The present invention relates to analysis of analytes,
such as metals, refractories, and slag, for the content of
oxygen or oxide. More particularly, the present invention
relates to a method and apparatus for analyzing an analyte
for the content of oxygen or oxide for each oxide, wherein
oxygen contained in an analyte is extracted as CO gas which
is then measured by inert gas carrying/Infrared absorption
analysis.
In recent years, an analytical technique for
accurately and rapidly analyzing an analyte for the content
of oxygen or oxide has been desired in the art.
For example, in the field of steelmaking, the
development of ultra low oxygen steel or high purity iron
with the form of oxides being controlled has been
progressed, and quantitatively determining the oxygen
concentration on a very low level of ppm (parts per
million) with high accuracy has been required. To this
end, at the time of analyzing an analyte for a very small
amount of oxygen, a contaminant, such as an oxide film,
formed on the surface of the analyte should be removed.
Electrolytic polishing or chemical polishing has been used
for pretreatment at the time of analysis for oxygen wherein
contaminants, such as an oxide film, are removed.
The electrolytic polishing is a method wherein
contaminants, such as an oxide film, formed on the surface
of an analyte is removed with a nonaqueous solvent
electrolyte, such as a 10% acetylsalicylic acid/1 %
tetramethylammonium chloride/methyl alcohol solution or a
4% sulfosalicylic acid/1% lithium chloride/methyl alcohol
solution. On the other hand, the chemical polishing is a
method wherein an iron and steel analyte is immersed in a
solution, such as hydrogen fluoride/hydrogen peroxide (HF-H2O2),
to remove a contaminant, such as an oxide film,
formed on the surface of the analyte (for example, Hisao
Yasuhara et al.: CAMP-ISIJ, 10(1997), p. 709).
However, the amount of oxygen present as an oxide on
the surface of the analyte is not constant. For example,
the amount of the surface oxide removed varies depending
upon e.g. polishing solution and a polishing time.
leading to a large variation in analytical value. Further,
electrolytic polishing or chemical polishing of the surface
of the analyte is disadvantageous in that the pretreatment
of the analyte is troublesome and requires a lot of time.
In order to solve the above problem, a method for
analyzing an iron and steel for a very small amount of
oxygen has been proposed (JP-A-148170/1994).
This method comprises the steps of: grinding
the surface of an iron and steel analyte by means of a
grinder, a file or the like; heat-extracting a very small
amount of oxygen contained in the analyte; and determining
the extracted oxygen, wherein the analyte after the
grinding is placed in a carbon crucible and preheated at
a temperature of 900 to 1400°C to separate and determine
oxygen derived from contaminants, such as deposited oxygen
and an oxide film, on the surface of the analyte and oxygen
in the iron and steel in the form of an oxide inclusion.
The analysis of an analyte for the content of oxygen
by the above proposed method, however, has a problem that
a point, where oxygen is evolved from an oxide inclusion
(point D shown in Fig. 1), overlaps with the first wave,
although the degree of overlapping varies depending upon
the type, amount, and particle diameter distribution of
oxide inclusions. This causes a part of the oxygen evolved
from the oxide inclusion to be embraced in the amount of
oxygen evolved from the surface deposited oxygen and iron
oxide, making it impossible to accurately determine only
the amount or oxygen evolved from the oxide inclusion.
On the other hand, in a bearing steel used under
severe conditions, particularly Al2O3, MgO • Al2O3, and (Ca,
Mg)O • Al2O3 inclusions, among inclusions present in a very
small amount, are likely to form large gains causative of
fatigue failure. For this reason, a reduction in amount
of inclusions in the product and the control of the form
of inclusions are important, and a technique, which can
accurately and rapidly analyze a low oxygen steel for each
inclusion, has been desired in the art.
Conventional methods for analyzing a steel for
inclusions include: a method which comprises extracting a
specimen from an analyte, observing a test surface under
a microscope, and classifying inclusions into A to C series
(JIS G 0555); and a method wherein the surface of an
analyte is subjected to mirror polishing and then
instrumentally analyzed by electron beam microanalysis or
the like.
In these methods, however, only a certain cross
section of the analyte is analyzed. This poses problems
including that true inclusions causative of material
failure cannot be detected the measuring time taken is
very long, and pretreatment of the analyte, such as
polishing, is troublesome.
An analytical method using an oxygen analyzer has
recently been proposed as means for solving these problems
(JP-A- 148167/1994). In this
method, an analyte is placed in a graphite crucible and
continuously heated at a constant temperature rise rate to
separate oxygen derived from easily reducible oxides (such
as FeO and MnO), which are decomposed on a relatively low
temperature side, and oxygen derived from sparingly
reducible oxides (such as CaO and Al2O3), which are
decomposed on a relatively high temperature side, from each
other utilizing a CO gas extraction curve at the time of
analysis.
The method described in JP-A-148167/1994
is intended for a high content of oxygen of not
less than 10% in steelmaking slag, and application of this
method to a metal analyte containing oxygen in a very small
amount on the order of several ppm has revealed that peaks
in CO gas extraction curves are small and waves in
respective CO gas extraction curves overlap with each other
or one another, making it difficult to separate waves from
each other or one another, that is, making it difficult to
apply the above method to a metal analyte containing oxygen
in a very small amount on the order of several ppm.
Further, the above method is intended for separation of
oxygen derived from easily reducible oxides and oxygen
derived from sparingly reducible oxides and cannot be
applied to analysis for oxygen in each oxide inclusion
present in a very small amount.
An object of the present invention is to provide a
method for analyzing an iron and steel for the content of
oxygen that, without pretreatment of the iron and steel to
remove an oxide film as a contaminant formed on the surface
of the iron and steel, can accurately separate and
determine oxygen derived from the oxide film as the
contaminant and oxygen contained in the iron and steel in
the form of oxide inclusions.
Another object of the present invention is to provide
a method and apparatus for analyzing an analyte for the
content of oxygen or oxide in each oxide, especially a
method and apparatus that can accurately and rapidly
analyze the analyte even when the oxygen content or oxide
content is very low.
Characteristic features of the present invention are
as follows.
Without pretreatment of an oxide film as a contaminant
formed on the surface of an iron and steel, the present
invention can accurately separate oxygen in the iron and
steel into surface contaminant oxygen and oxygen in the
form of oxide inclusions in the iron and steel. Further,
an iron and steel analyte can be analyzed for the oxygen
or oxide content for each of oxides, such as oxide
inclusions in the iron and steel analyte in a simple,
accurate, and rapid manner. Thus, the effect of the
present invention is significant. Therefore, the present
invention is a very useful invention that can meet the
needs of steelmaking and other industries where precise
control of the form and amount of oxides and the oxygen
content is required.
Contamination sources of contaminant oxygen on the
surface of metals are 1) adsorbed oxygen from air, and 2)
oxygen as iron oxides produced as a result of oxidation of
the surface of a metal due to an increase in temperature
of the surface of the metal in the case where the metal is
cut with a saw or ground with a grinder in order to adjust
the weight of the metal to a desired one. Investigations
using an X-ray electrophotometric analyzer have revealed
that the latter iron oxides include Fe2O3, Fe3O4, and FeO,
although the type and amount of the oxides vary depending
e.g. upon cutting or grinding temperature and time.
In the analysis of a metal for oxygen content by inert
gas carrying fusion/infrared absorption, it is considered
that the reaction
MO + C = M + CO
(wherein M represents a
metal, O represents oxygen, and C represents carbon) takes
place in a graphite crucible. The decomposition
temperature of iron oxides varies depending upon the type
of the oxide and the partial pressure of CO in the
crucible. According to the thermodynamic equilibrium
calculation and the results of measurement, the
decomposition temperature is approximately in the range of
from 400 to 1100°C. On the other hand, the
thermodynamically equilibrium temperature of oxide
inclusions is generally on higher temperature side as
compared with the decomposition temperature of iron oxides.
Under some metal heating conditions, however, reduction of
oxide inclusions with carbon takes places to evolve CO gas
even at such a low temperature that the reduction of iron
oxides occurs. An extraction curve for oxygen extracted
for each of oxides is shown in Fig. 1. The wave having a
first peak is an extraction curve corresponding to the
amount of oxygen derived from adsorbed oxygen from air and
oxygen evolved from iron oxides while the wave having a
second peak is an extraction curve corresponding to the
amount of oxygen evolved from oxide inclusions.
When these two oxygen extraction curves are more
clearly separated from each other without overlapping, the
amount or adsorbed oxygen from air and oxygen evolved from
iron oxides can be more accurately determined separately
from the amount of oxygen evolved from oxide inclusions.
The requirement for this is described in the above item
(1).
Regarding the temperature at which the first wave
begins to appear, when the temperature rise rate is
excessively high, the first wave is likely to overlap with
the second wave, rendering wave separation difficult. When
the temperature rise rate until the appearance of the first
wave is lower, conditions more close to thermodynamic
equilibrium are attained. This is considered to facilitate
the confirmation of the appearance temperature of the first
wave start point A. However, the temperature rise rate is
preferably not more than 20°C/sec from the viewpoint of the
efficiency of analysis and easiness of the confirmation of
rise time. Continuous heat melting at this temperature
rise rate soon permits the amount of CO evolved as a result
of reduction of iron oxides and the like with carbon to
reach the maximum value. When the amount of CO gas evolved
has reached the maximum value, the temperature is kept
constant and gas extraction is completed. The reason why
the temperature is kept constant in a period from the first
peak appearance point B to the first wave end point C is
that oxide inclusions are decomposed at a temperature or
in a time where the first wave still appears, although this
varies depending upon the amount, size, composition, and
position of oxide inclusions in the metal.
Subsequently, after the completion of the appearance
of the first wave, the analyte may be further heated to
rapidly decompose the oxide inclusions to obtain a second
wave as an oxygen extraction curve corresponding to the
amount of the oxide inclusions.
As described above, without pretreatment of a metal
to remove an oxide film as a contaminant formed on the
surface of a metal analyte, oxygen in the metal can be
separated into surface contaminant oxygen and oxygen
contained in the metal in the form of oxide inclusions and
hence can be accurately determined for each type of oxygen,
by a method for analyzing a metal for oxygen, using inert
gas carrying fusion/infrared absorption analysis,
comprising the steps of: placing a metal analyte in a
graphite crucible; heat-melting the metal analyte;
extracting a gas from the melt bath; and analyzing the gas
to determine the total oxygen content of the metal in the
form of a plurality of separated waves, wherein the metal
analyte is heated at a temperature rise rate of not more
than 20°C/sec in a period from a starting joint A of a
first wave to a peak appearance point B of the first wave,
held at a constant temperature in a period from the peak
appearance point B of the first wave to an end point C of
the first wave, and, after the completion of the appearance
of the first wave, is heated to melt the metal analyte for
further analysis. The temperature rise rate in a period
from the first wave start point A to the first wave peak
appearance point B is suitably not more than 20°C/sec,
particularly preferably not more than 5°C/sec. Further,
the temperature rise rate after the end of the first wave
is not particularly limited. The temperature rise rate is
preferably high from the viewpoint of the efficiency of the
analysis.
The temperature rise rate in a period from the metal
analyte heating start point to the first wave start point
A also is not particularly limited. However, if the
appearance tine or temperature of the first wave appearance
start point A, which in some cases varies depending upon
the type of the metal analyte, could be experimentally
grasped, a higher temperature rise rate is preferred from
the viewpoint of the efficiency of the analysis. In
general, the appearance temperature of the first wave start
point A is in many cases 400°C or above. Therefore, until
the temperature reaches about 400°C, the temperature rise
rate may be, for example, not less than 20°C/sec.
In Fig. 1 showing an extraction curve for oxygen, the
first wave is an extraction curve corresponding to the
amount of adsorbed oxygen from air and oxygen evolved from
iron oxides, while the second wave is an extraction curve
for oxygen corresponding to the amount of oxygen evolved
from oxide inclusions. For the first extraction curve
corresponding to the amount of adsorbed oxygen from air and
oxygen evolved from iron oxides, a plurality of waves in
some cases appears, as shown in Fig. 3, depending upon the
surface state of the analyte and conditions for the
analysis.
When these oxygen extraction curves are more clearly
separated from each other without overlapping, the amount
of adsorbed oxygen from air and oxygen evolved from iron
oxides can be more accurately determined separately from
the amount of oxygen evolved from oxide inclusions. The
requirement for this is described in the above item (2).
Fig 4 shows a diagram showing an oxygen extraction
curve for a first wave, wherein the temperature in the
first wave end point C is below 900°C, in comparison with
the form of a first wave, wherein the temperature in the
first wave end point C is 900°C or above,
When the temperature of the point C is below 900°C,
the amount of oxygen after the point C is on the same level
as the back ground before the point A and, thereafter, the
second wave appears. On the other hand, when the
temperature of the point C is 900°C or above, for the first
wave, the amount of oxygen at the maximum oxygen evolution
point, the point B and after the point C is larger than the
amount of oxygen evolved in the case where the temperature
of the point C is below 900°C, This tendency of an
increase in oxygen is more significant when the temperature
of the point C is higher. Specifically, when the
temperature of the point C is 900°C or above, a part of
oxide inclusions begins to be decomposed causing a part of
the amount of oxygen in the second wave to be embraced in
the first wave, although the degree of this unfavorable
phenomenon varies depending upon the amount, size,
composition, position and the like of oxide inclusions in
the iron and steel.
According to the present invention, without
pretreatment of a metal to remove an oxide film as a
contaminant formed on the surface of an iron and steel,
oxygen in the iron and steel can be separated into surface
contaminant oxygen and oxygen contained in the iron and
steel in the form of oxide inclusions and hence can be
accurately determined for each type of oxygen, by a method
for analyzing an iron and steel for oxygen present in a
very small amount, comprising the steps of: placing an iron
and steel analyte in a graphite crucible in an inert gas
atmosphere; heat-melting the analyte; extracting a CO gas
from the melt bath; and analyzing the gas to determine the
oxygen content of the iron and steel in the form of a
plurality of separated waves, wherein the analyte for an
iron and steel is heated so as not to exceed 900°C in a
period from the initiation of heating of the analyte for
an iron and steel to the end point of a wave, which has
appeared at a temperature below 900°C and closest to 900°C,
and subsequently further heated for analysis.
In the present invention, the method for analysis for
gas or oxygen is not particularly limited so far as the
method comprises placing a metal analyte in a graphite
crucible in an inert gas atmosphere, heat-melting the metal
analyte, and extracting CO gas from the melt bath. A
typical method is the so-called "inert gas carrying
fusion/infrared absorption method." Further, according
to studies conducted by the present inventor, oxygen
derived from oxide inclusions is extracted in a temperature
region of 900°C or above, and CO gas evolved in a
temperature region of below 900°C is regarded as one
derived from contaminant oxygen, such as adsorbed oxygen
on the surface of the metal analyte and iron oxide coating
on the surface of the metal analyte. Based on the above
finding, in the present invention, the wave of the
extraction curve for gas evolved at a temperature of below
900°C is not particularly taken into consideration, and
waves of gas extraction curves for CO gas evolved at a
temperature of 900°C or above are adopted for analysis for
each oxide inclusion.
For example, there are various oxide inclusions, such
as Al2O3, SiO2, CaO, MgO, and MnO, in iron and steel
materials. These oxide inclusions are present in various
forms, such as single forms and composite forms including
MgO • Al2O3.
The decomposition temperature of the oxide varies
depending upon the type of oxide and the partial pressure
of CO within the crucible. The reaction temperature may
be estimated or determined by thermodynamic equilibrium
calculation or based on the results of measurement. The
present inventor has found that, in analysis by the inert
gas carrying fusion/infrared absorption method or the like,
the decomposition temperature of the oxide is greatly
influenced by analyte heating conditions, independently of
the type of the oxide. Specifically, the reaction
temperature approaches the equilibrium calculation value
with reducing the temperature rise rate, leading to better
separability of gas extraction curves for respective
oxides. On the other hand, increasing the temperature rise
rate deteriorates the separability of gas extraction curves
for respective oxides.
In the present invention, this fending is applied to
gas analysis of a metal analyte for each oxide inclusion.
One example of a gas extraction curve obtained according
to the method of the present invention is shown in Fig. 5.
For example, when n types of oxide inclusions are contained
in the analyte, a first peak, a second peak, ....... an nth
peak are obtained in the order of reducibility of oxides.
When these oxygen extraction curves are more clearly
separated from each other without overlapping,
determination can be carried out more accurately for each
oxide. The requirement for this is described in the above
item (3).
When the metal analyte containing a very small amount
of oxygen is analyzed by e.g. the inert gas carrying
fusion/infrared absorption method, the
influence of the proportion of the amount of the surface
contaminant oxygen in the total amount of oxygen is not
negligible. Therefore, analysis is carried out after the
surface of the metal is polished by electrolytic polishing
or chemical polishing to remove surface contaminant oxygen.
In this method, the influence of surface contamination
cannot be completely eliminated. Iron oxides or hydroxides
constituting the surface contaminant layer, such as FeO,
Fe3O4, and FeOOH, can be decomposed at a relatively low
temperature at the temperature rise rate of the analyte at
the time of analysis for oxygen. This is the reason why
contaminant oxygen on the surface of the metal is separated
and removed at a temperature of below 900°C before the
analysis for the content of oxygen as oxide inclusions, and
oxygen attributable only to oxide inclusions is extracted
and determined at a temperature of 900°C or above.
Regarding the temperature at which each peak appears,
when the temperature rise rate is excessively high, the
reaction temperature range for the first oxide approaches
the reaction temperature range for the second oxide, making
it difficult to separate waves from each other. When the
temperature rise rate is lower, conditions more close to
thermodynamic equilibrium are attained. However, a
temperature rise rate of not more than 2°C/sec is necessary
for analysis for each oxide from the viewpoint of working
efficiency and easiness at the confirmation of the
appearance temperature of the wave start point. Continuous
heat melting at this temperature rise rate soon permits the
amount of CO gas evolved as a result of reduction at oxide
inclusions in the analyte with carbon to reach the maximum
value. When the amount at CO gas evolved has reached the
maximum value, the temperature is kept constant and gas
extraction is completed. The reason why the temperature
is kept constant in a period from each wave peak appearance
point Bn to each wave end point Cn is that continuous
heating during this period causes (n+1)th oxide inclusion
to be decomposed at a temperature or in a time where the
nth wave still appears, although this varies depending upon
the amount, size, composition, and position of other
inclusions in the analyte.
Subsequently, after the completion of the appearance
of the nth wave, the analyte is further heated to obtain
a second wave as a gas extraction curve corresponding to
the amount of the (n+1)th oxide inclusion.
This heating method is repeated, and, finally, at the
end of the analysis, n waves extracted from n oxide
inclusions present in the analyte are obtained. When the
position of the wave appearance for each of artificially
prepared oxides is previously confirmed, the oxide
inclusion in the analyte can be identified from the waves.
Further, the amount of oxygen for each oxide inclusion in
the analyte can be determined from the waves.
The method for heating to 900°C is not particularly
limited. Also for the heating to 900°C, however, the
temperature rise rate is preferably not more than 2°C/sec
from the viewpoint of avoiding the adverse effect on the
whole analysis.
Further, the present invention is based on a technique
wherein an analyte is heated in an inert atmosphere to
react the analyte with a carbon source, and CO gas evolved
as a result of the reaction of oxygen in the analyte with
the carbon source is extracted into an inert gas stream and
analyzed by the infrared absorption method to determine the
amount of reacted oxygen. Although the carbon source is
not particularly limited, graphite crucibles, graphite
powders, graphite capsules, carbon contained in the analyte
and the like may be used as the carbon source.
Among others, a practically useful method is such that
a graphite crucible is provided as the carbon source and
the analyte is placed in the graphite crucible and heat-melted
to evolve CO gas. It is also possible to use a
method wherein a graphite powder is provided as the carbon
source and is mixed with the analyte and the mixture is
then heated.
One of the characteristic features of the present
invention resides in that, based on the above technique,
the analyte is reacted with the carbon source while
regulating the temperature rise rate of the analyte,
successively evolved CO gas is extracted into an inert gas
stream, and the CO gas is successively analyzed to
determine the amount of reacted oxygen or the amount of
evolved CO to accumulate data on the amount of reacted
oxygen or data on the amount of evolved CO in time
sequence. The amount of oxygen or oxide for each of oxides
can be calculated from the successively obtained data on
the amount of reacted oxygen or data on the amount of
evolved CO.
Specifically, it is considered that the oxide in the
analyte is reacted with the carbon source as follows:
MO + C = M + CO
(wherein M represents a metal, O represents
oxygen, and C represents carbon). In this connection, the
present inventor has found that, since the reaction
temperature varies from oxide to oxide, reacting the oxide
with the carbon source by heating while closely controlling
the temperature rise rate of the analyte enables the
reaction to take place in a different time for each oxide
and, consequently, CO gas to be extracted in a different
time for each oxide. According to this method, CO gas
extracted in each time is carried by an inert gas stream
and successively analyzed and determined to calculate the
amount of oxygen derived from the oxide reacted in a
certain time or the amount of the oxide reacted in the
certain time.
Means for calculating or computing the amount of
oxygen or the amount of oxide for each of oxides can be
classified roughly into a method wherein data on the amount
of reacted oxygen are accumulated in time sequence and the
amount of oxygen or oxide is determined based on the data
accumulated in time sequence and a method wherein data on
evolved CO are accumulated in time sequence and the amount
of oxygen or oxide is determined based on the data
accumulated in time sequence.
In the method for determining the amount of oxygen or
oxide based on the data on the amount of reacted oxygen
accumulated in time sequence, data during the reaction time
corresponding to the reaction timing for each of oxides
(appearance time of each wave according to the following
method wherein the reaction timing is expressed in terms
of a wave) are integrated to determine the amount of oxygen
or the amount of oxide for each of oxides. Further, data
on reacted oxygen are successively accumulated, and the
total amount of oxygen or oxide is calculated.
In the method for determining the amount of oxygen or
oxide based on the data on the amount of evolved CO
accumulated in time sequence, data during the reaction time
corresponding to the reaction timing or each of oxides
(appearance time of each oxide according to the following
method wherein the reaction timing is expressed in terms
of a wave) are integrated, and the amount of oxygen or the
amount of oxide may be calculated from the obtained amount
of CO gas evolved by the reduction reaction for each oxide.
Further, data on reacted CO are successively accumulated,
and the total amount of oxide or the total amount of oxygen
is calculated.
One example of a graph showing the amount of extracted
oxygen (corresponding to the amount of extracted CO gas)
in time sequence obtained using the method and apparatus
according to a working example of the present invention is
shown in Fig. 11. For example, when n types of oxides are
contained in the analyte, waves having n peaks, that is,
a wave having a first peak, a wave having a second peak,
....... a wave having an nth peak, are obtained in the
order of reducibility of oxides.
The regulation of the temperature rise rate of the
analyte is specifically carried out as follows. The
analyte is gradually heated, held at a constant temperature
in a period from the appearance of a first peak for the
amount of extracted oxygen or extracted CO gas to the end
of the first wave, gradually heated in a period from the
end of the first wave to the appearance of a second peak,
held at a constant temperature from the appearance of the
second peak to the end of the second wave, gradually heated
in a period from the end of the second wave to the
appearance of a third peak, held at a constant temperature
in a period from the appearance of the third peak to the
end of the third wave, and gradually heated in a period
from the and of the third wave to the appearance of a
fourth peak. Thus, a repetitive pattern of rising of
temperature and folding at a constant temperature is
preferred.
More specifically, for example, in the case of the
analysis of a bearing steel containing four oxide
inclusions, the analyte is heated at a temperature rise
rate of 1°C/sec in a period from the analyte heating start
point to the first wave peak appearance point, at a
temperature rise rate of 0°C/sec in a period from the first
wave peak appearance point to the end point of the first
wave, again at a temperature rise rate of 1°C/sec in a
period from the end point of the first wave to a second
peak appearance point, at a temperature rise rate of 0°C/sec
in a period form the second peak appearance point to
the end point of the second wave, at a temperature rise
rate of 1°C/sec in a period from the end point of the
second wave to a third peak appearance point, at a
temperature rise rate of 0°C/sec in a period from the third
peak appearance point to the end point of the third wave,
again at a temperature rise rate of 1°C/sec in a period
from the end point of the third wave to a fourth peak
appearance point, at a temperature rise rate of 0°C/sec in
a period from the fourth peak appearance point to the end
point of the fourth wave, and again at temperature rise
rate of 1°C/sec in a period from the end point of the
fourth wave to the completion of the analysis. The above
control operation provides four peaks corresponding
respectively to the four inclusions.
Regarding the temperature at which each peak appears,
when the temperature rise rate is excessively high, the
reaction temperature range for the first oxide approaches
the reaction temperature range for the second oxide, making
it difficult to separate waves from each other. A lower
temperature rise rate is considered to permit conditions
more close to thermodynamic equilibrium to be attained.
An excessively low temperature rise rate results in
deteriorated efficiency of the analysis and hence is
unsuitable for the analysis of practically used steels.
For this reason, it is recommended that the temperature
rise rate of the analyte is not more than 0.01 to 20°C/sec.
The type of the oxide contemplated in the present
invention is not limited, and examples thereof include
Al2O3, SiO2, CaO, MgO, MnO, Cr2O3 and TiO2 and inclusions of
composite oxides of these oxides. In the case of iron and
steel materials as representative analytes contemplated in
the present invention, oxides inclusions in the iron and
steel materials include various oxides, such as Al2O3, SiO2,
CaO, MgO, and MnO. These oxide inclusions are present in
various forms, such as single forms and composite forms
including MgO • Al2O3.
Another characteristic feature of the present
invention resides in that, while controlling the
temperature rise rate of the analyte as described above,
successively extracted CO gas is successively analyzed to
determine the amount of reacted oxygen or the amount of
evolved CO, a peak of the amount of reacted oxygen or the
amount of evolved CO is detected from successively obtained
data on the amount of reacted oxygen or data on the amount
of evolved CO, and the analysis is carried out while
reducing the flow rate of an inert gas stream, which
extracts CO gas, for each appearance of the detected peak
corresponding to the amount of reacted oxygen or the amount
of evolved CO.
As described above, the decomposition temperature of
the oxide varies depending upon the type of oxide. The
present inventor has further found that the decomposition
temperature of each oxide is influenced by the partial
pressure of the atmosphere in the reaction of each oxide
with the carbon source. Further, as a result of studies,
as shown in Fig. 12, the relationship between the reaction
temperature of each oxide and the partial pressure of CO
could be estimated or determined by thermodynamic
equilibrium calculation or based on the results of
measurements.
As can be seen from an explanatory view, in Fig. 12,
showing the relationship between the decomposition
temperature for each of oxides and the partial pressure of
CO (corresponding to amount of oxygen constituting oxide),
the decomposition temperature of the oxide is considered
to change according to the partial pressure of CO.
Therefore, at some partial pressure of CO under which the
oxide is decomposed, different oxides often exhibit the
same decomposition temperature. In this case, the waves
shown in Fig. 11 is considered to overlap with each other,
making it impossible to identify the type of oxide. This
may be expressed by the following formula:
ΔG = -RT1nPCO
wherein ΔG represents formation free energy of oxide, R
represents gas constant, T represents temperature, and PCO
represents the partial pressure of CO gas at the time of
reduction of oxide with carbon and corresponds to the
amount of oxygen for each oxide. When waves of the curve
for the amount of extracted oxygen (amount of extracted CO
gas) are more clearly separated from each other without
overlapping, determination can be carried out more
accurately for each oxide.
Based on such finding, the present inventors have
thought that means for controlling the partial pressure of
CO in the atmosphere at the time of CO gas extraction is
necessary for attaining the objects of the present
invention. The partial pressure of CO can be expressed by
the following formula 2.
((amount of CO gas)/(amount of inert gas + amount of
CO gas)) = partial pressure of CO
In this case, the value of the numerator in the
formula 2 is a value that is necessarily determined by the
content of oxygen in the analyte. The partial pressure of
CO at the time of the analysis can be controlled as desired
by varying the amount of the inert gas in the denominator.
Specifically, varying the amount of the inert gas
enables the decomposition temperature of each oxide at the
time of analysis to be controlled as desired and can
significantly improve the separability of waves of CO gas
extraction curve for respective oxides from each other or
one another.
Thus, the analytical method of the present invention
has been developed wherein a peak of the amount of reacted
oxygen or the amount of evolved CO is detected from
successively obtained data on the amount of reacted oxygen
or data on the amount of evolved CO, and the analysis is
carried out while reducing the flow rate of an inert gas
stream, which extracts CO gas, for each appearance of the
detected peak corresponding to the amount of reacted oxygen
or the amount of evolved CO.
Coulometry, conductometry, gas chromatography, an
infrared absorption method, and a nonaqueous solvent method
may be used as means for detecting a peak of the amount of
reacted oxygen or the amount of evolved CO from data on the
amount of reacted oxygen or data on the amount of evolved
CO.
The inert gas flow rate control means for reducing the
flow rate of the inert gas stream for extracting CO gas for
each appearance of a peak on the detected amount of reacted
oxygen or the detected amount of evolved CO may be
constructed, for example, so that a flowmeter and an inert
gas flow rate control valve are used to permit the flow
rate to be controlled as desired.
Further, the flow rate of the inert gas for extracting
CO gas is preferably not more than 2000 cc/min. When the
flow rate of the inert gas for extracting CO gas exceeds
2000 cc/min, a variation in amount of detected gas is
likely to become significant, although this varies
depending upon peak detection time. The flow rate of the
inert gas for example, in the case of the apparatus
according to an embodiment of the present invention, shown
in Fig. 13, may be regulated by gas flow rate controllers
8, 9.
Further, the present inventors have found that the
amount of the analyte melted is also important for analysis
by the inert gas carrying/infrared absorption method.
Specifically, for example, in the case of a metal analyte
having a very low oxygen content or an analyte having a low
oxygen content and containing many types of oxides, the
amount of oxygen evolved from the oxide is very small.
This is likely to cause the wave for extracted oxygen to
overlap with a noise, inherent in the apparatus, unrelated
to the amount of oxygen, making it difficult to determine
only the amount of oxygen evolved from oxides in the
analyte. In order to prevent this unfavorable phenomenon,
the amount of the analyte melted may be increased.
However, the amount of the analyte melted is preferably not
more than about 5 g from the viewpoint or the efficiency
of the analysis and homogeneous melting.
As shown in Fig. 14 a reference cell 21 in an
infrared CO absorption detecting apparatus 10 is filled
with nitrogen or the like not having an infrared absorption
capability, and a detector 22 is filled with a high-concentration
gas to be determined. The detector 22 is
partitioned with a thin partition 23 into two compartments.
A metal sheet provided on the partition 23 serves as one
pole of a capacitor 24. When the analyte contains a
component to be determined, the quantity of light, which
enters the detector 22, is decreased by the quantity
absorbed by the component. This creates a difference in
pressure between both the compartments of the detector 22
to cause displacement of the partition 23, resulting in a
change in capacitance of the capacitor 24. The capacitance
change may be measured to learn the concentration of the
component to be determined.
The sensitivity of the infrared CO absorption
detecting apparatus 10 depends upon the difference in
quantity of light between the reference cell 21 and the
measuring cell 25. The optical path length L of the
infrared CO absorption detecting apparatus is important for
increasing the difference in quantity of light. When the
optical path length L exceeds 50 mm, distinguishment of the
extracted wave signal from the noise is difficult, or
otherwise normal waves cannot be obtained, although this
depends also upon the combination with the intensity of an
infrared light source 26. When the optical path length L
is excessively short, the difference in quantity of light
between the reference cell 21 and the measuring cell 25 is
less likely to develop. For this reason, the optical path
length L of the infrared CO absorption detecting apparatus
according to the present invention is preferably not more
than 50 mm.
Infrared CO absorption detecting apparatuses usable
in the present invention include those of cross flow type
or other various forms or having various structures. The
form, structure, type and the like are not particularly
limited so far as the above measurement principle is met.
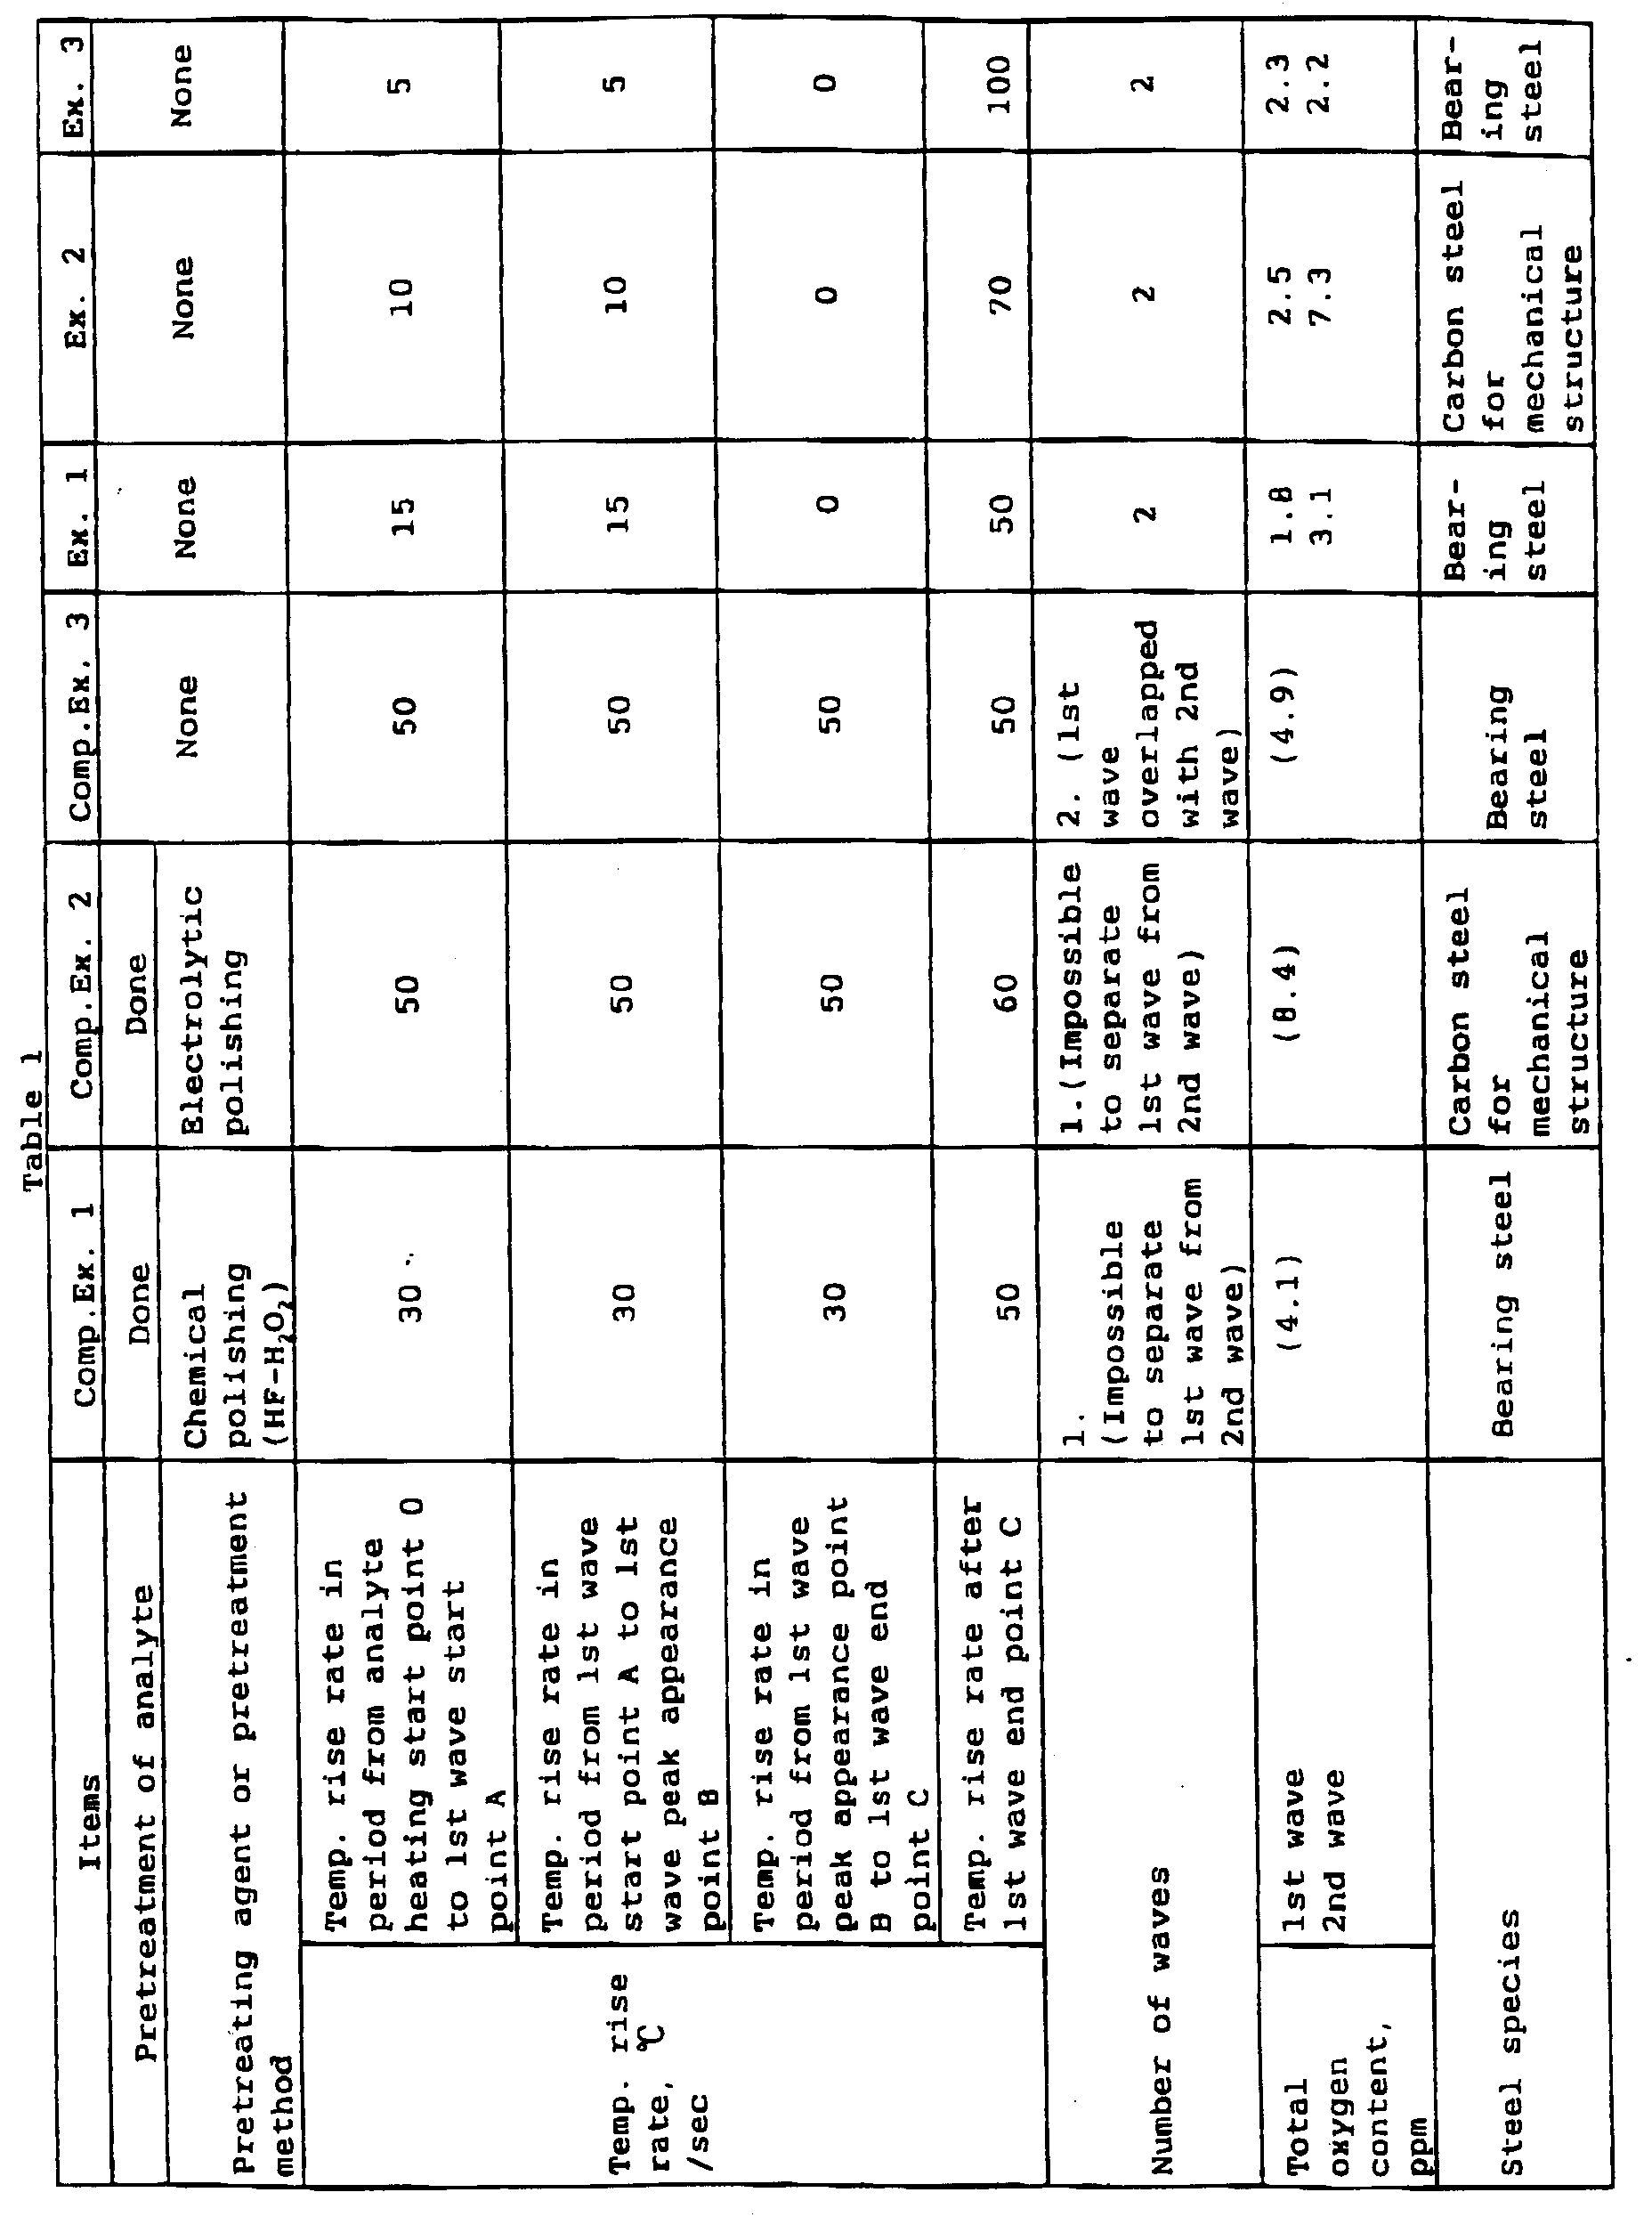
Examples 1 to 3
Examples 1 to 3 of the present invention, together
with Comparative Examples 1 to 3, shown in Table 1 will be
described. In each example, the content of oxygen in a
metal gas determined by an inert gas carrying
fusion/infrared absorption method therein a metal analyte
is placed in a graphite crucible, the analyte is heat-melted,
and a gas is extracted from the melt bath and
analyzed.
For Comparative Example 1, 1 g of a bearing steel
analyte was immersed in an HF-H2O2 solution, and analysis
was then carried out in such a manner that, in Fig. 7, the
analyte was heated at a temperature rise rate of 30°C/sec
in a period from a heating start point 0 to a peak
appearance point B of the first wave, at a temperature rise
race of 30°C/sec also in a period from the peak appearance
point B of the first wave to an end point C of the first
wave, and at a temperature rise rate of 50°C/sec after the
end point C of the first wave. It was difficult to
separate the first wave corresponding to the amount of
oxygen evolved from surface deposited oxygen and iron oxide
from the second wave corresponding to the amount of oxygen
evolved from oxide inclusions, and the total oxygen content
was 4.1 ppm. In Example 1 of the present invention, the
same bearing steel as used in Comparative Example 1 was
used. In Example 1, 1 g of the bearing steel was analyzed,
without the pretreatment, in such a manner that, in Fig.
1, the analyte was heated at a temperature rise rate of
15°C/sec in a period from a heating start point 0 to a peak
appearance point B of the first wave, at a temperature rise
rate of 0°C/sec in a period from the peak appearance point
B of the first wave to an end point C of the first wave,
and at a temperature rise rate or 50°C/sec after the end
point C of the first wave. The oxygen content
corresponding to the first wave was 1.8 ppm, the oxygen
content corresponding to the second wave was 3.1 ppm, and
the total oxygen content was 4.9 ppm. From the above
results, when the content of oxygen in the form of oxide
inclusions in the bearing steel in Comparative Example 1
is presumed to be 3.1 ppm, (total oxygen content in
Comparative Example 1) - (oxygen content corresponding to
the second wave in Example 1) = 4.1 - 3.1 = 1.0 ppm.
Therefore, the oxygen content 1.0 ppm is estimated to be
oxygen that has been left without being fully removed by
chemical polishing with the HF-H2O2 solution.
In Comparative Example 2, 1 g of a carbon steel for
mechanical structures was electrically polished with a
nonaqueous solvent electrolyte of a 4% sulfosalicylic
acid/1% lithium chloride/methyl alcohol solution under
conditions of an electrolysis potential of 1 V, a current
of 500 mA, and an electrolysis time of 4 min, and
ultrasonically cleaned in a methanol solution for 8 min,
followed by analysis for oxygen. The analysis was carried
out in such a manner that, in Fig. 7, the analyte was
heated at a temperature rise rate of 50°C/sec in a period
from a heating start point 0 to a peak appearance point B
of the first wave, at a temperature rise rate of 50°C/sec
also in a period from the peak appearance point B of the
first wave to an end point C of the first wave, and at a
temperature rise rate of 60°C/sec after the end point C of
the first wave. As with Comparative Example 1, it was
difficult to separate the first wave corresponding to the
amount of oxygen evolved from surface deposited oxygen and
iron oxide from the second wave corresponding to the amount
of oxygen evolved from oxide inclusions, and the total
oxygen content was 8.4 ppm.
In Example 2 of the present invention, the same carbon
steel for mechanical structures as used in Comparative
Example 2 was analyzed. In Example 2, the analyte was not
pretreated. The analysis was carried out in such a manner
that, in Fig. 1, the metal analyte was heated at a
temperature rise rate of 10°C/sec in a period from a
heating start point 0 to a peak appearance point B of the
first wave, at a temperature rise rate of 0°C/sec in a
period from the peak appearance point B of the first wave
to an end point C of the first wave, and at a temperature
rise rate of 70°C/sec after the end point C of the first
wave. The oxygen content corresponding to the first wave
was 2.5 ppm, the oxygen content corresponding to the second
wave was 7.3 ppm, and the total oxygen content was 9.8 ppm.
Therefore, as with Comparative Example 1, in Comparative
Example 2, the oxygen content 1.1 ppm (8.4 - 7.3 = 1.1 ppm)
is estimated to be oxygen that has been left without being
removed by the electrolytic polishing. Thus, it was
difficult to completely remove contaminants, such as an
oxide film, formed on the surface of the analyte, by
various pretreatments before the analysis. Even when
identical treatment was used, the total oxygen content was
not identical and a variation in found values occurred.
In Comparative Example 3, the bearing steel was
analyzed, without pretreatment, that is, chemical polishing
in Comparative Example 1 and electrolytic polishing in
Comparative Example 2, in such a manner that, in Fig. 1,
the analyte was heated at a temperature rise rate of
50°C/sec in a period from a heating start point 0 to a peak
appearance point B of the first wave, at a temperature rise
rate of 50°C/sec in a period from the peak appearance point
B of the first wave to an end point C of the first wave,
and at a temperature rise rate of 50°C/sec after the end
point C of the first wave. As shown in Fig. 2, the first
wave corresponding to the amount of oxygen evolved from
surface deposited oxygen and iron oxide and the second wave
corresponding to the amount of oxygen evolved from oxide
inclusions could not be separated from each other and
completely mutually overlapped. In Example 3, the same
bearing steel as used in Comparative Example 3 was used.
In Example 3, 1 g of the bearing steel analyte was
analyzed, without the pretreatment, in such a manner that,
in Fig. 1, the analyte was heated at a temperature rise
rate of 5°C/sec in a period from a heating start point 0 to
a peak appearance point B of the first wave, at a
temperature rise rate of 0°C/sec in a period from the peak
appearance point B of the first wave to an end point C of
the first wave, and at a temperature rise rate of 100°C/sec
after the and point C of the first wave. The oxygen
content corresponding to the first wave was 2.3 ppm, the
oxygen content corresponding to the second wave was 2.2
ppm, and the total oxygen content was 4.5 ppm. From the
above results, when the content of oxygen in the form of
oxide inclusions in the bearing steel in Comparative
Example 3 is presumed to be 2.2 ppm, (total oxygen content
in Comparative Example 3) - (oxygen content corresponding
to the second wave in Example 3) = 4.9 - 2.2 = 2.7 ppm.
Therefore, the oxygen content 2.7 ppm is considered to
correspond to the content of oxygen evolved from surface
deposited oxygen or iron oxide.
Examples 1 to 3 are examples of the present invention.
In Examples 1 to 3, the first wave corresponding to the
amount of oxygen evolved from surface deposited oxygen and
iron oxide could be clearly separated from the second wave
corresponding to the amount of oxygen evolved from oxide
inclusions. The experiment was repeated for several steels
of the same type. As a result, a variation in found values
hardly occurred.
As described above, according to the analytical method
of the present invention, without pretreatment of the
analyte, such as chemical polishing or electrolytic
polishing, contaminant oxygen derived from surface
deposited oxygen of the metal and oxygen evolved from iron
oxide and oxygen evolved from oxide inclusions could be
clearly separated from each other and quantitatively
accurately determined.
Examples 4 to 7 of the present invention, together
with Comparative Examples 4 to 9, shown in Tables 2 and 3
will be described. In all the examples and comparative
examples, the content of oxygen in an iron and steel was
determined by an inert gas carrying fusion/infrared
absorption method wherein an iron and steel analyte is
placed in a graphite crucible, the analyte is heat-melted,
and a CO gas is extracted from the melt bath and analyzed.
At the outset, Comparative Examples 4 to 6 and Examples 4
and 5 shown in Table 2 will be described.
Comparative Example 4 shows the results of the
analysis of 1 g of a bearing steel analyte for oxygen
wherein the temperature of the point C shown in Fig. 1 was
950°C. The oxygen content corresponding to the first wave
was 2.0 ppm, and the oxygen content corresponding to the
second wave was 2.9 ppm. Comparative Example 5 shows the
results of the analysis of 1 g of a bearing steel analyte
for oxygen wherein the temperature of the point C shown in
Fig. 1 was 1000°C. The oxygen content corresponding to the
first wave was 2.2 ppm, and the oxygen content
corresponding to the second wave was 2.7 ppm. Comparative
Example 6 shows the results of the analysis of 1 g of a
bearing steel analyte for oxygen wherein the temperature
of the point C show in Fig. 1 was 1100°C. The oxygen
content corresponding to the first wave was 2.4 ppm, and
the oxygen content corresponding to the second wave was 2.5
ppm. Example 4 shows the results of the analysis of 1 g
of a bearing steel analyte for oxygen wherein the
temperature of the point C shown in Fig. 1 was 890°C. The
oxygen content corresponding to the first wave was 1.8 ppm,
and the oxygen content corresponding to the second wave was
3.1 ppm. Example 5 shows the results of the analysis of
1 g of a bearing steel analyte for oxygen wherein the
temperature of the point C shown in Fig. 1 was 750°C. The
oxygen content corresponding to the first wave was 1.8 ppm,
and the oxygen content corresponding to the second wave was
3.1 ppm. That is, these values were the same as the values
obtained in Example 4. As is apparent from the above
results, for Comparative Examples 4, 5 and 6 and Examples
4 and 5, the total oxygen content obtained by adding the
oxygen content corresponding to the first wave to the
oxygen content corresponding to the second wave was
identical. However, the oxygen content corresponding to
the first wave increased with increasing the temperature
of the point C. From this, it is considered that a part
of oxygen evolved by decomposition of oxide inclusions,
which should appear in the second wave, has been included
in the first wave.
Next, Comparative Examples 7 to 9 and Examples 6 and
7 shown in Table 3 will be described. Comparative Example
7 shows the results of the oxygen analysis of 1 g of a
carbon steel analyte for a mechanical structure wherein the
temperature of the point C shown in Fig. 1 was 950°C. The
oxygen content corresponding to the first wave was 2.7 ppm,
and the oxygen content corresponding to the second wave was
7.1 ppm. Comparative Example 8 shows the results of the
oxygen analysis of 1 g of a carbon steel analyte for a
mechanical structure wherein the temperature of the point
C shown in Fig. 1 was 1000°C. The oxygen content
corresponding to the first wave was 2.9 ppm, and the oxygen
content corresponding to the second wave was 6.9 ppm.
Comparative Example 9 shows the results of the oxygen
analysis of 1 g of a carbon steel analyte for a mechanical
structure wherein the temperature of the point C shown in
Fig. 1 was 1100°. The oxygen content corresponding to the
first wave was 3.3 ppm, and the oxygen content
corresponding to the second wave was 6.5 ppm. Example 6
shows the results of the oxygen analysis of 1 g of a carbon
steel analyte for a mechanical structure wherein the
temperature of the point C shown in Fig. 1 was 890°C. The
oxygen content corresponding to the first wave was 2.5 ppm,
and the oxygen content corresponding to the second wave was
7.3 ppm. Example 7 shows the results of the oxygen
analysis of 1 g of a carbon steel analyte for a mechanical
structure wherein the temperature of the point C shown in
Fig. 1 was 750°C. The oxygen content corresponding to the
first wave was 2.5 ppm, and the oxygen content
corresponding to the second wave was 7.3 ppm. That is,
these values were the same as the values obtained in
Example 6. As is apparent from the above results, for
Comparative Examples 7, 8 and 9 and Examples 6 and 7, the
total oxygen content obtained by adding the oxygen content
corresponding to the first wave to the oxygen content
corresponding to the second wave was identical. However,
the oxygen content corresponding to the first wave
increased with increasing the temperature of the point C
of the comparative example. From this, it is considered
that a part of oxygen evolved by decomposition of oxide
inclusions, which should appear in the second wave, has
been included in the first wave.
For both the bearing steel and the carbon steel for
a mechanical structure, even when the temperature of the
point C was 750°C or below, the results were substantially
the same as those in Examples 4 to 7. The temperature of
the point C is preferably 800 to less than 900°C from the
viewpoint of the efficiency of analysis.
As described above, according to the analytical method
according to the examples of the present invention, without
pretreatment of the analyte, such as chemical polishing or
electrolytic polishing, contaminant oxygen derived from
surface deposited oxygen of the iron and steel and oxygen
evolved from iron oxide and oxygen evolved from oxide
inclusions could be clearly separated from each other and
quantitatively accurately determined.
| Steel species: bearing steel |
| Items | Comp. Ex. 4 | Comp. Ex. 5 | Comp. Ex. 6 | Ex. 4 | Ex. 5 |
| Point C termination temp., °C | 950 | 1000 | 1100 | 890 | 750 |
| Total oxygen content (ppm) | 1st wave | 2.0 | 2.2 | 2.4 | 1.8 | 1.8 |
| 2nd wave | 2.9 | 2.7 | 2.5 | 3.1 | 3.1 |
| Steel species: carbon steel for mechanical structure |
| Items | Comp. Ex. 7 | Comp. Ex. 8 | Comp. Ex. 9 | Ex. 6 | Ex. 7 |
| Point C termination temp., °C | 950 | 1000 | 1100 | 890 | 750 |
| Total oxygen content (ppm) | 1st wave | 2.7 | 2.9 | 3.3 | 2.5 | 2.5 |
| 2nd wave | 7.1 | 6.9 | 6.5 | 7.3 | 7.3 |
Examples 8 to 10 of the present invention, together
with Comparative Examples 10 to 13, shown in Table 4 will
be described. In each example, the content of oxygen in
a metal was determined by an inert gas carrying
fusion/infrared absorption method wherein a metal analyte
is placed in a graphite crucible in an inert gas
atmosphere, the analyte is heat-melted, and a CO gas is
extracted from the melt bath and analyzed.
In Comparative Example 10, a carbon steel for a
mechanical structure was analyzed. As shown in Fig. 7, the
analysis was carried out in such a manner that the
temperature rise rate of the metal analyte from the
initiation of heating to the completion of the analysis was
1°C/sec. It was difficult to separate peaks for respective
oxides, and the total oxygen content was 12.1 ppm. In
Example 8 of the present invention, the same carbon steel
for a mechanical structure as used in Comparative Example
10 was analyzed. As shown in Fig. 6, the analysis was
carried out in such a manner that the metal analyte was
heated at a temperature rise rate of 1°C/sec in a period
from a heating start point 0 to a first wave peak
appearance point B and at a temperature rise rate of 0°C/sec
in a period from the first wave appearance point B to
a first wave end point C. Subsequently, the analyte was
heated again at a temperature rise rate of 1°C/sec in a
period from the first wave end point C to a second peak
appearance point E and at a temperature rise rate of 0°C/sec
in a period from the second wave peak appearance point
E to the second wave end point F.
Further, the analyte was heated again at a temperature
rise rate of 1°C/sec after the second wave end point. In
this case, no gas extraction was observed until the
analysis was completed. The oxygen content corresponding
to the first wave was 1.8 ppm, the oxygen content
corresponding to the second wave was 10.3 ppm, and the
total oxygen content was 12.1 ppm. Oxides reacted at these
respective temperatures were determined by equilibrium
calculation. As a result, it was found that the first wave
represents SiO2 and the second wave represents Al2O3. This
was in agreement with the results obtained from
investigation of the proportions of ingredients
constituting the oxides by means of X-ray microanalyzer.
In Comparative Example 11, a bearing steel was
analyzed. As shown in Fig. 7, the analysis was carried out
in such a manner that the analyte was heated at a rate of
1°C/sec in a period from the initiation of heating of the
analyte to the completion of the analysis. It was
difficult to separate peaks for respective oxides from each
other, and the total oxygen content was 3.8 ppm. In
Example 9, the same bearing steel as used in Comparative
Example 11 was analyzed. As shown in Fig. 8, the analysis
was carried out in such a manner that the analyte was
heated at a temperature rise rate of 1°C/sec in a period
from a heating start point 0 to a first wave peak
appearance point B and at a temperature rise rate of 0°C/sec
in a period from the first wave appearance point B to
a first wave end point C. Subsequently, the analyte was
heated again at a temperature rise rate of 1°C/sec in a
period from the first wave end point C to a second peak
appearance point E and at a temperature rise rate of 0°C/sec
in a period from the second wave peak appearance point
E to the second wave end point F.
Further, the analyte was heated again at a temperature
rise race of 1°C/sec from the second wave end point F, at
a temperature rise rate of 0°C/sec from a third peak
appearance point H, and again at a temperature rise rate
of 1°C/sec from the third wave end point I. After that, no
gas extraction was observed until the analysis was
completed. The oxygen content corresponding to the first
wave was 1.1 ppm, the oxygen content corresponding to the
second wave was 1.4 ppm, the oxygen content corresponding
to the third wave was 1.3 ppm, and the total oxygen content
was 3.8 ppm. Oxides reacted at these respective
temperatures were determined by equilibrium calculation.
As a result, it was found that the first wave represents
SiO2, the second wave represents Al2O3, and the third wave
represents CaO. This was in agreement with the results
obtained from investigation of the proportions of
ingredients constituting the oxides by means of X-ray
microanalyzer.
In Comparative Example 12, a bearing steel, which is
different in steel species from the bearing steel used in
Comparative Example 11, was analyzed. The analysis was
carried out in such a manner that the analyte was heated
at a temperature rise rate of 1°C/sec in a period from the
initiation of the analysis to the completion of the
analysis. As a result as shown in Fig. 7, it was
difficult to separate wave from each other, and the total
oxygen content was 3.9 ppm. In Example 10, the same
bearing steel as used in Comparative Example 12 was
analyzed. As shown in Fig. 9, the analysis was carried out
in such a manner that the analysis was carried out in such
a manner that the analyte was heated at a temperature rise
rate of 1°C/sec in a period from a heating start point 0 to
a first wave peak appearance point B and at a temperature
rise rate of 0°C/sec in a period from the first wave
appearance point B to a first wave end point C.
Subsequently, the analyte was heated again at a temperature
rise rate of 1°C/sec in a period from the first wave end
point C to a second peak appearance point E and at a
temperature rise rate of 0°C/sec in a period from the
second wave peak appearance point E to the second wave end
point F. Next, the analyte was heated again at a
temperature rise rate of 1°C/sec in a period from the
second wave end point F to a third wave peak appearance
point H, at a temperature rise rate of 0°C/sec in a period
from the third wave appearance point H to a third wave end
point I, again at a temperature rise rate of 1°C/sec from
the third wave end pint I, at a temperature rise rate of
0°C/sec from a fourth wave peak appearance point K, and
again at a temperature rise rare of 1°C/sec from the fourth
wave end point L. After that, no gas extraction was
observed until the analysis was completed. The oxygen
content corresponding to the first wave was 0.9 ppm, the
oxygen content corresponding to the second wave was 1.1
ppm, the oxygen content corresponding to the third wave was
0.7 ppm, the oxygen content corresponding to the fourth
wave was 1.2 ppm, and the total oxygen content was 3.9 ppm.
Oxides reacted at these respective temperatures were
determined by equilibrium calculation. As a result it was
found that the first cave represents SiO2, the second wave
represents Al2O3, the third wave represents MgO, and the
fourth wave represents CaO. This was in agreement with the
results obtained from investigation of the proportions of
ingredients constituting the oxides by means of X-ray
microanalyzer.
In Comparative Example 13, analysis was carried out
in the same manner as described above in connection with
the method according to the present invention, except that
the temperature rise rate was 3°C/sec, that is, was higher
than that in the method according to the present invention.
Despite the use of the same bearing steel as used in
Example 10, as shown in Fig. 10, the wave separability was
poor, and two waves could not be separated from each other.
As a result, oxygen contents for respective oxide
inclusions could not be determined.
In Examples 8 to 10, waves for respective CO gases
derived from oxide inclusions could be clearly separated
from each other or one another, and the analyte could be
analyzed for oxygen in each oxide inclusion.
In all the above examples, the evolved oxygen is one
from oxide inclusions extracted from a temperature of 900°C
or above, and the true oxygen content of the metal analyte
could be determined for each oxide inclusion.
As described above, application of the analytical
method according to the method of the present invention to
the analysis for oxygen by the inert gas fusion
carrying/infrared absorption method realized separation and
determination of oxygen for each oxide inclusion in the
metal analyte with good accuracy.
Examples 11 to 14 or the present invention, together
with Comparative Examples 14 and 15, viii be described with
reference to Fig. 13 and Table 5.
Fig. 13 is a schematic diagram showing the
construction of a principal part of a sample analyzer
applied to the method according tot he present invention.
In Fig. 13, numeral 1 designates an extractor of direct
energization system. In the interior of the extractor, a
crucible 2, in which an analyte is to be placed, is
sandwiched between an upper electrode 3 and a lower
electrode 34 for energization heating of the crucible.
Numeral 5 designates an alternating current source, and one
end thereof is connected to the upper electrode 3 through
an ammeter 6, and the other end is connected to the lower
electrode 4. Numeral 7 designates a voltmeter for
measuring the voltage across both the electrodes 3, 4.
Numeral 16 designates a gas passage for the sample
analyser. A flow rate controller 8 for regulating the flow
rate of a gas introduced into the extractor 1 and a flow
rate controller 9 for regulating the flow rate of a gas
introduced into an infrared CO absorption detector 10 are
connected to the gas passage 16, and the analyte is
analyzed in the infrared CO absorption detector 10 to
determine the oxygen content. After the infrared CO
absorption detector 10, in order to analyze the analyte for
nitrogen, a thermal conductive analyser 14 is connected to
a room temperature oxidizer 11 for selectively oxidizing
CO contained in the gas to convert CO to CO2, a CO2 remover
12 for selectively removing CO2 alone produced in the room
temperature oxidizer, and an H2O remover 13.
Numeral 17 designates an electric signal control
circuit that sends an extracted gas signal to a
microcomputer 15 and, at the same time, send a signal, for
regulating the amount of helium in the atmosphere gas, to
the gas flow rate control valves 8, 9.
Numeral 15 designates a computation control section,
such as a microcomputer, which computes the extracted gas
signal from the sample to quantitatively determine the
oxygen content and the nitrogen content for each oxide
inclusion.
For the following examples and comparative examples,
the analysis was carried out using the analyzer shown in
Fig. 13. Conditions and results for each example are
summarized in Table 5.
In Comparative Example 14, an artificially prepared
oxide powder was analyzed. The amount of the powder melted
was 0.5 g. An Al2O3 powder, an MgO powder, and a CaO
powder were accurately weighed with a balance so that, in
the powder, the amount of oxygen as Al2O3 is 0.141 mg, the
amount of oxygen as MgO is 0.040 mg, and the amount of
oxygen as CaO is 0.028 mg. These three powders were mixed
together, and the mixture was placed in a graphite crucible
2 which has been previously deaerated under conditions of
2773 K and atmosphere gas helium flow rate 2000 ml/min.
At the time of gas extraction, the flow rate of atmosphere
gas helium, which flows through the gas flow rate
controllers 8, 9, was brought to 400 ml/min. The extracted
gas was introduced into the infrared CO absorption detector
(optical path length 50 mm) through the gas passage 16 and
analyzed by the infrared CO absorption mechanism, and the
amount of the oxygen gas was computed by the microcomputer
15. The temperature rise rate of the analyte was 10°C/sec.
As a result, a first wave only appeared without separation
into a plurality of waves, that is, three waves as shown
in Fig. 11. The total amount of oxygen was 0.201 mg,
indicating that the introduced oxygen could be
substantially recovered.
In Example 11, regarding the analyte, the powders and
the mixing ratio of these powders were the same as in
Comparative Example 14. Further, the analytical conditions
except for the inert gas flow rate were also the same as
those in Comparative Example 14. The inert gas flow rate
was regulated as follows. Until the appearance of a peak
of the first wave, the flow rate of the atmosphere gas,
which flows through the gas flow rate controllers 8, 9, was
brought to 600 ml/min. Thereafter, after the completion
of appearance of the peak of the first wave, the flow rate
of the atmosphere gas, which flows through the gas flow
rate controllers 8, 9, was reduced to 500 ml/min. This
permitted a second wave to appear separately from the first
wave.
Until the appearance of the second wave peak, the flow
rate of the atmosphere gas, which flows through the gas
flow rate controllers 8, 9, was kept at 500 ml/min. After
the appearance of the second wave peak, the temperature was
further raised, and the flow rate of the atmosphere gas,
which flows through the gas flow rate controllers 8, 9 was
reduced to 400 ml/min. This permitted a third wave to
appear separately from the second wave. Until the
appearance of the third wave peak, the flow rate of the
atmosphere gas, which flows through the gas flow rate
controllers 8, 9, was kept at 400 ml/min. After the
appearance of the third wave peak, the temperature was
further raised, and the flow rate of the atmosphere gas,
which flows through the gas flow rate controllers 8, 9, was
reduced to 300 ml/min. No further wave appears, and the
gas extraction was completed.
The first wave is one showing the amount of oxygen
corresponding to Al2O3 oxide, and the amount of oxygen was
0.141 mg. The second wave is one showing the amount of
oxygen corresponding to MgO oxide, and the amount of oxygen
was 0.040 mg. The third wave is one showing the amount of
oxygen corresponding to CaO oxide, and the amount of oxygen
was 0.028 mg. It is considered that, in the analysis, a
reduction in flow rate of inert gas in the order of
appearance of waves increases the partial pressure of CO
at the time of gas extraction and the decomposition
temperature of oxides are shifted toward higher temperature
side, resulting in improved wave separation. Thus,
regulation of the inert gas flow rate in the course of the
analysis has enabled analysis for oxygen in each of three
oxides in the powder analyte.
In Comparative Example 15, a bearing steel was
analyzed. Inclusions of the bearing steel were Al2O3, MgO,
and CaO. The oxygen content of the analyte for each
inclusion was quantitatively determined by extraction
separation of inclusions. As a result, it was found that
the content of oxygen corresponding Al2O3 was 2.5 ppm, the
content of oxygen corresponding to MgO was 1.5 ppm, and the
content of oxygen corresponding to CaO was 1.0 ppm.
Conditions for analysis, such as temperature rise rate,
inert gas flow rate, and optical path length of infrared
CO absorption detector were the same as those in
Comparative Example 14, The extracted wave could not be
separated into three and was single, and the total exacted
oxygen content was 4.9 ppm.
In Example 12, regarding the analyte, the same bearing
steel as used in Comparative Example 15 was analyzed.
Further, the analytical conditions except for the inert gas
flow rate were also the same as those in Comparative
Example 15. The inert gas flow rate was regulated as
follows. Until the appearance of a peak of the first wave,
the flow rate of the atmosphere gas, which flows through
the gas flow rate controllers 8, 9, was brought to 600
ml/min. Thereafter, after the completion of appearance of
the peak of the first wave, the flow rate of the atmosphere
gas, which flows through the gas flow rate controllers 8,
9, was reduced to 500 ml/min. This permitted a second wave
to appear clearly separately from the first wave. Until
the appearance of a second wave peak, the flow rate of the
atmosphere gas, which flows through the gas flow rate
controllers 8, 9, was kept at 500 ml/min. After the
appearance of the second wave peak, the temperature was
further raised, and the flow rate of the atmosphere gas,
which flows through the gas flow rate controllers 8, 9 was
reduced to 400 ml/min. This permitted a third wave to
appear clearly separately from the second wave. Until the
appearance of a third wave peak, the flow rate of the
atmosphere gas, which flows through the gas flow rate
controllers 8, 9, was kept at 400 ml/min. After the
appearance of the third wave peak, the temperature was
further raised, and the flow rate of the atmosphere gas,
which flows through the gas flow rate controllers 8, 9, was
reduced to 300 ml/min. No further wave appeared, and the
gas extraction was completed. The first wave is an
extraction curve for oxygen corresponding to Al2O3
inclusion, and the oxygen content was 2.49 ppm. The second
wave is an extraction curve for oxygen corresponding to MgO
inclusion, and the oxygen content was 1.48 ppm. The third
wave is an extraction curve for oxygen corresponding to CaO
inclusion, and the oxygen content was 0.96 ppm.
It is considered that, as with the analysis of the
powder analyte, in the analysis, a reduction in flow rate
of inert gas in the order of appearance of waves increases
the partial pressure of CO in the crucible 2 at the time
of gas extraction and the decomposition temperature of
oxides are shifted toward higher temperature side as
compared with the case where the atmosphere gas flow rate
is kept constant, resulting in improved wave separation.
Thus, regulation of the inert gas flow rate in the course
of the analysis has enabled analysis for oxygen in each of
three oxides in the bearing steel as the analyte.
In Example 13, the same bearing steel as used in
Comparative Example 15 and Example 12 was analyzed. In
Example 13, the amount of the analyte melted was increased
to 3 g as compared with 1 g of the analyte melted in
Comparative Example 15 and Example 12. Other conditions,
such as melting and gas flow rate, were quite the same as
those used in Example 12. As compared with Example 12, the
absolute amount of oxygen evolved from each oxide was
increased, the separability of the first, second, and third
waves from one another was further improved, resulting in
improved accuracy of the quantitatively determined value
for each oxide.
In Example 14 (not shown in Table 5), 1 g of a
bearing steel was analyzed while simultaneously controlling
the temperature rise rate and the gas flow rate.
Inclusions of the bearing steel were SiO2, Al2O3, MgO, and
CaO. The oxygen content of the analyte for each inclusion
was previously quantitatively determined by extraction
separation of inclusions. As a result, it was found that
the content of oxygen corresponding to SiO2 was 0.8 ppm,
the content of oxygen corresponding to Al2O3 was 2.1 ppm,
the content of oxygen corresponding to MgO was 1.4 ppm, and
the content of oxygen corresponding to CaO was 1.0 ppm.
The analyte was heated at a temperature rise rate of 1°C/sec
in a period from a analyte heating start point to a
first wave peak appearance point and at a temperature rise
rate of 0°C/sec in a period from the first wave peak
appearance point to a first wave end point. In this case,
until the appearance of a peak of the first wave, the flow
rate of the atmosphere gas, which flows through the gas
flow rate controllers 8, 9, was 600 ml/min. Thereafter,
in a period from the completion of appearance of the peak
of the first wave to a second wave peak appearance point,
the flow rate of the atmosphere gas, which flows through
the gas flow rate controllers 8, 9, was reduced to 500
ml/min. This permitted a second wave to appear clearly
separately from the first wave. The temperature rise rate
in a period from the first wave end point to the second
wave peak appearance point was 1°C/sec.
The temperature rise rate in a period from the second
wave peak appearance point to a second wave end point was
again brought to 0°C/sec. As soon as the second wave peak
appears, the flow rate of the atmosphere gas, which flows
through the gas flow rate controllers 8, 9, was reduced to
400 ml/min until a third wave peak appeared. This
permitted the third wave to appear clearly separately from
the second wave. The temperature rise rate in a period
from the second wave end point to the third wave peak
appearance point was 1°C/sec.
The temperature rise rate in a period from the third
wave peak appearance point to a third wave end point was
again brought to 0°C/sec. As soon as the third wave peak
appeared, the flow rate of the atmosphere gas, which flows
through the gas flow rate cotrollers 8, 9, was reduced to
350 ml/min until a fourth wave peak appeared. This
permitted the fourth wave to appear clearly separately from
the third wave. The temperature rise rate in a period from
the third wave end point to the fourth wave peak appearance
point was 1°C/sec.
The temperature rise rate in a period from the fourth
wave peak appearance point to a fourth wave end point was
again brought to 0°C/sec. As soon as the fourth wave peak
appeared, the flow rate of the atmosphere gas, which flows
through the gas flow rate controllers 8, 9, was reduced to
300 ml/min. The temperature rise rate was again brought
to 1°C/sec from the fourth wave end point. As a result, no
further gas extraction occurred until the completion of the
analysis. The first wave is an extraction curve for oxygen
corresponding to SiO2 and indicates that the oxygen content
is 0.79 ppm. The second wave is an extraction curve for
oxygen corresponding to Al2O3 and indicates that the oxygen
content is 2.1 ppm. The third wave is an extraction curve
for oxygen corresponding To MgO and indicates that the
oxygen content is 1.4 ppm. The fourth wave is an
extraction curve for oxygen corresponding to CaO and
indicates that the oxygen content is 1.0 ppm. Thus,
analysis while simultaneously controlling the temperature
rise rate and the gas flow rate could provide results which
were in very good agreement with the oxygen contents of the
analyte for each inclusion which had been previously
quantitatively determined. Further, the peak position of
each wave could be more clearly distinguished as compared
with that in the case where only the gas flow rate was
controlled.
The effect of separating waves from each other or one
another according to the examples of the present invention
better with reducing the temperature rise rate of the
analyte at the time of gas extraction.
The flow race of the gas passing through the flow rate
controller 8 may be the same as that of the gas passing
through the flow rate controller 9. However peakout of
the display of exacted wave often occurs due to excessive
amount of extracted gas. In this case, the flow rate of
the gas passing through the flow rate controller 9 may be
reduced.
As is apparent from the foregoing description,
application of the apparatus according to the present
invention to the analysis for oxygen for each oxide by the
inert gas fusion carrying/infrared absorption method
realized separation and determination of oxygen for each
oxide inclusion in an analyte with good accuracy.