EP0415401A2 - Verfahren und Gerät zur Verbesserung eines Multipliziersignals - Google Patents
Verfahren und Gerät zur Verbesserung eines Multipliziersignals Download PDFInfo
- Publication number
- EP0415401A2 EP0415401A2 EP90116621A EP90116621A EP0415401A2 EP 0415401 A2 EP0415401 A2 EP 0415401A2 EP 90116621 A EP90116621 A EP 90116621A EP 90116621 A EP90116621 A EP 90116621A EP 0415401 A2 EP0415401 A2 EP 0415401A2
- Authority
- EP
- European Patent Office
- Prior art keywords
- data
- multiplicative
- spectral
- additive
- model
- Prior art date
- Legal status (The legal status is an assumption and is not a legal conclusion. Google has not performed a legal analysis and makes no representation as to the accuracy of the status listed.)
- Granted
Links
- 238000000034 method Methods 0.000 title claims abstract description 121
- 238000012937 correction Methods 0.000 title claims description 58
- 238000001228 spectrum Methods 0.000 claims abstract description 208
- 230000003595 spectral effect Effects 0.000 claims abstract description 157
- 230000000996 additive effect Effects 0.000 claims abstract description 91
- 239000000654 additive Substances 0.000 claims abstract description 79
- 230000000694 effects Effects 0.000 claims abstract description 63
- 230000009021 linear effect Effects 0.000 claims abstract description 56
- 238000005259 measurement Methods 0.000 claims abstract description 32
- 230000002452 interceptive effect Effects 0.000 claims abstract description 21
- 238000004458 analytical method Methods 0.000 claims abstract description 18
- 238000012545 processing Methods 0.000 claims abstract description 16
- 238000010200 validation analysis Methods 0.000 claims abstract description 10
- 238000000491 multivariate analysis Methods 0.000 claims abstract description 6
- 239000011159 matrix material Substances 0.000 claims description 49
- 239000012491 analyte Substances 0.000 claims description 41
- 238000011068 loading method Methods 0.000 claims description 27
- 239000000126 substance Substances 0.000 claims description 12
- 230000036961 partial effect Effects 0.000 claims description 10
- 238000012986 modification Methods 0.000 claims description 5
- 230000004048 modification Effects 0.000 claims description 5
- 238000005457 optimization Methods 0.000 claims description 5
- 238000012628 principal component regression Methods 0.000 claims description 5
- 238000007476 Maximum Likelihood Methods 0.000 claims description 4
- 238000000354 decomposition reaction Methods 0.000 claims description 4
- 238000010276 construction Methods 0.000 claims description 2
- 238000002945 steepest descent method Methods 0.000 claims description 2
- OVBPIULPVIDEAO-LBPRGKRZSA-N folic acid Chemical compound C=1N=C2NC(N)=NC(=O)C2=NC=1CNC1=CC=C(C(=O)N[C@@H](CCC(O)=O)C(O)=O)C=C1 OVBPIULPVIDEAO-LBPRGKRZSA-N 0.000 claims 1
- 238000005303 weighing Methods 0.000 claims 1
- 238000004611 spectroscopical analysis Methods 0.000 abstract description 10
- 238000005516 engineering process Methods 0.000 abstract description 5
- 238000010191 image analysis Methods 0.000 abstract description 5
- 238000004587 chromatography analysis Methods 0.000 abstract description 4
- 238000001962 electrophoresis Methods 0.000 abstract description 4
- 238000000518 rheometry Methods 0.000 abstract description 3
- 238000002076 thermal analysis method Methods 0.000 abstract description 3
- 239000013598 vector Substances 0.000 description 21
- 238000012417 linear regression Methods 0.000 description 11
- 230000008569 process Effects 0.000 description 8
- 239000002904 solvent Substances 0.000 description 8
- 239000000470 constituent Substances 0.000 description 7
- 239000000203 mixture Substances 0.000 description 7
- 238000010606 normalization Methods 0.000 description 7
- 239000000463 material Substances 0.000 description 6
- 230000003287 optical effect Effects 0.000 description 6
- 238000002835 absorbance Methods 0.000 description 4
- 238000010521 absorption reaction Methods 0.000 description 4
- 238000013459 approach Methods 0.000 description 4
- 238000010586 diagram Methods 0.000 description 4
- 239000002245 particle Substances 0.000 description 4
- 238000000513 principal component analysis Methods 0.000 description 4
- 239000000047 product Substances 0.000 description 4
- 238000001055 reflectance spectroscopy Methods 0.000 description 4
- 230000004044 response Effects 0.000 description 4
- 230000035945 sensitivity Effects 0.000 description 4
- 230000009466 transformation Effects 0.000 description 4
- 230000000875 corresponding effect Effects 0.000 description 3
- 238000007405 data analysis Methods 0.000 description 3
- 238000013501 data transformation Methods 0.000 description 3
- 238000007619 statistical method Methods 0.000 description 3
- 238000002235 transmission spectroscopy Methods 0.000 description 3
- XLYOFNOQVPJJNP-UHFFFAOYSA-N water Substances O XLYOFNOQVPJJNP-UHFFFAOYSA-N 0.000 description 3
- 238000000862 absorption spectrum Methods 0.000 description 2
- 238000000498 ball milling Methods 0.000 description 2
- 230000008901 benefit Effects 0.000 description 2
- 230000005540 biological transmission Effects 0.000 description 2
- 239000008280 blood Substances 0.000 description 2
- 210000004369 blood Anatomy 0.000 description 2
- 230000008859 change Effects 0.000 description 2
- 230000002596 correlated effect Effects 0.000 description 2
- 230000007423 decrease Effects 0.000 description 2
- 238000009826 distribution Methods 0.000 description 2
- 230000008030 elimination Effects 0.000 description 2
- 238000003379 elimination reaction Methods 0.000 description 2
- 230000007613 environmental effect Effects 0.000 description 2
- 239000000835 fiber Substances 0.000 description 2
- 238000002329 infrared spectrum Methods 0.000 description 2
- 239000013067 intermediate product Substances 0.000 description 2
- 238000000053 physical method Methods 0.000 description 2
- 238000003672 processing method Methods 0.000 description 2
- 238000013519 translation Methods 0.000 description 2
- 238000012935 Averaging Methods 0.000 description 1
- 241000196324 Embryophyta Species 0.000 description 1
- WQZGKKKJIJFFOK-GASJEMHNSA-N Glucose Natural products OC[C@H]1OC(O)[C@H](O)[C@@H](O)[C@@H]1O WQZGKKKJIJFFOK-GASJEMHNSA-N 0.000 description 1
- 238000004566 IR spectroscopy Methods 0.000 description 1
- 241001465754 Metazoa Species 0.000 description 1
- 241000209140 Triticum Species 0.000 description 1
- 235000021307 Triticum Nutrition 0.000 description 1
- 230000003466 anti-cipated effect Effects 0.000 description 1
- 238000004364 calculation method Methods 0.000 description 1
- 230000001364 causal effect Effects 0.000 description 1
- 235000013339 cereals Nutrition 0.000 description 1
- 238000001816 cooling Methods 0.000 description 1
- 230000003247 decreasing effect Effects 0.000 description 1
- 238000011156 evaluation Methods 0.000 description 1
- 235000013305 food Nutrition 0.000 description 1
- 238000000186 gas chromatography-infrared spectroscopy Methods 0.000 description 1
- 239000008103 glucose Substances 0.000 description 1
- 238000000227 grinding Methods 0.000 description 1
- 238000009499 grossing Methods 0.000 description 1
- 229910052736 halogen Inorganic materials 0.000 description 1
- 230000009931 harmful effect Effects 0.000 description 1
- 229910052739 hydrogen Inorganic materials 0.000 description 1
- 239000001257 hydrogen Substances 0.000 description 1
- 125000004435 hydrogen atom Chemical group [H]* 0.000 description 1
- 238000012804 iterative process Methods 0.000 description 1
- 230000000670 limiting effect Effects 0.000 description 1
- 238000012886 linear function Methods 0.000 description 1
- 238000001320 near-infrared absorption spectroscopy Methods 0.000 description 1
- 230000009022 nonlinear effect Effects 0.000 description 1
- 230000001151 other effect Effects 0.000 description 1
- 238000005192 partition Methods 0.000 description 1
- 230000000704 physical effect Effects 0.000 description 1
- 238000007781 pre-processing Methods 0.000 description 1
- 102000004169 proteins and genes Human genes 0.000 description 1
- 108090000623 proteins and genes Proteins 0.000 description 1
- 239000000700 radioactive tracer Substances 0.000 description 1
- 230000009467 reduction Effects 0.000 description 1
- 230000002829 reductive effect Effects 0.000 description 1
- 238000000611 regression analysis Methods 0.000 description 1
- 238000011160 research Methods 0.000 description 1
- 241000894007 species Species 0.000 description 1
- 230000003068 static effect Effects 0.000 description 1
- 238000006467 substitution reaction Methods 0.000 description 1
- 230000009897 systematic effect Effects 0.000 description 1
- 238000004809 thin layer chromatography Methods 0.000 description 1
- 238000003325 tomography Methods 0.000 description 1
- 238000012546 transfer Methods 0.000 description 1
- 238000000844 transformation Methods 0.000 description 1
- 238000011282 treatment Methods 0.000 description 1
- 229910052721 tungsten Inorganic materials 0.000 description 1
- 239000010937 tungsten Substances 0.000 description 1
- -1 tungsten halogen Chemical class 0.000 description 1
Images


Classifications
-
- G—PHYSICS
- G01—MEASURING; TESTING
- G01J—MEASUREMENT OF INTENSITY, VELOCITY, SPECTRAL CONTENT, POLARISATION, PHASE OR PULSE CHARACTERISTICS OF INFRARED, VISIBLE OR ULTRAVIOLET LIGHT; COLORIMETRY; RADIATION PYROMETRY
- G01J3/00—Spectrometry; Spectrophotometry; Monochromators; Measuring colours
- G01J3/28—Investigating the spectrum
-
- G—PHYSICS
- G01—MEASURING; TESTING
- G01J—MEASUREMENT OF INTENSITY, VELOCITY, SPECTRAL CONTENT, POLARISATION, PHASE OR PULSE CHARACTERISTICS OF INFRARED, VISIBLE OR ULTRAVIOLET LIGHT; COLORIMETRY; RADIATION PYROMETRY
- G01J3/00—Spectrometry; Spectrophotometry; Monochromators; Measuring colours
- G01J3/12—Generating the spectrum; Monochromators
- G01J3/18—Generating the spectrum; Monochromators using diffraction elements, e.g. grating
- G01J2003/1828—Generating the spectrum; Monochromators using diffraction elements, e.g. grating with order sorter or prefilter
-
- G—PHYSICS
- G01—MEASURING; TESTING
- G01N—INVESTIGATING OR ANALYSING MATERIALS BY DETERMINING THEIR CHEMICAL OR PHYSICAL PROPERTIES
- G01N2201/00—Features of devices classified in G01N21/00
- G01N2201/12—Circuits of general importance; Signal processing
- G01N2201/129—Using chemometrical methods
Definitions
- the present invention relates generally to processing of spectral data to reduce undesired variations and to remove interfering information present in the data.
- the present invention relates to an improved instrument or method for processing of spectral data to reduce undesired variations and to remove interfering information present in the data.
- the present invention relates to an improved instrument, method or process to provide improved measurements of analytes based on spectral data by reducing undesired variations and removing interfering information present in the data.
- Spectral data consists of multiple interrelated data points, such as an optical spectrum or a chromatogram, which carries information related to the components and characteristics of the specimen from which the data was derived, as well as to the performance of the analytical instrument and to the general experimental conditions.
- this specimen is a material and the spectral data comprises the results of related measurements made on the specimen as a function of a variable, such as the frequency or wavelength of the energy used for measurement.
- the spectral variable may be time or distance.
- the variable is usually temperature or time.
- mechanical vibration/acoustics analysis the variable is usually frequency.
- the variable can be position, shear rate or time.
- electrophoresis and thin layer chromatography the variable is relative distance in one or two dimensions.
- time is either the primary variable or an additional variable that adds to the dimensionality of the data.
- the fundamental variable is usually distance in one or two dimensions although the two-dimensional Fourier transform, also known as the Weiner transform, and the Weiner spectrum which express the information in a two-dimensional spatial frequency domain are also prevalent.
- Multivariate images such as three color video signals and many satellite images where each picture element is characterized by a multichannel "spectrum" and also images constituting a time sequence of information, provide additional dimensionality in the data.
- the images can be summarized into histograms showing distributions of various picture elements, where the variable is then a vector of categories, each representing a class of picture elements, e.g. various gray levels of pixels, or contextual classes based on local image geometry.
- the additional multichannel information may be included in the contextual classification.
- Time information can likewise be included in the definition of the categories in the variable.
- the above descriptions of two-way images also apply to three-way tomographic images, e.g. in MRI and X-ray tomography.
- spectral data information from several specimens may be related to each other statistically to derive analytical information.
- desired analytical information such as the concentration of a constituent, the magnitude of a physical property, or the identification of the specimen or its components
- one form or another of additive multivariate approximation or modeling is typically employed.
- a desired parameter may be modeled as the suitably weighted sum of the measurements at selected data points within the spectrum or a weighted sum of previously determined reference spectra.
- the weighting coefficients sometimes referred to as the calibration coefficients, are statistically determined based on spectral data obtained from a set of calibration specimens for which the values for the parameter of interest are known.
- This additive multivariate calibration may be considered as a general interference subtraction, whereby each input spectrum is resolved as a sum of underlying structures, each with a known or estimated spectrum.
- the structures can be known or directly measured spectra of various individual phenomena affecting the input spectrum, or estimated "loading" vectors (e.g. bilinear factors) that span their variability statistically.
- the resolution yields estimates of the level or score of each such phenomenon or factor in the input spectrum.
- the additive modeling performs the equivalent of a weighted subtraction of the various interferants' spectral effects, thereby providing selectivity enhancement.
- Additive multivariate approximation is appropriate for purely additive structures, or by taking the logarithm of the data values, for purely multiplicative structures.
- the modeling is much less accurate and robust for mixed additive and multiplicative structures.
- real measured spectral data usually has some degree of such mixed structures including multiplicative effects that affect the analytical sensitivity.
- the scatter coefficient In diffuse reflectance spectroscopy, for example, the scatter coefficient varies due to particle size. Even when grinding is appropriate, the resulting particles have a range of sizes, with a mean and distribution that is variable depending on both physical and chemical factors, and a range of optical properties that vary with the wavelength itself as well as the particle composition and physical shape.
- the effective optical pathlength may be affected by changes in geometry, scattering, temperature, density of the material, and related physical parameters. Variation in the amount of material added to the column produces multiplicative effects in chromatography as does the intensity of the dye added to gel in electrophoresis. In image analysis, variations the total area of pixels counted and the pixel intensity can contribute multiplicative factors to otherwise additive structures. Finally, instrumental and other experimental effects, e.g. a nonlinear instrument response, may appear as multiplicative factors, particularly when a logarithmic data transformation is applied.
- first or second derivative spectra are used so that any baseline offsets are eliminated.
- the absence of baseline offset in the divisor is a requirement to maintain linearity when removing a multiplicative factor.
- Their method involves selecting a wavelength for the first numerator by examination of the correlation of the data at each wavelength with the values of the parameter of interest.
- a denominator wavelength is then selected by similar examination of the correlation of the ratio to the parameter of interest. Iteration involving changes to the data point spacing and smoothing used in the finite difference computation of the derivative is then performed to optimize the approximation. Additional terms may then be added to the model in a stepwise procedure. This method has been useful however, it is limited to a specific calibration using data at a few selected wavelengths.
- Each spectrum is then projected on this average spectrum by simple linear regression over selected wavelengths and its offset and slope relative to the average spectrum thereby determined. Corrected spectra are then obtained by subtracting the appropriate offset coefficient from each spectrum and then dividing the resulting spectral data by the slope coefficient. The estimated slope coefficient is sometimes modified somewhat at different wavelengths in order to correct for wavelength dependency of the scatter coefficient. The resulting corrected spectral values equal the average spectral values plus residuals that contain the desired analytical information normalized to the average measurement conditions. This method, however, is subject to errors caused by the non-random nature and potentially large magnitude of these residuals.
- Varying levels of known or unknown additive interferences also characterize the above forms of spectral data.
- spectroscopy it is common to have a background spectrum added to the desired data from sources such as absorption by the solvent used to dissolve the specimen for analysis, absorption by the reference used to determine the incident energy, nonspecific emission or fluorescence from the specimen or instrumentation, and stray light, specular reflections, and other measurement artifacts.
- sources such as absorption by the solvent used to dissolve the specimen for analysis, absorption by the reference used to determine the incident energy, nonspecific emission or fluorescence from the specimen or instrumentation, and stray light, specular reflections, and other measurement artifacts.
- the other technologies discussed above have similar problems of additive interferences.
- Specimen stability is often a cause of such a problem.
- powdered specimens are common.
- the water content of many powdered specimens tends to equilibrate with the environmental humidity.
- Temperature also affects the spectra, particularly in the case of hydrogen bonded species such as water. A small fraction of one degree Celsius temperature change can be readily detected in aqueous specimens. Adequate control of specimen temperature during measurement is difficult in the laboratory and often impossible in a processing plant environment. Other measurement technologies are subject to such difficult to control variables.
- a method to accurately remove the spectral effects of such variables without disturbing the analyte information prior to use of the spectra for calibration, validation, and determination would improve the utility and performance of multivariate data analysis techniques.
- additive e.g. chemical
- multiplicative e.g. physical
- a method is used wherein spectral data of each specimen is represented by a multivariate model using previously known spectral information as opposed to only the average or "ideal specimen” spectral data utilized with simple linear regression modeling in the prior multiplicative scatter correction method.
- the method encompasses incorporating the reference spectra of selected other components and, using multivariate estimation means rather than simple linear regression, determining the coefficients thereby resulting in substantially more accurate estimation of the magnitude of the offset and multiplicative corrections due to the reduction of the amount of unmodeled information contained in the residuals.
- the present invention includes using any linear multivariate estimator to determine the correction coefficients such as multiple linear regression, generalized least squares, maximum likelihood regression, robust regression, estimated best linear predictor, partial least squares, principal component regression, Fourier regression, covariance adjustment, or non-Euclidian distance measures.
- any linear multivariate estimator to determine the correction coefficients such as multiple linear regression, generalized least squares, maximum likelihood regression, robust regression, estimated best linear predictor, partial least squares, principal component regression, Fourier regression, covariance adjustment, or non-Euclidian distance measures.
- the present invention also includes using any non-linear multivariate estimation method to determine the corrections, such as linearization by Taylor expansion, the steepest descent method, Mar- quardt's compromise, or simplex optimization to define coefficients minimizing the sum squared error of the nonlinear model.
- any non-linear multivariate estimation method such as linearization by Taylor expansion, the steepest descent method, Mar- quardt's compromise, or simplex optimization to define coefficients minimizing the sum squared error of the nonlinear model.
- the present invention also comprises, as option A, using the coefficients of the interfering components derived by the linear or non-linear modeling to scale the spectra of these components so that subtraction of the scaled spectra from the data can substantially remove their contribution from the data.
- the present invention also comprises, as option B, generating modified reference spectra of the interfering components that contain only those portions of the original reference spectra that are orthogonal to, and therefore uncorrelated with, one or more reference analyte spectra.
- the coefficients generated for these orthogonal spectra are not influenced by the presence or magnitude of analyte information contained in the raw data even if the analyte spectrum is not included in the modeling or the coefficient estimator does not inherently or- thogonalize the components, so they may be a more correct representation of the magnitude of the spectral effects of the interfering components.
- These more accurate coefficients are then used to scale the original reference spectra prior to subtraction from the input data and the correction proceeds as in option A. This option reduces or eliminates the error in analyte spectral contribution that would otherwise be caused by subtracting an incorrect amount of a spectrum which contains some information equivalent to analyte information.
- the present invention also comprises, as option C, the further scaling of the spectra of the interfering components and, if desired, the spectra of the analyte(s) so as to control the degree of spectral modification and correction applied to the data.
- Spectral components may be removed, down-weighted, left as is, or emphasized by control of the weighting coefficients.
- the present invention also comprises, as option D, updating of the analyte and interference spectra based on the results of later stages of data processing and analysis, for example based on principal components analysis (PCA) or partial least squares (PLS).
- PCA principal components analysis
- PLS partial least squares
- the present invention also comprises, as option E, interactive displaying graphical output concerning which analyte and interference spectra, if any, are causing difficulties with respect to estimation of the multiplicative correction and interactive control over which reference spectra are utilized, the spectral range included in estimating the coefficients, and the weighting of the additive corrections employed.
- the present invention has general applicability in the field of signal and data processing, wherever "spectra" or data structures consisting of multiple interrelated data points are obtained and the variability in the data can be described as combined additive and multiplicative effects. These types of effects are common in many forms of measurement and previous efforts have been made to solve the problems, as discussed above.
- the present application uses division to normalize the multiplicative variability but it employs all or most of the spectral information rather than one or a few selected wavelengths and does not depend on use of the derivative data transformation.
- the measured spectral information may be considered as:
- X is the spectral ordinate, e.g. absorbance, fluorescent energy, or pixel intensity or relative count, representing the measurement system response.
- k may be representative of a single dimension, e.g wavelength in optical spectroscopy, two dimensions, e.g. time and wavelength in GC-IR measurements, or more depending on the measurement technology utilized.
- names of matrices are capitalized (e.g.
- R kj and a matrix may comprise a single row or a single column of elements, for example X k ;, Y ki, and R ks are individual spectra represented by single column matrices (vectors) of length K.
- Sets of multiple spectra form matrices (e.g. R ka , R kj , and Q km ). Quantities that only exist as vectors or scalers are not capitalized.
- the spectral data consists of the sum of spectral components R kn and Q km that are functions of the variable k, each contributing to the spectrum of specimen i in an amount defined by the coefficients t ni or t mi , the values of which differ from specimen to specimen but are not functions of k.
- e ki is additive random error in the spectral data.
- the spectral components may be considered the fundamental signatures of the underlying chemical or physical parameters being measured while the coefficients relate to the quantity of the parameter and the sensitivity of the measurement.
- Many fundamental physical processes generate such linear spectral data, e.g. the absorbance spectra of chemical mixtures measured by optical spectroscopy.
- t oi describes a additive offset and any additive baseline that is a function of k can be considered an additional spectral component Q km . Variations in the additive offset and the sensitivity of the measurement among data from different specimens contributes the additive and multiplicative errors for which this invention provides improved data corrections.
- the fundamental improved method of data normalization provided by this invention is based on the use of previously obtained reference spectra R ks , R ka , and R kj to model the input spectral data X ki . Therefore, they are separately considered in the equation above.
- Q km describes spectral information present in the input data that is not represented by any of the reference spectra.
- the objective is to include sufficient spectral information in R ks , R ka and R k j so that Q km *t mi is small enough that it may be safely neglected.
- R ks is the primary "standard" spectrum used as the basis for determining the multiplicative correction coefficient. Typically, it represents the average spectrum of the class of specimens, the spectrum of the solvent within which the analyte is dissolved and to which the analyte concentration is referenced (e.g. molality), or the spectrum of a naturally occurring or artificially introduced tracer material.
- a corrected spectrum Y ki can be defined as In order to perform such a correction, the values of t oi and t s ; must be derived from the data X k ; separately for each specimen i. Improved methods and apparatus for estimating these values are the subject of this invention.
- R ka are one or more reference spectra representing the expected influence of the analytes of interest on the input data.
- analyte is used broadly to indicate the quality sought in the subsequent analysis of the data, for example a quantity of a constituent or an identification of the specimen or one or more of its components based on a between-class discriminant function.
- R kj are reference spectra representing the expected influence of various undesired interferences, whether chemical or physical interferences in the specimen or artifacts introduced by the instrumentation, on the input data X ki .
- R ks is the ideal spectrum e.g. the average taken under the same measurement conditions, the expected value of t s ; is 1. If R ks is a pure solvent taken under the same conditions, t s ; is expected to be less than 1, depending on solute concentration. If R ks is taken under different pathlength or concentration conditions, t s ; can be less than or greater than 1.
- t ai and t ji are related to the concentration of the components and differences in the measurement sensitvity between the data for R kn and that for X ki .
- the reference spectra represent previously known more or less accurate information about how the qualities sought in the subsequent analysis (e.g. analyte concentrations or between-class discriminant functions) and various interferences are expected to affect the input data.
- These reference spectra can be based on direct physical measurements of individual specimens, direct physical measurement of the separate constituents, or statistical summaries or estimates of the spectra based on sets of specimens.
- R ks may be the average of all the spectra obtained by measurement of the calibration set of specimens or the result of a careful measurement of a solvent blank. It is desireable that the spectral characteristics of R ks be stable. If R ks is the average spectrum, this implies use of a reasonably large number of representative individual spectra in computing the average spectrum.
- R ks In the case of a solvent spectrum R ks , it is often desireable to characterize the solvent by more than one spectrum to encompass possible variations due to, for example, the influence of specimen composition, temperature or other environmental factors. The most stable spectral component is then used as R ks and the spectra representing deviations or variations in the solvent spectrum are included in R kj .
- the R ka and R kj reference spectra are often statistical estimates extracted from the measured data from sets of specimens, although directly measured spectra are also useful in many cases.
- Honig's spectral reconstruction (D.E. Honigs, G.M.Hieftje, and T. Hirschfeld, A New Method for Obtaining Individual Component Spectra from Those of Complex Mixtures, Applied Spectroscopy, 38(3),pp. 317-322, a copy of which being annexed hereto and incorporated in its entirety by reference) provides a method for extracting spectra from a set of mixture specimens based on knowledge of the concentration values.
- Principal component analysis (PCA) and partial least squares (PLS) provide orthogonal sets of spectra representative of the variation in the data.
- Stark's method (US Patent application 07/319,450) provides reference spectra for previously unknown variations based on analysis of replicate data.
- the primary requirement of R ka and R kj is that they reasonably span the variation of X k ; so as to stabilize the modeling and spectral accuracy and specificity are not essential.
- the quality of R ka and R kj become more important.
- the accuracy and specificity of the R ka spectral data is particularly important in orthogonalization of R kj either explicitly or implicitly and when used for added weight as described below.
- the spectral information in R ka and R kj may be represented in various ways with respect to redundancy and collinearity, for example one individual vector for each phenomenon, several replicates or specimens, statistical summaries (averages, bilinear components, square root of covariance matrices, etc.), or rotated representations where some or all collinearities have been eliminated.
- redundancy is eliminated by averaging so that the number of vectors equals the number of phenomena being modeled.
- C k ; and D k may each be a function of the spectral values X ki , of the wavelength k, or of both.
- the values of C k ; and D k are will be close to 0 and 1 respectively. If the nonlinearity is negligible, C ki can be set equal to 0 and D k ; equal to 1.
- the resulting structure is then equivalent to the linear additive and multiplicative structure discussed above.
- C k ; and D k are related to the causes of nonlinear behavior.
- the amount of scattering and therefore the effective pathlength may vary as a smooth function of wavelength.
- Refractive index effects have similar smoothly varying forms with respect to wavelength. Therefore, D k ; may be a smooth but non-linear function of wavelength.
- the effective pathlength may be a smooth function of absorbance, as in convergence error in transmission spectroscopy, where an increase in reduces the energy from longer pathlengths more than from shorter ones, thereby making the effective pathlength grow shorter as absorbance increases.
- C ki and D ki can be described as a product of these series, ie a new series in terms of the powers of k and X and their cross products, removing redundant constants and terms in k or X and normalizing so that the linear magnitude information is kept in [R kn *t ni ] and C k ; and D k ; carry only the information relating to the nonlinearity.
- C k ; and D k are matrices containing k rows, and as many columns as required for the number of terms in the appropriate power series approximations.
- the corrected spectra Y k are formed by where the b n ; are estimates of the true t n ; and C k ;, D ki , and b ni are derived from the data X ki .
- the corrected spectrum Y k comprises the standard spectrum R ks and linear additive deviations from R ks caused by analytes, interferants, and errors, and it is therefore suitable for further linear data analysis.
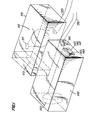
- a photospectrophotometric sensor system 100 as used in the present invention is described.
- This system can be used, for example, in the determination of analytes in blood or, for instance, in the display of glucose levels in blood.
- This sensor system 100 comprises an optical source 110, for example a General Electric type EPT tungsten halogen projection lamp 111 mounted in a housing 112 containing a fan 113 for cooling and coupled to a 1 cm. diameter fiber optic bundle 120 for transmitting energy to the specimen, e.g. the surface of the skin of a patient. Energy transmitted through the tissue is collected by a second fiber optic bundle 130, which transmits it to the spectrophotometer 140.
- an optical source 110 for example a General Electric type EPT tungsten halogen projection lamp 111 mounted in a housing 112 containing a fan 113 for cooling and coupled to a 1 cm. diameter fiber optic bundle 120 for transmitting energy to the specimen, e.g. the surface of the skin of a patient.
- Energy transmitted through the tissue is collected by
- This spectrophotometer comprises an entrance slit 141, a concave holographic grating 142, and one or more diode array detectors 143 and their associated order sorting filters 144, arranged to measure energy at different points in the spectral image formed by the holographic grating, and therefore at different wavelengths within the visible and near-infrared regions of the electromagnetic spectrum.
- Each detector channel has an associated preamplifier 145, the output of which is multiplexed by multiplexer 146 into a programmable gain and offset amplifier 147.
- the spectrophotometer 140 is further described in "Improved Grating Spectrometer", a US patent application filed August 24, 1989 by Edward Stark, one of the coinventors of the present invention. The contents of said application are incorporated herein by reference.
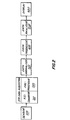
- the time sequential multiplexed analog signal is then converted to digital form by an analog to digital converter 201 in data acquisition system 200.
- the energy data is processed to eliminate instrumental offsets and to reduce both systematic and random noise and then ratioed to obtain data relating to transmission of the specimen.
- This data is then linearized with respect to the analyte information of interest, e.g., the logarithm of transmission is more or less linear with concentration of chemical constituents within the specimen.
- the data is then in form to be normalized in accordance with the methods of this invention. Although the details may differ, similar functions are utilized in obtaining spectral data of the other forms discussed above.
- the additive and multiplicative corrections of this invention are performed by data normalizer 300, which comprises special purpose digital computation logic.
- data normalizer 300 comprises special purpose digital computation logic.
- the data may be further processed in processor 400 prior to use for multivariate calibration, validation and determination of unknown values.
- processor 400 may comprise the invention of "Signal Processing Method and Apparatus” US Patent Application 07/319,450 filed March 3, 1989. The contents of said application are incoporated herein by reference.
- the data is analyzed in the data analyzer 500 which performs the functions of multivariate calibration, validation, and determination required to generate the analytical values then presented on display 600.
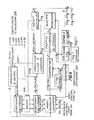
- the data normalizer 300 of the present system illustrated in Figure 3 provides a number of options for processing the input spectral data X ki .
- the basic improved method of data normalization provided by this invention is based on the use of reference spectra R ks , R ka , and R kj stored in the reference spectra storage 310 to model the input spectral data X k ; by means of the coefficient estimator 320, and to determine corrected spectral data Y ki by means of calculator 330.
- Functions 340, 350, and 360 provide additional options which are bypassed for the basic corrections.
- the control and logic sequencer 370 provides the timing, data selection, and control signals required to perform the selected functions in proper sequence.
- this correction is implemented by the calculator function 330 comprising subtractor 331, divider 332, subtractor 333, and divider 334 that perform successive operations on X ki involving the coefficients C k ;, D k ;, b o ;, and b s ; generated by the coefficient estimator 320.
- These operations are performed sequentially element by element by indexing k with a first counter and performing the required sequence of digital arithmetic functions under logic control based on the state of a second counter.
- These digital arithmetic functions are available digital logic functions utilized in computers, and may conveniently be obtained in the 80287 math coprocessor device or an array processor.
- additional correction spectra [R ka * b a ;] and [R kj *b ji ] are formed by matrix multiplier 340 from the reference spectra and their associated coefficients that were also generated in coefficient estimator 320.
- a matrix multiplier to form the spectrum (R kn *b ni ] for a single input spectrum i consists of short term storage for the both inputs, a multiplication and summation circuit, an address sequencer which accesses the corresponding elements n of R kn and B nk and a second address sequencer which accesses the rows k of R kn and addresses the short term storage which keeps the resulting k x 1 matrix.
- Matrix multiplication is also a standard function of available array processors. This additional combined correction spectrum may be used directly by subtractor 333 to further correct Y k ;, which becomes
- [R ka * b a ;] represents the analyte(s) of interest, which must not be removed.
- [Y k ; - R ks ] is simply the analyte spectrum whose scale factor represents the amount of analyte present.
- the [R kj *b ji ] should include, however, those interferants that are difficult or impossible to adequately represent in the calibration data, e.g. moisture and temperature as previously discussed.
- each correction spectrum that is subtracted in forming Y k can be controlled by the operator or in accordance with information obtained in later data processing steps.
- the corrections then become ha-[R ka *b ai ] and hj[R kj *b ji ].
- the corrected spectrum then becomes
- Values 0 ⁇ hj ⁇ 1 may be used to downweight information that has uncertainty or potentially harmful effects on later data analysis without total rejection.
- ha ⁇ 0 increases the weight of the analyte information, thereby reducing the relative importance of other information in the corrected signal.
- the orthogonal component generator 360 provides for transformation of the reference spectra [R ks ,R ka ,R kj ] into a new set of spectra, [P ks ,P ka ,P kj ], some or all of which are orthogonal to each other. If the reference spectra are latent variables derived from a single PCA or PLS analysis, they are orthogonal by definition. If they are measured spectra of components or otherwise separately derived, they will generally be intercorrelated, which if severe enough may cause errors in the coefficient values or failure of the coefficient estimator to complete its operation. If orthogonal reference spectra are created, new reference spectra may be added without requiring complete recalculation by the coefficient estimator. Orthogonal reference spectra also minimize the number of operations required by the coefficient estimator to determine the coefficients.
- the orthogonal component generator performs a Gram-Schmidt orthogonalization in accordance with where
- Each spectrum P kn comprises the residuals of the regression of R kn on the preceding orthogonal P kn . If a spectrum P kn is 0 or has only small values, it provides warning of dependence between spectra that could cause problems in coefficient estimation.
- the information is provided to the operator, or separate decision circuitry, to determine whether to delete the spectrum from the model, to downweight its importance, or to accept it without change.
- Orthogonalization processing may be performed solely for the purpose of generating this warning information.
- the reference spectra input to matrix multiplier 340 are the P kj and P ka .
- the orthogonal component generator and storage 360 comprises storage for P kn , the portion that is filled as the process proceeds comprising Z, storage for [Z'Z]-1, storage for the intermediate product Z(Z'Z)-1, storage for Z i , storage for the intermediate product Z'Z i , point by point multiply and sum logic, scalar inversion (1/a) logic, a subtractor, and the sequencer to select data from storage for processing, to control the processing sequence, and to direct storage of results.
- Circuit devices to perform these functions include the Intel 80287 math coprocessor for hardware implementation of the arithmetic functions, CMOS static ram chips (e.g.
- Full orthogonalization may modify the spectra so drastically that it becomes difficult to recognize their origin and the associated coefficients are thoroughly aliased compared to the original quantities represented by the reference spectra. This is particularly troublesome when interference subtraction, interference downweighting, or analyte enhancement is desired. These factors often make it desireable to perform less drastic processing.
- R ka may be omitted in the estimation of the b kj coefficients without causing errors in their determination.
- This method has the advantage of only removing analyte related information from the reference spectra, thus the analyte spectrum is unaffected, the interferant spectral shapes are minimally affected, and the coefficients have physical interpretations.
- the correct input to the matrix multiplier 340 is R kj rather than P kj , to properly subtract the portion of R kj correlated with R ka . Implementation of this digital logic requires only a subset of the functions described previously.
- the orthogonal component generation is bypassed and the original reference spectra are passed to the coefficient estimator.
- the coefficient estimator 320 mathematically determines the coefficients applicable to the various components used to model the input data.
- the coefficient estimation process involves creating a model representative of the input spectral data that is a function of the reference spectral data and, in nonlinear models, of other variables such as the input spectral data itself and k.
- coefficient estimator 320 fits X k ; to Rnk by some method, minimizing the residuals e ki in
- Methods for achieving this linear modeling include generalized least squares, maximum likelihood regression, robust regression, estimated best linear predictor, partial least squares, principal component regression, Fourier regression, covariance adjustment, and others.
- a preferred embodiment uses the more usual linear modeling performed by multiple linear rearession where
- a matrix multiplier for U nk and X k consists of short term storage for one or both inputs, a multiplication and summation circuit, an address sequencer which accesses the corresponding elements k of U nk and X k ; and a second address sequencer which accesses the rows n of U nk and addresses the short term storage which keeps the resulting b ni values.
- matrix [R R] must be formed and inverted to obtain [R R]-prior to matrix multiplication by R' to obtain U nk . This function can readily be accomplished with an available array processor and suitable logic sequencer.
- a second preferred embodiment of the coefficient estimator which avoids matrix inversion is a principal components regression (PCR) device, which requires no pretreatment of R kn and no matrix inversion.
- PCR principal components regression
- the coefficient estimator 320 becomes more complex as each nonlinear coefficient becomes a vector of length k.
- C k ; and D k ; are therefore matrices containing a number of coefficient vectors that depends on the form of the nonlinear model.
- a preferred embodiment uses the coefficient estimator 320 illustrated in Figure 4 which employs Taylor series linearization.
- the model response generator 321 calculates the vector F from the reference spectra Rkn, the present value Ari of the coefficients being generated by the iterative process, the variable k and the input spectral data Xki. This operation involves matrix multiplication and summation in accordance with the appropriate form of model as discussed above.
- the set of coefficients Ari comprising cni of Cki, dni of Dki, and bni, are initially stored in coefficient Aq-1 storage 322a.
- the multiplicative effect is modeled from the spectral data using a standard multiplicative scatter correction (i.e., avoiding the use of components for practicing the present invention) yielding the corrected spectral data Z.
- P may include any of the following: input component spectra, estimated component spectra, loadings from a PCA or PLS analysis of residuals after fitting estimated component spectra, or loadings from PCA or PLS analysis of X or Z.
- D represents the associated vector of weights obtained by PCA or PLS, for example.
- the finally corrected spectra, Z may be used as a multiplicative corrected input spectra or from this finally corrected spectra, Z, the desired D and P factors which one wants to take away may be subtracted.
- the multiplicative effects say from a physical model
- the additive effects say from a chemical model
- the results of each model are adjusted for the effect of the other model. That is, the results are adjusted for the multiplicative effects and the additive and interferent effects present in the bilinear factors which are chosen for elimination.
- this technique allows for a wide variety of choices of kinds of components to include in the chemical model varying from known interferents and component spectra through statistically estimated PCA or PLS factors.
- the fundamental improved method of data normalization provided by this invention is based on the use of previously obtained analyte and reference spectra to model multiplicative effects on spectral data, although use of the invention does not specifically require the estimation of multiplicative effects directly from the input spectral data using said reference spectra. Rather, the multiplicative effects can be modeled from coefficients and/or loadings derived from statistical analyses (e.g. multiple linear regression, principal component analysis, partial least squares, and generalized least squares) of spectral data. The multiplicative effects obtained in this way can be used to correct the spectral data for multiplicative effects.
- 1 is a vector of ones of length K
- C (c im ) is a matrix of regression coefficients of size LxM which quantifies the analyte and interference contributions
- F (f 1k ) contains the residual loadings with the multiplicative, analyte, and interference phenomena removed.
- d, h, and C can be estimated by regression of P on r, 1, and G by some method (e.g. weighted least squares).
- C*G' could be reduced in size by elimination of effects if the relative size of the chemical or interferent effects are small.
- the additive and multiplicative effects for the input spectra can be obtained from the loadings and scores by and If the mean values of vectors a and b are a mean and b mean , respectively, the input spectra, corrected for additive and multiplicative effects, can be determined by
- the input spectral data can be corrected simultaneously for interferent contributions and additive and multiplicative effects
- C and G * are user-chosen subsets of C and G which include those interferents and analytes of interest which it is desired to eliminate from the input spectral data.
- the corrected spectrum Y i . represents the original input spectral after correction for the additive, multiplicative, and interferent effects present in the bilinear factors.
- a modification to the above technique includes the method whereby the additive, multiplicative and interferent effects are modeled from the coefficients and/or loadings of multivariate statistical techniques and the corrections are applied directly to the multivariate scores rather than to the input spectral data.
- Z represents a general case. More specifically, Z can be corrected for offset and/or a subset of the analyte and interference information contained in C. In practice, if additive correction is desired, the offset correction and a correction for only s subset of C and G will be used.
- PCA singular value decomposition
- the product TU produces offset and interferent corrected scores and V is the matrix of corresponding spectra loadings associated with the corrected scores.
- Multiplicative correction of the offset and interferent corrected data Z can be found in the following way:
- the coefficient estimator 320 described above is preferably the basic element.
- the estimation of an additive model (p. 35, step 2), is performed by coefficient estimator 320.
- the reconstruction of the spectral data (p. 35, step 3), is preferably performed by calculator 330.
- the iteration required on page 35, step 5 is controlled by a logic sequencer 370 or equivalent.
- Modeling from statistical analyses (principal component analysis or partial least squares, for example) may be accomplished by the structure shown in Figure 5. Decomposition of loadings (see page 37) may be performed by the coefficient estimator 320.
- Other functions are readily performed by apparatus disclosed herein.
Landscapes
- Physics & Mathematics (AREA)
- Spectroscopy & Molecular Physics (AREA)
- General Physics & Mathematics (AREA)
- Investigating Or Analysing Materials By Optical Means (AREA)
Applications Claiming Priority (4)
| Application Number | Priority Date | Filing Date | Title |
|---|---|---|---|
| US40203889A | 1989-09-01 | 1989-09-01 | |
| US402038 | 1989-09-01 | ||
| US07/572,534 US5568400A (en) | 1989-09-01 | 1990-08-28 | Multiplicative signal correction method and apparatus |
| US572534 | 2009-10-02 |
Publications (3)
| Publication Number | Publication Date |
|---|---|
| EP0415401A2 true EP0415401A2 (de) | 1991-03-06 |
| EP0415401A3 EP0415401A3 (de) | 1994-02-02 |
| EP0415401B1 EP0415401B1 (de) | 1997-10-29 |
Family
ID=27017694
Family Applications (1)
| Application Number | Title | Priority Date | Filing Date |
|---|---|---|---|
| EP90116621A Expired - Lifetime EP0415401B1 (de) | 1989-09-01 | 1990-08-30 | Verfahren und Gerät zur Verbesserung eines Multipliziersignals |
Country Status (3)
| Country | Link |
|---|---|
| US (1) | US5568400A (de) |
| EP (1) | EP0415401B1 (de) |
| DE (1) | DE69031642T2 (de) |
Cited By (13)
| Publication number | Priority date | Publication date | Assignee | Title |
|---|---|---|---|---|
| EP0552300A4 (en) * | 1990-10-12 | 1994-06-01 | Exxon Research Engineering Co | Spectral data measurement and correction |
| WO1997038292A1 (en) * | 1996-04-11 | 1997-10-16 | Rosenhave Per Einar | Acoustic condition monitoring of objects |
| WO1998039634A1 (en) * | 1997-03-03 | 1998-09-11 | Cme Telemetrix Inc. | Method and apparatus for measurement of blood substitutes |
| EP0880859A4 (de) * | 1995-10-27 | 1999-11-17 | Northrop Grumman Corp | Gerat und verfahren zum beseitigen des offsets und der schattierung eines videosignals |
| WO2000013002A3 (en) * | 1998-08-27 | 2001-02-22 | Abbott Lab | Reagentless analysis of biological samples |
| WO2001042748A3 (en) * | 1999-12-10 | 2002-01-17 | Cidra Corp | Fiber bragg grating peak detection system and method |
| WO2006088350A1 (en) * | 2005-02-21 | 2006-08-24 | Chemometry Consultancy | Method and system for selection of calibration model dimensionality, and use of such a calibration model |
| US7198955B1 (en) | 1997-03-03 | 2007-04-03 | Nir Diagnostics Inc. | Method and apparatus for measurement of blood substitutes |
| EP1017993B1 (de) * | 1997-09-25 | 2009-04-15 | Siemens Healthcare Diagnostics Inc. | Spektralanalyse von proben mit trübungen und hohem absorptionsvermögen |
| US20150078989A1 (en) * | 2012-04-11 | 2015-03-19 | Johnson Matthey Public Limited Company | Zeolite catalyst containing metals |
| WO2017021726A1 (en) * | 2015-08-04 | 2017-02-09 | Stratophase Ltd | Method and system for compensating perturbed measurements |
| CN109409350A (zh) * | 2018-10-23 | 2019-03-01 | 桂林理工大学 | 一种基于pca建模反馈式载荷加权的波长选择方法 |
| US20190224657A1 (en) * | 2014-10-13 | 2019-07-25 | Johnson Matthey Public Limited Company | Zeolite catalyst containing metals |
Families Citing this family (144)
| Publication number | Priority date | Publication date | Assignee | Title |
|---|---|---|---|---|
| DE4243882C1 (de) * | 1992-12-23 | 1994-01-05 | Baleanu Michael Alin | Verfahren und Einrichtung zur Überwachung eines technischen Prozesses |
| DE69430152T2 (de) * | 1993-06-25 | 2002-10-31 | Edward W. Stark | Verfahren und Vorrichtung zum Messen von Glukoseverwandten Substanzen |
| US5857038A (en) | 1993-06-29 | 1999-01-05 | Canon Kabushiki Kaisha | Image processing apparatus and method for synthesizing first and second image data |
| US6690817B1 (en) * | 1993-08-18 | 2004-02-10 | Applied Spectral Imaging Ltd. | Spectral bio-imaging data for cell classification using internal reference |
| EP0737869A3 (de) * | 1995-04-12 | 1997-08-20 | Matsushita Electric Industrial Co Ltd | Thermisches Objektmessgerät, System zur Einschaltquotenschätzung für Fernsehprogramme, Entfernungsdetektor, Verfahren und Vorrichtung zur thermischen Detektion eines Objekts |
| US5841523A (en) * | 1995-04-20 | 1998-11-24 | Chiron Diagnostics Corporation | Method for performing spectroscopic analysis of inhomogeneous test samples |
| FR2734360B1 (fr) * | 1995-05-19 | 1997-07-04 | Elf Antar France | Procede de correction d'un signal delivre par un instrument de mesure |
| US6026334A (en) * | 1996-07-30 | 2000-02-15 | Weyerhaeuser Company | Control system for cross-directional profile sheet formation |
| US6181976B1 (en) * | 1997-04-18 | 2001-01-30 | Larry Stephen Chandler | Adept data processor implementing function similation with inverse deviation variation weighting |
| EP1044370B1 (de) | 1997-12-30 | 2017-08-23 | Caliper Life Sciences, Inc. | Software zur anzeige chromatographischer trenndaten |
| US6108800A (en) * | 1998-02-10 | 2000-08-22 | Hewlett-Packard Company | Method and apparatus for analyzing the performance of an information system |
| US6011875A (en) * | 1998-04-29 | 2000-01-04 | Eastman Kodak Company | Process for enhancing the spatial resolution of multispectral imagery using pan-sharpening |
| EP1086366B1 (de) * | 1998-06-12 | 2010-04-14 | Radiometer Medical ApS | Verfahren zur qualitätskontrolle eines spektrophotometers |
| SE512540C2 (sv) * | 1998-06-22 | 2000-04-03 | Umetri Ab | Metod och anordning för kalibrering av indata |
| US6407386B1 (en) * | 1999-02-23 | 2002-06-18 | Applied Materials, Inc. | System and method for automatic analysis of defect material on semiconductors |
| US6353475B1 (en) | 1999-07-12 | 2002-03-05 | Caliper Technologies Corp. | Light source power modulation for use with chemical and biochemical analysis |
| AU1082501A (en) * | 1999-10-13 | 2001-04-23 | Genomic Solutions, Inc. | A system for minimizing background fluorescence in fluorescence imaging applications using neutral density filter material substrates |
| US6549861B1 (en) | 2000-08-10 | 2003-04-15 | Euro-Celtique, S.A. | Automated system and method for spectroscopic analysis |
| AU2001288292A1 (en) | 2000-08-21 | 2002-03-04 | Euroceltique S.A. | Near infrared blood glucose monitoring system |
| US20020107640A1 (en) * | 2000-11-14 | 2002-08-08 | Ideker Trey E. | Methods for determining the true signal of an analyte |
| GB0031564D0 (en) * | 2000-12-22 | 2001-02-07 | Borealis Tech Oy | Viscosity measurement |
| US7194369B2 (en) * | 2001-07-23 | 2007-03-20 | Cognis Corporation | On-site analysis system with central processor and method of analyzing |
| FR2829849B1 (fr) * | 2001-09-20 | 2003-12-12 | Raise Partner | Dispositif de correction d'une matrice de covariance |
| US7107048B2 (en) * | 2002-01-25 | 2006-09-12 | Chandler Larry S | Inversion-conforming data sets processing |
| DE10222359B4 (de) * | 2002-05-21 | 2005-01-05 | Max Planck-Gesellschaft zur Förderung der Wissenschaften e.V. | Verfahren zur spektral differenzierenden, bildgebenden Messung von Fluoreszenzlicht |
| DE10228799A1 (de) * | 2002-06-27 | 2004-01-29 | Fraunhofer-Gesellschaft zur Förderung der angewandten Forschung e.V. | Vorrichtung und Verfahren zum Überwachen eines ablaufenden Prozesses |
| JP4602765B2 (ja) * | 2002-08-05 | 2010-12-22 | インフラレドックス インコーポレーティッド | 血管壁の近赤外分光分析 |
| JP2004118154A (ja) * | 2002-09-30 | 2004-04-15 | Canon Inc | ベルト搬送装置及び画像形成装置 |
| US7727181B2 (en) | 2002-10-09 | 2010-06-01 | Abbott Diabetes Care Inc. | Fluid delivery device with autocalibration |
| DE60336834D1 (de) | 2002-10-09 | 2011-06-01 | Abbott Diabetes Care Inc | Kraftstoffzufuhrvorrichtung, system und verfahren |
| US7993108B2 (en) | 2002-10-09 | 2011-08-09 | Abbott Diabetes Care Inc. | Variable volume, shape memory actuated insulin dispensing pump |
| US7679407B2 (en) * | 2003-04-28 | 2010-03-16 | Abbott Diabetes Care Inc. | Method and apparatus for providing peak detection circuitry for data communication systems |
| US8071028B2 (en) | 2003-06-12 | 2011-12-06 | Abbott Diabetes Care Inc. | Method and apparatus for providing power management in data communication systems |
| US20190357827A1 (en) | 2003-08-01 | 2019-11-28 | Dexcom, Inc. | Analyte sensor |
| CA2445426A1 (en) * | 2003-10-17 | 2005-04-17 | Alberta Research Council Inc. | A method for characterizing a dispersion using transformation techniques |
| US7092832B2 (en) * | 2003-12-11 | 2006-08-15 | Inlight Solutions, Inc. | Adaptive compensation for measurement distortions in spectroscopy |
| US7383128B2 (en) * | 2004-11-12 | 2008-06-03 | Chandler Larry S | Implementing two dimensional segment inversions with inversion-conforming data sets processing being rendered to include generalized composite weight factors in the processing of error-affected multivariate data samples |
| US9636450B2 (en) | 2007-02-19 | 2017-05-02 | Udo Hoss | Pump system modular components for delivering medication and analyte sensing at seperate insertion sites |
| US7127372B2 (en) * | 2005-02-24 | 2006-10-24 | Itt Manufacturing Enterprises, Inc. | Retro-regression residual remediation for spectral/signal identification |
| US20060224141A1 (en) | 2005-03-21 | 2006-10-05 | Abbott Diabetes Care, Inc. | Method and system for providing integrated medication infusion and analyte monitoring system |
| US7768408B2 (en) | 2005-05-17 | 2010-08-03 | Abbott Diabetes Care Inc. | Method and system for providing data management in data monitoring system |
| US7620437B2 (en) | 2005-06-03 | 2009-11-17 | Abbott Diabetes Care Inc. | Method and apparatus for providing rechargeable power in data monitoring and management systems |
| US7805345B2 (en) * | 2005-08-26 | 2010-09-28 | Sas Institute Inc. | Computer-implemented lending analysis systems and methods |
| CN101365374B (zh) * | 2005-08-31 | 2011-11-16 | 弗吉尼亚大学专利基金委员会 | 改善连续式葡萄糖传感器的准确度 |
| US8880138B2 (en) | 2005-09-30 | 2014-11-04 | Abbott Diabetes Care Inc. | Device for channeling fluid and methods of use |
| US7756561B2 (en) | 2005-09-30 | 2010-07-13 | Abbott Diabetes Care Inc. | Method and apparatus for providing rechargeable power in data monitoring and management systems |
| US7583190B2 (en) | 2005-10-31 | 2009-09-01 | Abbott Diabetes Care Inc. | Method and apparatus for providing data communication in data monitoring and management systems |
| US8344966B2 (en) | 2006-01-31 | 2013-01-01 | Abbott Diabetes Care Inc. | Method and system for providing a fault tolerant display unit in an electronic device |
| US7826879B2 (en) | 2006-02-28 | 2010-11-02 | Abbott Diabetes Care Inc. | Analyte sensors and methods of use |
| US7653425B2 (en) | 2006-08-09 | 2010-01-26 | Abbott Diabetes Care Inc. | Method and system for providing calibration of an analyte sensor in an analyte monitoring system |
| US8219173B2 (en) | 2008-09-30 | 2012-07-10 | Abbott Diabetes Care Inc. | Optimizing analyte sensor calibration |
| US7618369B2 (en) | 2006-10-02 | 2009-11-17 | Abbott Diabetes Care Inc. | Method and system for dynamically updating calibration parameters for an analyte sensor |
| US9339217B2 (en) | 2011-11-25 | 2016-05-17 | Abbott Diabetes Care Inc. | Analyte monitoring system and methods of use |
| US9392969B2 (en) | 2008-08-31 | 2016-07-19 | Abbott Diabetes Care Inc. | Closed loop control and signal attenuation detection |
| US8140312B2 (en) | 2007-05-14 | 2012-03-20 | Abbott Diabetes Care Inc. | Method and system for determining analyte levels |
| US8346335B2 (en) | 2008-03-28 | 2013-01-01 | Abbott Diabetes Care Inc. | Analyte sensor calibration management |
| US8374668B1 (en) | 2007-10-23 | 2013-02-12 | Abbott Diabetes Care Inc. | Analyte sensor with lag compensation |
| US8473022B2 (en) | 2008-01-31 | 2013-06-25 | Abbott Diabetes Care Inc. | Analyte sensor with time lag compensation |
| US8224415B2 (en) | 2009-01-29 | 2012-07-17 | Abbott Diabetes Care Inc. | Method and device for providing offset model based calibration for analyte sensor |
| US7630748B2 (en) | 2006-10-25 | 2009-12-08 | Abbott Diabetes Care Inc. | Method and system for providing analyte monitoring |
| US9675290B2 (en) | 2012-10-30 | 2017-06-13 | Abbott Diabetes Care Inc. | Sensitivity calibration of in vivo sensors used to measure analyte concentration |
| US20100046813A1 (en) * | 2006-07-31 | 2010-02-25 | Keiji Takamoto | Systems and Methods of Analyzing Two Dimensional Gels |
| AU2007308804A1 (en) | 2006-10-26 | 2008-05-02 | Abbott Diabetes Care, Inc. | Method, system and computer program product for real-time detection of sensitivity decline in analyte sensors |
| US8579853B2 (en) | 2006-10-31 | 2013-11-12 | Abbott Diabetes Care Inc. | Infusion devices and methods |
| US8732188B2 (en) | 2007-02-18 | 2014-05-20 | Abbott Diabetes Care Inc. | Method and system for providing contextual based medication dosage determination |
| US8930203B2 (en) | 2007-02-18 | 2015-01-06 | Abbott Diabetes Care Inc. | Multi-function analyte test device and methods therefor |
| EP4108162A1 (de) | 2007-04-14 | 2022-12-28 | Abbott Diabetes Care, Inc. | Verfahren und vorrichtung zur bereitstellung von datenverarbeitung und -kontrolle in einem medizinischen kommunikationssystem |
| CA2683962C (en) | 2007-04-14 | 2017-06-06 | Abbott Diabetes Care Inc. | Method and apparatus for providing data processing and control in medical communication system |
| CA2683953C (en) | 2007-04-14 | 2016-08-02 | Abbott Diabetes Care Inc. | Method and apparatus for providing data processing and control in medical communication system |
| CA2683959C (en) | 2007-04-14 | 2017-08-29 | Abbott Diabetes Care Inc. | Method and apparatus for providing data processing and control in medical communication system |
| US8103471B2 (en) | 2007-05-14 | 2012-01-24 | Abbott Diabetes Care Inc. | Method and apparatus for providing data processing and control in a medical communication system |
| US8444560B2 (en) | 2007-05-14 | 2013-05-21 | Abbott Diabetes Care Inc. | Method and apparatus for providing data processing and control in a medical communication system |
| US8600681B2 (en) | 2007-05-14 | 2013-12-03 | Abbott Diabetes Care Inc. | Method and apparatus for providing data processing and control in a medical communication system |
| US10002233B2 (en) | 2007-05-14 | 2018-06-19 | Abbott Diabetes Care Inc. | Method and apparatus for providing data processing and control in a medical communication system |
| US8239166B2 (en) | 2007-05-14 | 2012-08-07 | Abbott Diabetes Care Inc. | Method and apparatus for providing data processing and control in a medical communication system |
| US8260558B2 (en) | 2007-05-14 | 2012-09-04 | Abbott Diabetes Care Inc. | Method and apparatus for providing data processing and control in a medical communication system |
| US9125548B2 (en) | 2007-05-14 | 2015-09-08 | Abbott Diabetes Care Inc. | Method and apparatus for providing data processing and control in a medical communication system |
| US8560038B2 (en) | 2007-05-14 | 2013-10-15 | Abbott Diabetes Care Inc. | Method and apparatus for providing data processing and control in a medical communication system |
| WO2008144616A1 (en) * | 2007-05-18 | 2008-11-27 | Heidi Kay | Lipid raft, caveolin protein, and caveolar function modulation compounds and associated synthetic and therapeutic methods |
| US7930146B2 (en) * | 2007-05-23 | 2011-04-19 | Chandler Larry S | Errors-in-variables data processing including essential weighting of mapped path-oriented deviations with normal component discrimination |
| WO2009007133A2 (en) * | 2007-07-11 | 2009-01-15 | Technische Universität München | Method and apparatus for determining the visual quality of processed visual information |
| US8834366B2 (en) | 2007-07-31 | 2014-09-16 | Abbott Diabetes Care Inc. | Method and apparatus for providing analyte sensor calibration |
| US8377031B2 (en) | 2007-10-23 | 2013-02-19 | Abbott Diabetes Care Inc. | Closed loop control system with safety parameters and methods |
| US8216138B1 (en) | 2007-10-23 | 2012-07-10 | Abbott Diabetes Care Inc. | Correlation of alternative site blood and interstitial fluid glucose concentrations to venous glucose concentration |
| US8409093B2 (en) | 2007-10-23 | 2013-04-02 | Abbott Diabetes Care Inc. | Assessing measures of glycemic variability |
| US8228218B2 (en) * | 2007-10-30 | 2012-07-24 | Technion Research And Development Foundation Ltd. | Method and apparatus for reconstructing digitized distorted signals |
| WO2009070695A1 (en) * | 2007-11-26 | 2009-06-04 | Mayo Foundation For Medical Education And Research | System and method for phase offset and time delay correction in magnetic resonance spectroscopy data |
| US20090164239A1 (en) | 2007-12-19 | 2009-06-25 | Abbott Diabetes Care, Inc. | Dynamic Display Of Glucose Information |
| JP5498399B2 (ja) | 2008-02-12 | 2014-05-21 | ヒューレット−パッカード デベロップメント カンパニー エル.ピー. | 色検出器 |
| WO2009102328A1 (en) | 2008-02-13 | 2009-08-20 | Hewlett-Packard Development Company, L.P. | Color detector having area scaled photodetectors |
| US8876755B2 (en) | 2008-07-14 | 2014-11-04 | Abbott Diabetes Care Inc. | Closed loop control system interface and methods |
| US20100057040A1 (en) | 2008-08-31 | 2010-03-04 | Abbott Diabetes Care, Inc. | Robust Closed Loop Control And Methods |
| US9943644B2 (en) | 2008-08-31 | 2018-04-17 | Abbott Diabetes Care Inc. | Closed loop control with reference measurement and methods thereof |
| US8622988B2 (en) | 2008-08-31 | 2014-01-07 | Abbott Diabetes Care Inc. | Variable rate closed loop control and methods |
| US8734422B2 (en) | 2008-08-31 | 2014-05-27 | Abbott Diabetes Care Inc. | Closed loop control with improved alarm functions |
| US8986208B2 (en) | 2008-09-30 | 2015-03-24 | Abbott Diabetes Care Inc. | Analyte sensor sensitivity attenuation mitigation |
| US9326707B2 (en) | 2008-11-10 | 2016-05-03 | Abbott Diabetes Care Inc. | Alarm characterization for analyte monitoring devices and systems |
| US8103456B2 (en) | 2009-01-29 | 2012-01-24 | Abbott Diabetes Care Inc. | Method and device for early signal attenuation detection using blood glucose measurements |
| US8560082B2 (en) | 2009-01-30 | 2013-10-15 | Abbott Diabetes Care Inc. | Computerized determination of insulin pump therapy parameters using real time and retrospective data processing |
| US8581589B2 (en) * | 2009-02-02 | 2013-11-12 | The General Hospital Corporation | System and method for variable mode-mixing in magnetic resonance imaging |
| US7924422B2 (en) * | 2009-02-12 | 2011-04-12 | Tokyo Electron Limited | Calibration method for optical metrology |
| WO2010121084A1 (en) | 2009-04-15 | 2010-10-21 | Abbott Diabetes Care Inc. | Analyte monitoring system having an alert |
| WO2010121229A1 (en) | 2009-04-16 | 2010-10-21 | Abbott Diabetes Care Inc. | Analyte sensor calibration management |
| US8467972B2 (en) | 2009-04-28 | 2013-06-18 | Abbott Diabetes Care Inc. | Closed loop blood glucose control algorithm analysis |
| EP2425209A4 (de) | 2009-04-29 | 2013-01-09 | Abbott Diabetes Care Inc | Verfahren und system für die echtzeit-kalibrierung eines analytsensors mit rückwirkender füllung |
| US8597274B2 (en) | 2009-05-22 | 2013-12-03 | Abbott Diabetes Care Inc. | Usability features for integrated insulin delivery system |
| US8798934B2 (en) | 2009-07-23 | 2014-08-05 | Abbott Diabetes Care Inc. | Real time management of data relating to physiological control of glucose levels |
| ES2884623T3 (es) | 2009-07-23 | 2021-12-10 | Abbott Diabetes Care Inc | Procedimiento de fabricación y sistema de medición continua de analitos |
| WO2011014851A1 (en) | 2009-07-31 | 2011-02-03 | Abbott Diabetes Care Inc. | Method and apparatus for providing analyte monitoring system calibration accuracy |
| ES2912584T3 (es) | 2009-08-31 | 2022-05-26 | Abbott Diabetes Care Inc | Un sistema y procedimiento de monitorización de glucosa |
| EP2482720A4 (de) | 2009-09-29 | 2014-04-23 | Abbott Diabetes Care Inc | Verfahren und vorrichtung zur bereitstellung einer benachrichtigungsfunktion in analytüberwachungssystemen |
| US8185181B2 (en) | 2009-10-30 | 2012-05-22 | Abbott Diabetes Care Inc. | Method and apparatus for detecting false hypoglycemic conditions |
| US9086424B2 (en) | 2010-01-25 | 2015-07-21 | Waters Technologies Corporation | Method for determining equivalent thermal conditions between liquid chromatography systems |
| WO2011112753A1 (en) | 2010-03-10 | 2011-09-15 | Abbott Diabetes Care Inc. | Systems, devices and methods for managing glucose levels |
| US8635046B2 (en) | 2010-06-23 | 2014-01-21 | Abbott Diabetes Care Inc. | Method and system for evaluating analyte sensor response characteristics |
| US10092229B2 (en) | 2010-06-29 | 2018-10-09 | Abbott Diabetes Care Inc. | Calibration of analyte measurement system |
| EP2624745A4 (de) | 2010-10-07 | 2018-05-23 | Abbott Diabetes Care, Inc. | Analytüberwachungsvorrichtungen und -verfahren |
| US20120265036A1 (en) | 2011-04-15 | 2012-10-18 | Dexcom, Inc. | Advanced analyte sensor calibration and error detection |
| US20120310705A1 (en) * | 2011-06-06 | 2012-12-06 | Brent Joseph May | Method and system for separating demand models and demand forecasts into causal components |
| EP4122384A1 (de) | 2011-06-16 | 2023-01-25 | Abbott Diabetes Care, Inc. | Analytüberwachungsvorrichtungen, -verfahren und -systeme mit temperaturkompensation |
| WO2013066849A1 (en) | 2011-10-31 | 2013-05-10 | Abbott Diabetes Care Inc. | Model based variable risk false glucose threshold alarm prevention mechanism |
| US8710993B2 (en) | 2011-11-23 | 2014-04-29 | Abbott Diabetes Care Inc. | Mitigating single point failure of devices in an analyte monitoring system and methods thereof |
| US9317656B2 (en) | 2011-11-23 | 2016-04-19 | Abbott Diabetes Care Inc. | Compatibility mechanisms for devices in a continuous analyte monitoring system and methods thereof |
| WO2013191566A1 (en) * | 2012-06-19 | 2013-12-27 | Klein Medical Limited | Spectroscopic analysis |
| JP2014038042A (ja) * | 2012-08-17 | 2014-02-27 | Seiko Epson Corp | 分光計測方法、分光計測器、および変換行列の生成方法 |
| EP2890297B1 (de) | 2012-08-30 | 2018-04-11 | Abbott Diabetes Care, Inc. | Ausfallerkennung bei kontinuierlichen analytüberwachungsdaten bei datenabweichungen |
| WO2014052136A1 (en) | 2012-09-26 | 2014-04-03 | Abbott Diabetes Care Inc. | Method and apparatus for improving lag correction during in vivo measurement of analyte concentration with analyte concentration variability and range data |
| US9474475B1 (en) | 2013-03-15 | 2016-10-25 | Abbott Diabetes Care Inc. | Multi-rate analyte sensor data collection with sample rate configurable signal processing |
| US10433773B1 (en) | 2013-03-15 | 2019-10-08 | Abbott Diabetes Care Inc. | Noise rejection methods and apparatus for sparsely sampled analyte sensor data |
| WO2014152034A1 (en) | 2013-03-15 | 2014-09-25 | Abbott Diabetes Care Inc. | Sensor fault detection using analyte sensor data pattern comparison |
| EP3125761B1 (de) | 2014-03-30 | 2020-09-30 | Abbott Diabetes Care Inc. | Verfahren und vorrichtung zur bestimmung des starts einer mahlzeit und von spitzenwertereignissen in analytüberwachungssystemen |
| GB2533589A (en) * | 2014-12-22 | 2016-06-29 | Ndc Infrared Eng Ltd | Measurement of porous film |
| CA2991716C (en) | 2015-07-10 | 2026-05-12 | Abbott Diabetes Care Inc. | System, device and method of dynamic glucose profile response to physiological parameters |
| EP3600014B1 (de) | 2017-03-21 | 2025-07-30 | Abbott Diabetes Care Inc. | Vorrichtungen und system zur bereitstellung der diagnose von diabetischen zuständen |
| GB201712840D0 (en) | 2017-08-10 | 2017-09-27 | Univ Surrey | Apparatus and method for detecting mutually interfering information streams |
| US11331022B2 (en) | 2017-10-24 | 2022-05-17 | Dexcom, Inc. | Pre-connected analyte sensors |
| CN111246797B (zh) | 2017-10-24 | 2025-09-09 | 德克斯康公司 | 预连接分析物传感器 |
| CN110887809B (zh) * | 2018-09-07 | 2022-07-12 | 湖南中烟工业有限责任公司 | 一种基于近红外光谱技术测定烟丝中梗含量的方法 |
| US20200284871A1 (en) * | 2019-03-05 | 2020-09-10 | Aptiv Technologies Limited | Removing interference from signals received by detectors supported on a vehicle |
| CN109932362B (zh) * | 2019-04-01 | 2020-11-10 | 中国科学院过程工程研究所 | 一种离子液体体系中还原糖含量的测试方法 |
| DK3809118T3 (da) * | 2019-10-17 | 2023-09-18 | Evonik Operations Gmbh | Fremgangsmåde til at forudsige en egenskabsværdi af et materiale ved anvendelse af hovedkomponentanalyse |
| CN113686811B (zh) * | 2021-08-26 | 2023-11-03 | 四川启睿克科技有限公司 | 一种基于双传感器的光谱数据处理方法 |
| US20250327752A1 (en) * | 2024-04-02 | 2025-10-23 | The Research Foundation For The State University Of New York | Raman spectroscopic system for detecting human body fluid traces on an interfering substrate |
| CN119525842B (zh) * | 2025-01-22 | 2025-05-13 | 杭州谱育科技发展有限公司 | 基于libs技术的金属焊接在线检测方法 |
Family Cites Families (12)
| Publication number | Priority date | Publication date | Assignee | Title |
|---|---|---|---|---|
| US4642778A (en) * | 1984-03-02 | 1987-02-10 | Indiana University Foundation | Method and device for spectral reconstruction |
| US4627014A (en) * | 1984-04-09 | 1986-12-02 | Eastman Kodak Company | Method and apparatus for determination of an analyte and method of calibrating such apparatus |
| FR2580819B1 (fr) * | 1985-04-23 | 1987-05-15 | Commissariat Energie Atomique | Systeme pour detecter la presence d'un signal pur dans un signal bruite discret mesure a taux moyen de bruit constant avec une probabilite de fausse detection inferieure a un taux de fausse detection predetermine. |
| US4744657A (en) * | 1985-07-11 | 1988-05-17 | Beckman Instruments, Inc. | Method and record for calibration of a spectrophotometer |
| JPH0629852B2 (ja) * | 1985-08-26 | 1994-04-20 | 富士写真フイルム株式会社 | 偏倚乾式分析要素を用いた液体試料中の被検物質の定量分析方法 |
| US4802102A (en) * | 1987-07-15 | 1989-01-31 | Hewlett-Packard Company | Baseline correction for chromatography |
| JPH0746111B2 (ja) * | 1988-03-18 | 1995-05-17 | 株式会社日立製作所 | 試料分析方法及びこれを用いた自動分析装置 |
| US4916645A (en) * | 1988-06-02 | 1990-04-10 | The Perkin-Elmer Corporation | Continuous monochrometer drift compensation of a spectral monochromator |
| US5046846A (en) * | 1989-03-22 | 1991-09-10 | The Lubrizol Corporation | Method and apparatus for spectroscopic comparison of compositions |
| US4975581A (en) * | 1989-06-21 | 1990-12-04 | University Of New Mexico | Method of and apparatus for determining the similarity of a biological analyte from a model constructed from known biological fluids |
| US5081597A (en) * | 1989-12-21 | 1992-01-14 | Xerox Corporation | Process for dynamically equalizing multichannel optical imaging systems |
| EP0473467B1 (de) * | 1990-08-07 | 1994-12-14 | Schlumberger Limited | Gammastrahlungsspektroskopieverfahren und Vorrichtung zur Konzentrationsbestimmung von Elementen in einem unbekannten Material |
-
1990
- 1990-08-28 US US07/572,534 patent/US5568400A/en not_active Expired - Lifetime
- 1990-08-30 EP EP90116621A patent/EP0415401B1/de not_active Expired - Lifetime
- 1990-08-30 DE DE69031642T patent/DE69031642T2/de not_active Expired - Lifetime
Non-Patent Citations (7)
| Title |
|---|
| APPLIED SPECTROSCOPY. vol. 38, no. 3, 1984, BALTIMORE US pages 317 - 322 HONIGS ET AL. 'A new method for obtaining individual component spectra from those of complex mixtures' * |
| APPLIED SPECTROSCOPY. vol. 39, no. 4, July 1985, BALTIMORE US pages 641 - 646 IVERSEN 'multiplicative scatter correction' * |
| APPLIED SPECTROSCOPY. vol. 44, no. 5, June 1990, BALTIMORE US pages 895 - 898 MILLER ET AL. 'path-length correction method' * |
| database INSPEC, access number 264984 kautz et al. ' cellular logic in-memory arrays' (may 70, USA) * |
| JOURNAL OF CHEMOMETRICS vol. 1, 1987, pages 201 - 219 MARTENS 'improved selectivity in spectroscopy by multivariate calibration' * |
| LABORATORY MICROCOMPUTER vol. 7, no. 2, 1988, pages 74 - 75 MYERS 'unscrambler' * |
| PROCEEDINGS OF NORDIC SYMPOSIUM ON APPLIED STATISTICS June 1983, NORWAY pages 205 - 234 MARTENS ET AL. 'multivariate linearity transformations for Nir spectroscopy' * |
Cited By (19)
| Publication number | Priority date | Publication date | Assignee | Title |
|---|---|---|---|---|
| EP0552300A4 (en) * | 1990-10-12 | 1994-06-01 | Exxon Research Engineering Co | Spectral data measurement and correction |
| EP0880859A4 (de) * | 1995-10-27 | 1999-11-17 | Northrop Grumman Corp | Gerat und verfahren zum beseitigen des offsets und der schattierung eines videosignals |
| WO1997038292A1 (en) * | 1996-04-11 | 1997-10-16 | Rosenhave Per Einar | Acoustic condition monitoring of objects |
| US7198955B1 (en) | 1997-03-03 | 2007-04-03 | Nir Diagnostics Inc. | Method and apparatus for measurement of blood substitutes |
| WO1998039634A1 (en) * | 1997-03-03 | 1998-09-11 | Cme Telemetrix Inc. | Method and apparatus for measurement of blood substitutes |
| EP1017993B1 (de) * | 1997-09-25 | 2009-04-15 | Siemens Healthcare Diagnostics Inc. | Spektralanalyse von proben mit trübungen und hohem absorptionsvermögen |
| WO2000013002A3 (en) * | 1998-08-27 | 2001-02-22 | Abbott Lab | Reagentless analysis of biological samples |
| US6365109B1 (en) | 1998-08-27 | 2002-04-02 | Abbott Laboratories | Reagentless analysis of biological samples |
| US6426045B1 (en) | 1998-08-27 | 2002-07-30 | Abbott Laboratories | Reagentless analysis of biological samples |
| US6773922B2 (en) | 1998-08-27 | 2004-08-10 | Abbott Laboratories | Reagentless analysis of biological samples |
| US6346702B1 (en) | 1999-12-10 | 2002-02-12 | Cidra Corporation | Fiber bragg grating peak detection system and method |
| WO2001042748A3 (en) * | 1999-12-10 | 2002-01-17 | Cidra Corp | Fiber bragg grating peak detection system and method |
| WO2006088350A1 (en) * | 2005-02-21 | 2006-08-24 | Chemometry Consultancy | Method and system for selection of calibration model dimensionality, and use of such a calibration model |
| US20150078989A1 (en) * | 2012-04-11 | 2015-03-19 | Johnson Matthey Public Limited Company | Zeolite catalyst containing metals |
| US10245582B2 (en) * | 2012-04-11 | 2019-04-02 | Johnson Matthey Public Limited Company | Zeolite catalyst containing metals |
| US20190224657A1 (en) * | 2014-10-13 | 2019-07-25 | Johnson Matthey Public Limited Company | Zeolite catalyst containing metals |
| US10807082B2 (en) * | 2014-10-13 | 2020-10-20 | Johnson Matthey Public Limited Company | Zeolite catalyst containing metals |
| WO2017021726A1 (en) * | 2015-08-04 | 2017-02-09 | Stratophase Ltd | Method and system for compensating perturbed measurements |
| CN109409350A (zh) * | 2018-10-23 | 2019-03-01 | 桂林理工大学 | 一种基于pca建模反馈式载荷加权的波长选择方法 |
Also Published As
| Publication number | Publication date |
|---|---|
| DE69031642D1 (de) | 1997-12-04 |
| US5568400A (en) | 1996-10-22 |
| EP0415401A3 (de) | 1994-02-02 |
| DE69031642T2 (de) | 1998-04-30 |
| EP0415401B1 (de) | 1997-10-29 |
Similar Documents
| Publication | Publication Date | Title |
|---|---|---|
| EP0415401B1 (de) | Verfahren und Gerät zur Verbesserung eines Multipliziersignals | |
| DE69129751T2 (de) | Messung von spektraldaten und korrektion | |
| Faber et al. | Propagation of measurement errors for the validation of predictions obtained by principal component regression and partial least squares | |
| Kowalski et al. | Recent developments in multivariate calibration | |
| US5121337A (en) | Method for correcting spectral data for data due to the spectral measurement process itself and estimating unknown property and/or composition data of a sample using such method | |
| US6711503B2 (en) | Hybrid least squares multivariate spectral analysis methods | |
| Bi et al. | A local pre-processing method for near-infrared spectra, combined with spectral segmentation and standard normal variate transformation | |
| Brown et al. | Derivative preprocessing and optimal corrections for baseline drift in multivariate calibration | |
| Rossel | ParLeS: Software for chemometric analysis of spectroscopic data | |
| US7620674B2 (en) | Method and apparatus for enhanced estimation of an analyte property through multiple region transformation | |
| WO2009038908A1 (en) | Calibrated analyte concentration measurements in mixtures | |
| Sun | Statistical analysis of NIR data: Data pretreatment | |
| JPH0582545B2 (de) | ||
| Vogt et al. | Fast principal component analysis of large data sets | |
| Miao et al. | Non-destructive determination of ginsenosides in ginseng by combined hyperspectral and X-ray techniques based on ensemble learning | |
| Nantongo et al. | Machine learning methods in near infrared spectroscopy for predicting sensory traits in sweetpotatoes | |
| Hadjiloucas et al. | Analysis of spectroscopic measurements of leaf water content at terahertz frequencies using linear transforms | |
| Boysworth et al. | Aspects of multivariate calibration applied to near-infrared spectroscopy | |
| Nørgaard | A multivariate chemometric approach to fluorescence spectroscopy | |
| Demir et al. | Multivariate calibration on designed mixtures of four pharmaceuticals | |
| US20250003868A1 (en) | Raman spectroscopy method and apparatus | |
| Visser et al. | An information-theoretic methodology for the resolution of pure component spectra without prior information using spectroscopic measurements | |
| EP1166060A1 (de) | Hybride kleinste-quadrat-verfahren zur multivariablen spektralanalyse | |
| Ni et al. | The relationship between net analyte signal/preprocessing and orthogonal signal correction algorithms | |
| Al-Mbaideen et al. | Frequency self deconvolution in the quantitative analysis of near infrared spectra |
Legal Events
| Date | Code | Title | Description |
|---|---|---|---|
| PUAI | Public reference made under article 153(3) epc to a published international application that has entered the european phase |
Free format text: ORIGINAL CODE: 0009012 |
|
| AK | Designated contracting states |
Kind code of ref document: A2 Designated state(s): CH DE DK FR GB IT LI NL SE |
|
| PUAL | Search report despatched |
Free format text: ORIGINAL CODE: 0009013 |
|
| AK | Designated contracting states |
Kind code of ref document: A3 Designated state(s): CH DE DK FR GB IT LI NL SE |
|
| 17P | Request for examination filed |
Effective date: 19940629 |
|
| 17Q | First examination report despatched |
Effective date: 19941117 |
|
| GRAG | Despatch of communication of intention to grant |
Free format text: ORIGINAL CODE: EPIDOS AGRA |
|
| GRAH | Despatch of communication of intention to grant a patent |
Free format text: ORIGINAL CODE: EPIDOS IGRA |
|
| GRAH | Despatch of communication of intention to grant a patent |
Free format text: ORIGINAL CODE: EPIDOS IGRA |
|
| GRAA | (expected) grant |
Free format text: ORIGINAL CODE: 0009210 |
|
| AK | Designated contracting states |
Kind code of ref document: B1 Designated state(s): CH DE DK FR GB IT LI NL SE |
|
| PG25 | Lapsed in a contracting state [announced via postgrant information from national office to epo] |
Ref country code: IT Free format text: LAPSE BECAUSE OF FAILURE TO SUBMIT A TRANSLATION OF THE DESCRIPTION OR TO PAY THE FEE WITHIN THE PRE;WARNING: LAPSES OF ITALIAN PATENTS WITH EFFECTIVE DATE BEFORE 2007 MAY HAVE OCCURRED AT ANY TIME BEFORE 2007. THE CORRECT EFFECTIVE DATE MAY BE DIFFERENT FROM THE ONE RECORDED.SCRIBED TIME-LIMIT Effective date: 19971029 Ref country code: DK Free format text: LAPSE BECAUSE OF NON-PAYMENT OF DUE FEES Effective date: 19971029 Ref country code: NL Free format text: LAPSE BECAUSE OF FAILURE TO SUBMIT A TRANSLATION OF THE DESCRIPTION OR TO PAY THE FEE WITHIN THE PRESCRIBED TIME-LIMIT Effective date: 19971029 Ref country code: LI Free format text: LAPSE BECAUSE OF FAILURE TO SUBMIT A TRANSLATION OF THE DESCRIPTION OR TO PAY THE FEE WITHIN THE PRESCRIBED TIME-LIMIT Effective date: 19971029 Ref country code: CH Free format text: LAPSE BECAUSE OF FAILURE TO SUBMIT A TRANSLATION OF THE DESCRIPTION OR TO PAY THE FEE WITHIN THE PRESCRIBED TIME-LIMIT Effective date: 19971029 |
|
| REG | Reference to a national code |
Ref country code: CH Ref legal event code: EP |
|
| REF | Corresponds to: |
Ref document number: 69031642 Country of ref document: DE Date of ref document: 19971204 |
|
| PG25 | Lapsed in a contracting state [announced via postgrant information from national office to epo] |
Ref country code: SE Effective date: 19980129 |
|
| ET | Fr: translation filed | ||
| NLV1 | Nl: lapsed or annulled due to failure to fulfill the requirements of art. 29p and 29m of the patents act | ||
| REG | Reference to a national code |
Ref country code: CH Ref legal event code: PL |
|
| PLBE | No opposition filed within time limit |
Free format text: ORIGINAL CODE: 0009261 |
|
| STAA | Information on the status of an ep patent application or granted ep patent |
Free format text: STATUS: NO OPPOSITION FILED WITHIN TIME LIMIT |
|
| 26N | No opposition filed | ||
| REG | Reference to a national code |
Ref country code: GB Ref legal event code: IF02 |
|
| PGFP | Annual fee paid to national office [announced via postgrant information from national office to epo] |
Ref country code: FR Payment date: 20090817 Year of fee payment: 20 |
|
| PGFP | Annual fee paid to national office [announced via postgrant information from national office to epo] |
Ref country code: GB Payment date: 20090825 Year of fee payment: 20 |
|
| PGFP | Annual fee paid to national office [announced via postgrant information from national office to epo] |
Ref country code: DE Payment date: 20090827 Year of fee payment: 20 |
|
| REG | Reference to a national code |
Ref country code: GB Ref legal event code: PE20 Expiry date: 20100829 |
|
| PG25 | Lapsed in a contracting state [announced via postgrant information from national office to epo] |
Ref country code: GB Free format text: LAPSE BECAUSE OF EXPIRATION OF PROTECTION Effective date: 20100829 |
|
| PG25 | Lapsed in a contracting state [announced via postgrant information from national office to epo] |
Ref country code: DE Free format text: LAPSE BECAUSE OF EXPIRATION OF PROTECTION Effective date: 20100830 |