EP0359681B1 - Characterization of particles by modulated dynamic light scattering - Google Patents
Characterization of particles by modulated dynamic light scattering Download PDFInfo
- Publication number
- EP0359681B1 EP0359681B1 EP89420335A EP89420335A EP0359681B1 EP 0359681 B1 EP0359681 B1 EP 0359681B1 EP 89420335 A EP89420335 A EP 89420335A EP 89420335 A EP89420335 A EP 89420335A EP 0359681 B1 EP0359681 B1 EP 0359681B1
- Authority
- EP
- European Patent Office
- Prior art keywords
- particle
- light
- scattered
- values
- signal
- Prior art date
- Legal status (The legal status is an assumption and is not a legal conclusion. Google has not performed a legal analysis and makes no representation as to the accuracy of the status listed.)
- Expired - Lifetime
Links
- 239000002245 particle Substances 0.000 title claims description 219
- 238000002296 dynamic light scattering Methods 0.000 title description 11
- 238000012512 characterization method Methods 0.000 title 1
- 238000000034 method Methods 0.000 claims description 41
- 238000006073 displacement reaction Methods 0.000 claims description 32
- 238000005286 illumination Methods 0.000 claims description 28
- 238000012545 processing Methods 0.000 claims description 25
- 239000012530 fluid Substances 0.000 claims description 21
- 238000005259 measurement Methods 0.000 claims description 17
- 238000005311 autocorrelation function Methods 0.000 claims description 8
- 230000005855 radiation Effects 0.000 claims description 7
- 239000000126 substance Substances 0.000 claims description 5
- 238000001069 Raman spectroscopy Methods 0.000 claims description 4
- 230000003287 optical effect Effects 0.000 claims description 4
- 239000000203 mixture Substances 0.000 claims description 3
- 230000001427 coherent effect Effects 0.000 claims description 2
- 230000005670 electromagnetic radiation Effects 0.000 claims 6
- 238000004611 spectroscopical analysis Methods 0.000 claims 1
- 230000010287 polarization Effects 0.000 description 19
- 238000005314 correlation function Methods 0.000 description 18
- 239000003550 marker Substances 0.000 description 13
- 238000000149 argon plasma sintering Methods 0.000 description 10
- 230000014509 gene expression Effects 0.000 description 10
- 238000004458 analytical method Methods 0.000 description 9
- 238000009826 distribution Methods 0.000 description 9
- 239000013598 vector Substances 0.000 description 9
- 239000000725 suspension Substances 0.000 description 8
- 230000001419 dependent effect Effects 0.000 description 6
- 238000010586 diagram Methods 0.000 description 6
- 238000013519 translation Methods 0.000 description 6
- 230000014616 translation Effects 0.000 description 6
- 238000000605 extraction Methods 0.000 description 5
- 230000033001 locomotion Effects 0.000 description 5
- 239000012798 spherical particle Substances 0.000 description 5
- 230000007704 transition Effects 0.000 description 4
- 230000001066 destructive effect Effects 0.000 description 3
- 230000005684 electric field Effects 0.000 description 3
- 230000007935 neutral effect Effects 0.000 description 3
- 230000000737 periodic effect Effects 0.000 description 3
- 238000000926 separation method Methods 0.000 description 3
- 238000003860 storage Methods 0.000 description 3
- 230000002238 attenuated effect Effects 0.000 description 2
- 238000004590 computer program Methods 0.000 description 2
- 238000009792 diffusion process Methods 0.000 description 2
- 230000005686 electrostatic field Effects 0.000 description 2
- 230000000670 limiting effect Effects 0.000 description 2
- 239000007788 liquid Substances 0.000 description 2
- 230000008569 process Effects 0.000 description 2
- 238000001370 static light scattering Methods 0.000 description 2
- 238000012731 temporal analysis Methods 0.000 description 2
- 238000000700 time series analysis Methods 0.000 description 2
- 241000894006 Bacteria Species 0.000 description 1
- 230000005653 Brownian motion process Effects 0.000 description 1
- 238000004566 IR spectroscopy Methods 0.000 description 1
- 241000700605 Viruses Species 0.000 description 1
- 230000002730 additional effect Effects 0.000 description 1
- 239000012620 biological material Substances 0.000 description 1
- 238000005537 brownian motion Methods 0.000 description 1
- 238000004364 calculation method Methods 0.000 description 1
- 239000003990 capacitor Substances 0.000 description 1
- 230000000052 comparative effect Effects 0.000 description 1
- 238000007405 data analysis Methods 0.000 description 1
- 238000013461 design Methods 0.000 description 1
- 238000001514 detection method Methods 0.000 description 1
- 238000005315 distribution function Methods 0.000 description 1
- 230000005672 electromagnetic field Effects 0.000 description 1
- 238000011156 evaluation Methods 0.000 description 1
- 238000001914 filtration Methods 0.000 description 1
- 238000012623 in vivo measurement Methods 0.000 description 1
- 238000011065 in-situ storage Methods 0.000 description 1
- 230000002452 interceptive effect Effects 0.000 description 1
- 238000002955 isolation Methods 0.000 description 1
- 238000004519 manufacturing process Methods 0.000 description 1
- 238000002360 preparation method Methods 0.000 description 1
- 238000003672 processing method Methods 0.000 description 1
- 238000005215 recombination Methods 0.000 description 1
- 230000006798 recombination Effects 0.000 description 1
- 230000002829 reductive effect Effects 0.000 description 1
- 238000009877 rendering Methods 0.000 description 1
- 230000004044 response Effects 0.000 description 1
- 238000004062 sedimentation Methods 0.000 description 1
- 239000007787 solid Substances 0.000 description 1
- 238000006467 substitution reaction Methods 0.000 description 1
Images


Classifications
-
- G—PHYSICS
- G01—MEASURING; TESTING
- G01N—INVESTIGATING OR ANALYSING MATERIALS BY DETERMINING THEIR CHEMICAL OR PHYSICAL PROPERTIES
- G01N15/00—Investigating characteristics of particles; Investigating permeability, pore-volume or surface-area of porous materials
- G01N15/02—Investigating particle size or size distribution
- G01N15/0205—Investigating particle size or size distribution by optical means
-
- G—PHYSICS
- G01—MEASURING; TESTING
- G01J—MEASUREMENT OF INTENSITY, VELOCITY, SPECTRAL CONTENT, POLARISATION, PHASE OR PULSE CHARACTERISTICS OF INFRARED, VISIBLE OR ULTRAVIOLET LIGHT; COLORIMETRY; RADIATION PYROMETRY
- G01J3/00—Spectrometry; Spectrophotometry; Monochromators; Measuring colours
- G01J3/28—Investigating the spectrum
- G01J3/44—Raman spectrometry; Scattering spectrometry ; Fluorescence spectrometry
- G01J3/4412—Scattering spectrometry
-
- G—PHYSICS
- G01—MEASURING; TESTING
- G01N—INVESTIGATING OR ANALYSING MATERIALS BY DETERMINING THEIR CHEMICAL OR PHYSICAL PROPERTIES
- G01N15/00—Investigating characteristics of particles; Investigating permeability, pore-volume or surface-area of porous materials
- G01N15/02—Investigating particle size or size distribution
- G01N15/0205—Investigating particle size or size distribution by optical means
- G01N15/0211—Investigating a scatter or diffraction pattern
- G01N2015/0222—Investigating a scatter or diffraction pattern from dynamic light scattering, e.g. photon correlation spectroscopy
-
- G—PHYSICS
- G01—MEASURING; TESTING
- G01N—INVESTIGATING OR ANALYSING MATERIALS BY DETERMINING THEIR CHEMICAL OR PHYSICAL PROPERTIES
- G01N15/00—Investigating characteristics of particles; Investigating permeability, pore-volume or surface-area of porous materials
- G01N15/10—Investigating individual particles
- G01N15/14—Optical investigation techniques, e.g. flow cytometry
- G01N15/1434—Optical arrangements
- G01N2015/1447—Spatial selection
- G01N2015/145—Spatial selection by pattern of light, e.g. fringe pattern
Definitions
- the present invention is directed to methods and apparatuses for determining several property values of at least one particle by utilizing the light or other radiation signal scattered from a particle in an intensity modulated illumination field or by utilizing the modulated scattered signal from at least one particle in a field of uniform illumination.
- Measurement of molecules and particles (simply denoted particles hereafter) by light scattering methods is frequently preferred over other methods because light scattering provides the advantages of convenient, fast, sensitive, non-destructive, in situ or even in vivo measurement.
- SLS static light scattering
- the inference of particle properties from static light scattering (SLS) signals can be extremely complex, depending strongly on particle index, size, shape and homogeneity, properties which are not generally known a priori .
- Measurement of particles by dynamic light scattering (DLS) techniques retains the advantages listed above while eliminating complexity in inferring properties including particle size and shape, since these inferences do not require detailed knowledge of the optical properties of the particles.
- DLS techniques One strength of DLS techniques is their ability to measure a weighted mean value of a dynamic particle property (translational or rotational diffusion coefficient, electrophoretic mobility, . . .) for a suspension of particles.
- this strength is sometimes a liability as the weighted mean value accessible is frequently not the one of interest and, except in special cases, the latter cannot be obtained from the former because these methods do not provide the distribution of particles over any property.
- a number of moments of the distribution or the mean value of a number of properties of the suspension could be calculated.
- PCS photon correlation spectroscopy
- Equation (1) measured autocorrelation functions together with Equation (1) can be used to provide estimates of F( ⁇ ) which can be transformed into a size or other distribution function.
- precise extraction of A( ⁇ )F( ⁇ ) from Equation (1) is not trivial since this Fredholm integral equation of the first kind has the property that the A( ⁇ )F( ⁇ ) extracted is very sensitive to noise in C( ⁇ ).
- A( ⁇ ) is strongly dependent on particle size, the signal from any suspension of particles having significant breadth in its size distribution will be dominated by the signal from the fraction of particles having large A( ⁇ ) while the remaining particles contribute only slightly to C( ⁇ ).
- C( ⁇ ) dependence on other properties such as particle shape can also contribute to the imprecision with which a one-dimensional distribution can be determined since such dependence can lead to (apparent) noise in C( ⁇ ) and to the non-uniform weighting of A( ⁇ )F( ⁇ ) in Equation (1).
- the method of the present invention involves modulated dynamic light scattering (MDLS).
- MDLS modulated dynamic light scattering
- a suspension of particles may be precisely characterized by individual measurement of many particles which provides precise distributions over one or more particles properties, singly or jointly.
- This strategy removes the limitations on precision associated with the inversion of a Fredholm integral equation, the simultaneous measurement of strong and weak signals and the measurement of particles distributed in an undetermined manner over additional properties.
- the methodology introduces its own limitations, namely, the longer time required to individually measure a large number of particles and the inability to measure particles that are too small to be individually detected.
- the MDLS method will often provide more complete and precise information.
- the method and apparatus of the present invention operates upon the signal, such as an electrical signal, derived from a suitable sensor that is positioned and oriented to detect the scattered signal from at least one particle illuminated by an acoustic or electromagnetic field suitably modulated such that the illumination intensity varies periodically in both time and space over a volume within which the particle(s) is measured.
- the signal such as an electrical signal
- a suitable sensor that is positioned and oriented to detect the scattered signal from at least one particle illuminated by an acoustic or electromagnetic field suitably modulated such that the illumination intensity varies periodically in both time and space over a volume within which the particle(s) is measured.
- the electrical signal is measured in time to obtain the time history of the signal or the sequence of time intervals at which some feature of the signal recurs or is processed to obtain the autocorrelation or other function of the signal in order to capture information in the frequency and amplitude modulation of the signal due to the translational and rotational motions of the particle(s).
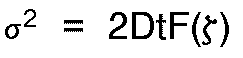
- the information so captured is used together with an appropriate analytical expression or analytical method to determine the mean square displacement ( ⁇ 2) of the particle in one dimension and the mean square rotations ( ⁇ r 2s) of the particle about at least one of three mutually perpendicular axes through the particle as it depends on the delay time interval ⁇ . Since the ⁇ 2 history depends on the time average value of the particle friction coefficient and, under certain conditions to be described below, the particle mass, the measured ⁇ 2 history can be used to determine the particle friction coefficient and/or the particle mass.
- the measured ⁇ r 2 histories can be used to determine the particle rotational friction coefficients and/or mass moments of inertia about the three axes.
- a shape category of the particle is readily determined from the general form of the measured or processed signal such that the particle can be classified as to its general shape category, for example, spherical, slightly non-spherical, highly non-spherical, axisymmetric or non-axisymmetric.
- Particle velocity is determined in the MDLS methods and apparatuses as well as the above mentioned properties. Measurement of particle or suspending fluid velocity is in itself a useful ability. Moreover, when an electrostatic field of known strength is imposed on the particle, the electrostatic charge and charge to mass ratio of the particle are determined.
- Illustrated in Figure 1A is an MDLS device 10A which is used to illuminate at least one particle and to capture and/or process the scattered light signal history used to determine values of the particle properties.
- the apparatus utilizes a one component light beam A consisting of a single color and single polarization, generated by a laser 12 that is intensity attenuated by means of a neutral density filter 14 and split into two beams 1 and 2 by a beamsplitter 16.
- Beam 1 passes through a Bragg cell 20 which frequency shifts the beam by F0, where F0 is typically 40 MHz.
- Beam 2 is reflected by a reflector 18 through a Bragg cell 21 wherein it is frequency shifted by F0+ ⁇ F, where
- Beam 2 is then redirected by reflector 22 through lens 23 and polarizer 24, to insure purity of the single beam component.
- From the polarizer beam 2 is directed by reflector 26 through the window 26A and through the center of sample chamber 40 containing at least one particle a liquid or gas suspension fluid to a light trap 32.
- beam 1 is reflected off reflector 28 and directed through lens 29 and polarizer 30, to insure purity of the single beam component.
- Beam 1 is then directed by reflector 31 through the window 31A to intersect beam 2 at the center of the sample chamber 40.
- a light trap 34 is positioned to trap beam 1 at the far side of the sample chamber. The beams intersect at angle ⁇ which is bisected by an axis Z.
- Perpendicular to axis Z is an X labelled axis.
- a lens 36 is positioned with its center on the Z axis to focus forward scattered light from at least one particle within the intersection volume of beams 1 and 2 onto photomultiplier tube (PMT) 42.
- a polarizer 37 typically passing light having the polarization angle of the original beams A, 1, and 2, is inserted in the beam path to insure purity of the light component detected.
- a mask 38 is interposed in the beam path centered on the Z axis to remove defocused light.
- the lens 36 and the PMT 42 are also centered on axis Z.
- Signal storage and processing equipment 43 receives, as an input, the electrical signals from PMT 42 and performs storage of the signal history and signal processing methodologies on the received signals by signal processing equipment 43 and 60 to provide output data S0(t) and S(t) relating to the characteristics of the particle illuminated in the intersection volume contained at the center of chamber 40.
- Figure 1B illustrates an MDLS device 10B which is used to illuminate at least one particle with light containing two components in each of two beams that are combined in the intersection volume at the center of chamber 40 to form the independently modulated fringe patterns, one from each component.
- Light beam A from laser 12 passes through a half-wave plate 13 which can be rotated to fix the direction of polarization of light in beam A′ in order to divide substantially equally the light in beams 3 and 4.
- Light in beam A′ is intensity attenuated by neutral density filter 14 and split into beams 1 and 2 by beamsplitter 16. Both beams 1 and 2 contain two components, namely, light having vertical and horizontal polarization.
- Beam 1, containing substantially half the power of beam A′, is directed by beamsplitter 16 through a Bragg cell 20 which frequency shifts by F0 both components of beam 1.
- beam 1 After passing through Bragg cell 20 beam 1 is directed by reflector 28 through lens 29 (optional) and onto reflector 31 which directs beam 1 through window 31A into the center of sample chamber 40.
- Beam 1 then passes through the center of chamber 40 and is trapped in a light trap 34 at the far side of chamber 40.
- Beam 2 is separated into the two beams 3 and 4 each having only one component (polarization) by polarizing beamsplitter 18A.
- Beam 3 containing the horizontally polarized component of beam 2 is directed by reflector 18 through a neutral density filter 15 (optional) used to adjust the intensity balance between beams 3 and 4 upon their recombination as beam 5 and to reflector 22 and to polarizer 20A (optional) to insure purity of the horizontally polarized light component of beam 3.
- Beam 4 containing the vertically polarized light component of beam 2 is directed by polarizing beamsplitter 18A through Bragg cell 21 which frequency shifts the beam F0+ ⁇ F. Beam 4 next passes through polarizer 21A to insure purity of the vertically polarized light component of beam 4.
- Beam 3 and beam 4 are recombined into beam 5 by polarizing beamsplitter 19 such that beam 5 contains two components of substantially equal intensity, namely, the horizontally polarized light component of beam 3 that is not frequency shifted and the vertically polarized light component of beam 4 that is frequency shifted by F0+ ⁇ F.
- Beam 5 is next passed through lens 23 (optional) and onto reflector 26 which directs beam 5 through window 26A through the center of sample chamber 40 and into light trap 32.
- Beams 1 and 5 intersect at the center of chamber 40 with intersection angle ⁇ which is bisected by an axis Z. Perpendicular to axis Z is an axis labelled X.
- a lens 36 is positioned on the Z axis to focus scattered light from any particle in the intersection volume of beams 1 and 5 onto photomultiplier tube (PMT) 42.
- Mask 38 is positioned intermediate between the lens 36 and the PMT 42 to prevent undesired stray light from reaching PMT 42.
- Electronic and signal processing equipment 43 receives, as an input, the electrical signals from PMT 42 and performs electronic filtering, signal storage and signal processing methodologies on the signal received from PMT 42.
- the signal from PMT 42 contains one signal component due to the horizontally polarized light components of beams 1 and 5 and therefore contains this signal component at the modulation or bias frequency F0.
- the low frequency signal component is proportional to the product of the instantaneous illumination intensity and the light scattering cross-section of the particle, the former quantity being particle displacement dependent while the latter is particle orientation dependent.
- the ratio of the low frequency signal component and the high frequency signal component thus provides a signal that depends only on particle location and is independent of particle orientation.
- Output data relating to location dependent properties of the particle such as the translational friction coefficient of the particle in the suspending fluid and the particle mass can be extracted directly from this ratio of low and high frequency signal components provided by signal processing equipment 60 without extensive and complex analysis.
- output data relating to orientation dependent properties of the particle can be extracted directly from the high frequency signal component.
- FIG 1C an apparatus 10C similar in function to that of Figure 1B is illustrated.
- the apparatus of Figure 1C is identical to that of Figure 1B in its components and their functions with the exception of components 39, 42A, 42B, 43A, 43B and output signals S1(t) and S2(t), which components and their functions are here described.
- the apparatus of Figure 1C separates these two signal components optically by use of a polarizing beamsplitter 39.
- Scattered light signal containing the two components (polarizations) and passing through mask 38 of Figure 1C is separated into two beams 39A and 39B which substantially contain, respectively, the horizontally and vertically polarized light scattered from the particle in the intersection volume at the center of sample chamber 40.
- One component of this scattered light signal, the horizontally polarized component beam 39A which is the component modulated at high frequency F0, is detected by PMT 42A which provides in response an electrical output signal captured or processed by signal processing equipment 43A to provide data output signal S1(t).
- Signal processing equipment includes means for providing the time averaged mean signal over an interval which is long compared to the period 1/F0 but short compared to the much longer period 1/ ⁇ F.
- the electrical signal S1(t) is proportional to the product of the local time averaged intensity and the instantaneous value of the light scattering cross-section of the particle which cross-section may vary substantially over time intervals >> 1/F0 due to random Brownian rotations of the particle.
- the second component of the scattered light signal from the particle in the intersection volume at the center of chamber 40, the vertically polarized component beam 39B which is the component modulated at the much lower frequency ⁇ F, is detected by PMT 42B which provides an electrical output signal captured or processed by signal processing equipment 43B to provide data output signal S2(t).
- output signal S2(t) is proportional to the product of the light scattering cross-section of the particle and the instantaneous illumination intensity which depends on the instantaneous particle displacement in the x-direction.
- the ratio S2(t)/S1(t) at time t obtained by use of signal processing equipment 60 depends only on particle displacement x at time t.
- Figure 2A illustrates in a cross-sectional view the local intensity of one component (polarization) versus x-direction displacement within the intersection volume of the two beams at the center of chamber 40 at one instant in time.
- the amplitude I is shown varying between a maximum value of I p and a minimum value of I v .
- the intersection of beams 1 and 2 in Figure 1A establishes one interference fringe pattern or beams 1 and 5 in Figures 1B and 1C establishes two superimposed interference fringe patterns of alternate, parallel planes of high intensity I p separated by planes of low intensity I v throughout the central portion of the intersection volume.
- the MDLS device contains light beams having two components, two such intensity fields are superimposed since, for example, light having a horizontal electric field vector (polarization) does not interfere with light having a vertical electric field vector (polarization).
- the polarization vectors of the two beams are not aligned because the beams are inclined by angle ⁇ .
- the intensity field fringe pattern has a larger value of the minimum intensity I v while the maximum intensity I p may be unchanged.
- a high frequency pass filter receiving the electrical signal from the detector (PMT) 42 removes the signal component due to the background illumination intensity I v passing only the fluctuating signal component.
- the polarization vectors are always aligned and the background illumination intensity, I v , is small. Vertical polarization thus gives the largest intensity modulation.
- a particle 50 moves, for example, by random Brownian translations over an example trajectory 52.
- particles are introduced into the sample chamber 40 at sufficiently low concentration so that a particle is located in the intersection volume no more than 10 percent of the time. Only rarely then will more than one particle occupy the intersection volume, resulting in negligible coincidence errors.
- particles are introduced at much higher concentration so that many are simultaneously in the intersection volume. In this case the properties measured are weighted mean values.
- PMT detector
- the signal When the PMT signal indicates the presence of a particle in the intersection volume (exceeds a threshold value), the signal is captured, stored or processed.
- a digital correlator can be used to accumulate the correlation function of the PMT (scattered light) signal until the particle leaves the intersection volume the (PMT signal falls below the threshold value).
- the measured autocorrelation function for each particle is stored and processed later or processed on-line to extract the property values of interest from which precise distributions can be determined.
- Example computer programs for extraction of some property values are given in Appendices B, C and D.
- output signal S0(t) of device 10A is functionally equivalent to S(t) and the methods utilized to extract property values and other information from S(t) can also be used to extract property values and other information from S0(t). Accordingly, the output signal S0(t) from the apparatus of Figure 1A can be coupled into a sensor circuit of equipment 60 and the following description then applies equally to the output of equipment 60 from apparatus 10A, 10B and 10C.
- FIG 4 are illustrated some of the components of signal processing equipment 60.
- the signals S1(t) and S2(t) are applied to a divider 62.
- the marker signals generated by detector 64 are transmitted to a processor 66 which determines the time intervals between selected marker signals (nearest neighbor, second nearest neighbors, . . .) and provides the sequence of these interval values as digitized quantities on the output data line of processor 66.
- the sensor circuit detects when the a.c. component of S(t) crosses the zero level with positive slope and generates an electrical marker signal at each such crossing. These marker signals thus occur at the time values at which the a.c. component of the illumination intensity given by Equation (2) is zero with positive slope.
- O cos[ ⁇ (t0+ ⁇ t) - K(x0+ ⁇ x)].
- a time series analysis of the signal S(t) to obtain at least one property of particle 50 can be performed as follows.
- the sequence of n measured time intervals ⁇ t between marker signals is used with Equation (5) to obtain the corresponding displacements ⁇ x.
- a time series analysis methodology like the one illustrated above will be adequate when the noise contained in the signal S(t) is relatively low, as occurs for large particles with large light scattering cross-sections.
- other methods which employ, for example, one or more signal processing techniques which allow clean extraction of signals buried deeply in noise.
- An example of such an autocorrelation function as measured with device 10A is shown in Figure 5.
- the same methods can be used to determine at least one property of the particle 50 in chamber 40 by use of the autocorrelation function of the signal S(t) obtained using the device 10D of Figure 6 which device will be described hereinafter.
- the autocorrelation function (or simply correlation function hereafter) is formed by use of a correlator, to which the signal S(t) is transmitted. It remains, however, to show how the correlation function depends on the properties of particle 50 and, therefore, how the correlation function can be used to obtain at least one property of particle 50.
- I n (t) 1 + ⁇ (t) where ⁇ (t) is the relative fluctuation of I n (t) at time t.
- To determine C( ⁇ ) it remains only to determine ⁇ (t) ⁇ (t+ ⁇ ) ⁇ . This time average is readily determined by calculating the ensemble average in place of the time average, since the two are equivalent.
- V p constant average velocity
- the correlation function is thus given by the ensemble average where p(x, ⁇ ;x0) is the transition probability, i.e., the probability density that a particle is located at x at time ⁇ when it began at location x0 at time zero.
- Evaluation of the integrals (15) gives the desired correlation function C( ⁇ ) ⁇ 2[1 + ⁇ 2/2 exp(-K2 ⁇ 2/2) cos( ⁇ )]
- Determination of C( ⁇ ) by use of a correlator together with the analytical expression (17) allows extraction of ⁇ 2 at each of several values of delay time ⁇ by suitable data analysis methods, such as least-squares fitting of Equation (17) to the measured C( ⁇ ).
- a least-squares or other fit of the measured C( ⁇ ) to Equation (17) can be used to determine D, D and ⁇ or m directly as in the example computer programs of Appendices B, C and D.
- the dynamic mass range which can be measured, or the ratio of maximum to minimum m, is obtained directly from Equation (19a) as (N/N1)2ln(1/ ⁇ 2)/ln(1/ ⁇ 1) .
- Equation (19b) allows the selection of operating parameters which provide measurement of the particle property values f and m in their desired ranges and the calculation of the dynamic range in one property given a specified dynamic range of the other.
- Equations (18a) and (18b) require K2kTN1 ⁇ /ln(1/ ⁇ 2) ⁇ f ⁇ K2kTN ⁇ /ln(1/ ⁇ 1) from which the dynamic range in f is (N/N1)ln(1/ ⁇ 2)/ln(1/ ⁇ 1) .
- the dynamic range in f is 1,246.
- An example analysis of the correlation function of signal S1(t) of device 10B, 10C, 10D or of signal S0(t) of device 10A, when the time variations of S0(t) are dominated by rotational motion of particle 50, provides information about particle properties related to particle rotation. Similar to the example analysis above for the signal S(t), fluctuations in time of this signal due, for example, to Brownian rotations of an axisymmetric particle 50 about three mutually perpendicular axes of the signal S1(t) or S0(t), subject to the stated conditions for S0(t), gives an analytical expression for the rotational correlation function having the form where the coefficients c j are constants for any one particle and can be determined empirically.
- f r is the rotational friction coefficient of particle 50 for rotation about its axis normal to the symmetry axis and I m is the mass moment of inertia of the particle about the same axis of rotation.
- the particle properties D r and I m can be determined from the measured correlation function C r ( ⁇ ).
- ⁇ r ⁇ must fall in the range 0.1 ⁇ r ⁇ 100. For ⁇ r ⁇ 0.1 only I m can be determined and for ⁇ r ⁇ >>1 only D r .
- the comparative forms of the measured rotational correlation function C r ( ⁇ ) and the translational correlation function C( ⁇ ) reveal a general shape category of the particle. Based on results observed for many particle shapes it has been determined that the relative rate of decay of C r ( ⁇ ) is zero for spherical particles, is small for slightly non-spherical particles, moderate for non-spherical particles and large for highly non-spherical particles, where the relative rate of decay in C r ( ⁇ ) is determined by comparison to that of C( ⁇ ) for translational motion.
- C r ( ⁇ ) analysis of C r ( ⁇ ) can provide information regarding the symmetry of a particle. If the particle is axisymmetric C r ( ⁇ ) can be well fitted by an expression having the form of (18) with ⁇ r 2 given by a single set of f r and I m . When the particle is not axisymmetric, two or three sets of f r and I m are required for an adequate fit. Precise data is generally required for such symmetry analysis.
- MDLS device 10D consisting of light or other electromagnetic illumination source 12 which can be, for example, a laser or incandescent light source which generates illumination beam A which passes through window 26A into a sample chamber 40, through the center of chamber 40 and into light trap apparatus 32 at the far side of chamber 40.
- illumination beam A which passes through window 26A into a sample chamber 40, through the center of chamber 40 and into light trap apparatus 32 at the far side of chamber 40.
- a scattered illumination beam B is generated.
- the beam B exits chamber 40 through a window 26B, passes through a spatial filter device consisting, for example, of lens 36 and mask 38A having a small aperture near the image plane of the center of chamber 40, through lens 36A, and into into beamsplitter 16.
- Beam C continues through a modulator device 35 consisting, for example, of a finely lined beam chopper disk 35A driven by a motor 35B, onto detector device 42B which may consist of a photomultiplier tube (PMT) which serves to transform the incident scattered illumination signal of modulated beam C′ into electrical signal SB(t).
- PMT photomultiplier tube
- particle 50 displaces due, for example, to random Brownian translations, the location of the image of particle 50 in the plane of beam chopper 35A displaces a corresponding amount, magnified by a magnification M, the magnification in the image plane coincident with chopper 35A due to the optical components of the device.
- the image of particle 50 in the image plane located at beam chopper 35A displaces the distance Mx(t), also normal to the plane of Figure 6 which is the direction of the tangential motion of beam chopper 35A.
- Modulator device 35 transforms beam C to modulated beam C′ by imposing a time and x-direction displacement periodic modulation on the intensity of beam C.
- beam chopper 35A When beam chopper 35A is utilized, for example, the scattered illumination of beam C is focused to an image point in the plane of beam chopper 35A and the modulation is imposed by alternately transmitting through and stopping the beam as the transparent and opaque regions associated with each line of the beam chopper traverse the image point location, respectively.
- the intensity of scattered illumination in beam C′ is modulated periodically in both time t and displacement x(t).
- Table 2 shows example values of ⁇ F for selected values of N r and RPM.
- Beam chopping at sufficiently large radial location on the rotating chopper is preferred so that displacements in the object plane over the field of view allowed by mask 38A result in negligible relative changes in the radial location of the image of particle 50 on the chopper and so that the width of the lines is larger than the image spot size to insure good signal visibility and displacement resolution.
- signal S1(t) is proportional to the product of the instantaneous value of the scattering cross-section of particle 50 and the incident illumination, while signal S2(t) is proportional to this product and also depends on the particle location x(t).
- the ratio S(t) thus depends only on x(t) and can be used to obtain values of the properties of particle 50 that influence x(t), including the particle mass, translational friction coefficient and velocity component in the x-direction, and information that derives therefrom.
- C( ⁇ ) can be determined. Comparison of measured and calculated values of C( ⁇ ) for particles undergoing random Brownian translations, for example, provide values of the translational friction coefficient, mass and x-direction velocity of the particle(s), as illustrated above.
- g( ⁇ t) I0[1 + ⁇ cos( ⁇ )] , with I0 a constant, the resulting C( ⁇ ) is identical to that given above in Equation (17).
- the local fluid velocity is determined by the value of V p .
- the device 10D can thus be used to determine the x-direction velocity of a fluid or of at least one particle suspended therein.
- Information pertaining to chemical composition as obtained by a number of analytical techniques can also be incorporated into the data base for each particle.
- the light (or other radiation) scattered, transmitted or emitted by the illuminated particle can be used with techniques including emission, Raman, ultraviolet, visible and infrared spectroscopies.
- Particles such as cells, bacteria, viruses and spores or portions thereof can also be stained to provide a flurorescence signal indicative of a chemical or a biological material. Since flurorescent decay is typically quite fast the detector can monitor the fluctuations in S(t) due to particle translations and rotations by observation of this signal.
- Scattered light at a zero scattering angle is isolated from incident illumination in the crossed beam MDLS device by the different directions of the incident and scattered beams and by isolating the a.c. component of the scattered light signal senses to eliminate d.c. components which may be due to non-zero scattering light. Additionally, observation of the forward scattered or emitted light isolated from incident illumination can be used to obtain signals having improved location resolution and signal-to-noise ratios for certain measurements such as light scattering from small particles.
Landscapes
- Chemical & Material Sciences (AREA)
- Dispersion Chemistry (AREA)
- Physics & Mathematics (AREA)
- Health & Medical Sciences (AREA)
- Life Sciences & Earth Sciences (AREA)
- Analytical Chemistry (AREA)
- Biochemistry (AREA)
- General Health & Medical Sciences (AREA)
- General Physics & Mathematics (AREA)
- Immunology (AREA)
- Pathology (AREA)
- Investigating Or Analysing Materials By Optical Means (AREA)
Description
- The present invention is directed to methods and apparatuses for determining several property values of at least one particle by utilizing the light or other radiation signal scattered from a particle in an intensity modulated illumination field or by utilizing the modulated scattered signal from at least one particle in a field of uniform illumination.
- Measurement of molecules and particles (simply denoted particles hereafter) by light scattering methods is frequently preferred over other methods because light scattering provides the advantages of convenient, fast, sensitive, non-destructive, in situ or even in vivo measurement. However, the inference of particle properties from static light scattering (SLS) signals can be extremely complex, depending strongly on particle index, size, shape and homogeneity, properties which are not generally known a priori. Measurement of particles by dynamic light scattering (DLS) techniques retains the advantages listed above while eliminating complexity in inferring properties including particle size and shape, since these inferences do not require detailed knowledge of the optical properties of the particles.
- One strength of DLS techniques is their ability to measure a weighted mean value of a dynamic particle property (translational or rotational diffusion coefficient, electrophoretic mobility, . . .) for a suspension of particles. However, this strength is sometimes a liability as the weighted mean value accessible is frequently not the one of interest and, except in special cases, the latter cannot be obtained from the former because these methods do not provide the distribution of particles over any property. Were a distribution provided, a number of moments of the distribution or the mean value of a number of properties of the suspension could be calculated.
- Consider photon correlation spectroscopy (PCS) as an example of a DLS method. A PCS measurement of a suspension of spherical particles illuminated by a coherent light source provides, after some manipulation, the autocorrelation function of the electric field of the light signal scattered from the suspension. This function has the form of the Laplace transform of the product A(Γ)F(Γ)

where τ is the delay time,


- In principle, measured autocorrelation functions together with Equation (1) can be used to provide estimates of F(Γ) which can be transformed into a size or other distribution function. However, precise extraction of A(Γ)F(Γ) from Equation (1) is not trivial since this Fredholm integral equation of the first kind has the property that the A(Γ)F(Γ) extracted is very sensitive to noise in C(τ). Moreover, because A(Γ) is strongly dependent on particle size, the signal from any suspension of particles having significant breadth in its size distribution will be dominated by the signal from the fraction of particles having large A(Γ) while the remaining particles contribute only slightly to C(τ). Finally, C(τ) dependence on other properties such as particle shape can also contribute to the imprecision with which a one-dimensional distribution can be determined since such dependence can lead to (apparent) noise in C(τ) and to the non-uniform weighting of A(Γ)F(Γ) in Equation (1).
- Because of these fundamental limitations in the PCS method in particular and in many DLS methods in general, improved methods are perused. The method of the present invention involves modulated dynamic light scattering (MDLS). In this method, a suspension of particles may be precisely characterized by individual measurement of many particles which provides precise distributions over one or more particles properties, singly or jointly. This strategy removes the limitations on precision associated with the inversion of a Fredholm integral equation, the simultaneous measurement of strong and weak signals and the measurement of particles distributed in an undetermined manner over additional properties. However, the methodology introduces its own limitations, namely, the longer time required to individually measure a large number of particles and the inability to measure particles that are too small to be individually detected. In spite of these limitations, the MDLS method will often provide more complete and precise information.
- The method and apparatus of the present invention operates upon the signal, such as an electrical signal, derived from a suitable sensor that is positioned and oriented to detect the scattered signal from at least one particle illuminated by an acoustic or electromagnetic field suitably modulated such that the illumination intensity varies periodically in both time and space over a volume within which the particle(s) is measured.
- The electrical signal is measured in time to obtain the time history of the signal or the sequence of time intervals at which some feature of the signal recurs or is processed to obtain the autocorrelation or other function of the signal in order to capture information in the frequency and amplitude modulation of the signal due to the translational and rotational motions of the particle(s).
- The information so captured is used together with an appropriate analytical expression or analytical method to determine the mean square displacement (σ²) of the particle in one dimension and the mean square rotations (σr²s) of the particle about at least one of three mutually perpendicular axes through the particle as it depends on the delay time interval τ. Since the σ² history depends on the time average value of the particle friction coefficient and, under certain conditions to be described below, the particle mass, the measured σ² history can be used to determine the particle friction coefficient and/or the particle mass. Likewise, since the
σ r² histories depend on the time average values of the rotational friction coefficients of the particle and, under the same certain conditions, the mass moments of inertia of the particle about the three axes, the measuredσ r² histories can be used to determine the particle rotational friction coefficients and/or mass moments of inertia about the three axes. - Moreover, a shape category of the particle is readily determined from the general form of the measured or processed signal such that the particle can be classified as to its general shape category, for example, spherical, slightly non-spherical, highly non-spherical, axisymmetric or non-axisymmetric.
- Particle velocity is determined in the MDLS methods and apparatuses as well as the above mentioned properties. Measurement of particle or suspending fluid velocity is in itself a useful ability. Moreover, when an electrostatic field of known strength is imposed on the particle, the electrostatic charge and charge to mass ratio of the particle are determined.
- Finally, additional analysis or processing of the scattered signal together with proper preparation of the sample particle when required provides information about the chemical, biological or structural nature of the particle.
- Figure 1A is a block diagram of an MDLS device and associated signal processing equipment. This device illuminates a particle with light having one component (polarization or color) with a fringe pattern intensity field that is modulated to be periodic in both time and spatial displacements.
- Figure 1B is a block diagram of an MDLS device for illuminating a particle with light having two components (polarization and/or color) each of which has a fringe pattern intensity field that is independently modulated to give two independent time and displacement periodicities. Also shown are associated signal detection and processing equipment.
- Figure 1C is a block diagram of an MDLS device similar to that of Figure 1B but utilizing different optical, electronic and signal processing equipment.
- Figure 2A is a waveform illustrating the illumination intensity pattern caused by destructive interference of one component of light within the intersection volume of the two crossed beams shown in Figures 1A, 1B and 1C at one instant in time.
- Figure 2B is a rendering of the fringe pattern formed at one instant in time within the intersection volume by the destructive interference of one component of light in the two beams of Figures 1A, 1B and 1C.
- Figure 3 is a diagram illustrating the orientation of the symmetry axis of an axisymmetric particle in polar coordinates fixed to a laboratory reference frame.
- Figure 4 is a block diagram of electronic and signal processing equipment that may be used to capture and/or process the scattered light signal history of a particle in the device of Figures 1A, 1B or 1C.
- Figure 5 is a point plot of a measured correlation function for a sample particle made in accordance with one method of the present invention.
- Figure 6 is a block diagram of an MDLS device having additional features and associated equipment.
- Illustrated in Figure 1A is an MDLS device 10A which is used to illuminate at least one particle and to capture and/or process the scattered light signal history used to determine values of the particle properties. The apparatus utilizes a one component light beam A consisting of a single color and single polarization, generated by a
laser 12 that is intensity attenuated by means of aneutral density filter 14 and split into twobeams beamsplitter 16.Beam 1 passes through a Braggcell 20 which frequency shifts the beam by F₀, where F₀ is typically 40 MHz.Beam 2 is reflected by areflector 18 through aBragg cell 21 wherein it is frequency shifted by F₀+ΔF, where |ΔF|≧1 KHz in typical applications.Beam 2 is then redirected byreflector 22 throughlens 23 andpolarizer 24, to insure purity of the single beam component. From thepolarizer beam 2 is directed byreflector 26 through thewindow 26A and through the center ofsample chamber 40 containing at least one particle a liquid or gas suspension fluid to alight trap 32. In a like manner,beam 1 is reflected offreflector 28 and directed throughlens 29 and polarizer 30, to insure purity of the single beam component.Beam 1 is then directed byreflector 31 through thewindow 31A to intersectbeam 2 at the center of thesample chamber 40. Alight trap 34 is positioned to trapbeam 1 at the far side of the sample chamber. The beams intersect at angle Ψ which is bisected by an axis Z. Perpendicular to axis Z is an X labelled axis. Alens 36 is positioned with its center on the Z axis to focus forward scattered light from at least one particle within the intersection volume ofbeams polarizer 37 typically passing light having the polarization angle of the original beams A, 1, and 2, is inserted in the beam path to insure purity of the light component detected. Amask 38 is interposed in the beam path centered on the Z axis to remove defocused light. Thelens 36 and the PMT 42 are also centered on axis Z. Signal storage andprocessing equipment 43 receives, as an input, the electrical signals from PMT 42 and performs storage of the signal history and signal processing methodologies on the received signals bysignal processing equipment chamber 40. - Figure 1B illustrates an MDLS device 10B which is used to illuminate at least one particle with light containing two components in each of two beams that are combined in the intersection volume at the center of
chamber 40 to form the independently modulated fringe patterns, one from each component. Light beam A fromlaser 12 passes through a half-wave plate 13 which can be rotated to fix the direction of polarization of light in beam A′ in order to divide substantially equally the light inbeams 3 and 4. Light in beam A′ is intensity attenuated byneutral density filter 14 and split intobeams beamsplitter 16. Bothbeams Beam 1, containing substantially half the power of beam A′, is directed bybeamsplitter 16 through a Braggcell 20 which frequency shifts by F₀ both components ofbeam 1. After passing through Braggcell 20beam 1 is directed byreflector 28 through lens 29 (optional) and ontoreflector 31 which directsbeam 1 throughwindow 31A into the center ofsample chamber 40.Beam 1 then passes through the center ofchamber 40 and is trapped in alight trap 34 at the far side ofchamber 40.Beam 2 is separated into the twobeams 3 and 4 each having only one component (polarization) by polarizingbeamsplitter 18A. Beam 3 containing the horizontally polarized component ofbeam 2 is directed byreflector 18 through a neutral density filter 15 (optional) used to adjust the intensity balance betweenbeams 3 and 4 upon their recombination asbeam 5 and to reflector 22 and to polarizer 20A (optional) to insure purity of the horizontally polarized light component of beam 3.Beam 4 containing the vertically polarized light component ofbeam 2 is directed bypolarizing beamsplitter 18A throughBragg cell 21 which frequency shifts the beam F₀+ΔF.Beam 4 next passes throughpolarizer 21A to insure purity of the vertically polarized light component ofbeam 4. Beam 3 andbeam 4 are recombined intobeam 5 by polarizingbeamsplitter 19 such thatbeam 5 contains two components of substantially equal intensity, namely, the horizontally polarized light component of beam 3 that is not frequency shifted and the vertically polarized light component ofbeam 4 that is frequency shifted by F₀+ΔF.Beam 5 is next passed through lens 23 (optional) and ontoreflector 26 which directsbeam 5 throughwindow 26A through the center ofsample chamber 40 and intolight trap 32.Beams chamber 40 with intersection angle Ψ which is bisected by an axis Z. Perpendicular to axis Z is an axis labelled X. Alens 36 is positioned on the Z axis to focus scattered light from any particle in the intersection volume ofbeams Mask 38 is positioned intermediate between thelens 36 and the PMT 42 to prevent undesired stray light from reaching PMT 42. Electronic andsignal processing equipment 43 receives, as an input, the electrical signals from PMT 42 and performs electronic filtering, signal storage and signal processing methodologies on the signal received from PMT 42. The signal from PMT 42 contains one signal component due to the horizontally polarized light components ofbeams beams 
signal processing equipment 60 without extensive and complex analysis. Likewise, output data relating to orientation dependent properties of the particle can be extracted directly from the high frequency signal component. - In Figure 1C an apparatus 10C similar in function to that of Figure 1B is illustrated. The apparatus of Figure 1C is identical to that of Figure 1B in its components and their functions with the exception of
components polarizing beamsplitter 39. Scattered light signal containing the two components (polarizations) and passing throughmask 38 of Figure 1C is separated into twobeams 39A and 39B which substantially contain, respectively, the horizontally and vertically polarized light scattered from the particle in the intersection volume at the center ofsample chamber 40. One component of this scattered light signal, the horizontally polarizedcomponent beam 39A which is the component modulated at high frequency F₀, is detected byPMT 42A which provides in response an electrical output signal captured or processed bysignal processing equipment 43A to provide data output signal S1(t). Signal processing equipment includes means for providing the time averaged mean signal over an interval which is long compared to theperiod 1/F₀ but short compared to the muchlonger period 1/ΔF. Thus, the electrical signal S1(t) is proportional to the product of the local time averaged intensity and the instantaneous value of the light scattering cross-section of the particle which cross-section may vary substantially over time intervals >> 1/F₀ due to random Brownian rotations of the particle. The second component of the scattered light signal from the particle in the intersection volume at the center ofchamber 40, the vertically polarized component beam 39B which is the component modulated at the much lower frequency ΔF, is detected byPMT 42B which provides an electrical output signal captured or processed bysignal processing equipment 43B to provide data output signal S2(t). Thus, output signal S2(t) is proportional to the product of the light scattering cross-section of the particle and the instantaneous illumination intensity which depends on the instantaneous particle displacement in the x-direction. The ratio S2(t)/S1(t) at time t obtained by use ofsignal processing equipment 60 depends only on particle displacement x at time t. - Figure 2A illustrates in a cross-sectional view the local intensity of one component (polarization) versus x-direction displacement within the intersection volume of the two beams at the center of
chamber 40 at one instant in time. The amplitude I is shown varying between a maximum value of Ip and a minimum value of Iv. This interference fringe pattern (intensity distribution) is moving in the x-direction with the constant velocity
beams - For the light component having polarization direction in the plane of Figures 1A, 1B or 1C (horizontal polarization), the polarization vectors of the two beams are not aligned because the beams are inclined by angle Ψ. In this case the intensity field fringe pattern has a larger value of the minimum intensity Iv while the maximum intensity Ip may be unchanged.
- A high frequency pass filter receiving the electrical signal from the detector (PMT) 42 removes the signal component due to the background illumination intensity Iv passing only the fluctuating signal component. For light having polarization vector normal to the plane of Figures 1A, 1B and 1C (vertical polarization), the polarization vectors are always aligned and the background illumination intensity, Iv, is small. Vertical polarization thus gives the largest intensity modulation.
- A
particle 50 moves, for example, by random Brownian translations over anexample trajectory 52. The illumination intensity of theparticle 50 is time and displacement modulated according to [Equation (A5b), Appendix A]


beams beams - To measure individual particles, particles are introduced into the
sample chamber 40 at sufficiently low concentration so that a particle is located in the intersection volume no more than 10 percent of the time. Only rarely then will more than one particle occupy the intersection volume, resulting in negligible coincidence errors. To measure more than one particle at a time, particles are introduced at much higher concentration so that many are simultaneously in the intersection volume. In this case the properties measured are weighted mean values. - While a particle resides in the intersection volume of the device shown in Figure 1A it scatters light through
lens 36,analyzer 37 andmask 38 onto detector (PMT) 42. Typically for MDLS device 10A, only scattered light having the same polarization as the incident light is detected. As illustrated in Figure 1A, this light is scattered within a small solid angle centered on the forward direction. Non-forward scattered light can also be observed by movement of the detector-mask analyzer-lens axis off the central axis Z. - When the PMT signal indicates the presence of a particle in the intersection volume (exceeds a threshold value), the signal is captured, stored or processed. For example, a digital correlator can be used to accumulate the correlation function of the PMT (scattered light) signal until the particle leaves the intersection volume the (PMT signal falls below the threshold value). The measured autocorrelation function for each particle is stored and processed later or processed on-line to extract the property values of interest from which precise distributions can be determined. Example computer programs for extraction of some property values are given in Appendices B, C and D.
- To infer the property values from the captured or processed data, a suitable model that relates the data and the particle properties is required. We illustrate here the basis of such models and outline example analysis and signal processing methods.
- For a
particle 50 suspended in a fluid at absolute temperature T, the probability that it will displace in the x-direction the net length Δx by random Brownian displacements in time interval t is given by the so-called transition probability expression


particle 50,


Table 1 ζ F(ζ) ζ F(ζ) ζ F(ζ) → ∞ 1 - 1/ζ 10.0 0.9000 0.8 0.3117 100.0 0.9900 8.0 0.8750 0.6 0.2480 80.0 0.9875 6.0 0.8337 0.4 0.1758 60.0 0.9833 4.0 0.7546 0.3 0.1361 40.0 0.9750 3.0 0.6833 0.2 0.09365 30.0 0.9667 2.0 0.5677 0.1 0.04837 20.0 0.9500 1.0 0.3679 → 0 ζ/2 - When the suspending fluid is a liquid or a gas at normal temperature and pressure,


- Consider, as a first example,
particle 50 located near the center ofchamber 40 within the intersection volume ofbeams 
signal processing equipment 60 is coupled so that only the a.c. component of signal S(t) is passed into a sensor circuit ofequipment 60. When theparticle 50 observed in MDLS device 10A either has an orientation dependence of its scattering cross-section that is zero or relatively weak or is constrained to remain in a fixed orientation, such as by use of an imposed electrostatic or aerodynamic field, then output signal S₀(t) of device 10A is functionally equivalent to S(t) and the methods utilized to extract property values and other information from S(t) can also be used to extract property values and other information from S₀(t). Accordingly, the output signal S₀(t) from the apparatus of Figure 1A can be coupled into a sensor circuit ofequipment 60 and the following description then applies equally to the output ofequipment 60 from apparatus 10A, 10B and 10C. - In Figure 4 are illustrated some of the components of
signal processing equipment 60. Referring to Figure 4, the signals S1(t) and S2(t) are applied to adivider 62. The output from the divider is the signal

positive slope crossings 64 via a d.c. decoupler such ascapacitor 63. The marker signals generated bydetector 64 are transmitted to aprocessor 66 which determines the time intervals between selected marker signals (nearest neighbor, second nearest neighbors, . . .) and provides the sequence of these interval values as digitized quantities on the output data line ofprocessor 66. - The sensor circuit detects when the a.c. component of S(t) crosses the zero level with positive slope and generates an electrical marker signal at each such crossing. These marker signals thus occur at the time values at which the a.c. component of the illumination intensity given by Equation (2) is zero with positive slope. Thus, for time interval Δt between two selected marker signals and particle displacement Δx during the interval, it follows from Equation (2) that

- Defining the initial time t₀ and location x₀ to give a reference condition at which the a.c. component of the illumination intensity crosses zero with positive slope, namely,


For nearest neighbor marker signals m₀ = 1. For second nearest neighbor marker signals m₀ = 2. For the ηth nearest neighbor marker signals

- When a large number, n, of time intervals Δt is measured for a
particle 50 in the modulated illumination intensity field and when the number of measurements, ni, for which
signal processing equipment 60, the probability of observing


- A time series analysis of the signal S(t) to obtain at least one property of
particle 50 can be performed as follows. The sequence of n measured time intervals Δt between marker signals is used with Equation (5) to obtain the corresponding displacements Δx. The number of intervals ni having specified time interval Δti and displacement Δxi is determined from this sequence and the ratio


- A time series analysis methodology like the one illustrated above will be adequate when the noise contained in the signal S(t) is relatively low, as occurs for large particles with large light scattering cross-sections. For particles having light scattering cross-sections which are relatively small, other methods are preferred which employ, for example, one or more signal processing techniques which allow clean extraction of signals buried deeply in noise.
- Now consider, as a second example, the determination of at least one property of a
particle 50 inchamber 40 by use of the autocorrelation function of the signal S(t) obtained using device 10B or 10C or signal S₀(t) obtained using device 10A subject to the conditions previously stated. An example of such an autocorrelation function as measured with device 10A is shown in Figure 5. The same methods can be used to determine at least one property of theparticle 50 inchamber 40 by use of the autocorrelation function of the signal S(t) obtained using the device 10D of Figure 6 which device will be described hereinafter. The autocorrelation function (or simply correlation function hereafter) is formed by use of a correlator, to which the signal S(t) is transmitted. It remains, however, to show how the correlation function depends on the properties ofparticle 50 and, therefore, how the correlation function can be used to obtain at least one property ofparticle 50. - For example, in the modulated illumination device 10C of Figure 1C, the signal


particle 50 obtained, within a multiplicative constant, from the (short) time average of signal S1(t) of the device 10C. It is useful to express In(t) in the form


- To calculate the ensemble average we first note that the angular bias frequency Δω of Equation (2) can be expressed in terms of the fringe field velocity Vf (Appendix A)

particle 50 moves with constant average velocity Vp, such as by sedimentation or convection in a moving suspending fluid, and by random Brownian translations, particle location is given by


- The correlation function is thus given by the ensemble average

where p(x,τ;x₀) is the transition probability, i.e., the probability density that a particle is located at x at time τ when it began at location x₀ at time zero. For a particle undergoing pure Brownian motion, for example,


- Determination of C(τ) by use of a correlator together with the analytical expression (17) allows extraction of σ² at each of several values of delay time τ by suitable data analysis methods, such as least-squares fitting of Equation (17) to the measured C(τ). These σ² are τ data pairs for the
particle 50 together with the expressions


- We also illustrate how the range of values obtainable from C(τ) can be determined. This determination may be based on two requirements:
- 1. Sufficient decay of the factor exp(-K²σ²/2) must occur over the τ-range for which C(τ) is measured to allow determination of this decay.
- 2. The decay of the factor exp(-K²σ²/2) must be sufficiently weak so that it can be quantitatively resolved, i.e., the decay must be slow enough to be measured over more than one resolution time or sample time of the correlator.
- These two conditions (18a) and (18b) impose lower and upper limits on the range of property values of
particle 50 that can be determined by the example method described in this illustration. - For the case when β τ ≦ 0.1 for which


- For the case when 3 ≦ βτ for which


- For the case when βτ >> 1 for which


γ ₁ andγ ₂, the dynamic range in f is 1,246. - An example analysis of the correlation function of signal S1(t) of device 10B, 10C, 10D or of signal S₀(t) of device 10A, when the time variations of S₀(t) are dominated by rotational motion of
particle 50, provides information about particle properties related to particle rotation. Similar to the example analysis above for the signal S(t), fluctuations in time of this signal due, for example, to Brownian rotations of anaxisymmetric particle 50 about three mutually perpendicular axes of the signal S1(t) or S₀(t), subject to the stated conditions for S₀(t), gives an analytical expression for the rotational correlation function having the form
where the coefficients cj are constants for any one particle and can be determined empirically. However, it can be shown that for simple systems only a few of the cj are nonzero at known values of j. Consider, for example, an axisymmetric particle such as rod, disk, spheroid or straight chain aggregate of spheres for all of which only rotation about two axes (those normal to the symmetry axis as shown in Figure 3 with the polar angle Θ the inclination of the symmetry axis from the Z axis and Φ the inclination of the x-y plane projection of the symmetry axis from the x axis) contribute to the fluctuations in light scattered from the particle and fr and Im are equal for those two rotational degrees of freedom. By definition, fr is the rotational friction coefficient ofparticle 50 for rotation about its axis normal to the symmetry axis and Im is the mass moment of inertia of the particle about the same axis of rotation. For these simple systems it is possible to fit the measured to the theoretical rotational correlation function Cr(τ) in order to determineσ r² at several values of delay time τ. Theseσ r² and τ data pairs can be used with theexpression 


- For the case of rotation of a non-axisymmetric particle the rotational correlation function Cr(τ) is complex. However, it can be qualitatively represented as the product of two or three functions having the form of Equation (20).
- In any case, the comparative forms of the measured rotational correlation function Cr(τ) and the translational correlation function C(τ) reveal a general shape category of the particle. Based on results observed for many particle shapes it has been determined that the relative rate of decay of Cr(τ) is zero for spherical particles, is small for slightly non-spherical particles, moderate for non-spherical particles and large for highly non-spherical particles, where the relative rate of decay in Cr(τ) is determined by comparison to that of C(τ) for translational motion.
- Morever, analysis of Cr(τ) can provide information regarding the symmetry of a particle. If the particle is axisymmetric Cr(τ) can be well fitted by an expression having the form of (18) with
σ r² given by a single set of fr and Im. When the particle is not axisymmetric, two or three sets of fr and Im are required for an adequate fit. Precise data is generally required for such symmetry analysis. - In Figure 6 is shown MDLS device 10D consisting of light or other
electromagnetic illumination source 12 which can be, for example, a laser or incandescent light source which generates illumination beam A which passes throughwindow 26A into asample chamber 40, through the center ofchamber 40 and intolight trap apparatus 32 at the far side ofchamber 40. When at least oneparticle 50 is located sufficiently near the center ofchamber 40, a scattered illumination beam B is generated. The beam B exitschamber 40 through awindow 26B, passes through a spatial filter device consisting, for example, oflens 36 andmask 38A having a small aperture near the image plane of the center ofchamber 40, throughlens 36A, and into intobeamsplitter 16. The scattered illumination in beam B which passes through the spatial filter device and entersbeamsplitter 16 is divided into two beams C and D. Beam C continues through amodulator device 35 consisting, for example, of a finely linedbeam chopper disk 35A driven by amotor 35B, ontodetector device 42B which may consist of a photomultiplier tube (PMT) which serves to transform the incident scattered illumination signal of modulated beam C′ into electrical signal SB(t).Beam chopper 35A is positioned at an image plane of the objectplane containing particle 50. Asparticle 50 displaces due, for example, to random Brownian translations, the location of the image ofparticle 50 in the plane ofbeam chopper 35A displaces a corresponding amount, magnified by a magnification M, the magnification in the image plane coincident withchopper 35A due to the optical components of the device. Thus, whenparticle 50 displaces the distance x(t) normal to the plane of Figure 6, the image ofparticle 50 in the image plane located atbeam chopper 35A displaces the distance Mx(t), also normal to the plane of Figure 6 which is the direction of the tangential motion ofbeam chopper 35A.Modulator device 35 transforms beam C to modulated beam C′ by imposing a time and x-direction displacement periodic modulation on the intensity of beam C. Whenbeam chopper 35A is utilized, for example, the scattered illumination of beam C is focused to an image point in the plane ofbeam chopper 35A and the modulation is imposed by alternately transmitting through and stopping the beam as the transparent and opaque regions associated with each line of the beam chopper traverse the image point location, respectively. Thus, the intensity of scattered illumination in beam C′ is modulated periodically in both time t and displacement x(t). The frequency ΔF of this modulation is given, for example, by the product of the number of lines per revolution Nr ofbeam chopper 35A and the revolutions per second RPM/60 with which the chopper is rotated.
- Table 2 shows example values of ΔF for selected values of Nr and RPM.
Table 2 Nr RPM ΔF, KHz Nr RPM ΔF, KHz 180 100 0.30 360 100 0.60 180 200 0.60 360 200 1.20 180 500 1.50 360 500 3.00 180 1000 3.00 360 1000 6.00 180 2000 6.00 360 2000 12.00 180 5000 15.00 360 5000 30.00 180 10000 30.00 360 10000 60.00
Beam chopping at sufficiently large radial location on the rotating chopper is preferred so that displacements in the object plane over the field of view allowed bymask 38A result in negligible relative changes in the radial location of the image ofparticle 50 on the chopper and so that the width of the lines is larger than the image spot size to insure good signal visibility and displacement resolution. -
Beam splitter 16 provides from incident beam B a second output beam D. Beam D is passed onto detector device (PMT) 42A which transforms the incident illumination signal of beam D into electrical signal SA(t). Electric signals SB(t) and SA(t) are processed bysignal processing equipment signal processing equipment 60 is used to obtain the signal
particle 50 and the incident illumination, while signal S2(t) is proportional to this product and also depends on the particle location x(t). The ratio S(t) thus depends only on x(t) and can be used to obtain values of the properties ofparticle 50 that influence x(t), including the particle mass, translational friction coefficient and velocity component in the x-direction, and information that derives therefrom. - For example, let S(t) be given by the periodic function g(Δωt) for at least one stationary particle or other scatterer at the center of
chamber 40 with
chopper 35A. For a non-stationary particle having x-location given by


chopper 35A. The correlation function of S(t) is then
where p(x,τ;x₀) is the transition probability. Once the functions g(ωt) and p(x,τ;x₀) are specified, C(τ) can be determined. Comparison of measured and calculated values of C(τ) for particles undergoing random Brownian translations, for example, provide values of the translational friction coefficient, mass and x-direction velocity of the particle(s), as illustrated above. When
- Moreover, when only ω is determined from the S(t) or C(τ) data, for example, measured for at least one particle, the velocity of the particle(s) can be obtained from

- When device 10A, 10B, 10C or 10D is used to determine particle translational friction coefficient f, particle mass and x-direction velocity Vp and when an x-direction electrostatic field of magnitude dV/dx is imposed over the intersection volume within
chamber 40, the electrostatic charge of the particle is determined by
- Information pertaining to chemical composition as obtained by a number of analytical techniques can also be incorporated into the data base for each particle. The light (or other radiation) scattered, transmitted or emitted by the illuminated particle can be used with techniques including emission, Raman, ultraviolet, visible and infrared spectroscopies. Particles such as cells, bacteria, viruses and spores or portions thereof can also be stained to provide a flurorescence signal indicative of a chemical or a biological material. Since flurorescent decay is typically quite fast the detector can monitor the fluctuations in S(t) due to particle translations and rotations by observation of this signal.
- Scattered light at a zero scattering angle is isolated from incident illumination in the crossed beam MDLS device by the different directions of the incident and scattered beams and by isolating the a.c. component of the scattered light signal senses to eliminate d.c. components which may be due to non-zero scattering light. Additionally, observation of the forward scattered or emitted light isolated from incident illumination can be used to obtain signals having improved location resolution and signal-to-noise ratios for certain measurements such as light scattering from small particles.
Claims (17)
- Method for determining the mass m of suspended particles in a fluid comprising the steps of :- illuminating at least one particle with a light having at least one component ;- sensing the light scattered or emitted by the particle by means of a sensor providing an electrical signal representative of the intensity of the scattered or emitted light ;- modulating the light sensed by the sensor periodically both in time and space over a volume within which the particle is measured ;- processing the electrical signal representing the intensity of the scattered light over a time interval t ;- determining the mean-square-x-displacement σ² value of each particle at one or more values of the time interval t, wherein x is normal to the direction of the sensed light ; and- in order to determine the mass m of the particle equating the measured


- Method as defined in claim 1, wherein βt is less or equal to 0.1 in order to approximate σ² by kTt²/m so that the mass of each particle is determined by the required condition

- Method as defined in claim 1, wherein the mean-square-x-displacement σ² value of each particle is measured at least at two values of time interval t in order to determine both the mass and the friction coefficient of the particle.
- Method as defined in any of claims 1 to 3, wherein several particles suspended in a fluid are simultaneously within the volume of measurement in order to obtain average values of the mass m and of the friction coefficients f by measurement of a weighted average mean-square-x-displacement σ² of the particles at two or more values of time interval t.
- Method as defined in any of claims 1 to 4, wherein the mean-square-x-displacement σ² values are determined by measurement of electromagnetic radiation emitted or scattered from the suspended particles.
- Method as defined in any of claims 1 to 4, wherein the mean-square-x-displacement σ² values are determined by measurement of particulate radiation emitted or scattered from the suspended particles.
- Method as defined in any of claims 1 to 4, wherein the mean-square-x-displacement σ² values are determined by forming the autocorrelation function of the scattered light signal from the suspended particles.
- Method as defined in any of claims 1 to 7 for determining particle mass m (and friction coefficient f) and information about the chemical composition of the particle by use of Raman or fluoresence spectroscopy wherein the particle is illuminated with an exciting beam of radiation modulated and the fluctuations of the Raman or fluoresence signals are used to determine the particle mass m (and friction coefficient f) while the time average value of the Raman or fluoresence signal is used to determine chemical composition information about the particle.
- Method as defined in claim 8 wherein the exciting beam is a beam of electromagnetic radiation.
- Method as defined in claim 8 wherein the exciting beam is a beam of particulate radiation.
- Method as defined in any of claims 1 to 10, wherein the step of modulating the sensed light comprises illuminating said particle by incident radiation in two crossed coherent beams in order to obtain space modulation, at least one of said beams being time modulated so that the time averaged scattered signal is quantitatively related to the time averaged incident illumination irrespective of intensity variations within the intersection volume of the crossed beams ; and wherein the step of sensing the scattered or emitted light comprises detecting the scattered or emitted signal at any angle including the forward angle without interference with the illuminating beam.
- Method as defined in any of claim 1 to 10, wherein the step of modulating the sensed light comprises illuminating said particle by incident radiation and chopping the scattered or emitted light so as to cause the local intensity of the illuminated particle to vary periodically with both time and space displacement.
- Apparatus for determining the mass m of one or more particles suspended in a fluid, comprising :a) means (12) for illuminating at least one particle with a light having at least one component ;b) means (42) for sensing the light scattered or emitted by the particle for providing an electrical signal representative of the intensity of the scattered or emitted light ;c) means (20, 21, 35) for modulating the light received by the sensing means periodically both in time and space over a volume within which the particle is measured ;d) means (43, 60) for processing the electrical signal representing the intensity of the scattered or emitted light over a time interval t ;e) means for determining the mean-square-x-displacement σ² value of each particle at one or more values of time interval t wherein x is normal to the direction of the sensed light ; andf) means for comparing the measured σ² values to theoritical values given by


- Apparatus as defined in claim 13, wherein the means for modulating the light received comprises means (35) for chopping the scattered or emitted light so as to cause the local intensity of the illuminated particle to vary periodically with both time and space displacement.
- Apparatus as defined in claim 13, wherein the means for modulating the light received comprises means for generating an electromagnetic radiation field by the intersection of two beams of the electromagnetic radiation at least one of which is modulated so as to cause the local intensity of the electromagnetic radiation field illuminating the particle to vary periodically with both time and space displacement.
- Apparatus as defined in claim 15, wherein the means for generating an electromagnetic radiation field comprises means for directing at least two frequency shifted light beams along crossed optical paths so as to establish at least one fringe pattern within the intersection of the crossed beams ; the means for sensing comprises at least one sensor means positioned to detect the light scattered or emitted by a particle within the intersection of the beams for converting at least one detected light to at least one signal ; the means for determining comprises at least one signal processing means (43, 60) coupled to at least one said sensor means for receiving the signals therefrom and for processing said signals to obtain the determination of the mean-square-x-displacement σ² value of each particle at one or more values of the time interval t for which βt is approximately equal to or less than 0.1 whereby the mass of said particle is determined by comparing the determination of the mean-square-x-displacement σ² value to the theoritical values approximated by


- Apparatus as defined in claim 15, wherein the means for illuminating at least one particle comprises a light source having two components, the means for modulating the light illuminating the particle established at least two independant fringe patterns.
Applications Claiming Priority (2)
| Application Number | Priority Date | Filing Date | Title |
|---|---|---|---|
| US24496588A | 1988-09-15 | 1988-09-15 | |
| US244965 | 1988-09-15 |
Publications (3)
| Publication Number | Publication Date |
|---|---|
| EP0359681A2 EP0359681A2 (en) | 1990-03-21 |
| EP0359681A3 EP0359681A3 (en) | 1990-09-12 |
| EP0359681B1 true EP0359681B1 (en) | 1995-11-08 |
Family
ID=22924809
Family Applications (1)
| Application Number | Title | Priority Date | Filing Date |
|---|---|---|---|
| EP89420335A Expired - Lifetime EP0359681B1 (en) | 1988-09-15 | 1989-09-11 | Characterization of particles by modulated dynamic light scattering |
Country Status (4)
| Country | Link |
|---|---|
| US (2) | US5502561A (en) |
| EP (1) | EP0359681B1 (en) |
| JP (1) | JPH02193043A (en) |
| DE (1) | DE68924749T2 (en) |
Cited By (3)
| Publication number | Priority date | Publication date | Assignee | Title |
|---|---|---|---|---|
| CN103245637A (en) * | 2013-04-16 | 2013-08-14 | 北京清风康华科技有限公司 | Method for converting particle number concentration measured by using light scattering method into mass concentration and detector |
| CN106996906A (en) * | 2016-01-22 | 2017-08-01 | 株式会社堀场制作所 | Grading analysis device and grading analysis method |
| CN107037275A (en) * | 2016-10-26 | 2017-08-11 | 北京航空航天大学 | A kind of device for measuring single charged particle charge-mass ratio |
Families Citing this family (78)
| Publication number | Priority date | Publication date | Assignee | Title |
|---|---|---|---|---|
| JPH03140840A (en) * | 1989-10-26 | 1991-06-14 | Hitachi Ltd | Flow cytoanalyser |
| DE4129105A1 (en) * | 1991-09-02 | 1993-03-04 | Klotz Markus Dipl Ing Fh | Optical particle analyser, e.g. for blood particles in biological tissue - illuminates particles with light beam contg. superimposed mutually perpendicularly polarised components or beams to form interference pattern |
| DE4215908A1 (en) * | 1992-05-14 | 1993-11-18 | Ubbo Prof Dr Ricklefs | Optical particle size measurement appts. e.g. for clean room - periodically modulates light incident on measuring vol. e.g by varying light source power or using grating, acoustic=optic modulator or hologram, and detects scattered light. |
| US5627308A (en) * | 1995-05-31 | 1997-05-06 | Dahneke; Barton E. | Method and apparatus for measuring motion of a suspended particle or a suspending fluid |
| NL1000711C2 (en) * | 1995-06-30 | 1996-12-31 | Stichting Tech Wetenschapp | Imaging and characterization of the focal field of a lens by spatial autocorrelation. |
| US5633468A (en) * | 1995-09-13 | 1997-05-27 | The Babcock & Wilcox Company | Monitoring of fuel particle coating cracking |
| NL1001369C2 (en) * | 1995-10-06 | 1997-04-08 | Univ Delft Tech | Method and device for measuring particle size at low concentration. |
| DE19630956A1 (en) * | 1996-07-31 | 1998-02-05 | Basf Ag | Method and device for Raman correlation spectroscopy |
| US5943130A (en) * | 1996-10-21 | 1999-08-24 | Insitec, Inc. | In situ sensor for near wafer particle monitoring in semiconductor device manufacturing equipment |
| US7187441B1 (en) | 1996-11-08 | 2007-03-06 | The Texas A&M University System | Particle analysis system and method |
| US5818583A (en) * | 1996-11-08 | 1998-10-06 | Purdue Research Foundation | Particle analysis system and method |
| US6052184A (en) * | 1996-11-13 | 2000-04-18 | The Administrators Of The Tulane Educational Fund | Miniature, submersible, versatile, light scattering probe for absolute equilibrium and non-equilibrium characterization of macromolecular and colloidal solutions |
| US6653150B1 (en) | 1996-11-13 | 2003-11-25 | The Administrators Of The Tulane Educational Fund | Automatic mixing and dilution methods for online characterization of equilibrium and non-equilibrium properties of solutions containing polymers and/or colloids |
| US6137584A (en) * | 1996-11-27 | 2000-10-24 | Max-Planck-Gesellschaft Zur | Method and device for determining predetermined properties of target particles of a sample medium |
| DE59809426D1 (en) * | 1997-01-16 | 2003-10-02 | Rastopov Stanislav Federovich | METHOD AND DEVICE FOR RECORDING THE MOVEMENT OF MICROSCOPIC OBJECTS |
| EP0884583A1 (en) | 1997-06-10 | 1998-12-16 | Evotec BioSystems GmbH | A method for characterizing samples in at least two dimensional space of specific physical properties |
| US6263097B1 (en) * | 1997-07-04 | 2001-07-17 | Agfa-Gevaert | Method of determining (a) symmetry line(s) in a radiation image |
| EP1042664B1 (en) * | 1997-12-23 | 2001-10-31 | Evotec BioSystems AG | Method for detecting reactions by means of coincidence analysis |
| EP0947822A1 (en) * | 1998-04-02 | 1999-10-06 | Stichting Nederlands Instituut voor Zuivelonderzoek | Arrangement and method to apply diffusing wave spectroscopy to measure the properties of multi-phase systems, as well as the changes therein |
| US6519032B1 (en) | 1998-04-03 | 2003-02-11 | Symyx Technologies, Inc. | Fiber optic apparatus and use thereof in combinatorial material science |
| US6100976A (en) * | 1998-09-21 | 2000-08-08 | The Board Of Regents For Oklahoma State University | Method and apparatus for fiber optic multiple scattering suppression |
| EP1022549B1 (en) | 1999-01-21 | 2005-08-31 | European Space Agency | Dynamic light scattering method and apparatus |
| US7054002B1 (en) | 1999-10-08 | 2006-05-30 | The Texas A&M University System | Characterization of luminescence in a scattering medium |
| US6177993B1 (en) * | 1999-12-07 | 2001-01-23 | The Regents Of The University Of California | Inspection of lithographic mask blanks for defects |
| DE10036860A1 (en) * | 2000-07-28 | 2002-02-07 | Basf Ag | Method and device for determining physical collective parameters of particles in gases |
| WO2002088673A2 (en) * | 2001-05-02 | 2002-11-07 | University Of Hertfordshire | Detector for airborne biological particles |
| AU2002951467A0 (en) * | 2002-09-18 | 2002-10-03 | Ellex Medical Pty Ltd | Ophthalmic laser |
| US6847449B2 (en) * | 2002-11-27 | 2005-01-25 | The United States Of America As Represented By The Secretary Of The Navy | Method and apparatus for reducing speckle in optical coherence tomography images |
| JP3860162B2 (en) * | 2003-10-20 | 2006-12-20 | 大塚電子株式会社 | Dynamic light scattering measurement system using phase modulation interferometry |
| US7111496B1 (en) * | 2004-04-29 | 2006-09-26 | Pedro Lilienfeld | Methods and apparatus for monitoring a mass concentration of particulate matter |
| US7532327B2 (en) * | 2004-09-17 | 2009-05-12 | Jmar Research, Inc. | Systems and methods for detecting scattered light from a particle using illumination incident at an angle |
| WO2006047408A2 (en) * | 2004-10-22 | 2006-05-04 | Vanderbilt University | On-chip polarimetry for high-throughput screening of nanoliter and smaller sample volumes |
| US7616311B2 (en) | 2005-05-02 | 2009-11-10 | Jmar Llc | Systems and methods for a multiple angle light scattering (MALS) instrument having two-dimensional detector array |
| US8243272B2 (en) * | 2005-09-19 | 2012-08-14 | Jmar Llc | Systems and methods for detecting normal levels of bacteria in water using a multiple angle light scattering (MALS) instrument |
| US7551279B2 (en) * | 2005-09-19 | 2009-06-23 | Jmar Technologies, Inc. | Systems and methods for detecting normal levels of bacteria in water using a multiple angle light scattering (MALS) instrument |
| US7580127B1 (en) * | 2006-07-21 | 2009-08-25 | University Corporation For Atmospheric Research | Polarization lidar for the remote detection of aerosol particle shape |
| US8821799B2 (en) * | 2007-01-26 | 2014-09-02 | Palo Alto Research Center Incorporated | Method and system implementing spatially modulated excitation or emission for particle characterization with enhanced sensitivity |
| US9164037B2 (en) | 2007-01-26 | 2015-10-20 | Palo Alto Research Center Incorporated | Method and system for evaluation of signals received from spatially modulated excitation and emission to accurately determine particle positions and distances |
| KR100929868B1 (en) | 2007-03-12 | 2009-12-04 | 한국표준과학연구원 | Particle Measuring System and Particle Measuring Method Using The Same |
| EP2160590A4 (en) * | 2007-05-18 | 2012-11-21 | Univ Vanderbilt | Improved interferometric detection system and method |
| US8445217B2 (en) | 2007-09-20 | 2013-05-21 | Vanderbilt University | Free solution measurement of molecular interactions by backscattering interferometry |
| KR100912626B1 (en) * | 2007-10-16 | 2009-08-24 | 충청북도 | Portable optical device for multi-chamber fluorescence measurement and method for multi-chamber fluorescence measurement using the same |
| US8031339B2 (en) * | 2007-12-21 | 2011-10-04 | Lawrence Livermore National Security, Llc | Particle measurement systems and methods |
| US8373860B2 (en) | 2008-02-01 | 2013-02-12 | Palo Alto Research Center Incorporated | Transmitting/reflecting emanating light with time variation |
| US8629981B2 (en) * | 2008-02-01 | 2014-01-14 | Palo Alto Research Center Incorporated | Analyzers with time variation based on color-coded spatial modulation |
| US8625093B2 (en) * | 2008-09-26 | 2014-01-07 | Horiba, Ltd. | Particle characterization device |
| US8614792B2 (en) * | 2009-03-04 | 2013-12-24 | Malvern Instruments, Ltd. | Particle characterization |
| JP2010243374A (en) * | 2009-04-08 | 2010-10-28 | Chuo Univ | Particle size measurement apparatus of nanoparticle and particle size measurement method of nanoparticle |
| EP2365313B1 (en) * | 2010-03-12 | 2015-08-26 | LS Instruments AG | Cross-correlation dynamic light scattering (DLS) method and system |
| CN101852712B (en) * | 2010-05-11 | 2012-11-14 | 北京交通大学 | Device and method for detecting optical detector working point of particle detector |
| WO2011156713A1 (en) | 2010-06-11 | 2011-12-15 | Vanderbilt University | Multiplexed interferometric detection system and method |
| US8284398B2 (en) | 2010-06-24 | 2012-10-09 | Met One Instruments, Inc. | Nephelometer with concentration-modulated sample flow |
| GB201011590D0 (en) | 2010-07-09 | 2010-08-25 | Univ Gent | Method and system for dispersion measurements |
| US9562853B2 (en) | 2011-02-22 | 2017-02-07 | Vanderbilt University | Nonaqueous backscattering interferometric methods |
| US8723140B2 (en) | 2011-08-09 | 2014-05-13 | Palo Alto Research Center Incorporated | Particle analyzer with spatial modulation and long lifetime bioprobes |
| US9029800B2 (en) | 2011-08-09 | 2015-05-12 | Palo Alto Research Center Incorporated | Compact analyzer with spatial modulation and multiple intensity modulated excitation sources |
| US9273949B2 (en) | 2012-05-11 | 2016-03-01 | Vanderbilt University | Backscattering interferometric methods |
| US8854621B1 (en) * | 2012-08-29 | 2014-10-07 | University Of South Florida | Systems and methods for determining nanoparticle dimensions |
| JP2014062822A (en) * | 2012-09-21 | 2014-04-10 | Sony Corp | Fine particle analyzer and fine particle analyzing method |
| DE102013211885A1 (en) * | 2013-06-24 | 2014-12-24 | Siemens Aktiengesellschaft | Particle detector and method for the detection of particles |
| WO2016118812A1 (en) | 2015-01-23 | 2016-07-28 | Vanderbilt University | A robust interferometer and methods of using same |
| DE102015003019A1 (en) * | 2015-03-06 | 2016-09-08 | Fraunhofer-Gesellschaft zur Förderung der angewandten Forschung e.V. | Method and device for the optical detection of movement in a biological sample with spatial extent |
| DE102015007506B3 (en) * | 2015-06-11 | 2016-12-15 | Sensor Instruments Entwicklungs- Und Vertriebs Gmbh | Apparatus and method for determining a particle size in a spray jet |
| CN105510192A (en) * | 2015-11-24 | 2016-04-20 | 华南师范大学 | Method and system for measuring the particle size of nanometer particles |
| US10627396B2 (en) | 2016-01-29 | 2020-04-21 | Vanderbilt University | Free-solution response function interferometry |
| EP3379232A1 (en) * | 2017-03-23 | 2018-09-26 | Malvern Panalytical Limited | Particle characterisation |
| US10591422B2 (en) | 2017-10-05 | 2020-03-17 | Honeywell International Inc. | Apparatus and method for increasing dynamic range of a particle sensor |
| US11754712B2 (en) | 2018-07-16 | 2023-09-12 | Cilag Gmbh International | Combination emitter and camera assembly |
| CN110857909B (en) * | 2018-08-24 | 2022-05-20 | 北京世纪朝阳科技发展有限公司 | System for measuring particle size of particles |
| US11832996B2 (en) | 2019-12-30 | 2023-12-05 | Cilag Gmbh International | Analyzing surgical trends by a surgical system |
| US11776144B2 (en) | 2019-12-30 | 2023-10-03 | Cilag Gmbh International | System and method for determining, adjusting, and managing resection margin about a subject tissue |
| US11896442B2 (en) | 2019-12-30 | 2024-02-13 | Cilag Gmbh International | Surgical systems for proposing and corroborating organ portion removals |
| US11284963B2 (en) | 2019-12-30 | 2022-03-29 | Cilag Gmbh International | Method of using imaging devices in surgery |
| US20210199557A1 (en) * | 2019-12-30 | 2021-07-01 | Ethicon Llc | Adaptive surgical system control according to surgical smoke particulate characteristics |
| US11759283B2 (en) | 2019-12-30 | 2023-09-19 | Cilag Gmbh International | Surgical systems for generating three dimensional constructs of anatomical organs and coupling identified anatomical structures thereto |
| US11744667B2 (en) | 2019-12-30 | 2023-09-05 | Cilag Gmbh International | Adaptive visualization by a surgical system |
| CN111443020B (en) * | 2020-06-17 | 2020-09-08 | 天宇利水信息技术成都有限公司 | Sensor for monitoring sediment content of water body |
| CN113466092B (en) * | 2021-06-30 | 2023-06-23 | 澳谱特科技(上海)有限公司 | Root mean square error threshold method for determining optimal cut-off position of autocorrelation function |
Family Cites Families (13)
| Publication number | Priority date | Publication date | Assignee | Title |
|---|---|---|---|---|
| US3732014A (en) * | 1972-01-31 | 1973-05-08 | Gen Electric | Electromagnetic radiation apparatus for analyzing small particles |
| US3766048A (en) * | 1972-11-24 | 1973-10-16 | Univ Illinois | Analysis of polymer mixtures in solution utilizing electrophoretic light scattering apparatus |
| US3872312A (en) * | 1973-07-02 | 1975-03-18 | Block Engineering | Method and apparatus for detecting and classifying nucleic acid particles |
| GB1463983A (en) * | 1973-11-13 | 1977-02-09 | Nat Res Dev | Laser doppler velocimeter |
| CA1068409A (en) * | 1975-12-12 | 1979-12-18 | Pierre-Andre Grandchamp | Determination of parameters of an autocorrelation function |
| US4148585A (en) * | 1977-02-11 | 1979-04-10 | The United States Of America As Represented By The Department Of Health, Education & Welfare | Three dimensional laser Doppler velocimeter |
| US4211487A (en) * | 1979-01-22 | 1980-07-08 | The United States Of America As Represented By The Secretary Of The Army | Method and apparatus for determining aerosol size distributions |
| US4351709A (en) * | 1979-02-28 | 1982-09-28 | Goetz Philip J | Method of obtaining the mean electrophoretic mobility of particles |
| US4263508A (en) * | 1979-04-20 | 1981-04-21 | Research Corporation | Pulse edge measurement for determining particle dimensional characteristics |
| US4537507A (en) * | 1982-10-18 | 1985-08-27 | Spectron Development Laboratories, Inc. | Dual beam maximum intensity laser sizing system |
| US4596036A (en) * | 1983-08-31 | 1986-06-17 | The United States Of America As Represented By The United States Department Of Energy | Method and apparatus for fringe-scanning chromosome analysis |
| US4633714A (en) * | 1985-08-13 | 1987-01-06 | University Of Arkansas | Aerosol particle charge and size analyzer |
| US4807990A (en) * | 1986-10-28 | 1989-02-28 | University Of Tennessee Research Corporation | Laser fluorescence velocimeter |
-
1989
- 1989-09-11 DE DE68924749T patent/DE68924749T2/en not_active Expired - Fee Related
- 1989-09-11 EP EP89420335A patent/EP0359681B1/en not_active Expired - Lifetime
- 1989-09-14 JP JP1239773A patent/JPH02193043A/en active Pending
-
1990
- 1990-08-20 US US07/569,800 patent/US5502561A/en not_active Expired - Fee Related
-
1991
- 1991-04-23 US US07/689,657 patent/US5434667A/en not_active Expired - Fee Related
Cited By (5)
| Publication number | Priority date | Publication date | Assignee | Title |
|---|---|---|---|---|
| CN103245637A (en) * | 2013-04-16 | 2013-08-14 | 北京清风康华科技有限公司 | Method for converting particle number concentration measured by using light scattering method into mass concentration and detector |
| CN103245637B (en) * | 2013-04-16 | 2016-03-16 | 北京清风康华科技有限公司 | A kind of Particle number concentration recorded by light scattering method is converted to method and the detector of mass concentration |
| CN106996906A (en) * | 2016-01-22 | 2017-08-01 | 株式会社堀场制作所 | Grading analysis device and grading analysis method |
| CN107037275A (en) * | 2016-10-26 | 2017-08-11 | 北京航空航天大学 | A kind of device for measuring single charged particle charge-mass ratio |
| CN107037275B (en) * | 2016-10-26 | 2019-08-16 | 北京航空航天大学 | A kind of device measuring single charged particle charge-mass ratio |
Also Published As
| Publication number | Publication date |
|---|---|
| DE68924749D1 (en) | 1995-12-14 |
| JPH02193043A (en) | 1990-07-30 |
| US5502561A (en) | 1996-03-26 |
| EP0359681A2 (en) | 1990-03-21 |
| DE68924749T2 (en) | 1996-07-04 |
| US5434667A (en) | 1995-07-18 |
| EP0359681A3 (en) | 1990-09-12 |
Similar Documents
| Publication | Publication Date | Title |
|---|---|---|
| EP0359681B1 (en) | Characterization of particles by modulated dynamic light scattering | |
| CA1138218A (en) | Material-testing method and apparatus | |
| EP0102726B1 (en) | Method and apparatus for characterizing microparticles or measuring their response to their environment | |
| Pusey et al. | Intensity fluctuation spectroscopy of laser light scattered by solutions of spherical viruses. R17, Q. beta., BSV, PM2, and T7. I. Light-scattering technique | |
| Schärtl | Light scattering from polymer solutions and nanoparticle dispersions | |
| Lanni et al. | Modulation detection of fluorescence photobleaching recovery | |
| US7294513B2 (en) | Method and apparatus for characterizing solutions of small particles | |
| CA1072362A (en) | Method for determining the volume and the volume distribution of suspended small particles | |
| US3870612A (en) | Analysis for polymer mixtures in solution utilizing electrophoretic light scattering apparatus | |
| JPH03170844A (en) | Method and apparatus for measuring distribution of particle size | |
| Kratohvil | Light scattering | |
| JPS61501527A (en) | Method and apparatus using electrophoretic light scattering | |
| JP2014524581A (en) | Dual mode characterization of fine particles | |
| Marx et al. | Size and refractive index determination of single polystyrene spheres | |
| US20040017568A1 (en) | Absolute measurement centrifuge | |
| Cooper et al. | Diffusion coefficients of mixed micelles of Triton X-100 and sphingomyelin and of sonicated sphingomyelin liposomes, measured by autocorrelation spectroscopy of Rayleigh scattered light | |
| US3732014A (en) | Electromagnetic radiation apparatus for analyzing small particles | |
| US4828388A (en) | Method of measuring concentration of substances | |
| Hirschfeld et al. | Virometer: an optical instrument for visual observation, measurement and classification of free viruses. | |
| EP0853760B1 (en) | Method and apparatus for measuring particle size at low concentration | |
| Nemoto et al. | Dynamic light scattering instrument with a time interval digitizer | |
| US4696571A (en) | Suspended sediment sensor | |
| Babick et al. | Characterisation of colloidal suspensions | |
| Salmeen et al. | Hydrodynamic diameters of RNA tumor viruses. Studies by laser beat frequency light scattering spectroscopy of avian myeloblastosis and Rauscher murine leukemia viruses | |
| Sellen | Light scattering Rayleigh linewidth measurements on some globular protein solutions |
Legal Events
| Date | Code | Title | Description |
|---|---|---|---|
| PUAI | Public reference made under article 153(3) epc to a published international application that has entered the european phase |
Free format text: ORIGINAL CODE: 0009012 |
|
| AK | Designated contracting states |
Kind code of ref document: A2 Designated state(s): DE FR GB |
|
| PUAL | Search report despatched |
Free format text: ORIGINAL CODE: 0009013 |
|
| AK | Designated contracting states |
Kind code of ref document: A3 Designated state(s): DE FR GB |
|
| 17P | Request for examination filed |
Effective date: 19901222 |
|
| 17Q | First examination report despatched |
Effective date: 19920715 |
|
| GRAA | (expected) grant |
Free format text: ORIGINAL CODE: 0009210 |
|
| AK | Designated contracting states |
Kind code of ref document: B1 Designated state(s): DE FR GB |
|
| REF | Corresponds to: |
Ref document number: 68924749 Country of ref document: DE Date of ref document: 19951214 |
|
| ET | Fr: translation filed | ||
| PLBE | No opposition filed within time limit |
Free format text: ORIGINAL CODE: 0009261 |
|
| STAA | Information on the status of an ep patent application or granted ep patent |
Free format text: STATUS: NO OPPOSITION FILED WITHIN TIME LIMIT |
|
| 26N | No opposition filed | ||
| PGFP | Annual fee paid to national office [announced via postgrant information from national office to epo] |
Ref country code: DE Payment date: 19990927 Year of fee payment: 11 |
|
| PGFP | Annual fee paid to national office [announced via postgrant information from national office to epo] |
Ref country code: GB Payment date: 20000807 Year of fee payment: 12 |
|
| PGFP | Annual fee paid to national office [announced via postgrant information from national office to epo] |
Ref country code: FR Payment date: 20000905 Year of fee payment: 12 |
|
| PG25 | Lapsed in a contracting state [announced via postgrant information from national office to epo] |
Ref country code: DE Free format text: LAPSE BECAUSE OF NON-PAYMENT OF DUE FEES Effective date: 20010601 |
|
| PG25 | Lapsed in a contracting state [announced via postgrant information from national office to epo] |
Ref country code: GB Free format text: LAPSE BECAUSE OF NON-PAYMENT OF DUE FEES Effective date: 20010911 |
|
| GBPC | Gb: european patent ceased through non-payment of renewal fee |
Effective date: 20010911 |
|
| PG25 | Lapsed in a contracting state [announced via postgrant information from national office to epo] |
Ref country code: FR Free format text: LAPSE BECAUSE OF NON-PAYMENT OF DUE FEES Effective date: 20020531 |
|
| REG | Reference to a national code |
Ref country code: FR Ref legal event code: ST |