WO2025013249A1 - 品質異常要因分析支援システム - Google Patents
品質異常要因分析支援システム Download PDFInfo
- Publication number
- WO2025013249A1 WO2025013249A1 PCT/JP2023/025756 JP2023025756W WO2025013249A1 WO 2025013249 A1 WO2025013249 A1 WO 2025013249A1 JP 2023025756 W JP2023025756 W JP 2023025756W WO 2025013249 A1 WO2025013249 A1 WO 2025013249A1
- Authority
- WO
- WIPO (PCT)
- Prior art keywords
- quality
- data
- quality abnormality
- factor estimation
- abnormality
- Prior art date
- Legal status (The legal status is an assumption and is not a legal conclusion. Google has not performed a legal analysis and makes no representation as to the accuracy of the status listed.)
- Pending
Links
Images






Classifications
-
- B—PERFORMING OPERATIONS; TRANSPORTING
- B21—MECHANICAL METAL-WORKING WITHOUT ESSENTIALLY REMOVING MATERIAL; PUNCHING METAL
- B21B—ROLLING OF METAL
- B21B38/00—Methods or devices for measuring, detecting or monitoring specially adapted for metal-rolling mills, e.g. position detection, inspection of the product
-
- B—PERFORMING OPERATIONS; TRANSPORTING
- B21—MECHANICAL METAL-WORKING WITHOUT ESSENTIALLY REMOVING MATERIAL; PUNCHING METAL
- B21C—MANUFACTURE OF METAL SHEETS, WIRE, RODS, TUBES, PROFILES OR LIKE SEMI-MANUFACTURED PRODUCTS OTHERWISE THAN BY ROLLING; AUXILIARY OPERATIONS USED IN CONNECTION WITH METAL-WORKING WITHOUT ESSENTIALLY REMOVING MATERIAL
- B21C51/00—Measuring, gauging, indicating, counting, or marking devices specially adapted for use in the production or manipulation of material in accordance with subclasses B21B - B21F
Definitions
- This disclosure relates to a quality abnormality cause analysis support system.
- this disclosure relates to a quality abnormality cause analysis support system that supports the analysis of the causes of quality abnormalities when products such as steel plates manufactured in a rolling plant are determined to have quality abnormalities.
- Patent Document 1 discloses a manufacturing process abnormality determination device.
- Products that are determined to have quality abnormalities are sold as low-grade materials or disposed of, resulting in reduced production efficiency.
- a quality abnormality occurs, it is necessary to determine its characteristics, analyze and investigate the causes, and determine and implement measures to prevent recurrence, such as changing operating conditions or control settings.
- Patent Document 2 discloses a system for estimating the cause of quality abnormalities.
- Patent Document 2 a group of products with similar input information conditions during manufacturing can be found, and quality abnormalities can be detected in advance based on whether the output results of the group of products match the trends.
- the accuracy of predictive calculations for a target product can be improved based on the difference between the representative value of the output results of a group of products with similar input information conditions and the predicted result calculated based on the input information of the target product.
- Patent Document 2 focuses on detecting quality abnormalities for individual product manufacturing conditions and setting conditions and analyzing their causes. As a result, Patent Document 2 is unable to determine the longitudinal position of the product at which the quality abnormality occurred. This is because products are long in the longitudinal direction, and the amount of information in the time-series data (performance data) is too great, so it is common to detect quality abnormalities by compressing the time-series data. For this reason, when a quality abnormality occurs, it is necessary to identify the location where the quality abnormality occurred and then analyze the cause of the identified location.
- the present disclosure has been made to solve the problems described above.
- the purpose of the present disclosure is to provide a quality abnormality cause analysis support system that, when a product is determined to have a quality abnormality, is capable of displaying the position in the longitudinal direction of the product at which the quality abnormality has occurred, as well as the cause of the occurrence.
- the first aspect relates to a quality abnormality factor analysis support system.
- the quality abnormality factor analysis support system includes a data storage unit, a quality abnormality factor estimation calculation unit, and a display information generation unit.
- the data storage unit stores the manufacturing conditions of products manufactured in a rolling plant, the setting conditions of equipment installed in the rolling plant, and time-series data at the time of manufacturing as performance data acquired from measuring equipment installed in the rolling plant.
- the quality abnormality factor estimation calculation unit calculates a quality evaluation value from quality data related to the product quality of a product selected from the time-series data at the time of manufacturing, and determines an abnormal product or product group whose calculated quality evaluation value exceeds an allowable range as an abnormal product, and acquires a quality abnormality part that exceeds the allowable range of the abnormal product.
- the quality abnormality factor estimation calculation unit constructs a quality abnormality factor estimation model based on time-series data related to a normal product group whose quality evaluation value is within an allowable range, or on the manufacturing conditions and setting conditions, and estimates candidate factors of quality abnormalities from the time-series data or the manufacturing conditions and setting conditions based on the constructed quality abnormality factor estimation model, and calculates the relevance of the estimated candidate factors to the quality abnormality.
- the display information generation unit generates information for displaying on the display unit the quality data of the abnormal product, the location of the quality abnormality, time series data, or the manufacturing conditions and setting conditions, and the candidate factors and relevance estimated and calculated by the quality abnormality factor estimation calculation unit.
- the second viewpoint has the following feature in addition to the first viewpoint:
- the display information generating unit generates information for displaying a list of the manufacturing conditions, setting conditions, quality evaluation values, and quality abnormality locations of the abnormal product.
- the third viewpoint has the following feature in addition to the first viewpoint:
- the display information generation unit generates information for displaying a trend chart of the quality data of the abnormal product, a trend chart of the time-series data corresponding to the most relevant factor candidate among the factor candidates estimated by the quality abnormality factor estimation calculation unit, and the location of the quality abnormality in each trend chart.
- the fourth viewpoint has the following feature in addition to the first viewpoint:
- the display information generation unit generates information for displaying a trend chart of the quality data of the abnormal product, a number of candidate factors estimated by the quality abnormality factor estimation calculation unit, the degree of association of each candidate factor, a trend chart of the time-series data corresponding to each candidate factor, and the location of the quality abnormality in each trend chart.
- the fifth viewpoint has the following feature in addition to the first viewpoint:
- the display information generating unit generates information for displaying setting conditions as candidate causes and the relevance of each setting condition to the quality abnormality for abnormal products with the same quality data and quality abnormality location.
- the sixth viewpoint has the following feature in addition to the first viewpoint:
- the quality anomaly factor estimation calculation unit uses machine learning or statistical methods as a quality anomaly factor estimation model.
- the seventh viewpoint has the following feature in addition to the first viewpoint:
- the quality anomaly factor estimation calculation unit reconstructs the quality anomaly factor estimation model every time a product is manufactured, and updates the quality anomaly factor estimation model when the prediction error of the reconstructed quality anomaly factor estimation model is smaller than the prediction error of the quality anomaly factor estimation model before reconstruction.
- the present disclosure by acquiring the quality anomaly location where the quality evaluation value of the abnormal product exceeds the allowable range, it is possible to display the position in the longitudinal direction of the product where the quality anomaly has occurred. Furthermore, by constructing a quality anomaly factor estimation model using normal data, inferring candidate factors of the quality anomaly using the constructed quality anomaly factor estimation model, and calculating the relevance of the inferred candidate factors to the quality anomaly, it is possible to display time-series data with high relevance as the cause of the quality anomaly. Therefore, it is possible to provide a quality anomaly factor analysis support system that, when a product is determined to have a quality anomaly, can display the position in the longitudinal direction of the product where the quality anomaly has occurred as well as the cause of the quality anomaly.
- FIG. 1 is a schematic diagram showing an example of a rolling plant to which a quality abnormality cause analysis support system according to a first embodiment is applied.
- 11 is a diagram showing the configuration of data collected and registered by a data storage unit.
- FIG. FIG. 2 is a diagram showing a processing flow of the quality abnormality cause analysis support system according to the first embodiment.
- FIG. 13 is a diagram illustrating an example of input and output variables of a quality anomaly cause estimation model.
- 11A to 11C are diagrams showing various screens displayed on the HMI device based on information generated by the quality information display function.
- FIG. 13 is a diagram illustrating the display contents of a steel sheet information list screen.
- 13 is a diagram showing a schematic diagram of the display contents of a screen that is popped up on the steel sheet information list screen.
- FIG. 13 is a diagram illustrating the display contents of a quality abnormality cause estimation result display screen.
- FIG. 13 is a diagram illustrating the display content of a similar quality abnormality cause inference analysis screen.
- FIG. 13 is a diagram illustrating the display contents of a quality abnormality cause/setting analysis display screen.
- FIG. 11 is a diagram showing a processing flow of a quality anomaly cause analysis support system according to the second embodiment.
- FIG. 2 illustrates an example of a hardware configuration of a quality abnormality cause analysis support system.
- FIG. 1 is a schematic diagram showing an example of a rolling plant 1 to which a quality abnormality cause analysis support system 20 according to a first embodiment is applied.
- the rolling plant 1 is, for example, a hot rolling plant having a hot rolling line, but may also be a cold rolling plant.
- the rolling plant 1 is equipped with a heating furnace 2, a roughing mill 3, a crop shear 4, a finishing mill 5, a cooling device 6, and a winder 7 as the main equipment that constitutes the hot rolling line.
- the rolling plant 1 is equipped with a conveying table (not shown) for transporting the steel plate Pr between the rolling equipment. These rolling equipment are driven by an electrical system of electric motors and actuators.
- the heating furnace 2 is configured to heat the steel plate (slab) Pr before rolling to a predetermined temperature (e.g., 1200°C).
- the roughing mill 3 has at least one rolling stand (usually 1 to 3 stands) and rolls the steel plate (slab) Pr heated in the heating furnace 2 in multiple passes in the forward direction (from upstream to downstream of the rolling line) and in the reverse direction (from downstream to upstream of the rolling line).
- the crop shear 4 cuts off defective parts of the shape at the front or tail end of the steel plate Pr with upper and lower blades based on the shape measured by a shape detector 81 described later.
- the finishing mill 5 is a tandem rolling mill equipped with, for example, seven rolling stands F1 to F7 arranged side by side in the rolling direction of the steel plate Pr.
- hot rolling command information which is a rolling plan
- the hot rolling command information includes a target plate thickness, a target plate width, a target temperature, and the like.
- the target temperatures include the target temperature at the exit of the finishing rolling mill 5 (hereinafter referred to as the “finishing exit temperature”) and the target temperature at the entry of the winding machine 7 (hereinafter referred to as the "winding temperature").
- the process control computer 11 receives hot rolling command information (rolling plan), which is the manufacturing condition, from the host computer 12, calculates design data including the setting values of each rolling equipment to be controlled, and transmits the calculated design data to the rolling plant 1, thereby controlling the various rolling equipment.
- the quality abnormality cause analysis support system 20 collects data (rolling data) exchanged between each rolling equipment in the rolling plant line 1 and the control computer 12, calculates information to support quality abnormality cause analysis using the collected rolling data, and provides it to users (including administrators).
- the data storage unit 21 has the function of collecting rolling data and storing it in the database DB.
- the rolling data includes the aforementioned hot rolling command information, setting data, and performance data.
- the quality abnormality factor estimation calculation unit 22 uses the rolling data stored in the data storage unit 21 to evaluate product quality and calculate (calculate) information to support analysis of quality abnormality factors based on the evaluation results.
- the display information generation unit 23 causes the HMI device 13, which serves as a display unit, to display the calculation results of the quality abnormality factor estimation calculation unit 22. The operator checks and operates the information (calculation results) displayed on the HMI device 13 and performs analysis work.
- FIG. 2 is a diagram showing the configuration of data collected and registered by the data storage unit 21.
- the information collected by the data storage unit 21 includes, for example, information assigned to each steel plate Pr, such as hot rolling command information and setting data, and time series data obtained from moment to moment for the rolling of the steel plate Pr, such as performance data, and these pieces of information and data are stored as a database DB, linked to the manufacturing number of the steel plate Pr (hereinafter referred to as "coil ID") and the extraction time of the steel plate Pr from the heating furnace 2.
- the database DB is provided inside the quality abnormality factor analysis support system 20, but the database DB may be provided outside the quality abnormality factor analysis support system 20, and information and data may be exchanged via a network connection.
- FIG. 3 is a diagram showing the processing flow of the quality abnormality factor analysis support system 20 according to the first embodiment.
- the quality abnormality factor estimation calculation unit 22 first acquires quality data xi used to evaluate the quality of the steel sheet Pr manufactured in the rolling plant 1, such as the finishing exit plate thickness, finishing exit plate width, shape, finishing exit temperature, and coiler entry temperature, selected from the performance data, which is the time-series data described above, from the data storage unit 21 (database DB) (step S1), and calculates a quality evaluation value (step S2).
- quality data xi used to evaluate the quality of the steel sheet Pr manufactured in the rolling plant 1, such as the finishing exit plate thickness, finishing exit plate width, shape, finishing exit temperature, and coiler entry temperature, selected from the performance data, which is the time-series data described above, from the data storage unit 21 (database DB) (step S1), and calculates a quality evaluation value (step S2).
- Each of these quality data xi has a tolerance range, which is a reference value, and the quality of the steel sheet Pr is evaluated based on this tolerance range.
- the quality evaluation value is calculated, for example, by the following formula
- performance A indicates any one of the quality evaluation values of the steel sheet Pr, such as the finishing exit thickness, finishing exit width, shape, finishing exit temperature, and coiler entry temperature.
- I s indicates the quality evaluation value calculation target start point for the steel sheet longitudinal position
- I L indicates the quality evaluation value calculation target end point for the steel sheet longitudinal position.
- the longitudinal direction of the steel sheet Pr corresponds to the rolling direction and the conveying direction.
- xi indicates the value of quality data at point i from I s to I L.
- Tolerance indicates any one of the quality standard values, such as the finishing exit thickness, finishing exit width, shape, finishing exit temperature, and coiler entry temperature.
- the start and end points for calculating the quality evaluation value in the longitudinal direction of the steel plate Pr are often taken as the length excluding the non-steady deformation portions at the longitudinal leading and trailing ends of the steel plate Pr (so-called leading and trailing end cuts).
- the length excluding the non-steady deformation portions at the longitudinal leading and trailing ends of the steel plate Pr may be further divided into several sections, and the quality evaluation value may be calculated for each section.
- the quality evaluation value calculated in step S2 is stored by the data storage unit 21 in association with the coil ID of the steel sheet Pr (step S3).
- it is determined whether the calculated quality evaluation value satisfies the allowable range as a reference value (step S4). If the quality evaluation value satisfies the allowable range, it is registered as normal data of the quality, and if not, it is registered as abnormal data of the quality by linking it to the coil ID of the steel sheet Pr and registering a label (step S5) and storing it by the data storage unit 21.
- the label of the abnormal quality data is not necessarily assigned to distinguish it from normal data, but may be registered as a label according to the characteristics of the abnormality.
- the finishing delivery plate thickness exceeds the allowable range
- it may be registered as information such as whether it is thicker than the upper limit value or thinner than the lower limit value, and further, how far it is out of the allowable range.
- the measurement point that exceeds the allowable range i.e., the position and range in the longitudinal direction of the steel sheet Pr
- a label may be registered as an index (indicator) based on a predetermined numerical range for the degree of deviation from the upper or lower limit of the tolerance range, or for the position or range of the measurement point that exceeds the tolerance range.
- step S6 It is determined whether or not the number of steel sheets Pr labeled as normal data for the quality of the target has been collected by an arbitrary number N L , that is, whether or not a certain number N L has been collected in the normal data group (step S6). If the number exceeds the certain number N L , a quality abnormality factor estimation model (hereinafter also referred to as "model") for the quality of the target is constructed (step S7), the constructed model is stored by the data storage unit 21 (step S8), and this routine is temporarily terminated. If the above-mentioned quality evaluation value exceeds the allowable range after the model construction, it is determined as NO in the above step S4, and YES in step S9, and the routine proceeds to step S10.
- model quality abnormality factor estimation model
- step S10 the abnormality factor for the quality of the target is estimated using the quality abnormality factor estimation model. That is, the quality abnormality factor estimation model estimates candidate factors of the quality abnormality, and the relevance of each estimated candidate factor with the quality abnormality is calculated.
- the actual data estimated to be candidate factors related to the quality abnormality of the target is quantified as “relevance,” and each item of actual data and the calculated relevance are linked to the coil ID of the steel sheet Pr, etc., and stored in the data storage unit 21.
- the quality anomaly factor estimation model is constructed only when the above-mentioned conditions are met, and thereafter, as will be described in the second embodiment below, it can be constructed at any timing determined by the user (including the administrator) of the quality anomaly factor analysis support system 20.
- the above-mentioned quality anomaly factor estimation model may use, for example, Auto Encoder (AE), Random Forest (RF), Support Vector Regression (SVR), etc., which fall under the category of machine learning, or a method utilizing statistical methods.
- AE Auto Encoder
- RF Random Forest
- SVR Support Vector Regression
- NN the algorithms NN, RF, and SVR are widely known, so they will be briefly explained below.
- AE is a type of neural network model (hereafter referred to as "NN model"), and is a method for detecting anomalies from the deviation between input and output variables using an NN model trained only on a group of data (hereafter referred to as "normal data”) that has been labeled as normal data so as to output a variable similar to the input variable.
- an NN model has a three-layer structure consisting of an input layer, an intermediate layer, and an output layer, and it is also possible to increase the number of intermediate layers. By adding multiple intermediate layers, it can also be used for deep learning.
- Each layer is composed of one or more neurons, and the neurons in each layer have weight coefficients and bias values and are connected to each other.
- an activation function is defined for one neuron, and it is designed so that the output state changes depending on the level of the input value.
- RF is a method that connects multiple decision trees, tree-structured weak learners whose output is determined by the conditions of input variables, in parallel, and predicts the final output by taking a majority vote or averaging the outputs of each.
- SVR is a method that applies the support vector machine algorithm, which determines the boundary line or hyperplane that divides data into two groups, to regression problems.
- a model that predicts and calculates output variables from input variables must be constructed using a set of data prepared for learning.
- a quality anomaly factor estimation model is constructed using the time-series data of steel plates that have been labeled as normal data as described above, or the setting data of steel plates that have been labeled as normal data.
- ⁇ j is a score indicating the relevance to the input variable j
- ⁇ j ' is a score indicating the standardized relevance.
- the score ⁇ j indicating the relevance calculated from the normal data used in learning can be used to define the abnormality determination criterion.
- the abnormality determination criterion can be any numerical value, and for example, a method such as the top eighth of the scores indicating the relevance calculated from the normal data used in learning sorted in descending order may be adopted, but is not limited to this.
- Data related to quality abnormality is detected by deviation from this abnormality determination criterion. In the case of AE, this deviation degree Abnormality j is taken as the "degree of relevance" in estimating the quality abnormality cause, and is taken as shown in the following formula (7).
- the root mean square error between the input variable and the output variable, or the root mean square error between the actual target quality data and the predicted output variable may be defined as the loss function to build a model with improved prediction performance for normal data, and the output of the data input thereafter may be evaluated to detect data related to quality abnormalities.
- SHAP Silicon Additive Explanation
- SHAP is a well-known method, it will not be mentioned in detail here, but will be explained briefly.
- SHAP can express the degree to which each input variable contributed to the prediction result using the average marginal contribution (Shapley value) of players in a cooperative game in game theory. As in this case, when abnormal data is input into a model built using only normal data, the contribution of abnormal data items becomes large, and it can be estimated as a quality abnormality factor.
- a representative waveform is constructed for each data item of performance data and quality data related to the target quality data in the above-mentioned normal data, and the quality anomaly factor can be estimated by checking the similarity between the representative waveform and the subsequent detection target data.
- the representative waveform may be, for example, the average value of each point, as shown in the following formula (8).
- rep j,i is the data of the i-th point of the representative waveform in data item j.
- the similarity to the representative waveform may be expressed as, for example, the root mean square error. In other words, the larger the value, the lower the similarity can be evaluated.
- Standardization may be calculated using the maximum and minimum values of the normal data, or from the average value and standard deviation.
- the number of measurement points i.e., the length of the steel plate at the measurement location, often differs for each data item of the quality data and the performance data related to the quality data. For this reason, the number of measurement points may be interpolated by approximation, and the length of the steel plate may also be standardized.
- the display information generating unit 23 supports the analysis of quality abnormality factors using the information in which the above-mentioned relevance is registered and the performance data associated with the steel plate Pr.
- Various screens generated by the display information generating unit 23 are shown in FIG. 5.
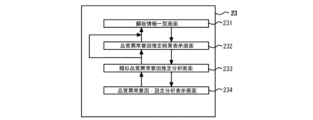
- FIG. 5 is a diagram showing various screens displayed on the HMI device 13 based on information generated by the display information generating unit 23.
- the display information generating unit 23 configures information for displaying a steel plate information list screen 231, a quality abnormality factor estimation result display screen 232, a similar quality abnormality factor estimation analysis screen 233, and a quality abnormality factor/settings analysis display screen 234, and displays these screens 231 to 234 on the HMI device 13.
- the steps involved in supporting quality abnormality factor analysis will be explained step by step.
- the steel plate information list screen 231 displays the main product information such as the coil ID and target thickness of the steel plate, and the quality evaluation value.
- FIG. 6 is a diagram showing the display contents of the steel plate information list screen 231.
- the main product information such as the coil ID and target thickness of the steel plate Pr described above, and the quality evaluation value are displayed in a table format with one steel plate Pr (one coil ID) per line.
- the line of the steel plate Pr whose quality evaluation value exceeds the allowable range, such as coil ID "xxx2” may be highlighted by changing the background color, etc.
- the cell color or text color of the quality item for example, quality A "A2" whose quality evaluation value exceeds the allowable range may be highlighted.
- FIG. 7 is a diagram showing the display contents of the screen 231a popped up on the steel sheet information list screen 231.
- the quality data of the target "quality A” and the performance data related to the quality of the target "data b" that has the highest relevance among the quality abnormality factor estimations are displayed as a trend chart.
- the part where the quality of the target exceeds the allowable range is highlighted by shading in the figure, and it can be confirmed where (at what position) of the steel sheet Pr the allowable range is exceeded.
- this pop-up screen 231a only the data b with the highest relevance is displayed as the target quality abnormality factor, but by pressing the details display button at the bottom of this pop-up screen 231a, the screen transitions to the quality abnormality factor estimation result display screen 232 shown in FIG. 8, where the details of the quality abnormality factor estimation result for the target quality of the steel sheet Pr can be confirmed.
- the quality abnormality factor estimation result display screen 232 displays details of the quality abnormality factor estimation result for the target quality A of the steel plate Pr (coil ID: xxx2) selected on the steel plate information list screen 231 described above.
- Major product information such as the coil ID and target plate thickness of the steel plate Pr, a list of quality evaluation values, and a trend chart of the target quality data are displayed.
- the performance data related to the target quality A with the highest relevance is displayed as a trend chart.
- the performance data related to the target quality A with the highest relevance is displayed in ascending order of relevance, so that data that can be considered as a quality abnormality factor can be confirmed early.
- data with low relevance can be confirmed in order by scrolling on the screen.
- the pop-up screen 231a of the steel plate information list screen 231 described above the parts of the target quality A that exceed the allowable range are highlighted in a shading pattern in the figure, so that it is possible to confirm where in the steel plate the allowable range is exceeded. Since the highly relevant performance data and the areas that exceed the tolerance range can be confirmed at a glance, if the user is an experienced person who has been involved in hot rolling lines for a long time, they can easily arrive at measures to improve quality. Even if the user is not an experienced person, the highly relevant data is displayed at the top, so it can lead to early next actions such as reporting problems and exchanging measures.
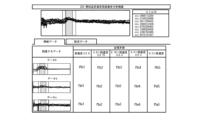
- FIG. 9 is a diagram showing the display contents of the similar quality abnormality factor estimation analysis screen 233.
- the tab button for "performance data" is pressed.
- the similar quality abnormality factor estimation analysis screen 233 it is possible to compare and analyze the quality abnormality factor estimation results with other steel sheets Pr in which similar quality abnormality characteristics are registered as the steel sheet Pr selected on the steel sheet information list screen 231 described above.
- the target quality data of the steel sheets in which similar quality abnormality characteristics are registered are displayed together as trend charts in the same graph.
- the coil IDs of each steel sheet are also displayed at the same time, and by pressing these, a function specialized for visualization may be added, such as highlighting only the trend chart of the steel sheet Pr in question.
- performance data related to the target quality abnormality is displayed as a trend chart.
- the points in the trend chart of the target quality data and related performance data where the target quality tolerance range is exceeded are highlighted by shading in the figure, but the range of the relevant points may also be displayed in color, for example, by minimum, maximum, or average values.
- the distribution of the relevance for each of the data b, d, and a is also displayed in a list in the same way.
- the distribution of the relevance for each data is displayed in table format as the number of steel plates that appear, but the highest values may also be highlighted by using a darker background color, for example. Alternatively, it may be displayed as a histogram chart.
- FIG. 10 is a diagram showing the display contents of the quality abnormality factor/settings analysis display screen 234.
- the quality abnormality factor/settings analysis display screen 234 allows analysis of the setting data as well as performance data related to the target quality abnormality. For example, it is possible to support analysis of the target quality abnormality and the setting data by displaying a chart of the relevance of setting data such as design values of 4, 7, 2, 8, and 5 as candidate factors in the form of a box-and-whisker plot.
- the quality anomaly factor analysis support system that, when a product is determined to have a quality anomaly, can display the position in the longitudinal direction of the product where the quality anomaly has occurred as well as the cause of the quality anomaly.
- FIG. 11 is a diagram showing the processing flow of the quality abnormality factor analysis support system according to embodiment 2.
- the routine shown in FIG. 11 is started each time rolling is completed.
- quality data xi is acquired (step S1), and a quality evaluation value is calculated (step S2). Then, it is determined whether the quality evaluation value is outside the allowable range, which is a reference value (step S4).
- the processing up to this point is the same as in embodiment 1.
- step S5 if the quality evaluation value of the steel plate Pr is determined to be within the allowable range in step S5, a label is registered as normal data (step S5), and new data for the steel plate Pr is added to the normal data used when the previous model was constructed, to reconstruct the quality abnormality factor estimation model (step S12).
- step S13 the error calculated from the loss function of the quality abnormality factor estimation model reconstructed in step S12 is compared with the error calculated from the loss function of the previously constructed model (step S13), and if the error of the reconstructed model is small, the reconstructed quality abnormality factor estimation model is saved (step S14).
- the quality abnormality factor estimation model can be updated by reconstructing the model each time rolling is completed. This improves the reproducibility of the input variables or the prediction performance of the target quality data, and makes it possible to estimate quality abnormality factors using a quality abnormality factor estimation model that is always suited to the latest state of the rolling plant 1. Furthermore, if the prediction error of the reconstructed quality abnormality factor estimation model is smaller than the prediction error of the quality abnormality factor estimation model currently in use before reconstruction, the quality abnormality factor estimation model is updated (saved in the data storage unit 21), thereby preventing a decrease in accuracy due to model reconstruction.
- the model is reconstructed each time rolling is completed, but this is not limited to this, and the user can set the timing of reconstruction as appropriate. For example, if the user feels something is wrong when checking the quality abnormality factor estimation result display screen 232, the model can be reconstructed. This can improve accuracy.
- FIG. 12 is a diagram showing an example of the hardware configuration of the quality abnormality factor analysis support system 20.
- the above-mentioned functions of the quality abnormality factor analysis support system 20 can be realized by the processing circuit shown in FIG. 12.
- the processing circuit 20 may be dedicated hardware 20a.
- the processing circuit may include a processor 20b and a memory 20c.
- the processing circuit may be partially formed as dedicated hardware 20a and further include a processor 20b and a memory 20c.
- a part of the processing circuit 20 is formed as dedicated hardware 20a, and the processing circuit 20 also includes a processor 20b and a memory 20c.
- the processing circuit 20 may be at least one dedicated hardware 20a.
- the processing circuit 20 corresponds to, for example, a single circuit, a composite circuit, a programmed processor, a parallel programmed processor, an ASIC, an FPGA, or a combination of these.
- the processing circuit 20 may include at least one processor 20b and at least one memory 20c.
- each function of the quality abnormality factor analysis support system 20 is realized by software, firmware, or a combination of software and firmware.
- the software and firmware are written as programs and stored in the memory 20c.
- the processor 20b realizes each function of the quality abnormality factor analysis support system 20 by reading and executing the programs stored in the memory 20c.
- the processor 20b is also called a CPU (Central Processing Unit), central processing unit, processing unit, arithmetic unit, microprocessor, microcomputer, or DSP.
- the memory 20c corresponds to a storage device such as a non-volatile or volatile semiconductor memory such as a RAM, ROM, flash memory, EPROM, or EEPROM.
- the memory 20c can also serve as a database DB. In this way, the processing circuit 20 can realize each function of the quality abnormality factor analysis support system 20 by hardware, software, firmware, or a combination of these.
- the present invention is not limited to the above embodiment, and various modifications can be made without departing from the spirit of the present invention.
- the information generated by the display information generating unit 23 is sent to the HMI device 13, and the HMI device 13 displays various screens 231, 232, 233, and 234, but a display unit may be provided inside the quality anomaly cause analysis support system 20, and various screens may be displayed on this display unit.
- 1...Rolling plant 13...HMI device (display unit), 20...Quality abnormality factor analysis support system, processing circuit, 20a...Dedicated hardware, 20b...Processor, 20c...Memory, 21...Data storage unit, 22...Quality abnormality factor estimation calculation unit, 23...Display information generation unit, 231...Steel plate information list screen, 232...Quality abnormality factor estimation result display screen, 233...Similar quality abnormality factor estimation analysis screen, 234...Quality abnormality factor/setting analysis display screen
Landscapes
- Engineering & Computer Science (AREA)
- Mechanical Engineering (AREA)
- General Factory Administration (AREA)
Priority Applications (3)
| Application Number | Priority Date | Filing Date | Title |
|---|---|---|---|
| PCT/JP2023/025756 WO2025013249A1 (ja) | 2023-07-12 | 2023-07-12 | 品質異常要因分析支援システム |
| JP2024549733A JP7715298B2 (ja) | 2023-07-12 | 2023-07-12 | 品質異常要因分析支援システム |
| CN202380053630.2A CN119630497A (zh) | 2023-07-12 | 2023-07-12 | 品质异常要因分析支援系统 |
Applications Claiming Priority (1)
| Application Number | Priority Date | Filing Date | Title |
|---|---|---|---|
| PCT/JP2023/025756 WO2025013249A1 (ja) | 2023-07-12 | 2023-07-12 | 品質異常要因分析支援システム |
Publications (1)
| Publication Number | Publication Date |
|---|---|
| WO2025013249A1 true WO2025013249A1 (ja) | 2025-01-16 |
Family
ID=94214816
Family Applications (1)
| Application Number | Title | Priority Date | Filing Date |
|---|---|---|---|
| PCT/JP2023/025756 Pending WO2025013249A1 (ja) | 2023-07-12 | 2023-07-12 | 品質異常要因分析支援システム |
Country Status (3)
| Country | Link |
|---|---|
| JP (1) | JP7715298B2 (https=) |
| CN (1) | CN119630497A (https=) |
| WO (1) | WO2025013249A1 (https=) |
Citations (5)
| Publication number | Priority date | Publication date | Assignee | Title |
|---|---|---|---|---|
| JPH08164409A (ja) * | 1994-10-14 | 1996-06-25 | Furukawa Electric Co Ltd:The | 熱間圧延における板厚精度予測方法 |
| JPH10122917A (ja) * | 1996-10-23 | 1998-05-15 | Nippon Steel Corp | 設備及び製品プロセス異常状態の診断方法及び診断装置 |
| JP2000263113A (ja) * | 1999-03-12 | 2000-09-26 | Mitsubishi Electric Corp | 圧延機における異常圧延状態修正方法および装置 |
| JP2000315111A (ja) * | 1999-04-30 | 2000-11-14 | Nippon Steel Corp | 設備及び製品プロセス異常状態の診断方法及び装置 |
| JP2013029916A (ja) * | 2011-07-27 | 2013-02-07 | Toshiba Mitsubishi-Electric Industrial System Corp | 製品欠陥要因分析装置 |
Family Cites Families (1)
| Publication number | Priority date | Publication date | Assignee | Title |
|---|---|---|---|---|
| JP7031713B1 (ja) * | 2020-10-22 | 2022-03-08 | Jfeスチール株式会社 | 異常診断モデルの構築方法、異常診断方法、異常診断モデルの構築装置および異常診断装置 |
-
2023
- 2023-07-12 JP JP2024549733A patent/JP7715298B2/ja active Active
- 2023-07-12 CN CN202380053630.2A patent/CN119630497A/zh active Pending
- 2023-07-12 WO PCT/JP2023/025756 patent/WO2025013249A1/ja active Pending
Patent Citations (5)
| Publication number | Priority date | Publication date | Assignee | Title |
|---|---|---|---|---|
| JPH08164409A (ja) * | 1994-10-14 | 1996-06-25 | Furukawa Electric Co Ltd:The | 熱間圧延における板厚精度予測方法 |
| JPH10122917A (ja) * | 1996-10-23 | 1998-05-15 | Nippon Steel Corp | 設備及び製品プロセス異常状態の診断方法及び診断装置 |
| JP2000263113A (ja) * | 1999-03-12 | 2000-09-26 | Mitsubishi Electric Corp | 圧延機における異常圧延状態修正方法および装置 |
| JP2000315111A (ja) * | 1999-04-30 | 2000-11-14 | Nippon Steel Corp | 設備及び製品プロセス異常状態の診断方法及び装置 |
| JP2013029916A (ja) * | 2011-07-27 | 2013-02-07 | Toshiba Mitsubishi-Electric Industrial System Corp | 製品欠陥要因分析装置 |
Also Published As
| Publication number | Publication date |
|---|---|
| CN119630497A (zh) | 2025-03-14 |
| JPWO2025013249A1 (https=) | 2025-01-16 |
| JP7715298B2 (ja) | 2025-07-30 |
Similar Documents
| Publication | Publication Date | Title |
|---|---|---|
| JP6791261B2 (ja) | 圧延設備の異常診断の方法及び装置 | |
| JP7044175B2 (ja) | 異常判定支援装置 | |
| DE102022201761A1 (de) | Verfahren, System und Speichermedium zur automatischen Diagnose vonVorrichtungen | |
| JP6572979B2 (ja) | 製造設備診断支援装置及び製造設備診断支援方法 | |
| JP6702297B2 (ja) | プロセスの異常状態診断方法および異常状態診断装置 | |
| JP6662222B2 (ja) | 製造プロセスの異常状態診断方法及び異常状態診断装置 | |
| JP7070796B2 (ja) | 絞り発生予測システム | |
| JP5195331B2 (ja) | 製造プロセスにおける品質予測装置、予測方法、プログラム及びコンピュータ読み取り可能な記録媒体 | |
| CN113780852B (zh) | 一种板带轧制过程质量缺陷的诊断方法 | |
| JPH08117827A (ja) | 圧延装置 | |
| JP7715298B2 (ja) | 品質異常要因分析支援システム | |
| JP7135962B2 (ja) | 鋼板の仕上出側温度制御方法、鋼板の仕上出側温度制御装置、及び鋼板の製造方法 | |
| KR101840419B1 (ko) | 조질압연기 및 형상교정기 설비장애 예지 정비 시스템 및 방법 | |
| JP6885321B2 (ja) | プロセスの状態診断方法及び状態診断装置 | |
| JP4696775B2 (ja) | 板幅制御方法および装置 | |
| CN118786397A (zh) | 原因推理装置、原因推理方法、原因推理系统及终端装置 | |
| JP7708318B2 (ja) | 圧延設備機器の劣化診断装置 | |
| JP7800785B1 (ja) | 金属材料の品質予測モデル生成方法、金属材料の品質予測方法、金属材料の品質影響要因推定方法、金属材料の製造方法、金属材料の品質予測モデル生成装置、金属材料の品質予測装置および金属材料の品質影響要因推定装置 | |
| JPWO2025013249A5 (https=) | ||
| JP7754337B1 (ja) | 鉄鋼プラントのメンテナンス支援システム | |
| WO2025263145A1 (ja) | 異常診断方法および異常診断装置 | |
| WO2026048122A1 (ja) | 金属材料の品質予測モデル生成方法、金属材料の品質予測方法、金属材料の品質影響要因推定方法、金属材料の製造方法、金属材料の品質予測モデル生成装置、金属材料の品質予測装置および金属材料の品質影響要因推定装置 | |
| TW202609480A (zh) | 金屬材料的品質預測模型生成方法、金屬材料的品質預測方法、金屬材料的品質影響因子推定方法、金屬材料的製造方法、金屬材料的品質預測模型生成裝置、金屬材料的品質預測裝置及金屬材料的品質影響因子推定裝置 | |
| JPWO2024189790A5 (https=) | ||
| WO2024189790A1 (ja) | 圧延製品の材質特性予測装置 |
Legal Events
| Date | Code | Title | Description |
|---|---|---|---|
| WWE | Wipo information: entry into national phase |
Ref document number: 2024549733 Country of ref document: JP |
|
| WWE | Wipo information: entry into national phase |
Ref document number: 202517002981 Country of ref document: IN |
|
| WWE | Wipo information: entry into national phase |
Ref document number: 202380053630.2 Country of ref document: CN |
|
| 121 | Ep: the epo has been informed by wipo that ep was designated in this application |
Ref document number: 23945123 Country of ref document: EP Kind code of ref document: A1 |
|
| WWP | Wipo information: published in national office |
Ref document number: 202380053630.2 Country of ref document: CN |
|
| NENP | Non-entry into the national phase |
Ref country code: DE |