WO2025004975A1 - 架橋反応シミュレーション装置、および内部気泡推定装置 - Google Patents
架橋反応シミュレーション装置、および内部気泡推定装置 Download PDFInfo
- Publication number
- WO2025004975A1 WO2025004975A1 PCT/JP2024/022487 JP2024022487W WO2025004975A1 WO 2025004975 A1 WO2025004975 A1 WO 2025004975A1 JP 2024022487 W JP2024022487 W JP 2024022487W WO 2025004975 A1 WO2025004975 A1 WO 2025004975A1
- Authority
- WO
- WIPO (PCT)
- Prior art keywords
- reaction
- model
- polymer
- crosslinking reaction
- target
- Prior art date
- Legal status (The legal status is an assumption and is not a legal conclusion. Google has not performed a legal analysis and makes no representation as to the accuracy of the status listed.)
- Ceased
Links
Images



























Classifications
-
- B—PERFORMING OPERATIONS; TRANSPORTING
- B29—WORKING OF PLASTICS; WORKING OF SUBSTANCES IN A PLASTIC STATE IN GENERAL
- B29C—SHAPING OR JOINING OF PLASTICS; SHAPING OF MATERIAL IN A PLASTIC STATE, NOT OTHERWISE PROVIDED FOR; AFTER-TREATMENT OF THE SHAPED PRODUCTS, e.g. REPAIRING
- B29C35/00—Heating, cooling or curing, e.g. crosslinking or vulcanising; Apparatus therefor
- B29C35/02—Heating or curing, e.g. crosslinking or vulcanizing during moulding, e.g. in a mould
-
- B—PERFORMING OPERATIONS; TRANSPORTING
- B29—WORKING OF PLASTICS; WORKING OF SUBSTANCES IN A PLASTIC STATE IN GENERAL
- B29C—SHAPING OR JOINING OF PLASTICS; SHAPING OF MATERIAL IN A PLASTIC STATE, NOT OTHERWISE PROVIDED FOR; AFTER-TREATMENT OF THE SHAPED PRODUCTS, e.g. REPAIRING
- B29C45/00—Injection moulding, i.e. forcing the required volume of moulding material through a nozzle into a closed mould; Apparatus therefor
- B29C45/17—Component parts, details or accessories; Auxiliary operations
- B29C45/76—Measuring, controlling or regulating
-
- C—CHEMISTRY; METALLURGY
- C08—ORGANIC MACROMOLECULAR COMPOUNDS; THEIR PREPARATION OR CHEMICAL WORKING-UP; COMPOSITIONS BASED THEREON
- C08L—COMPOSITIONS OF MACROMOLECULAR COMPOUNDS
- C08L7/00—Compositions of natural rubber
-
- C—CHEMISTRY; METALLURGY
- C08—ORGANIC MACROMOLECULAR COMPOUNDS; THEIR PREPARATION OR CHEMICAL WORKING-UP; COMPOSITIONS BASED THEREON
- C08L—COMPOSITIONS OF MACROMOLECULAR COMPOUNDS
- C08L9/00—Compositions of homopolymers or copolymers of conjugated diene hydrocarbons
-
- G—PHYSICS
- G16—INFORMATION AND COMMUNICATION TECHNOLOGY [ICT] SPECIALLY ADAPTED FOR SPECIFIC APPLICATION FIELDS
- G16C—COMPUTATIONAL CHEMISTRY; CHEMOINFORMATICS; COMPUTATIONAL MATERIALS SCIENCE
- G16C20/00—Chemoinformatics, i.e. ICT specially adapted for the handling of physicochemical or structural data of chemical particles, elements, compounds or mixtures
- G16C20/10—Analysis or design of chemical reactions, syntheses or processes
Definitions
- This disclosure relates to a cross-linking reaction simulation device and an internal bubble estimation device.
- crosslinking polymers An example of such a polymer is rubber. Rubber is made by adding sulfur or other crosslinking agents, vulcanization accelerators, etc. to the raw rubber and then heating it, forming a three-dimensional network-like crosslinked structure between or within the rubber molecular chains.
- Non-Patent Document 1 A technique for estimating the degree of vulcanization of rubber, i.e., the reaction rate of the crosslinking reaction of rubber, is described in Non-Patent Document 1. This technique estimates the degree of vulcanization from the temperature history of the rubber based on the Arrhenius equation, and estimates the appropriate vulcanization conditions (mold temperature, vulcanization time).
- This disclosure has been made in light of this background, and aims to provide a crosslinking reaction simulation device and an internal bubble estimation device that can appropriately estimate the setting conditions for the crosslinking reaction.
- a storage unit that stores data used in the simulation;
- a setting condition analysis unit that analyzes setting conditions related to a cross-linking reaction of a polymer part of a target workpiece model;
- a crosslinking reaction simulation device comprising:
- the storage unit is A polymer characteristic value which is a characteristic value related to a raw material polymer constituting the polymer portion of the target workpiece model;
- a target workpiece model elastic modulus which is the elastic modulus of the polymer part of the target workpiece model, a set temperature in a crosslinking reaction of the polymer part of the target workpiece model having the target workpiece model elastic modulus, and a reaction time in a crosslinking reaction of the polymer part of the target workpiece model having the target workpiece model elastic modulus are stored; and
- the setting condition analysis unit A polymer characteristic value acquisition unit that acquires the polymer characteristic value;
- a target workpiece model elastic modulus acquisition unit that acquires the target workpiece model elastic modulus;
- a relationship data acquisition unit that acquires the relationship data; and
- the setting conditions for the crosslinking reaction of the polymer portion it is possible to calculate the setting conditions for the crosslinking reaction of the polymer portion to obtain a product having the desired target work model elastic modulus from the polymer characteristic values of the raw polymer that is the subject of the crosslinking reaction.
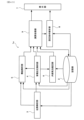
- FIG. 1 is a block diagram showing a crosslinking reaction simulation device according to embodiment 1-1.
- FIG. 13 is a schematic diagram showing details of a storage unit according to embodiment 1-1.
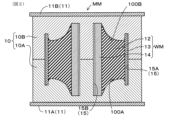
- FIG. 13 is a diagram showing a state in which a target workpiece model is placed on a molding die model in embodiment 1-1.
- FIG. 1 is a diagram showing a target workpiece model of embodiment 1-1.
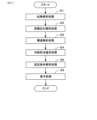
- 1 is a flowchart showing the operation of the crosslinking reaction simulation device of embodiment 1-1.
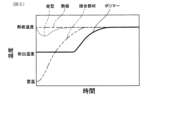
- FIG. 11 is a diagram showing the change over time in temperature of each part when a target workpiece model is placed on a molding die model in embodiment 1-1.
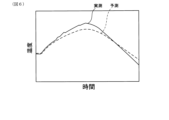
- 1 is a graph showing actual measured values and predicted values of the temperature of a polymer portion in the prior art.
- FIG. 1 is a graph showing actual measured values and predicted values of the temperature of a polymer portion in embodiment 1-1.
- 1 is a graph showing the change in thermal conductivity versus the carbon black content in embodiment 1-1.
- FIG. 13 is a diagram for explaining the state of the analysis mesh when a target workpiece model is placed on a molding die model in embodiment 1-1.
- FIG. 1 is a schematic diagram showing the structure of a vulcanization tester according to embodiment 1-1.
- 1A and 1B are diagrams for explaining a method of converting the torque measured by the vulcanization tester of embodiment 1-1 into a reaction rate, in which (a) is a graph showing a change in torque versus reaction time, and (b) is a graph showing a change in reaction rate versus reaction time.
- FIG. 13 is a diagram for explaining a method of calculating a gradient coefficient in the crosslinking reaction analysis process of embodiment 1-1.
- FIG. 13 is a diagram for explaining a method for calculating an equivalent reaction amount in the crosslinking reaction analysis process of embodiment 1-1.
- FIG. 13 is a diagram for explaining a method for calculating an equivalent reaction amount from an equivalent reaction amount increase amount in the crosslinking reaction analysis process of embodiment 1-1.
- FIG. 13 is a diagram for explaining a method of converting an equivalent reaction amount into a reaction rate in the crosslinking reaction analysis process of embodiment 1-1.
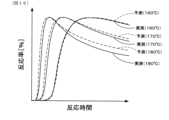
- FIG. 1 is a diagram showing the actual measured values and predicted values of the reaction rate of the polymer portion in the conventional technology.
- FIG. 1 is a diagram for explaining a method for dividing the crosslinking reaction into sections according to the progress of the reaction and calculating the activation energy for each section in embodiment 1-1.
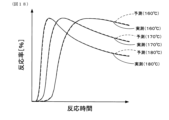
- FIG. 1 is a diagram showing the actual measured value and the predicted value of the reaction rate of the polymer portion in embodiment 1-1.
- FIG. 1 is a diagram for explaining a method of expressing the change in reaction rate with respect to reaction time in embodiment 1-1.
- FIG. 1 is a diagram showing the change in reaction rate versus reaction time in embodiment 1-1.
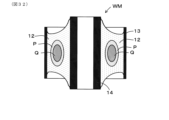
- FIG. 13 is a diagram showing a second function according to embodiment 1-1. A figure for explaining the appearance of the analysis mesh of the target work model in embodiment 1-1.
- FIG. 13 is a diagram showing a state in which internal bubbles are generated in a polymer portion.
- FIG. 2 is a graph showing the reaction rate at the blow point, the reaction rate at demolding, and the final reaction rate in a crosslinking reaction.
- 1A is a graph showing the reaction rate at the blow point of a number of samples
- FIG. 1B is a graph showing the torque measured by a vulcanization tester at the blow point of a number of samples.
- FIG. 1 is a diagram for explaining a mechanism for suppressing internal bubbles.
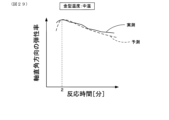
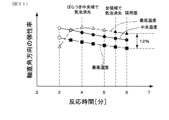
- FIG. 2 is a heat map showing the reaction rate distribution of the polymer portion in embodiment 1-1. This is a diagram showing the change in elastic modulus of a target work model in the direction perpendicular to the axis versus reaction time when the mold temperature is low in embodiment 1-1.
- FIG. 1 is a graph showing changes in elastic modulus of a polymer portion and generation of internal bubbles with respect to reaction time in embodiment 1-1.
- FIG. 11 is a diagram visually showing the predicted results of internal bubble generation in embodiment 1-1.
- FIG. 13 is a diagram showing another example of the molding die model in embodiment 1-1.
- Graphs showing the change in the elastic modulus Ks of the target workpiece model in embodiment 1-1 where (a) is a graph showing the change in the elastic modulus Ks of the target workpiece model versus the set temperature of the crosslinking reaction, and (b) is a graph showing the change in the elastic modulus Ks of the target workpiece model versus the polymer characteristic value RKs.
- FIG. 1-1 is a graph showing the process of calibrating the simulation results with actual measurement data, in which (a) is a simulation result showing the change in elastic modulus with respect to the set temperature, (b) is actual measurement data showing the change in elastic modulus with respect to the set temperature, and (c) is a graph showing the state in which the peak of the graph of the simulation results coincides with the peak of the graph of the actual measurement data.
- FIG. 37 is a diagram showing a state in which the graph obtained in FIG. 36(c) is shifted to a different RKs value in embodiment 1-1.
- FIG. 1 is a diagram showing a method for adjusting the elastic modulus by adjusting the set temperature of the crosslinking reaction in embodiment 1-1.
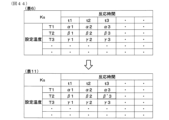
- FIG. 11 is a diagram showing a method for calibrating simulation results to actual measurement data by shifting the set temperature and reaction time using a table in the first to third embodiments.
- FIG. 11 is a diagram showing a method for calibrating simulation results to actual measurement data by shifting reaction times using a table in the first to fourth embodiments.
- FIG. 13 is a diagram showing a method for calibrating simulation results to actual measurement data by shifting a set time using a table in the first to fifth embodiments.
- FIG. 11 is a diagram showing a method for calibrating simulation results to actual measurement data by shifting the set temperature, reaction time, and elastic modulus using a table in the first to sixth embodiments.
- FIG. 13 is a diagram showing a method for calibrating simulation results to actual measurement data by changing the elastic modulus value of a specific cell using a table in embodiments 1-7.
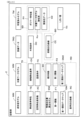
- FIG. 2 is a block diagram showing a crosslinking reaction simulation device according to embodiment 2-1.
- FIG. 13 is a diagram showing details of a storage unit according to embodiment 2-1.
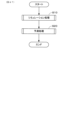
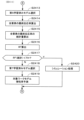
- 1 is a flowchart showing a main flow of a crosslinking reaction simulator according to embodiment 2-1.
- 11 is a flowchart showing a simulation process according to embodiment 2-1.
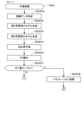
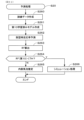
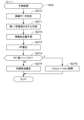
- 11 is a part of a flowchart showing a prediction process according to embodiment 2-1.
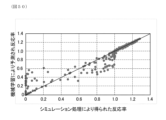
- FIG. 11 is a diagram showing the correlation between the reaction rate obtained by simulation processing and the reaction rate predicted by machine learning in embodiment 2-1.
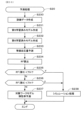
- 11 is a part of a flowchart showing a prediction process according to embodiment 2-2.
- 11 is a part of a flowchart showing a preheating process according to embodiment 2-2.
- 11 is a part of a flowchart showing a preheating process according to embodiment 2-2.
- 13 is a part of a flowchart showing a preheating process according to a modified example of embodiment 2-2.
- FIG. 13 is a part of a flowchart showing a preheating process according to a modified example of embodiment 2-2. 13 is a flowchart showing a prediction process according to embodiment 2-3.
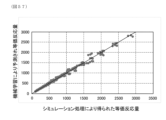
- FIG. 11 is a diagram showing the correlation between the reaction rate obtained by simulation processing and the reaction rate predicted by machine learning in embodiment 2-3.
- 11 is a part of a flowchart showing a prediction process according to an embodiment 2-4.
- 11 is a part of a flowchart showing a preheating process according to an embodiment 2-4.
- 11 is a part of a flowchart showing a preheating process according to an embodiment 2-4.
- 11 is a part of a flowchart showing a prediction process according to embodiment 3-1.
- 13 is a flowchart showing a prediction process according to embodiment 3-2.
- 13 is a part of a flowchart showing a prediction process according to embodiment 3-3.
- 13 is a flowchart showing a prediction process according to embodiment 3-4.
- (Embodiment 1-1) Configuration of the crosslinking reaction simulation device 1 1-1. Overall configuration of the crosslinking reaction simulation device 1 The overall configuration of the crosslinking reaction simulation device 1 (an example of an internal bubble estimation device) of embodiment 1-1 will be described with reference to Fig. 1. The crosslinking reaction simulation device 1 of this embodiment performs a simulation of a crosslinking reaction that crosslinks molecular chains of a raw material polymer, and predicts the setting conditions of the crosslinking reaction.
- the raw polymer is not particularly limited as long as the molecular chains are capable of undergoing a crosslinking reaction, and any polymer can be appropriately selected, such as thermosetting resins such as phenolic resin, epoxy resin, melamine resin, urea resin, unsaturated polyester resin, alkyd resin, silicone resin, and polyurethane, thermoplastic resins such as crosslinked polyethylene and crosslinked polypropylene, synthetic rubbers such as natural rubber, styrene-butadiene rubber, butadiene rubber, isoprene rubber, ethylene-propylene-diene rubber, fluororubber, acrylonitrile-butadiene rubber, chloroprene rubber, butyl rubber, and silicone rubber, and elastomers.
- thermosetting resins such as phenolic resin, epoxy resin, melamine resin, urea resin, unsaturated polyester resin, alkyd resin, silicone resin, and polyurethane
- thermoplastic resins such as crosslinked polyethylene and crosslinked polypropylene
- rubbers including natural rubber and synthetic rubber are used as the polymer.
- a crosslinking agent such as sulfur added
- the molecular chains that make up the rubber are crosslinked, causing a so-called vulcanization reaction.
- the cross-linking reaction simulation device 1 includes a memory unit 2, a heat transfer analysis unit 3, a cross-linking reaction analysis unit 4, a structure analysis unit 5, an internal bubble estimation unit 6, a display unit 7, and a setting condition analysis unit 8.
- the storage unit 2 stores data used in the simulation.
- the data includes the mold model MM, the target workpiece model WM, heat transfer analysis data TD used by the heat transfer analysis unit 3, crosslinking reaction analysis data RD used by the crosslinking reaction analysis unit 4, internal bubble estimation data BD used by the internal bubble estimation unit 6, and setting condition analysis data SD used by the setting condition analysis unit 8.
- the molding model MM will be described with reference to FIG. 2.
- the molding model MM is composed of a metal mold 10 and a hot plate 11 attached to the metal mold 10.
- the metal mold 10 has a lower mold 10A located on the lower side and an upper mold 10B assembled from above to the lower mold 10A.
- the hot plate 11 is composed of a lower hot plate 11A attached to the lower surface of the lower mold 10A and an upper hot plate 11B attached to the upper surface of the upper mold 10B.
- a lower cavity 100A that opens upward is formed in the lower mold 10A.
- an upper cavity 100B that opens downward is formed in the upper mold 10B.
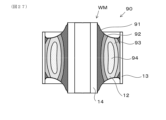
- the target work model WM will be described with reference to FIG. 3.
- the target work model WM has a polymer portion 12.
- the polymer portion 12 includes a raw polymer.
- the polymer portion 12 may include additives such as antioxidants, carbon black, etc.
- the polymer portion 12 in this embodiment is configured to include a raw polymer and carbon black.
- the raw polymer is not particularly limited, and any material such as rubber or thermosetting resin can be appropriately selected.
- the raw polymer is made of rubber.
- the polymer portion 12 in this embodiment is a rubber portion configured to exhibit vibration-proof performance, and the target work model WM is a model of a vibration-proof rubber device.
- the polymer portion 12 may be configured to include a thermosetting resin as a raw polymer, or may not include carbon black.
- the polymer part 12 in this embodiment is formed in a cylindrical shape along the axis A extending in the vertical direction.
- An outer joining member 13 (an example of a joining member) formed in a cylindrical shape extending in the vertical direction is disposed on the outer periphery of the polymer part 12.
- the outer joining member 13 is made of metal, resin, or a composite of metal and resin.
- the outer joining member 13 in this embodiment is made of metal and is joined to the outer periphery of the polymer part 12.
- An inner joining member 14 (an example of a joining member) formed in a cylindrical shape extending in the vertical direction is disposed on the inner periphery of the polymer part 12.
- the inner joining member 14 is made of metal, resin, or a composite of metal and resin.
- the inner joining member 14 in this embodiment is made of metal and is joined to the inner periphery of the polymer part 12.
- the vertical length dimension of the inner joining member 14 is formed to be larger than the vertical length dimension of the outer joining member 13.
- the upper and lower surfaces of the polymer part 12 are formed in a concave shape.
- the shape of the polymer part 12 is not limited to the above shape.
- the target workpiece model WM may be configured without both or either of the outer joining member 13 and the inner joining member 14.
- gaps 15 are formed between the mold model MM and the outer joining member 13 and between the mold model MM and the inner joining member 14.
- the heat transfer analysis data TD includes the thermal diffusivity characteristic TS, which indicates the relationship between the mass ratio of carbon black to the raw polymer and the thermal diffusivity of the polymer portion 12; the contact heat transfer coefficient CH, which is the heat transfer coefficient between the mold model MM and the outer and inner joining members 13 and 14 when the target work model WM is placed in the mold model MM; the air heat transfer coefficient AC, which is the heat transfer coefficient of the air surrounding the target work model WM when the target work model WM is demolded from the mold model MM; the temperature condition TC of the mold model MM, which is input from the condition input unit 30 described below; and the outside air condition OC, which includes the air temperature surrounding the demolded target work model WM.
- the thermal diffusivity characteristic TS which indicates the relationship between the mass ratio of carbon black to the raw polymer and the thermal diffusivity of the polymer portion 12
- the contact heat transfer coefficient CH which is the heat transfer coefficient between the mold model MM and the outer and inner joining members 13 and 14 when the target work model WM is
- the crosslinking reaction analysis data RD defines the equivalent reaction amount as the ratio of the reaction amount of the crosslinking reaction at a target reaction time at a target reaction temperature to the reaction amount of the crosslinking reaction at a reference reaction temperature for a reference reaction time, and includes an equivalent reaction amount calculation model EM defined including a slope coefficient that represents the slope of the Arrhenius plot, and a slope coefficient SC set according to the progress of the crosslinking reaction of the polymer portion 12.
- the crosslinking reaction analysis data RD further includes a first relationship data map DM1, a second relationship data map DM2, a first function F1, a second function F2, and a reference reaction curve RC, which will be described later.
- the data BD for estimating internal bubbles includes a crosslinking reaction curve CC that defines the relationship between the elapsed time from the start of the crosslinking reaction and the torque that corresponds to the progress of the crosslinking reaction in the polymer part 12 of the target work model WM and can be measured by a crosslinking reaction characteristic tester using a test target polymer material that corresponds to the polymer part 12.
- the set condition analysis data SD includes a polymer characteristic value PV and relationship data CD.
- the polymer characteristic value PV is a characteristic value related to the raw polymer constituting the polymer portion 12 of the target work model WM.
- the relationship data CD is data that correlates the target work model elastic modulus Ks, which is the elastic modulus of the polymer portion 12 of the target work model WM, the set temperature in the crosslinking reaction of the polymer portion 12 of the target work model WM having the target work model elastic modulus Ks, and the reaction time in the crosslinking reaction of the polymer portion 12 of the target work model having the target work model elastic modulus Ks.
- the target work model elastic modulus Ks may be the elastic modulus in the axial direction (axis A direction) of the target work model WM, or may be the elastic modulus in the axial orthogonal direction (direction perpendicular to axis A) of the target work model WM.
- the heat transfer analysis unit 3 performs a heat transfer analysis during a crosslinking reaction of the polymer part 12 of the target workpiece model WM. As shown in FIG. 1, the heat transfer analysis unit 3 includes a condition input unit 30, a polymer thermal diffusivity determination unit 31, and an analysis unit 32.
- the condition input unit 30 inputs the mass ratio of carbon black to the raw material polymer in the target workpiece model WM, and the temperature condition TC of the mold model MM.
- the condition input unit 30 may be an input device such as a keyboard, mouse, trackball, or joystick, or an external storage medium such as a semiconductor memory or hard disk memory.
- the polymer thermal diffusivity determination unit 31 determines the polymer thermal diffusivity, which is the thermal diffusivity of the polymer part 12 of the target workpiece model WM, based on the mass ratio of carbon black input by the condition input unit 30 and the thermal diffusivity characteristics TS stored in the memory unit 2.
- the analysis unit 32 performs a heat transfer analysis during the cross-linking reaction of the polymer part 12 of the target work model WM, using the polymer thermal diffusivity determined by the polymer thermal diffusivity determination unit 31 and the temperature conditions TC stored in the memory unit 2, with the target work model WM placed on the mold model MM.
- the crosslinking reaction analysis unit 4 analyzes the reaction rate of the crosslinking reaction of the polymer part 12 using the results of the heat transfer analysis by the heat transfer analysis unit 3. As shown in FIG. 1, the crosslinking reaction analysis unit 4 includes a temperature acquisition unit 40 and a reaction rate calculation processing unit 41.
- the temperature acquisition unit 40 acquires the temperature at each time for each element of the polymer part 12 of the target workpiece model WM in the crosslinking reaction as a result of the heat transfer analysis performed by the heat transfer analysis unit 3.
- the reaction rate calculation processing unit 41 calculates the equivalent reaction amount of the polymer part 12 at each time based on the temperature at each time for each element of the polymer part 12 in the acquired crosslinking reaction, the equivalent reaction amount calculation model EM, and the slope coefficient SC according to the progress of the crosslinking reaction at the target time, and calculates the reaction rate of the crosslinking reaction of the polymer part 12 based on the calculated equivalent reaction amount.
- the structure analysis unit 5 performs structure analysis using the reaction rate of the crosslinking reaction of the polymer portion 12 analyzed by the crosslinking reaction analysis unit 4. As shown in Fig. 1, the structure analysis unit 5 includes a temperature acquisition unit 50, a reaction rate acquisition unit 51, an elastic modulus assignment unit 52, and a characteristic acquisition unit 53. However, the temperature acquisition unit 50 may be omitted.
- the temperature acquisition unit 50 acquires the temperature at each time for each element of the polymer part 12 of the target workpiece model WM in the crosslinking reaction as a result of the heat transfer analysis by the heat transfer analysis unit 3.
- the reaction rate acquisition unit 51 acquires the reaction rate of each element of the polymer part 12 calculated by the reaction rate calculation processing unit 41 of the crosslinking reaction analysis unit 4.
- the elastic modulus assignment unit 52 assigns an elastic modulus in the polymer section 12 according to the obtained reaction rate.
- the characteristic acquisition unit 53 acquires the characteristics of the target workpiece model WM by performing a structural analysis with an elastic modulus assigned to the polymer portion 12.
- the internal bubble estimation unit 6 Configuration of the internal bubble estimation unit 6
- the internal bubble estimation unit 6 is applied to a crosslinking reaction process in which the polymer part 12 of the target work model WM is crosslinked in the mold model MM and then the mold model MM is demolded, and estimates the generation of internal bubbles inside the polymer part 12 of the target work model WM that accompanies the demolding of the mold model MM.
- the internal bubble estimation unit 6 includes a reaction rate acquisition unit 60, a torque calculation unit 61, and an estimation unit 62.
- the reaction rate acquisition unit 60 acquires the reaction rate of the cross-linking reaction of the polymer part 12 of the target work model WM.
- the reaction rate is the reaction rate at the time when the mold 10 is opened, that is, when the mold clamping pressure is released.
- the reaction rate is also called the degree of vulcanization at demolding.
- the torque calculation unit 61 calculates the torque (also called demolding torque) corresponding to the reaction rate acquired based on the reaction rate acquired by the reaction rate acquisition unit 60 (reaction rate at demolding) and the crosslinking reaction curve CC stored in the memory unit 2.
- the estimation unit 62 compares the torque calculated by the torque calculation unit 61 (torque at demolding) with the blow point torque (described in detail later) calculated from the blow point vulcanization degree (described in detail later) in the polymer portion 12, and estimates whether or not air bubbles will be generated inside the polymer portion 12.
- the display unit 7 displays a value obtained from the reaction rate corresponding to the reaction time, based on the analysis results of the crosslinking reaction analysis unit 4.
- the display unit 7 also displays characteristics corresponding to the temperature of the mold model MM used in the crosslinking reaction of the polymer part 12 and the in-mold reaction time from the start of the crosslinking reaction to the demolding of the mold model MM, based on the results of the structure analysis of the structure analysis unit 5.
- the display unit 7 also displays the presence or absence of internal bubbles according to the temperature of the mold model MM and the in-mold reaction time from the start of the crosslinking reaction to the demolding of the mold model MM, based on the estimation results of the internal bubble estimation unit 6.
- the display unit 7 also displays a value obtained from the reaction rate according to the temperature of the mold model MM and the in-mold reaction time from the start of the crosslinking reaction to the demolding of the mold model MM, based on the analysis results of the crosslinking reaction analysis unit 4, in accordance with the presence or absence of internal bubbles.
- the display unit 7 also displays the characteristics according to the temperature of the mold model MM and the in-mold reaction time from the start of the crosslinking reaction to the demolding of the mold model MM, in accordance with the presence or absence of internal bubbles, based on the results of the structural analysis of the structural analysis unit 5.
- the setting condition analysis unit 8 analyzes the setting conditions in the crosslinking reaction of the polymer part 12 of the target workpiece model WM.
- the setting condition analysis unit 8 includes a polymer characteristic value acquisition unit 181, a target workpiece model elastic modulus acquisition unit 182, a relationship data acquisition unit 183, and a correction unit 184.
- the polymer characteristic value acquisition unit 181 acquires the polymer characteristic value PV.
- the target work model elastic modulus acquisition unit 182 acquires the target work model elastic modulus Ks.
- the relationship data acquisition unit 183 acquires the relationship data CD.
- the correction unit 184 corrects the relationship between the target work model elastic modulus Ks, the set temperature, and the reaction time in the relationship data CD based on the polymer characteristic value PV.
- a heat transfer analysis process S1 is executed.
- the heat transfer analysis process S1 obtains the temperature at each time for each element of the polymer part 12 of the target workpiece model WM in the crosslinking reaction. Details will be described later.
- the crosslinking reaction analysis process S2 is executed.
- the equivalent reaction amount of the polymer part 12 at each time is calculated based on the temperature at each time for each element of the polymer part 12 of the target workpiece model WM in the crosslinking reaction obtained as a result of the heat transfer analysis, the equivalent reaction amount calculation model EM, and the slope coefficient SC according to the progress of the crosslinking reaction at the target time, and the reaction rate of the crosslinking reaction of the polymer part 12 is calculated based on the calculated equivalent reaction amount. Details will be described later.
- a structural analysis process S3 is executed.
- an elastic modulus is assigned according to the reaction rate of each element of the polymer part 12 calculated by the crosslinking reaction analysis unit 4, and the properties of the target work model WM are obtained by performing a structural analysis with the elastic modulus assigned to the polymer part 12. Details will be described later.
- the internal bubble estimation process S4 is executed.
- the torque corresponding to the reaction rate of the polymer part 12 is calculated based on the reaction rate of the polymer part 12 calculated by the crosslinking reaction analysis process and the crosslinking reaction curve CC stored in the memory unit 2, and the occurrence of internal bubbles inside the polymer part 12 of the target work model WM is estimated based on the torque at the time of demolding. Details will be described later.
- the set condition analysis process S6 is executed.
- the relationship between the target work model elastic modulus Ks, the set temperature, and the reaction time in the relationship data CD is corrected based on the polymer characteristic value PV.
- the display process S5 is executed.
- the presence or absence of internal bubbles is displayed according to the temperature of the mold model MM and the in-mold reaction time from the start of the crosslinking reaction to the demolding of the mold model MM based on the estimation result by the internal bubble estimation unit 6.
- the value obtained from the reaction rate according to the temperature of the mold model MM and the in-mold reaction time from the start of the crosslinking reaction to the demolding of the mold model MM is displayed according to the presence or absence of internal bubbles.
- the characteristics according to the temperature of the mold model MM and the in-mold reaction time from the start of the crosslinking reaction to the demolding of the mold model MM are displayed according to the presence or absence of internal bubbles. Also, based on the analysis result of the setting conditions by the setting condition analysis unit 8, the setting conditions of the crosslinking reaction of the polymer part 12 for obtaining a product having the desired target work model elastic modulus Ks are displayed.
- Heat transfer analysis process S1 3-1 Mass ratio of carbon black
- FIG. 2 in a state where the lower mold 10A and the upper mold 10B are combined, an outer joining member 13 and an inner joining member 14 are placed in the space formed by the lower cavity 100A and the upper cavity 100B. Furthermore, raw material polymer is injected into the space formed by the lower cavity 100A and the upper cavity 100B. Thereafter, a cross-linking reaction of the molecular chains constituting the polymer portion 12 proceeds in the mold 10.
- the temperature of the hot plate 11 is set to a constant value.
- the temperature of the mold 10 is set to the same temperature as the hot plate 11.
- the temperature of the polymer portion 12 during injection is lower than the set temperature of the mold 10. Therefore, the temperature of the mold 10 temporarily drops after the raw polymer is injected.
- the temperature of the mold 10 then rises and becomes the same as the temperature of the hot plate 11.
- the temperature of the polymer portion 12 rises after being injected into the mold 10, and becomes the same as the temperature of the mold 10 after a sufficient amount of time has passed.
- the temperature of the inner joining member 14 and the outer joining member 13 may be the same as the outside air temperature before being placed in the mold 10, or may be preheated.
- the outside air temperature may drop to about 0°C in winter, for example. If it is preheated, it may be heated to any temperature, for example, to around 100°C. After the inner joining member 14 and the outer joining member 13 are placed in the mold 10, the temperatures of the inner joining member 14 and the outer joining member 13 rise due to heat transfer from the mold 10, and after the raw polymer is injected, the temperatures rise further, and after sufficient time has passed, they become the same as the temperature of the mold 10.
- Equation (1) is the so-called unsteady heat conduction equation.
- Thermal diffusivity ⁇ and thermal conductivity ⁇ correspond to the thermal diffusivity characteristic TS.
- the thermal diffusivity characteristic TS is not limited to the thermal diffusivity ⁇ and thermal conductivity ⁇ .
- the temperature of the polymer portion 12 can be calculated by the unsteady heat conduction equation (1) using the thermal diffusivity ⁇ directly. If the thermal diffusivity ⁇ is not known, the thermal diffusivity ⁇ can be calculated from equation (2) using the thermal conductivity ⁇ , density ⁇ , and specific heat C, and the calculated ⁇ can be used to calculate the temperature of the polymer portion 12 using equation (1).
- the cause was that the value of the thermal diffusivity ⁇ or thermal conductivity ⁇ of the raw polymer of the polymer portion 12 listed in JIS or the like was different from the value of the thermal diffusivity ⁇ or thermal conductivity ⁇ of the actual polymer portion 12.
- the temperature of the polymer part 12 of the target work model WM to be measured was actually measured, and the thermal diffusivity ⁇ or thermal conductivity ⁇ of the polymer part 12 was identified, thereby obtaining the thermal diffusivity ⁇ or thermal conductivity ⁇ of the polymer part 12 of the target work model WM to be measured.
- Figure 7 shows the measured temperature of the polymer part 12 of the target workpiece model WM and the temperature calculated using the measured thermal diffusivity ⁇ or thermal conductivity ⁇ obtained as described above. It was found that the measured temperature of the polymer part 12 coincided with the predicted temperature with a high degree of accuracy.
- the thermal diffusivity ⁇ or thermal conductivity ⁇ of the polymer part 12 constituting the target workpiece model WM varies depending on the type of raw polymer of the polymer part 12 and the amount or type of additive material added to the raw polymer. For this reason, it is cumbersome to actually measure the thermal diffusivity ⁇ or thermal conductivity ⁇ for all polymer parts 12 with different compositions.
- the inventors therefore focused on carbon black among the additive materials added to the polymer portion 12.
- the rubber that constitutes the polymer portion 12 is a material that does not easily transmit heat.
- carbon black is a material that transmits heat easily.
- the thermal diffusivity ⁇ or thermal conductivity ⁇ of the polymer portion 12 is highly related to the mass ratio of carbon black to the raw material polymer that constitutes the polymer portion 12. Examples of carbon black include furnace black, acetylene black, and ketjen black.
- Figure 8 shows the relationship between the mass ratio of carbon black to the raw polymer and the thermal conductivity ⁇ of the polymer portion 12 when experiments were conducted using multiple types of raw polymers and different mass ratios of carbon black.
- the mass ratio of carbon black to the raw polymer is expressed in parts by mass. However, the mass ratio of carbon black to the raw polymer may also be expressed in % by mass.
- the thermal conductivity ⁇ of the polymer portion 12 has a linear relationship with the mass ratio of carbon black to the raw polymer. It was also found that the thermal conductivity ⁇ of the polymer portion 12 is independent of the type of raw polymer. This makes it possible to accurately predict the thermal conductivity ⁇ of the polymer portion 12 based on the amount of carbon black mixed, regardless of the type of raw polymer. In addition, since the thermal diffusivity ⁇ can be calculated from the thermal conductivity ⁇ using equation (2), it is also possible to accurately predict the thermal diffusivity ⁇ .
- an inner gap 15B may be formed between the inner surface of the mold 10 and the inner joint member 14.
- heat is transferred from the inner surface of the mold 10 to the inner joint member 14 through the air in the inner gap 15B.
- the contact heat transfer coefficient CH is set according to the size of the inner gap 15B.
- the contact heat transfer coefficient CH is determined by measuring the temperature behavior when the size of the inner gap 15B is changed in an experiment using a test piece, and a value that can reproduce each temperature behavior is obtained by analysis.
- the memory unit 2 stores the contact heat transfer coefficient CH in the gaps 15A, 15B between the mold model MM and the metal fittings when the target workpiece model WM is placed on the mold model MM.
- the analysis unit 32 is configured to perform heat transfer analysis using the polymer thermal diffusivity determined by the polymer thermal diffusivity determination unit 31, the temperature condition TC stored in the memory unit 2, and the contact heat transfer coefficient CH, with the target workpiece model WM placed on the mold model MM. This makes it possible to accurately predict the temperature of the polymer part 12.
- the condition input unit 30 is configured to input the outside air condition OC including the air temperature around the target work model WM demolded from the mold model MM. Furthermore, the memory unit 2 stores the air heat transfer coefficient AC, which is the heat transfer coefficient of the air around the target work model WM demolded from the mold model MM.
- the analysis unit 32 performs a heat transfer analysis using the polymer thermal diffusivity determined by the polymer thermal diffusivity determination unit 31, the air heat transfer coefficient AC, and the outside air conditions OC stored in the memory unit 2, in a state in which the target work model WM is demolded from the mold model MM after the polymer part 12 of the target work model WM has been subjected to a cross-linking reaction within the mold model MM.
- This makes it possible to accurately predict the temperature of the polymer part 12 in a state in which the target work model WM has been demolded from the mold model MM.
- an analysis mesh is created for the state in which the target workpiece model WM is placed on the forming die model MM.
- the size of the analysis mesh may be determined in advance, or may be input from the condition input unit 30.
- the characteristics of the shapes of the forming die model MM and the target workpiece model WM e.g., symmetry
- An eight-node solid element is used as the mesh type. However, any model can be used for the mesh type, and for example, a four-node solid element may be used.
- the analytical mesh it is possible to predict the temperature at each node of the target work model WM. In other words, it is possible to predict the temperature distribution in the polymer part 12 of the target work model WM. In particular, it is possible to predict the temperature at each node of the polymer part 12 at each time.
- the molding model MM is not limited to the above, and may be, for example, the molding model MMa shown in FIG. 33.
- the molding model MMa includes a lower mold 10A, an upper mold 10B, a first inner mold 110A, a second inner mold 110B, a lower insert 16A, an upper insert 16B, a lower shaft portion 17A, an upper shaft portion 17B, and a heater 18.
- the gap 15 is omitted in FIG. 33.
- first middle mold 110A arranged on the lower mold 10A side
- second middle mold 110B arranged on the upper mold 10B side.
- the first middle mold 110A and the second middle mold 110B are arranged radially outward of the target work model WM.
- the first middle mold 110A and the second middle mold 110B are arranged outward of the outer joining member 13 of the target work model WM.
- the lower insert 16A and the upper insert 16B come into contact with the polymer portion 12 of the target workpiece model WM. As a result, the lower insert 16A forms the shape of the lower edge of the polymer portion 12, and the upper insert 16B forms the shape of the upper edge of the polymer portion 12.
- the lower shaft portion 17A is arranged so that it penetrates the lower mold 10A in the vertical direction.
- the lower shaft portion 17A is arranged so that it is inserted from below into the inside of the inner joint member 14 of the target work model WM.
- the upper surface of the lower shaft portion 17A abuts against the inner joint member 14 from below.
- the upper shaft portion 17B is attached to the upper mold 10B and is inserted from above into the inside of the inner joint member 14 of the target work model WM.
- the lower surface of the upper shaft portion 17B abuts against the inner joint member 14 from above.
- the inner joint member 14 is positioned by being clamped between the upper surface of the lower shaft portion 17A and the lower surface of the upper shaft portion 17B.
- a heater 18 is placed inside the lower die 10A.
- the heater 18 may be an electric heating wire or a pipe through which a heated fluid (water or oil) flows.
- a heated fluid water or oil
- the temperature of the polymer portion 12 can be accurately predicted by using the set temperature of the lower insert 16A.
- the heater 18 may be located in the upper die 10B, in which case the set temperature of the upper insert 16B may be used.
- crosslinking reaction analysis process S2 Next, the crosslinking reaction analysis process S2 will be described. Regarding the crosslinking reaction analysis process S2, first, the reaction rate will be described. Next, the conventional technology will be described, followed by the problems with the conventional technology. After that, the crosslinking reaction analysis process of this embodiment will be described.
- reaction rate of the crosslinking reaction is measured as follows. As shown in FIG. 10, the reaction rate of the rubber according to this embodiment is measured in accordance with JIS K6300-2 using a vulcanization tester 70 (an example of a crosslinking reaction tester), and the reaction rate (degree of vulcanization) is calculated from the relationship between the torque and the reaction time.
- a vulcanization tester 70 for example, a Curastometer (registered trademark) can be used.
- the above-mentioned JIS K6300-2 is an example of a method for calculating the reaction rate, and the method for calculating the reaction rate is not limited to the above.
- the raw material polymer constituting the polymer portion 12 is not limited to the polymer according to JIS K6300-2, and any polymer can be appropriately selected.
- JIS K6300-2 is created based on ISO 6502:1999, but some stipulated items not included in the corresponding international standard are added. Furthermore, some of the corresponding international standards are changed and deleted.
- the reaction behavior can be measured under the desired vibration conditions, for example, using a rubber processability analyzer (RPA).
- RPA rubber processability analyzer
- a disk 75 attached to the tip of a rotor 74 is placed between a lower die 72 and an upper die 73, each having a cavity 71.
- the lower die 72 and upper die 73 can be set to a predetermined temperature.
- the torsion angle of the rotor 74 can be selected from +3° to -3°, or +1° to -1°.
- a measurement sample 76 is placed between the cavity 71 and the disk 75, and a crosslinking reaction is caused while applying a rotational torque from the disk 75 at a constant temperature, and the progress of the crosslinking reaction is detected from the change in torque.
- Figure 11 shows an example of the measurement results.
- Figure 11(a) is a graph (crosslinking reaction curve CC) of the change in torque versus reaction time at a specified reaction temperature. Meanwhile, the reaction rate is defined as 0% reaction rate at the minimum torque and 100% reaction rate at the maximum torque.
- Figure 11(b) shows a graph (reference reaction curve RC) showing the change in reaction rate versus reaction time at a specified reaction temperature.
- the reaction rate is called the degree of vulcanization.
- the degree of vulcanization is defined as the degree of vulcanization when the physical properties of the vulcanized rubber (elastic modulus, elongation, tensile strength, hardness, etc.) are used as indicators.
- the region from reaction time 0 to the reaction time showing the minimum torque is a plastic region where the crosslinking reaction of the polymer portion 12 has not yet reacted. For this reason, in Figure 11(b), the reaction rate in this region is set to 0%.
- the equivalent reaction amount of the crosslinking reaction is estimated using the formula (4) related to the equivalent reaction amount obtained by modifying the Arrhenius formula (3).
- the formula (4) related to the equivalent reaction amount indicates how many times the reaction amount at the reaction temperature T and reaction time t is larger than the reaction amount at a certain reference temperature T 0 and reference time t 0.
- the formula (4) is called the equivalent vulcanization formula in the vulcanization reaction of rubber.
- reaction rate in the reaction reversion period cannot be predicted by the formula (for example, Kamal's reaction rate formula) used to predict the behavior of the thermosetting reaction of rubber, epoxy, etc. in general analysis software.
- reaction rate A frequency factor
- E activation energy
- T reaction temperature
- the Arrhenius equation (3) can be transformed as follows to derive the equivalent reaction amount equation (4).
- the reaction amount Z of the crosslinking reaction at reaction time t is expressed by formula (5).
- reaction amount Z is calculated from the Arrhenius equation (3) and the above equation (5) as shown in the following equation (6).
- Z0 is expressed by the following formula (7).
- the ratio U of the reaction amount Z at reaction temperature T and reaction time t to the reaction amount Z 0 at reaction temperature T 0 and reaction time t 0 is taken, the ratio U is expressed by the following formula (8).
- the increase in the equivalent reaction amount in a small time period at the target time is calculated based on the temperature at the target time, the above formula (4), and the slope coefficient SC, and the equivalent reaction amount integrated value from the start of the crosslinking reaction to the target time is calculated based on the increase in the equivalent reaction amount, and the reaction rate at the target time is calculated based on the equivalent reaction amount integrated value from the start of the crosslinking reaction to the target time.
- ⁇ U i Equivalent reaction increase amount in a small time of the target time
- ⁇ t Small time of the target time
- the equivalent reaction amount U can be calculated by accumulating it per unit time as shown in the following formula (11).
- the above formula (4) is the formula inside ⁇ in the above formula (11), and corresponds to each of the accumulated equivalent reaction amounts.
- reaction rate A frequency factor
- E activation energy
- T reaction temperature
- reaction rate ⁇ can be any value between 0% and 100%, such as 5%, 90%, etc.
- the reaction time is divided into predetermined intervals (e.g., 1 minute).
- the temperature is read at each predetermined interval.
- the equivalent reaction amount per given interval is calculated using formula (4).
- the calculation is performed by substituting the given interval ⁇ t into formula (4).
- the equivalent reaction amount U i-1 at reaction time t i-1 and reaction temperature T i-1 is calculated using formula (4). Similarly, the equivalent reaction amount U i at reaction time t i and reaction temperature T i is calculated.
- reaction amount Z at reaction temperature T0 and reaction time t is expressed by formula (5).
- reaction amount Z0 at reaction temperature T0 and reaction time t0 is expressed by the following formula (15).
- each k has the same value from formula (3).
- the reaction time t can be read as the equivalent reaction amount U.
- FIG. 15 shows a graph with the reaction rate on the vertical axis and the equivalent reaction amount on the horizontal axis. Based on this graph, the reaction rate can be calculated from the equivalent reaction amount U obtained by calculation.
- Figure 16 shows the change in reaction rate versus reaction time.
- the reference temperature was set to 160°C, so when the reaction temperature was 160°C, the measured value and the predicted value matched with good precision.
- Figure 17 shows a graph that shows the change in reaction rate versus reaction time.
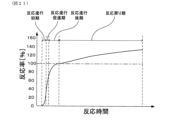
- the crosslinking reaction in this embodiment proceeds through the following process.
- reaction rate gradually increases. After a certain amount of time has passed and the reaction reaches the accelerated reaction stage, the reaction rate increases rapidly. Then, in the later stages of reaction progression, the rate of increase in the reaction rate slows down and the reaction rate reaches a maximum value. After the reaction rate reaches its maximum value, the reaction enters the reaction return stage, where a return reaction occurs. During this reaction return stage, the reaction rate gradually decreases.
- reaction from the initial stage to the reaction return stage was considered to be one crosslinking reaction, so to speak.
- reaction rate was predicted using one activation energy E.
- E activation energy
- Figure 17 shows an example in which the reaction progress is divided into four stages: early reaction progress, accelerated reaction progress, late reaction progress, and reaction return.
- the reaction progress may be divided into any number of stages, such as two to three, or five or more.
- the entire period including the reaction progress and reaction return periods may also be divided into equal intervals.
- the progress of the crosslinking reaction over the entire period may be used as a standard, and the progress of the crosslinking reaction may be divided into 5% increments, for example.
- the index for division is not limited to 5%, and may be 1% to 4%, or 6% or more.
- the reaction rate of 0% to 5% is defined as the early stage of the reaction
- the reaction rate of 5% to 50% is defined as the accelerated reaction stage
- the reaction rate of 50% to 100% is defined as the late stage of the reaction
- the range after the late stage of the reaction where the reaction rate decreases from 100% to 90% is defined as the reaction return stage.
- the slope coefficient SC is set to different values for the reaction progress period until the crosslinking reaction rate reaches a peak and the reaction return period when the reaction rate has passed the peak. Also, in this embodiment, the slope coefficient SC is set to a smaller value in the reaction return period than in the reaction progress period.
- the slope coefficient SC is set to different values for the early reaction progress, the reaction acceleration period, the late reaction progress, and the reaction return period.
- the slope coefficient SC in the reaction acceleration period is set to a value larger than those in the early reaction progress and the late reaction progress.
- the slope coefficient SC is set to a value corresponding to each interval.
- the slope coefficient SC calculated by the method described in the above-mentioned non-patent document 1 may also be used.
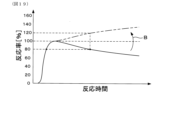
- Fig. 19 is a graph showing the change in the reaction rate of the crosslinking reaction with respect to the reaction time. The graph shown by the solid line is the actual measured value of the reaction rate.
- the reaction rate of the crosslinking reaction gradually decreases after it reaches its maximum value as the back reaction progresses. For this reason, for example, there will be a point where the reaction rate is 80% before it reaches its maximum value, and a point where the reaction rate is 80% after it reaches its maximum value. In this case, if you simply compare the reaction rate figures, you will not be able to distinguish between the value of 80% before the reaction rate reaches its maximum value and the value of 80% after the reaction rate reaches its maximum value.
- the reaction rate of the crosslinking reaction is defined as 0% at the start of the crosslinking reaction during the reaction progress phase until the reaction rate of the crosslinking reaction reaches its peak
- the degree of increase in the reaction rate of the crosslinking reaction is defined as a range from 0% to 100%
- the degree of decrease in the reaction rate from the peak reaction rate is defined as a value obtained by adding 100% to the degree of increase.
- the slope coefficient SC and the reaction rate are determined using one or both of a database and a function.
- the accuracy of the estimated value can be improved.
- the calculation speed can be improved.
- the storage unit 2 stores a first relationship data map DM1 that defines the correspondence relationship between the reaction rate and the slope coefficient SC of the crosslinking reaction of the polymer portion 12.
- the reaction rate calculation processing unit 41 determines the slope coefficient SC by using the reaction rate at the previous time and the first relationship data map DM1.
- the memory unit 2 stores a second relationship data map DM2 that defines the correspondence between the equivalent reaction amount integrated value and the reaction rate at the target time.
- the reaction rate calculation processing unit 41 determines the reaction rate at the target time using the equivalent reaction amount integrated value at the target time and the second relationship data map DM2.
- the second relationship data map DM2 is set from a reference reaction curve RC based on the relationship between the crosslinking reaction time and the torque generated in the test polymer material at the reference reaction temperature measured by the vulcanization tester 70 using a test polymer material corresponding to the polymer part 12 of the target workpiece model WM.
- the memory unit 2 stores a first function F1 that defines the correspondence relationship between the reaction rate and the slope coefficient SC of the crosslinking reaction of the polymer portion 12.
- the reaction rate calculation processing unit 41 determines the slope coefficient SC by using the reaction rate at the previous time and the first function F1.
- the first function F1 is set to a different function according to a plurality of reaction rate divisions set according to the progress of the crosslinking reaction of the polymer portion 12.
- the number of divisions of the progress of the crosslinking reaction is arbitrary, and may be divided into one or more than two.
- any function can be appropriately selected, such as an n-th order function including linear complementation, a spline curve, etc. In this embodiment, for example, a sextic function is preferably used. Note that the number of divisions of the first function F1 can be set independently of the divisions when calculating the value of the activation energy E N for each progress stage of the reaction divided into N stages.
- the memory unit 2 stores a second function F2 that defines the correspondence between the equivalent reaction amount integrated value and the reaction rate at the target time.
- the reaction rate calculation processing unit 41 determines the reaction rate at the target time using the equivalent reaction amount integrated value at the target time and the second function F2.
- the second function F2 is set from a reference reaction curve RC based on the relationship between the crosslinking reaction time and the torque generated in the test polymer material at a reference reaction temperature measured by a vulcanization tester 70 using a test polymer material corresponding to the polymer part 12 of the target workpiece model WM.
- the second function F2 is set to a different function according to a plurality of reaction rate divisions set according to the progress of the crosslinking reaction of the polymer portion 12.
- the number of divisions of the progress of the crosslinking reaction is arbitrary, and may be divided into one or more than two.
- any function can be appropriately selected, such as an n-th order function including linear complementation, a spline curve, etc. In this embodiment, for example, a sextic function is preferably used. Note that the number of divisions of the second function F2 can be set independently of the divisions when calculating the value of the activation energy E N for each progress stage of the reaction divided into N stages.
- FIG. 21 shows an example of the second function F2 when the progress of the crosslinking reaction is divided into four stages.
- the stages are an early stage of reaction progress, an accelerated stage of reaction progress, a late stage of reaction progress, and a return stage of reaction.
- the reaction rate and reaction time are approximated by mutually different functions.
- an analytical mesh of the target workpiece model WM is created.
- the size of the analytical mesh may be determined in advance, or may be input from the condition input unit 30.
- an analytical mesh as shown in FIG. 22 is created taking into consideration the characteristics of the shape of the target workpiece model WM (e.g., symmetry).
- An eight-node solid element is used as the mesh type.
- any model can be used as the mesh type, and for example, a four-node solid element may be used.
- reaction rate of each node can be calculated from the temperature of each node at each time for only the polymer part 12 of the target workpiece model WM.
- Structural analysis process S3 5-1 Initial Processing Next, the structural analysis process S3 will be described.
- the structural analysis unit 5 creates an analytical mesh of the target workpiece model WM.
- the analytical mesh of the target workpiece model WM may be the same as the analytical mesh created in the crosslinking reaction analysis process S2, or it may be different.
- the analytical mesh used in the structural analysis process S3 is the same as the analytical mesh used in the crosslinking reaction analysis process S2.
- the structure analysis unit 5 acquires the analysis result of the temperature distribution of the polymer part 12 of the target work model WM analyzed by the heat transfer analysis unit 3.
- the structure analysis unit 5 also acquires the analysis result of the reaction rate of the polymer part 12 of the target work model WM analyzed by the crosslinking reaction analysis unit 4.
- the structure analysis unit 5 calculates the elastic modulus of each node at each time of the polymer part 12 of the target workpiece model WM. First, a test piece with a crosslinking reaction rate of 100% is created, and the elastic modulus of this test piece is actually measured. Next, a correction coefficient is calculated based on the quotient obtained by dividing the torque at the target reaction rate by the torque at a reaction rate of 100%. The above torque is a torque that can be measured by the vulcanization tester 70. The structure analysis unit 5 calculates the elastic modulus of each node at each time by multiplying the actually measured elastic modulus by the calculated correction coefficient.
- the structural analysis unit 5 predicts the properties of the target workpiece model WM.
- the input conditions used in the finite element analysis are the temperature of each node at each time, the elastic modulus of each node at each time, and the boundary conditions of the outer bonding member 13 and the inner bonding member 14.
- a force or strain perpendicular to the axis A of the target work model WM is applied to the target work model WM.
- the structural analysis unit 5 outputs the overall elastic modulus of the target work model WM.
- the elastic modulus against a force statically applied in a direction perpendicular to the axis A of the target work model WM is predicted as a characteristic.
- the predicted characteristic is not limited to the elastic modulus against a force or strain in a direction perpendicular to the axis A, and any physical property value can be predicted as a characteristic, such as the elastic modulus against a force vibrating in a direction perpendicular to the axis A, the elastic modulus against a force or strain statically applied in a direction along the axis A, the elastic modulus against a force vibrating in a direction along the axis A, etc.
- the rubber product which is an example of this embodiment, is made by molding and vulcanization. Therefore, gas originally dissolved in the rubber or gas generated by the vulcanization reaction is dissolved in the rubber under the high temperature and high pressure conditions of vulcanization. When the mold 10 is opened, the pressure applied to the rubber decreases, and the solubility of the gas in the rubber decreases. Therefore, when vulcanization is not fully advanced, internal bubbles 80 may occur in the polymer portion 12 made of rubber (see FIG. 23).
- blow point The degree of vulcanization of the rubber in the slowest vulcanization part at the time the mold 10 is opened when molded for a vulcanization time until the generation of internal air bubbles 80 is no longer observed in this slowest vulcanization part.
- the vulcanization time in the mold 10 is made as long as possible. However, if the vulcanization time in the mold 10 is extended too much, the manufacturing efficiency of the product decreases. For this reason, it is important to estimate the blow point described above in order to determine the vulcanization time of the product.
- Figure 25(a) shows the blow point reaction rate when multiple types of fillers are added in different amounts to multiple types of polymers.
- the blow point reaction rate is the reaction rate of the crosslinking reaction of the polymer part 12 at the blow point.
- Samples A1 to A3 use raw polymer A with different amounts of filler mixed in.
- samples B1 to B3 use raw polymer B with different amounts of filler mixed in
- samples C1 to C3 use raw polymer C with different amounts of filler mixed in.
- the samples used were commercially available products, the exact type and amount of filler mixed in is unknown.
- blow point reaction rate varies greatly depending on the type of raw polymer and the amount of filler. For this reason, it was found that it is difficult to predict the blow point of the polymer part 12 using the blow point reaction rate.
- Figure 25(b) shows the blow point torque when multiple types of fillers are added to multiple types of polymers in different amounts.
- the blow point torque is the torque measured by the vulcanization tester 70 that corresponds to the blow point reaction rate converted from the blow point reaction rate.
- the torque (blow point torque) at which internal bubbles 80 are no longer observed is approximately the same regardless of the type of raw polymer or the amount of filler. In other words, by using a torque that is easily measurable, it is possible to easily predict the blow point.
- the threshold value is shown on the vertical axis of FIG. 25(b).
- the estimation unit 62 of the internal bubble estimation unit 6 estimates that internal bubbles 80 have occurred in the polymer part 12 of the target work model WM if the torque when the target work model WM is demolded does not exceed the threshold value.
- the threshold is set to a uniform value for multiple types of raw material polymers.
- the threshold is also a torque that corresponds to a reaction rate that is greater than the reaction rate of the crosslinking reaction at the blow point of the polymer portion 12.
- multiple groups may be set and a threshold may be set for each group.
- the multiple groups may be divided according to any criteria.
- the reaction rate acquisition unit 51 acquires the reaction rate for each part of the polymer part 12, the torque calculation unit 61 calculates the torque for each part of the polymer part 12, and the estimation unit 62 estimates the generation of internal bubbles 80 for each part of the polymer part 12.
- the elastic modulus Ks of the target workpiece model WM can change depending on the setting conditions in the crosslinking reaction of the polymer part 12 of the target workpiece model WM.
- the setting conditions are not particularly limited, and can be, for example, the setting temperature of the mold 10 in the crosslinking reaction, the reaction time of the crosslinking reaction, the temperature of the raw material polymer when the raw material polymer is injected into the mold 10, the temperature of the insert, the temperature of the outer joining member 13, the temperature of the inner joining member 14, the temperature of the lower shaft part, the temperature of the upper shaft part, and other primary vulcanization conditions, and secondary vulcanization conditions.
- the secondary vulcanization conditions may include the above-mentioned primary vulcanization conditions, or may include other vulcanization conditions.
- the secondary vulcanization conditions are an example of conditions for additional crosslinking reactions.
- the set temperature of the mold 10 is explained as an example of a set condition.
- the elastic modulus Ks of the target work model WM correlates with the set temperature in the cross-linking reaction of the polymer portion 12 of the target work model WM.
- the elastic modulus Ks of the target workpiece model WM correlates with the polymer characteristic value PV, which is a characteristic value related to the polymer portion 12 of the target workpiece model WM.
- the polymer characteristic value PV is not particularly limited and includes a characteristic value related to the elasticity of the raw material polymer, and further includes at least one of the scorch time and Mooney viscosity of the raw material polymer.
- RKs is explained as an example of a polymer characteristic value PV.
- RKs is defined as the elastic modulus of a test specimen calculated using a specified method by applying a load to the test specimen, which is made by molding and crosslinking a raw polymer into a specified shape, using a specified jig at a specified displacement rate in a direction that compresses the test specimen.
- the raw polymer is placed in a mold with a cavity of 30.0 mm in diameter and 30 mm in thickness, and crosslinked by holding at 150°C for 20 minutes to produce a cylindrical sample.
- the produced sample is used to measure the static spring constant of the crosslinked raw polymer.
- a load of 10 N is applied to the sample in the thickness direction, compressing it at a displacement rate of 0.33 mm/sec, and the spring constant is calculated using the forward path method based on JIS K6385:2012.
- TS is defined as the difference in the amount of deformation when the first load is applied and the second load is applied, the difference being calculated by applying a first load in the thickness direction to a test piece made by molding and cross-linking a raw polymer into a specified shape, and then applying a second load smaller than the first load.
- the raw polymer is placed in a mold with a cavity of 30.0 mm in diameter and 30 mm in thickness, and crosslinked by holding at 150°C for 20 minutes to produce a cylindrical sample.
- a load of 70 kg (an example of a first load) is applied to the produced sample in the thickness direction of the sample.
- a load of 20 kg is then applied, and the difference in the amount of deformation in the thickness direction of the sample when a load of 70 kg and a load of 20 kg are applied is measured.
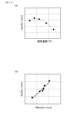
- Figure 34 (b) shows the change in the elastic modulus Ks with respect to RKs, which is an example of a characteristic value of the polymer portion 12.
- the elastic modulus Ks of the target workpiece model WM has a correlation with RKs.
- the elastic modulus Ks of the target workpiece model WM and RKs have a linear relationship.
- the polymer characteristic value PV of the raw polymer differs for each lot of the raw polymer. Since the polymer characteristic value PV can be measured in advance for each lot of the raw polymer, it is possible to know it before the crosslinking reaction is carried out. Then, by changing the setting conditions for the crosslinking reaction according to the polymer characteristic value PV of the raw polymer, it is thought that it is possible to adjust the elastic modulus Ks of the target work model WM after the crosslinking reaction to a desired value.
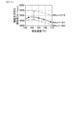
- Figure 35(a) shows the correlation between the elastic modulus Ks of the target work model WM calculated as described above and the set temperature of the mold 10.
- the vertical axis represents the ratio of the elastic modulus in the direction perpendicular to the axis, and is not the value of the elastic modulus Ks itself.
- the graph shown in Figure 35(a) does not include information about RKs, which is an example of the polymer characteristic value PV of the raw material polymer.
- Figure 35 (b) shows actual measurement data showing the change in the elastic modulus in the direction perpendicular to the axis with respect to the set temperature of the mold.
- the measured RKs of the raw polymer is 191 [N/mm].
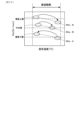
- the graph shown in FIG. 35(a) is shifted in the vertical and/or horizontal directions so that the peak positions of the graph shown in FIG. 35(a) and the peak positions of the graph shown in FIG. 35(b) coincide.
- the graph is shifted in the direction of the elastic modulus perpendicular to the axis and/or in the direction of the set temperature.
- Display process S5 1 the display unit 7 displays a value obtained from the reaction rate according to the reaction time based on the analysis result of the crosslinking reaction analysis unit 4. As shown in FIG.
- the display unit 7 displays characteristics corresponding to the temperature of the mold model MM used in the cross-linking reaction of the polymer part 12 and the in-mold reaction time from the start of the cross-linking reaction to the demolding of the mold model MM.
- the display unit 7 displays the presence or absence of internal bubbles 80 based on the estimation results of the internal bubble estimation unit 6, according to the temperature of the mold model MM and the in-mold reaction time from the start of the crosslinking reaction to the demolding of the mold model MM.
- the display unit 7 displays a value obtained from the reaction rate according to the temperature of the mold model MM and the in-mold reaction time from the start of the crosslinking reaction to the demolding of the mold model MM, along with the presence or absence of internal bubbles 80.
- the contents displayed by the display unit 7 are not limited to the above.
- Table 1 summarizes the relationship between the mold temperature and reaction time for the crosslinking reaction rate in the element with the smallest crosslinking reaction rate in the target workpiece model WM.
- the reaction times listed in Table 1 represent the reaction times when the target work model WM is placed inside the mold 10.
- the reaction rate values listed in Table 1 are calculated based on the temperature history of both the reaction time when the target work model WM is placed inside the mold 10 and the time after the target work model WM is released from the mold 10. Since the crosslinking reaction continues even after the target work model WM is released from the mold 10, the above considerations are necessary. In the following explanation, the same applies to the reaction times and reaction rates listed in Tables 2 to 4.
- the area surrounded by a thick line in the upper right corner has a reaction rate greater than 115%. In this area, the back reaction of the crosslinking reaction is proceeding excessively, which is undesirable.
- the range of reaction rates can be set arbitrarily, and a value other than 115% can be used as the threshold value.
- the area surrounded by a thick line in the lower left of Table 1 has a reaction rate lower than 95%. This is not desirable because the crosslinking reaction has not progressed sufficiently in this area.
- the reaction rate range can be set arbitrarily, and a value other than 95% can be used as the threshold value.
- Table 1 the areas surrounded by thick lines, excluding the upper right area and the lower left area, are favorable areas from the viewpoint of the reaction rate of the crosslinking reaction. Note that Table 1 does not include information regarding the internal bubbles 80, which will be described later.
- Table 2 summarizes the relationship between the mold temperature and reaction time for the average crosslinking reaction of all elements of the target workpiece model WM.
- the area surrounded by a thick line in the upper right corner has a reaction rate greater than 115%. In this area, the reverse reaction of the crosslinking reaction is proceeding excessively, which is undesirable.
- the reaction rate range can be set arbitrarily, and a value other than 115% can be used as the threshold value.
- the area surrounded by a thick line in the lower left of Table 2 has a reaction rate lower than 95%. This is not desirable because the crosslinking reaction has not progressed sufficiently in this area.
- the reaction rate range can be set arbitrarily, and a value other than 95% can be used as the threshold value.
- the regions other than the upper right region and the lower left region are favorable regions from the viewpoint of the reaction rate of the crosslinking reaction. Note that Table 2 does not include information regarding the internal bubbles 80, which will be described later.
- Table 3 summarizes the relationship between the mold temperature and reaction time for the crosslinking reaction rate in the element with the highest crosslinking reaction rate in the target workpiece model WM.
- the area surrounded by a thick line in the upper right corner has a reaction rate greater than 115%. In this area, the reverse reaction of the crosslinking reaction is proceeding excessively, which is undesirable.
- the range of the reaction rate can be set arbitrarily, and a value other than 115% can be used as the threshold value.
- the area surrounded by a thick line in the lower left of Table 3 has a reaction rate lower than 95%. This is not desirable because the crosslinking reaction has not progressed sufficiently in this area.
- the reaction rate range can be set arbitrarily, and a value other than 95% can be used as the threshold value.
- the regions other than the upper right region and the lower left region are favorable regions from the viewpoint of the reaction rate of the crosslinking reaction. Note that Table 3 does not include information regarding the internal bubbles 80, which will be described later.
- Table 4 is Table 2 with the addition of information regarding the internal bubbles 80.
- the area surrounded by a thick line in the upper right corner has a reaction rate greater than 115%. In this area, the reverse reaction of the crosslinking reaction is proceeding excessively, which is undesirable.
- the range of reaction rates can be set arbitrarily, and a value other than 115% can be used as the threshold value.
- reaction rate is less than 95%. This is not desirable because the crosslinking reaction has not progressed sufficiently in this area.
- the reaction rate range can be set arbitrarily, and a value other than 95% can be used as the threshold value.
- Table 4 was created by adding information about the internal bubbles 80 to the prediction results shown in Table 2, but this is not limited to the above, and information about the internal bubbles 80 can be added to the prediction results of the reaction rate at any temperature.
- the reaction times listed in Table 5 represent the reaction times when the target work model WM is placed inside the mold 10.
- the elastic modulus values listed in Table 5 are calculated based on the temperature history of both the reaction time when the target work model WM is placed inside the mold 10 and the time after the target work model WM is released from the mold 10. Since the crosslinking reaction continues even after the target work model WM is released from the mold 10, the above considerations are necessary. Note that in the following explanation, the same applies to the reaction times and elastic moduli listed in Figures 28 to 31.
- the elastic modulus is the elastic modulus when a static force is applied in a direction perpendicular to the axis A of the target work model WM.
- the values in the table are the ratios to the elastic modulus when the reaction rate of the cross-linking reaction is 100%.
- the direction of the force applied to the target work model WM is not limited, and the elastic modulus can be used when a force is applied in any direction, such as when a static force is applied in a direction parallel to the axis A of the target work model WM, when a static force is applied in a direction rotating around the axis A of the target work model WM, when a static force is applied in a direction tilting against the axis A of the target work model WM, etc.
- the force applied to the target work model WM is not limited to a static force, and may be, for example, the elastic modulus when vibration is applied to the target work model WM.
- Table 5 shows the relationship between the elastic modulus obtained as a result of performing a structural analysis in which an elastic modulus according to the degree of vulcanization was assigned to each element of the target workpiece model WM, and the mold temperature and reaction time.
- the meanings of the thick lines, double lines, and dashed lines in Table 5 are the same as those in Table 4, so redundant explanations will be omitted. Note that in Table 5, cells with a "-" written in them indicate where a calculation error occurred in the elastic modulus simulation.
- any information can be added to Table 5, such as information about the internal bubbles 80.
- lines are used to separate the numerical values in the table, but this is not limited to the above.
- the numerical values in the table can be separated by any method, such as changing the color of the numerical values in the table, changing the font, changing the typeface to italics or bold, changing the background color of the cells in which the numerical values are written, or changing the background pattern of the cells.
- FIG. 27 shows a heat map diagram 90 that displays the distribution of the reaction rate of the crosslinking reaction for the target workpiece model WM in shades of gray.
- the outer joint member 13 and the inner joint member 14 of the target workpiece model WM are displayed in white. Also, the polymer part 12 of the target workpiece model WM is displayed divided into regions 91 to 94 according to the reaction rate of the crosslinking reaction, and each of the divided regions 91 to 94 is displayed in shade according to the crosslinking reaction rate.
- Area 91 has the highest cross-linking reaction rate and is displayed in the darkest color tone.
- Area 92 has the second highest cross-linking reaction rate and is displayed in the second darkest color tone.
- Area 93 has the third highest cross-linking reaction rate and is displayed in the third darkest color tone.
- Area 94 has the lowest cross-linking reaction rate and is displayed in the lightest color tone.
- the display unit 7 displays a heat map diagram 90 to the operator. By visually checking the regions 91 to 94, which are displayed in shades, the operator can intuitively understand the distribution of the reaction rate of the crosslinking reaction in the polymer portion 12 of the target work model WM.
- the heat map diagram 90 can be created and output for all reaction conditions (e.g., temperature, time, etc.) related to the target workpiece model WM.
- the heat map diagram 90 may also be created and output only for certain reaction conditions.
- the method of displaying the heat map diagram 90 by the display unit 7 is not particularly limited, and for example, the display unit 7 may display the above-mentioned Table 5, and the operator may select each cell of the displayed Table 5, thereby displaying the heat map diagram 90 for the reaction conditions corresponding to that cell. In addition, the operator may input the reaction conditions for the crosslinking reaction, thereby displaying the heat map diagram 90 corresponding to the input reaction conditions.
- the heat map diagram 90 is configured to display the polymer portion 12 divided into regions 91 to 94, but is not limited to this, and the polymer portion 12 may be displayed divided into two to three regions, or five or more regions. Also, in the heat map diagram 90, regions with high reaction rates may be displayed in lighter shades, and regions with low reaction rates may be displayed in darker shades.
- areas with high response rates may be displayed in warm colors such as red, and areas with low response rates may be displayed in cool colors such as blue, or areas with high response rates may be displayed in cool colors such as blue, and areas with low response rates may be displayed in warm colors such as red.
- Figs. 28 to 30 are graphs of the elastic modulus of the target workpiece model WM versus the reaction time of the crosslinking reaction.
- Fig. 28 is a graph when the crosslinking reaction of the polymer part 12 of the target workpiece model WM is performed at the lowest temperature of the mold 10
- Fig. 29 is a graph when the crosslinking reaction of the polymer part 12 of the target workpiece model WM is performed at a medium temperature of the mold 10
- FIG. 30 is a graph when the crosslinking reaction of the polymer part 12 of the target workpiece model WM is performed at the highest temperature of the mold 10.
- the solid line indicates the actual measured value of the elastic modulus
- the dashed line indicates the predicted value.
- the elastic modulus increases after the crosslinking reaction begins, reaches a maximum value, and then decreases after reaching the maximum value.
- Figure 31 shows a graph of the elastic modulus versus reaction time when a force is applied in a direction perpendicular to the axis A of the target work model WM.
- Square symbols indicate the elastic modulus in the element where the temperature of the polymer part 12 of the target work model WM is the highest.
- Round symbols indicate the elastic modulus in the element where the temperature of the polymer part 12 of the target work model WM is the median.
- Triangular symbols indicate the elastic modulus in the element where the temperature of the polymer part 12 of the target work model WM is the lowest.
- open symbols indicate cases where internal bubbles 80 are predicted to occur, and filled symbols indicate cases where internal bubbles 80 are predicted not to occur.
- graphs for the element where the temperature of the polymer portion 12 is at its highest value and the element where the temperature is at its median value are graphs for the reaction return period after the reaction progress period.
- the cross-linking reaction proceeds most quickly in the element where the temperature of the polymer portion 12 is the highest. For this reason, it was predicted that when the reaction time exceeds 3 minutes and 3 minutes and 30 seconds have passed, the internal bubbles 80 would not be generated. In the element where the temperature of the polymer portion 12 is the highest, the return reaction of the cross-linking reaction also proceeds quickly, and therefore the modulus of elasticity is the lowest when the reaction time has passed 6 minutes.
- the progress of the crosslinking reaction is also at a moderate level. For this reason, it was predicted that when the reaction time exceeds 3 minutes 30 seconds and 4 minutes have passed, the internal bubbles 80 will not be generated.
- the elastic modulus at 6 minutes of reaction time is greater than that of the element where the temperature of the polymer portion 12 is the highest.
- the crosslinking reaction progresses the slowest. Therefore, before the reaction time is 4 minutes, the reaction is in the progress phase, and it was predicted that the elastic modulus would increase as the reaction time progresses. After the reaction time has passed 4 minutes, the reversal reaction of the crosslinking reaction progresses, and the elastic modulus was predicted to gradually decrease. In the element where the temperature of the polymer part 12 is the lowest, it was predicted that the internal bubbles 80 would not be generated when the reaction time exceeds 5 minutes and 5 minutes and 30 seconds have passed. At this point, it was predicted that the internal bubbles 80 would disappear in the entire area of the polymer part 12 of the target work model WM. The elastic modulus after the reaction time of 6 minutes has passed was predicted to be the largest in the entire area of the polymer part 12.
- the reaction time of 6 minutes was adopted as the reaction time of this target work model WM.
- the variation in the elastic modulus of the polymer portion 12 was predicted to be 12%.
- Figure 32 uses a cross-sectional view of the target work model WM to show the likelihood of internal bubbles 80 occurring in the polymer part 12 using shading.
- the outer joint member 13 and inner joint member 14 of the target work model WM are shown in the darkest pattern in Figure 32.
- the polymer part 12 of the target work model WM is shown with the lightest pattern in Figure 32. Inside the polymer part 12, an elliptical region P and an elliptical region Q located inside region P are displayed. Region P is displayed with a pattern that is slightly darker than the light pattern representing the polymer part 12. Region Q is displayed with a pattern that is slightly darker than region P.
- region P is determined to be a region in which internal bubbles 80 are relatively likely to occur
- region Q is determined to be a region in which internal bubbles 80 are more likely to occur than region P. Regions P and Q actually correspond to regions in which internal bubbles 80 are likely to occur (see FIG. 23).
- the display unit 7 displays the target work model WM shown in FIG. 32.
- the worker visually recognizes the outer bonding member 13 and inner bonding member 14 shown in a relatively dark pattern, and the polymer portion 12 shown in a relatively light pattern.
- the worker can intuitively understand that the outer bonding member 13 and inner bonding member 14 shown in a dark pattern are different parts from the polymer portion 12. This allows the worker to intuitively understand that in order to find the internal bubble 80, it is sufficient to check the polymer portion 12 shown in a relatively light pattern.
- the outer bonding member 13 and inner bonding member 14 may also be displayed in white.
- regions P and Q which are shown in a relatively dark pattern, are displayed in the polymer portion 12, which is shown in a light pattern.
- regions P and Q which are shown in a relatively dark pattern
- region Q is displayed in a darker pattern than region P
- the worker can intuitively understand that internal bubbles 80 are most likely to occur in region P.
- regions where internal bubbles 80 are likely to occur may also be displayed in a relatively light pattern.
- FIG. 38 shows a graph relating to the correlation between the elastic modulus Ks and the set temperature of the crosslinking reaction for raw material polymers having multiple (three in this embodiment) different RKs.
- the horizontal axis of the graph in Figure 38 is the set temperature of the mold in which the crosslinking reaction is carried out.
- a specific manufacturing range is set for the set temperature.
- the crosslinking reaction is carried out at a set temperature within the manufacturing range.
- the vertical axis of the graph shown in FIG. 38 is the elastic modulus Ks of the target work model WM.
- Standards have been established for the elastic modulus Ks.
- the elastic modulus Ks of the target work model WM is required to be a value within the range between the upper and lower limits of the standard. If Ks is greater than the upper limit of the standard, or if Ks is less than the lower limit of the standard, the target work model WM is deemed a defective product.
- the elastic modulus Ks is a value between the upper and lower limits of the specification, and it is more preferable that it is close to the median.
- the elastic modulus Ks of the target work model WM may fall within the range between the upper and lower limits of the specification. Even in such a case, the set temperature can be adjusted based on the simulation results so that the elastic modulus Ks of the target work model WM is close to the midpoint between the upper and lower limits of the specification.
- the display unit 7 may display the graph shown in FIG. 38 to the worker.
- the display unit 7 may also display the numerical value of the set temperature that is appropriately set in FIG. 38 to the worker.
- the setting condition analysis unit may be configured to transmit the value of the set temperature appropriately set in FIG. 38 to a crosslinking reaction device (not shown) without displaying it on the display unit 7, and the crosslinking reaction device may then carry out a crosslinking reaction on the raw polymer based on the received value.
- Embodiment 1-2 differs from embodiment 1-2 in that the reaction time of the crosslinking reaction of the polymer portion 12 is used as the polymer characteristic value PV.
- Figure 39(a) shows the correlation between the elastic modulus Ks of the target work model WM calculated as described above and the reaction time of the crosslinking reaction.
- the vertical axis represents the ratio of the elastic modulus in the direction perpendicular to the axis, and is not the value of the elastic modulus Ks itself.
- the graph shown in Figure 35(a) does not include information about RKs, which is an example of the polymer characteristic value PV of the raw material polymer.
- Figure 39(b) shows actual measurement data showing the change in the elastic modulus in the direction perpendicular to the axis versus the reaction time of the crosslinking reaction.
- the raw polymer has a certain RKs.
- the graph shown in FIG. 39(a) is shifted in the vertical and/or horizontal directions so that the peak position of the graph shown in FIG. 39(a) coincides with the peak position of the graph shown in FIG. 39(b).
- the graph is shifted in the direction of elastic modulus perpendicular to the axis and/or in the direction of reaction time.
- the heat transfer analysis process S1, the cross-linking reaction analysis process S2, and the structure analysis process S3 described in FIG. 4 of embodiment 1-1 are executed to create Table 6, which corresponds to Table 5 of embodiment 1-1.
- Table 6 summarizes the relationship between the elastic modulus Ks of the target work model WM, the set temperature for the crosslinking reaction, and the reaction time for the crosslinking reaction.
- the set temperature is not particularly limited, and may be the temperature of the mold 10, the temperature of the insert, or the temperature of another component.
- the elastic modulus Ks may be the elastic modulus of the target work model WM in the direction perpendicular to the axis, or in the axial direction.
- the elastic modulus Ks of the target work model WM is ⁇ 1.
- the elastic modulus Ks of the target work model WM is ⁇ n.
- l, m, and n are natural numbers equal to or greater than 1.
- Table 6 does not include information about RKs.
- a crosslinking reaction is carried out using a raw material polymer having a specified RKs, and actual measurement data is obtained for the elastic modulus, set temperature, and reaction time. Based on the actual measurement data obtained, the set temperature and reaction time listed in Table 6 are changed. Specifically, the set temperature and reaction time are shifted to match the value of the elastic modulus Ks of the actual measurement data. In this way, Table 7 is created.
- the elastic modulus Ks of the target work model WM is ⁇ 1.
- the elastic modulus Ks of the target work model WM is ⁇ n.
- l, m, and n are natural numbers equal to or greater than 1. This allows the simulation results obtained by executing the heat transfer analysis process S1, the cross-linking reaction analysis process S2, and the structural analysis process S3 to be calibrated to match the actual measurement data.
- the heat transfer analysis process S1, the cross-linking reaction analysis process S2, and the structure analysis process S3 described in FIG. 4 of embodiment 1-1 are executed to create Table 6, which corresponds to Table 5 of embodiment 1-1.
- a crosslinking reaction is carried out using a raw material polymer having a specified RKs, and actual measurement data is obtained for the elastic modulus, set temperature, and reaction time. Based on the actual measurement data obtained, the reaction time listed in Table 6 is changed. Specifically, the reaction time is shifted to match the value of the elastic modulus Ks of the actual measurement data. In this way, Table 8 is created.
- the elastic modulus Ks of the target work model WM is ⁇ 1.
- the elastic modulus Ks of the target work model WM is ⁇ n.
- l, m, and n are natural numbers equal to or greater than 1. This allows the simulation results obtained by executing the heat transfer analysis process S1, the cross-linking reaction analysis process S2, and the structural analysis process S3 to be calibrated to match the actual measurement data.
- the heat transfer analysis process S1, the cross-linking reaction analysis process S2, and the structure analysis process S3 described in FIG. 4 of embodiment 1-1 are executed to create Table 6, which corresponds to Table 5 of embodiment 1-1.
- a crosslinking reaction is carried out using a raw material polymer having a specified RKs, and actual measurement data is obtained for the modulus of elasticity, set temperature, and reaction time. Based on the actual measurement data obtained, the set temperature listed in Table 6 is changed. Specifically, the set temperature is shifted to match the value of the modulus of elasticity Ks of the actual measurement data. In this way, Table 9 is created.
- the elastic modulus Ks of the target work model WM is ⁇ 1.
- the elastic modulus Ks of the target work model WM is ⁇ n.
- l, m, and n are natural numbers equal to or greater than 1. This allows the simulation results obtained by executing the heat transfer analysis process S1, the cross-linking reaction analysis process S2, and the structural analysis process S3 to be calibrated to match the actual measurement data.
- the heat transfer analysis process S1, the cross-linking reaction analysis process S2, and the structural analysis process S3 shown in FIG. 4 of embodiment 1-1 are executed to create Table 6, which corresponds to Table 5 of embodiment 1-1.
- a crosslinking reaction is carried out using a raw material polymer having a specified RKs, and actual measurement data is obtained for the elastic modulus, set temperature, and reaction time. Based on the actual measurement data obtained, the set temperature, reaction time, and elastic modulus Ks listed in Table 6 are changed. Specifically, the set temperature, reaction time, and elastic modulus Ks are shifted to match the value of the elastic modulus Ks of the actual measurement data. In this way, Table 10 is created.
- the elastic modulus Ks of the target work model WM is ⁇ '1.
- the elastic modulus Ks of the target work model WM is ⁇ 'n.
- l, m, and n are natural numbers equal to or greater than 1. This allows the simulation results obtained by executing the heat transfer analysis process S1, the cross-linking reaction analysis process S2, and the structural analysis process S3 to be calibrated to match the actual measurement data.
- This embodiment differs from the above-described embodiment 1-3 in that the elastic modulus Ks of the target work model WM is also shifted.
- the elastic modulus Ks is fixed and simulation results and actual measurement data are constructed as in embodiment 1-3.
- the set temperature T'l and reaction time t'm will be numerical values that include decimals.
- a simulation result is corrected using a table, and the simulation result is corrected by shifting the target work model elastic modulus Ks for one cell in the table.
- the heat transfer analysis process S1, the cross-linking reaction analysis process S2, and the structure analysis process S3 described in FIG. 4 of embodiment 1-1 are executed to create Table 6, which corresponds to Table 5 of embodiment 1-1.
- a crosslinking reaction is carried out using a raw material polymer having a specified RKs, and actual measurement data is obtained for the elastic modulus, set temperature, and reaction time. Based on the actual measurement data obtained, only one piece of data for the elastic modulus Ks listed in Table 6 is changed. Specifically, only one value of the elastic modulus Ks is shifted to match the value of the elastic modulus Ks of the actual measurement data. In this way, Table 11 is created.
- the elastic modulus Ks of the target work model WM is ⁇ '3. This allows the simulation results obtained by executing the heat transfer analysis process S1, the cross-linking reaction analysis process S2, and the structural analysis process S3 to be calibrated to match the actual measurement data. According to this embodiment, it is only necessary to configure the desired value of the elastic modulus Ks, thereby shortening the calculation time.
- the elastic modulus Ks of a target workpiece model is predicted using a simulation result related to the reaction rate of a crosslinking reaction and machine learning.
- machine learning a number of trained models up to the same number as the number of elements of the target workpiece model WM is generated, and a number of reaction rates of the crosslinking reaction up to the same number as the number of elements is used.
- the crosslinking reaction simulation device 1a includes a calculation processing unit 9 that performs machine learning.
- the crosslinking reaction simulation device 1a according to this embodiment generates a trained model TM by performing machine learning using training data TRD for learning selected from data related to the reaction rate of the crosslinking reaction of the polymer part 12, and predicts the target work model elastic modulus Ks using this trained model TM.
- the cross-linking reaction simulation device 1a includes a calculation processing unit 9.
- the calculation processing unit 9 performs machine learning.
- the heat transfer analysis unit 3, the cross-linking reaction analysis unit 4, the structure analysis unit 5, the internal bubble estimation unit 6, and the setting condition analysis unit 8 are the same as those in FIG. 1a, so they are denoted by the same reference numerals and redundant explanations are omitted.
- the calculation processing unit 9 generates a trained model TM by performing machine learning using the training data TRD.
- the calculation processing unit 9 also predicts the objective variable using the trained model TM.
- the objective variable is not particularly limited, and any objective variable can be appropriately selected, such as the final reaction rate of the polymer part 12, the reaction rate of the polymer part 12 at the time of demolding, the final equivalent reaction amount of the polymer part 12, the equivalent reaction amount of the polymer part at the time of demolding, the elastic modulus Ks of the target work model WM, the occurrence of internal bubbles in the polymer part 12, etc.
- the memory unit 2 stores training data TRD for learning selected from data related to the reaction rate or equivalent reaction amount of the crosslinking reaction of the polymer portion 12, a trained model TM generated by performing machine learning using the training data TRD, and a threshold value TH.
- Figure 47 shows the main flow of the operation of the crosslinking reaction simulation device 1a according to this embodiment.
- a simulation process S10 is executed.
- a prediction process S20 is executed, and the operation ends.
- a step of determining the analysis conditions by experimental design may be executed. By using the data selected by experimental design, the simulation process S10 can be executed efficiently.
- the simulation process S10 in this embodiment is the same as the main flow shown in FIG. 4 in the first embodiment, so the same processes are given the same reference numerals and duplicated explanations are omitted.
- FIG. 49 shows a flowchart of the prediction process according to this embodiment.
- the calculation processing unit 9 When the prediction process (S20) starts, the calculation processing unit 9 generates training data (S210).
- the training data is extracted from the multiple reaction rates calculated by the reaction rate calculation processing unit 41.
- the training data may be extracted randomly from the multiple reaction rates, or may be extracted based on a predetermined rule that takes into account the distribution of data related to the multiple reaction rates, or may be extracted based on an experimental design method, for example.
- the calculation processing unit 9 generates a first trained model (S211).
- the first trained model is an example of a trained model.
- the calculation processing unit 9 generates a first trained model for each element corresponding to multiple analysis meshes of the target work model WM. That is, a maximum of the same number of first trained models as the analysis meshes of the target work model WM are generated.
- the first trained model predicts the final reaction rate of the polymer part 12 from the setting conditions of the crosslinking reaction of the polymer part 12.
- the final reaction rate is the final reaction rate of element number n.
- the calculation processing unit 9 generates a second trained model (S211).
- the second trained model is an example of a trained model.
- the calculation processing unit 9 predicts the elastic modulus Ks of the target work model from the set conditions and the final reaction rates of each element of the multiple analysis meshes of the target work model WM predicted based on the multiple first trained models.
- the calculation processing unit 9 predicts the reaction rate (S213). As a result, the calculation processing unit 9 predicts the final reaction rate for each element corresponding to the multiple analysis meshes of the target workpiece model WM based on the set conditions and the first and second trained models.
- the calculation processing unit 9 calculates the coefficient of determination R2 for the first trained model and the second trained model (S214).
- the following formula (19) is used for the coefficient of determination R2 .
- the coefficient of determination R2 may be defined differently.
- the index of prediction accuracy is not limited to the coefficient of determination R2 , and any index such as the mean absolute error (MEA) or the root mean square error (RMSE) can be appropriately selected.
- y is a sample value
- f is an estimated value based on prediction
- y av is the average value of the sample values
- the calculation processing unit 9 judges whether the coefficient of determination R 2 (first) of the first trained model is smaller than a threshold value TH (S215).
- the value of the threshold value TH is not particularly limited, and any value can be appropriately adopted.
- the threshold value TH is preferably 0.6 to 0.9, and more preferably 0.65 to 0.75.
- the threshold value TH in this embodiment is set to 0.7.
- the calculation processing unit 9 determines whether the coefficient of determination R2 (second) of the second trained model is smaller than the threshold value (S216).
- the simulation process (S218) is executed for all conditions. This calculates the target work model elastic modulus Ks. This ends the prediction process (S20).
- the calculation processing unit 9 predicts the final reaction rate of each element corresponding to the multiple analysis meshes of the target work model WM using the set conditions and the first trained model. Next, the calculation processing unit 9 predicts the elastic modulus Ks of the target work model using the set conditions and the final reaction rate of each element corresponding to the multiple analysis meshes of the target work model WM using the second trained model (S217). With the above, the prediction process (S20) is completed.
- FIG. 50 shows the correlation when the horizontal axis represents the final reaction rate of element number n of polymer part 12 obtained by simulation processing, and the vertical axis represents the final reaction rate of element number n predicted by machine learning.
- the final reaction rate can be predicted by machine learning, and the elastic modulus Ks of the target workpiece model can be predicted by machine learning. This makes it possible to reduce the calculation time for the elastic modulus Ks of the target workpiece model.
- the calculation time for the setting conditions can be reduced overall.
- the elastic modulus Ks of a target workpiece model is predicted using a simulation result related to the reaction rate of the crosslinking reaction and machine learning.
- machine learning a trained model that predicts multiple statistics regarding the reaction rate of the crosslinking reaction is generated, and the reaction rates of the crosslinking reaction are used in the same number as the statistics.
- FIG. 51 shows a part of a flowchart of the prediction process of this embodiment.
- the calculation processing unit 9 creates training data (S2200).
- the process of S2200 in this embodiment is the same as S210 in FIG. 49, so a duplicated explanation will be omitted.
- the calculation processing unit 9 generates a first trained model (S2201), generates a third trained model (S2202), and generates a fourth trained model (S2203).
- the processing of S2201 is the same as S210 in FIG. 49, so a duplicated explanation will be omitted.
- the fourth trained model may be generated after S2207, which will be described later, and before S2209.
- the third trained model predicts the elastic modulus Ks of the target work model based on the set conditions and at least one of the average value of the final reaction rate of each element corresponding to the multiple analysis meshes of the target work model WM, and the maximum value, minimum value, and standard deviation of the final reaction rate of each element corresponding to the multiple analysis meshes of the target work model WM.
- the statistical quantities to be predicted are not limited to the above, and any statistical quantity may be predicted.
- the fourth trained model is an example of a trained model.
- the calculation processing unit 9 predicts at least one of the average, maximum, minimum, and standard deviation for the final reaction rate of each element corresponding to multiple analysis meshes of the target work model WM.
- the number of fourth trained models is the total of those that predict at least one of the average, maximum, minimum, and standard deviation of the final reaction rate. Therefore, the number of fourth trained models is at least one.
- the statistical quantity to be predicted is preferably the average. However, the statistical quantity to be predicted is not limited to the above, and any statistical quantity may be predicted.
- the calculation processing unit 9 predicts the reaction rate (S2204). As a result, the calculation processing unit 9 predicts the final reaction rate for each element corresponding to the multiple analysis meshes of the target work model WM based on the set conditions and the first trained model, the third trained model, and the fourth trained model. However, the reaction rate using the fourth trained model may be predicted after S2207 described below and before S2209.
- the calculation processing unit 9 calculates the coefficient of determination R2 for the first trained model, the third trained model, and the fourth trained model (S2205).
- the coefficient of determination R2 for the fourth trained model may be predicted after S2207 and before S2209, which will be described later.
- the calculation processing unit 9 determines whether the coefficient of determination R 2 (first) of the first trained model is smaller than a threshold value TH (S2206).
- the calculation processing unit 9 determines whether the coefficient of determination R2 (third) of the third trained model is smaller than the threshold value (S2207).
- the simulation process (S2208) is executed for all conditions. This calculates the target work model elastic modulus Ks. This ends the prediction process (S20) (see FIG. 52).
- the calculation processing unit 9 determines whether the coefficient of determination R 2 (fourth) of the fourth trained model is smaller than the threshold value TH (S2209).
- the calculation processing unit 9 selects the third trained model and the fourth trained model (S2210).
- the calculation processing unit 9 uses the fourth trained model to predict at least one of the average value, maximum value, minimum value, and standard deviation for the final reaction rate of each element corresponding to the multiple analysis meshes of the target work model WM (S2211).
- the calculation processing unit 9 executes a target work model elastic modulus prediction process (S2212).
- the calculation processing unit 9 predicts the target work model elastic modulus Ks based on the third learned model, the setting conditions, and at least one of the average value, maximum value, minimum value, and standard deviation for the final reaction rate of each element corresponding to the multiple analysis meshes of the target work model WM.
- the statistical quantity is not limited to the above, and any statistical quantity may be predicted.
- the prediction process (S20) ends.
- the calculation processing unit 9 selects the first trained model (S2213).
- the calculation processing unit 9 calculates the final reaction rate for elements corresponding to multiple analysis meshes of the target work model WM (S2214).
- the calculation processing unit 9 calculates statistics for elements corresponding to multiple analysis meshes of the target work model WM (S2215).
- the calculation processing unit 9 calculates the coefficient of determination R 2 (statistics) based on the predicted value of the statistics of the final reaction rate calculated in S2215 and the analytical value (S2216).
- the calculation processing unit 9 judges whether the coefficient of determination R 2 (statistics) is smaller than a threshold value TH (S2217).
- the simulation process (S2220) is executed for all conditions. This calculates the target workpiece model elastic modulus Ks. This ends the prediction process (S20) (see FIG. 52).
- the calculation processing unit 9 selects the third trained model (S2218).
- the calculation processing unit 9 predicts the target work model elastic modulus Ks using the third trained model and the statistics calculated in S2215 (S2219). This ends the prediction process (S20) (see FIG. 52).
- Fig. 54 and Fig. 55 show a part of a flowchart of the preheating process according to this modified example.
- the flowchart shown in Fig. 54 differs from the flowchart in Fig. 51 in that S2201 and S2206 are omitted.
- the flowchart in FIG. 55 differs from the flowchart in FIG. 53 in that S2201, S2204, S2205, and S2206 are included.
- a first trained model is generated (S2201).
- the reaction rate is predicted (S2204).
- the coefficient of determination R 2 for the first trained model is calculated (S2205).
- the calculation processing unit 9 determines whether the coefficient of determination R 2 (first) of the first trained model is smaller than the threshold value TH (S2206). If the coefficient of determination R 2 (first) of the first trained model is not smaller than the threshold value TH (S2206: N), the first trained model is selected (S2213).
- the first trained model is adopted when the accuracy of the third trained model and the fourth trained model is not sufficiently high. Since the first trained model generates multiple predictive models, it takes time to generate the models. Therefore, according to this embodiment, when the accuracy of the third trained model and the fourth trained model is sufficiently high, the generation of the first trained model can be omitted, and therefore, overall, processing can be speeded up.
- the elastic modulus Ks of a target workpiece model is predicted using a simulation result related to an equivalent reaction amount of a crosslinking reaction and machine learning.
- machine learning a number of trained models up to the same number as the number of elements of the target workpiece model WM is generated, and an equivalent reaction amount up to the same number as the number of elements is used.
- the calculation processing unit 9 When the prediction process (S230) according to this embodiment starts, the calculation processing unit 9 generates training data (S230).
- the calculation processing unit 9 extracts training data from the multiple equivalent reaction amounts calculated by the reaction rate calculation processing unit 41.
- the training data may be extracted randomly from the multiple equivalent reaction amounts, or may be extracted based on a predetermined rule taking into account the distribution of data related to the multiple equivalent reaction amounts, or may be extracted based on an experimental design method, for example.
- the calculation processing unit 9 generates a fifth trained model (S231).
- the fifth trained model is an example of a trained model.
- the calculation processing unit 9 generates a fifth trained model for each element corresponding to the multiple analysis meshes of the target work model WM. That is, a maximum of the same number of fifth trained models as the analysis meshes of the target work model WM are generated.
- the fifth trained model predicts the equivalent reaction amount of the polymer part 12 from the set conditions of the crosslinking reaction of the polymer part 12.
- the calculation processing unit 9 generates a sixth trained model (S232).
- the sixth trained model is an example of a trained model.
- the calculation processing unit 9 predicts the target work model elastic modulus Ks from the set conditions and the equivalent reaction amounts of each element of the multiple analysis meshes of the target work model WM predicted based on the multiple sixth trained models. For example, the predicted multiple equivalent reaction amounts may be converted into multiple final reaction amounts, and the target work model elastic modulus Ks may be predicted based on the converted multiple final reaction amounts.
- the calculation processing unit 9 executes an equivalent reaction amount prediction process (S233).
- the prediction processing unit predicts an equivalent reaction amount for each element corresponding to multiple analysis meshes of the target workpiece model WM based on the set conditions and the fifth trained model.
- the order of the process of generating the sixth trained model (S232) and the equivalent reaction amount prediction process (S233) is arbitrary.
- the graph shown in FIG. 11(b), in which the vertical axis represents the reaction rate and the horizontal axis represents the reaction time can be converted to a graph in which the vertical axis represents the reaction rate and the horizontal axis represents the equivalent reaction amount. This makes it easy to convert the predicted equivalent reaction amount into the reaction rate.
- the converted reaction rate can be used to determine the presence of internal bubbles, as described below.
- the calculation processing unit 9 calculates the coefficient of determination R2 for the fifth trained model and the sixth trained model (S234).
- the calculation processing unit 9 determines whether the coefficient of determination R 2 (fifth) of the fifth trained model is smaller than the threshold value TH (S235).
- the simulation process (S238) is executed for all conditions. This calculates the target work model elastic modulus Ks. This ends the prediction process (S20).
- the calculation processing unit 9 determines whether the coefficient of determination R2 (sixth) of the sixth trained model is smaller than the threshold value (S236).
- the simulation process (S238) is executed for all conditions. This calculates the target work model elastic modulus Ks. This ends the prediction process (S20).
- the calculation processing unit 9 predicts the equivalent reaction amount of each element corresponding to the multiple analysis meshes of the target work model WM using the set conditions and the fifth trained model. Next, the calculation processing unit 9 predicts the elastic modulus Ks of the target work model using the set conditions and the equivalent reaction amount of each element corresponding to the multiple analysis meshes of the target work model WM using the sixth trained model (S237). With the above, the prediction process (S20) is completed.
- FIG. 57 shows the correlation when the horizontal axis represents the final equivalent reaction amount of element number n of polymer part 12 obtained by simulation processing, and the vertical axis represents the final equivalent reaction amount of element number n predicted by machine learning.
- the prediction accuracy of the setting conditions can be improved overall.
- the calculation time can be shortened.
- the elastic modulus Ks of a target workpiece model is predicted using a simulation result related to the equivalent reaction amount of a crosslinking reaction and machine learning.
- machine learning a trained model that predicts multiple statistics for the equivalent reaction amount of a crosslinking reaction is generated, and the equivalent reaction amount of the crosslinking reaction is used in the same number as the statistics.
- FIG. 58 shows a part of a flowchart of the prediction process of this embodiment.
- the calculation processing unit 9 creates training data (S2400).
- S2400 in this embodiment is the same as S2200 in FIG. 51, so a duplicated explanation will be omitted.
- the calculation processing unit 9 generates a fifth trained model (S2401), a seventh trained model (S2402), and an eighth trained model (S24203).
- S2401 is the same as S2231 in FIG. 54, so a duplicated explanation will be omitted.
- the eighth trained model may be generated after S2407 described below and before S2409 (between S2407 and S2409).
- the seventh trained model predicts the elastic modulus Ks of the target work model based on the set conditions and at least one of the average value of the equivalent reaction amount of each element corresponding to the multiple analysis meshes of the target work model WM, and the maximum value, minimum value, and standard deviation of the equivalent reaction amount of each element corresponding to the multiple analysis meshes of the target work model WM.
- the eighth trained model is an example of a trained model.
- the calculation processing unit 9 predicts at least one of the average, maximum, minimum, and standard deviation of the equivalent reaction amount of each element corresponding to the multiple analysis meshes of the target work model WM.
- the number of eighth trained models is the total of those that predict at least one of the average, maximum, minimum, and standard deviation of the equivalent reaction amount. Therefore, the number of eighth trained models is at least one.
- the statistical amount to be predicted is not limited to the above, and any statistical amount may be predicted.
- the calculation processing unit 9 predicts the equivalent reaction amount (S2404).
- the calculation processing unit 9 predicts the equivalent reaction amount for each element corresponding to the multiple analysis meshes of the target workpiece model WM based on the set conditions and the fifth trained model, the seventh trained model, and the eighth trained model.
- the equivalent reaction amount using the eighth trained model may be predicted after S2407 described below and before S2409 (between S2407 and S2409).
- the calculation processing unit 9 calculates the coefficient of determination R2 for the fifth trained model, the seventh trained model, and the eighth trained model (S2405).
- the coefficient of determination R2 for the eighth trained model may be predicted after S2407 and before S2409 (between S2407 and S2409), which will be described later.
- the calculation processing unit 9 determines whether the coefficient of determination R 2 (fifth) of the fifth trained model is smaller than the threshold value TH (S2406).
- a simulation process (S2408) is executed for all conditions.
- the contents of the simulation process (S2408) are the same as those of the simulation process (S10) in FIG. 48, so duplicated explanations will be omitted.
- This calculates the target work model elastic modulus Ks. This completes the prediction process (S20) (see FIG. 59).
- the calculation processing unit 9 determines whether the coefficient of determination R2 (third) of the third trained model is smaller than the threshold value (S2207).
- the simulation process (S2408) is executed for all conditions. This calculates the target work model elastic modulus Ks. This ends the prediction process (S20) (see FIG. 59).
- the calculation processing unit 9 determines whether the coefficient of determination R 2 (8th) of the 8th trained model is smaller than the threshold value TH (S2409).
- the calculation processing unit 9 selects the seventh trained model and the eighth trained model (S2410).
- the calculation processing unit 9 uses the eighth trained model to predict at least one of the average value, maximum value, minimum value, and standard deviation for the equivalent reaction amount of each element corresponding to the multiple analysis meshes of the target work model WM (S2411).
- the calculation processing unit 9 executes a target work model elastic modulus prediction process (S2412).
- the calculation processing unit 9 predicts the target work model elastic modulus Ks based on the seventh trained model, the setting conditions, and at least one of the average value, maximum value, minimum value, and standard deviation for the final reaction rate of each element corresponding to the multiple analysis meshes of the target work model WM.
- the statistical quantity is not limited to the above, and any statistical quantity may be predicted.
- the prediction process (S20) ends.
- the calculation processing unit 9 selects the fifth trained model (S2413).
- the calculation processing unit 9 calculates the equivalent reaction amount for all elements corresponding to the multiple analysis meshes of the target work model WM (S2414).
- the calculation processing unit 9 calculates statistics for all elements corresponding to the multiple analysis meshes of the target work model WM (S2415).
- the calculation processing unit 9 calculates the coefficient of determination R 2 (statistics) based on the predicted value of the statistics of the final reaction rate calculated in S2415 and the analytical value (S2416).
- the calculation processing unit 9 judges whether the coefficient of determination R 2 (statistics) is smaller than a threshold value TH (S2417).
- the simulation process (S2420) is executed for all conditions. This calculates the target work model elastic modulus Ks. This ends the prediction process (S20) (see FIG. 57).
- the calculation processing unit 9 selects the seventh trained model (S2418).
- the calculation processing unit 9 predicts the target work model elastic modulus Ks using the seventh trained model and the statistics calculated in S2415 (S2419). This ends the prediction process (S20) (see FIG. 59).
- a minimum of one eighth trained model is used, which shortens the calculation time for the target work model elastic modulus Ks.
- S2401 and S2406 shown in FIG. 58 may be omitted, and S2401, S2404, S2405, and S2406 may be executed in FIG. 60.
- the fifth trained model is adopted when the accuracy of the seventh trained model and the eighth trained model is not sufficiently high. Since the fifth trained model generates multiple predictive models, it takes time to generate the models. Therefore, according to this embodiment, when the accuracy of the seventh trained model and the eighth trained model is sufficiently high, the generation of the fifth trained model can be omitted, and therefore, overall, processing can be speeded up.
- Embodiment 3-1 Next, embodiment 3-1 will be described with reference to Fig. 61.
- the occurrence of internal bubbles in a target workpiece model WM is predicted using a simulation result related to the reaction rate of a crosslinking reaction and machine learning.
- machine learning a number of trained models up to the same number as the number of elements of the target workpiece model WM is generated, and a number of reaction rates of the crosslinking reaction up to the same number as the number of elements is used.
- FIG. 61 shows a flowchart of the prediction process according to this embodiment.
- the prediction process (S20) starts, the calculation processing unit 9 generates training data (S250).
- the process of S250 in this embodiment is the same as S210 in FIG. 49, so a duplicated explanation will be omitted.
- the calculation processing unit 9 generates a ninth trained model (S251).
- the ninth trained model is an example of a trained model.
- the calculation processing unit 9 generates a ninth trained model for each element corresponding to the multiple analysis meshes of the target work model WM. That is, a maximum of the same number of ninth trained models as the analysis meshes of the target work model WM are generated.
- the ninth trained model predicts the reaction rate of the polymer part 12 at the time of demolding from the set conditions of the crosslinking reaction of the polymer part 12.
- the prediction processing unit executes a demolding reaction rate prediction process (S252).
- the prediction processing unit predicts the demolding reaction rate for each element corresponding to the multiple analysis meshes of the target workpiece model WM based on the set conditions and the ninth trained model.
- the calculation processing unit 9 calculates the coefficient of determination R 2 (ninth) based on the demolding reaction rate calculated in S252 and the analytical value (S253).
- the calculation processing unit 9 judges whether the coefficient of determination R 2 (ninth) is smaller than a threshold value TH (S254).
- the simulation process (S256) is executed for all conditions. The presence or absence of internal bubbles is predicted. This ends the prediction process (S20).
- the calculation processing unit 9 estimates the generation of internal bubbles in the target workpiece model WM based on the demolding reaction rate calculated in S252 (S255, internal bubble estimation process).
- S255 internal bubble estimation process
- the content of S255 is the same as S4 in Fig. 4, so a duplicated explanation will be omitted.
- the occurrence of internal bubbles in the target workpiece model WM can be predicted by machine learning. This makes it possible to reduce the number of analyses required to predict the occurrence of internal bubbles in the target workpiece model WM, and shorten the calculation time.
- Embodiment 3-2 Next, embodiment 3-2 will be described with reference to FIG. 62.
- the occurrence of internal bubbles in a target workpiece model WM is predicted using a simulation result related to the reaction rate of a crosslinking reaction and machine learning.
- machine learning a trained model that predicts multiple statistics regarding the reaction rate of a crosslinking reaction is generated, and the reaction rates of the crosslinking reaction are used in the same number as the statistics.
- the minimum value of the reaction amount at demolding may be used as the multiple statistics.
- FIG. 62 shows a flowchart of the prediction process of this embodiment.
- the calculation processing unit 9 creates training data (S260).
- S260 training data
- the process of S260 in this embodiment is the same as S210 in FIG. 49, so a duplicated explanation will be omitted.
- the calculation processing unit 9 generates a tenth trained model (S261).
- the tenth trained model is an example of a trained model.
- the calculation processing unit 9 predicts at least one of the average value, maximum value, minimum value, and standard deviation of the demolding reaction rate of each element corresponding to the multiple analysis meshes of the target workpiece model WM.
- the number of tenth trained models is the total of those that predict at least one of the average value, maximum value, minimum value, and standard deviation of the demolding reaction rate. Therefore, the number of tenth trained models is at least one in the smallest case.
- the statistical quantity is not limited to the above, and any statistical quantity may be predicted.
- the prediction processing unit executes a demolding reaction rate prediction process (S262). As a result, the prediction processing unit predicts the demolding reaction rate for each element corresponding to the multiple analysis meshes of the target workpiece model WM based on the set conditions and the 10th trained model.
- the calculation processing unit 9 calculates the coefficient of determination R 2 (tenth) based on the demolding reaction rate calculated in S262 and the analytical value (S253).
- the calculation processing unit 9 judges whether the coefficient of determination R 2 (tenth) is smaller than the threshold value TH (S264).
- the simulation process (S266) is executed for all conditions. This predicts the occurrence of internal bubbles. This ends the prediction process (S20).
- the calculation processing unit 9 estimates the generation of internal bubbles in the target workpiece model WM based on the demolding reaction rate calculated in S262 (S265, internal bubble estimation process).
- the content of S265 is the same as S4 in Fig. 4, so a duplicated explanation will be omitted.
- a minimum of two and a maximum of four tenth trained models are used, thereby shortening the calculation time required to predict the occurrence of internal bubbles in the target workpiece model WM.
- Embodiment 3-3 Next, embodiment 3-3 will be described with reference to Fig. 63.
- the occurrence of internal bubbles in a target workpiece model WM is predicted using a simulation result related to an equivalent reaction amount of a crosslinking reaction and machine learning.
- machine learning a number of trained models equal to the number of elements in the target workpiece model WM are generated, and a maximum number of equivalent reaction amounts equal to the number of elements is used.
- the calculation processing unit 9 When the prediction process (S20) according to this embodiment starts, the calculation processing unit 9 generates training data (S270).
- the process of S270 in this embodiment is the same as S2200 in FIG. 51, so a duplicated explanation will be omitted.
- the calculation processing unit 9 generates an eleventh trained model (S271).
- the eleventh trained model is an example of a trained model.
- the calculation processing unit 9 generates an eleventh trained model for each element corresponding to the multiple analysis meshes of the target work model WM. That is, the same number of eleventh trained models as the number of analysis meshes of the target work model WM are generated.
- the eleventh trained model predicts the equivalent reaction amount of the polymer part 12 at the time of demolding from the set conditions of the crosslinking reaction of the polymer part 12.
- the calculation processing unit 9 executes an equivalent reaction amount prediction process (S272).
- the prediction processing unit predicts the equivalent reaction amount at demolding for each element corresponding to the multiple analysis meshes of the target workpiece model WM based on the set conditions and the eleventh trained model.
- the calculation processing unit 9 calculates the determination coefficient R 2 (eleventh) based on the equivalent reaction amount at the time of demolding calculated in S272 and the analytical value (S273).
- the calculation processing unit 9 judges whether the coefficient of determination R 2 (eleventh) is smaller than the threshold value TH (S274).
- the simulation process (S276) is executed for all conditions. This calculates the target workpiece model elastic modulus Ks. This ends the prediction process (S20).
- the calculation processing unit 9 estimates the generation of internal bubbles in the target workpiece model WM based on the equivalent reaction amount at demolding calculated in S272 (S275, internal bubble estimation process).
- S275 internal bubble estimation process
- the content of S275 is the same as S4 in Fig. 4, so a duplicated explanation will be omitted.
- the generation of internal bubbles in a target workpiece model WM is predicted using a simulation result related to the equivalent reaction amount of a crosslinking reaction and machine learning.
- machine learning a trained model that predicts multiple statistics for the equivalent reaction amount of a crosslinking reaction at demolding is generated, and the same number of equivalent reaction amounts of the crosslinking reaction as the statistics are used.
- the minimum value of the reaction amount at demolding may be used as the multiple statistics.
- FIG. 64 shows a flowchart of the prediction process of this embodiment.
- the calculation processing unit 9 creates training data (S280).
- S280 The process of S280 in this embodiment is the same as S2200 in FIG. 51, so a duplicated explanation will be omitted.
- the calculation processing unit 9 generates a 12th trained model (S281).
- the 12th trained model is an example of a trained model.
- the calculation processing unit 9 predicts at least one of the average value, maximum value, minimum value, and standard deviation for the equivalent reaction amount of each element corresponding to the multiple analysis meshes of the target work model WM.
- the number of 12th trained models is the total of those that predict at least one of the average value, maximum value, minimum value, and standard deviation of the equivalent reaction amount. Therefore, the number of 12th trained models is one at the smallest.
- the statistical amount is not limited to the above, and any statistical amount may be predicted.
- the calculation processing unit 9 executes an equivalent reaction amount prediction process (S282).
- the prediction processing unit predicts the equivalent reaction amount at demolding for each element corresponding to the multiple analysis meshes of the target workpiece model WM based on the set conditions and the 12th trained model.
- the calculation processing unit 9 calculates the determination coefficient R 2 (twelfth) based on the equivalent reaction amount at the time of demolding calculated in S282 and the analytical value (S283).
- the calculation processing unit 9 judges whether the coefficient of determination R 2 (twelfth) is smaller than a threshold value TH (S284).
- the simulation process (S286) is executed for all conditions. This calculates the target workpiece model elastic modulus Ks. This ends the prediction process (S20).
- the calculation processing unit 9 estimates the generation of internal bubbles in the target workpiece model WM based on the equivalent reaction amount at demolding calculated in S282 (S285, internal bubble estimation process).
- the content of S285 is the same as S4 in Fig. 4, so a duplicated explanation will be omitted. With the above, the prediction process (S20) is completed.
- a minimum of two and a maximum of four fourth trained models are used, thereby reducing the time required to calculate the occurrence of internal bubbles in the target workpiece model WM.
- the internal bubble estimation unit 6 is configured to include a torque calculation unit 61, but is not limited to this. It may also be configured to include a reaction rate acquisition unit 60 that acquires the reaction rate (vulcanization degree) of the crosslinking reaction of the polymer part 12 of the target work model WM, and an estimation unit 62 that estimates the generation of bubbles in the polymer part 12 of the target work model WM based on the reaction rate at the time of demolding.
- the vulcanization degree at the threshold torque is obtained from the reference reaction curve RC, and this vulcanization degree can be used as the blow point vulcanization degree.
- blow point vulcanization degree may be directly measured using a known measuring device such as a blow point analyzer or blow point tester. After that, the reaction analysis of the vulcanization reaction is performed, and the calculation result (vulcanization degree) of the reaction rate acquisition unit 60 is compared with the above blow point vulcanization degree to estimate the generation of internal bubbles. For example, if the degree of vulcanization does not exceed the blow point degree of vulcanization, it is estimated that an internal bubble 80 has occurred in the polymer part 12 of the target workpiece model WM.
- the cross-linking reaction simulation device can take the following forms [1] to [36].
- a storage unit that stores data to be used in a simulation; a heat transfer analysis unit that performs a heat transfer analysis during a cross-linking reaction in a polymer part of a target workpiece model; a crosslinking reaction analysis unit that analyzes a reaction rate of a crosslinking reaction of the polymer portion using a result of the heat transfer analysis;
- a crosslinking reaction simulation device comprising: The storage unit is The target work model has the polymer portion including a raw material polymer; an equivalent reaction amount calculation model defined as a ratio of the reaction amount of the crosslinking reaction at a target reaction temperature and a target reaction time to the reaction amount of the crosslinking reaction at a standard reaction temperature and a standard reaction time, including a slope coefficient representing the slope of an Arrhenius plot; the slope coefficient set according to the progress of the crosslinking reaction of the polymer portion;
- the crosslinking reaction analysis unit a temperature acquisition unit that acquires a temperature at each time point for each element of the polymer part of the target workpiece model in a cross
- the polymer portion is a rubber portion configured to exhibit vibration-proofing performance
- the crosslinking reaction simulation device according to [1] wherein the target workpiece model is a model of a vibration-proof rubber device.
- the slope coefficient is The reaction return period is set to a smaller value than the reaction progress period,
- the reaction progress period is divided into an initial reaction progress period in which the crosslinking reaction starts to progress, a reaction acceleration period in which the reaction progress rate becomes faster than the initial reaction progress period, and a reaction late progress period in which the reaction progress rate becomes slower than the reaction acceleration period,
- [8] determining the slope coefficient to be used at the target time based on the reaction rate at the previous time; Calculating an equivalent reaction amount increase amount in a short time period of the target time based on the temperature at the target time, the equivalent reaction amount calculation model, and the slope coefficient; Calculating an equivalent reaction amount integrated value from the start of the crosslinking reaction to a target time based on the equivalent reaction amount increase amount;
- the crosslinking reaction simulation device according to [1] or [2], which calculates a reaction rate at a target time based on the integrated value of the equivalent reaction amount from the start of the crosslinking reaction to the target time.
- a second function that defines a correspondence relationship between the equivalent reaction amount integrated value and the reaction amount at a target time is stored;
- the reaction rate of the crosslinking reaction is In the reaction progress phase until the reaction rate of the crosslinking reaction reaches a peak, the start of the crosslinking reaction is defined as 0%, and the increase in the reaction rate of the crosslinking reaction is defined as a range from 0% to 100%,
- the crosslinking reaction simulation device according to [1] or [2] further includes a display unit that displays a value obtained from the reaction rate according to the target reaction time based on the analysis results of the crosslinking reaction analysis unit.
- a structure analysis unit that performs a structure analysis using the reaction rate of the crosslinking reaction of the polymer portion analyzed by the crosslinking reaction analysis unit
- the structural analysis unit is a reaction rate acquisition unit that acquires the reaction rate of each element of the polymer portion calculated by the reaction rate calculation processing unit of the crosslinking reaction analysis unit; an elastic modulus assignment unit that assigns an elastic modulus according to the obtained reaction rate in the polymer portion;
- the crosslinking reaction simulation device according to [1] or [2], further comprising: a characteristic acquisition unit that acquires the characteristics of the target work model by performing structural analysis with the elastic modulus assigned to the polymer portion.
- the crosslinking reaction simulation device described in [19] further includes a display unit that displays the characteristics according to the temperature of the mold model used in the crosslinking reaction of the polymer portion and the in-mold reaction time from the start of the crosslinking reaction to the demolding of the mold model based on the results of the structural analysis.
- the storage unit further comprises: A molded model;
- the target work model further includes the polymer portion containing carbon black; a thermal diffusivity characteristic representing a relationship between a mass ratio of the carbon black to the raw polymer and a thermal diffusivity of the polymer portion;
- the heat transfer analysis unit is a condition input unit for inputting a mass ratio of the carbon black to the raw material polymer in the target workpiece model and a temperature condition of the mold model; a polymer thermal diffusivity determination unit that determines a polymer thermal diffusivity, which is the thermal diffusivity of the polymer portion of the target workpiece model, based on the mass ratio input by the condition input unit and the thermal diffusivity characteristics stored in the storage unit; and an analysis unit that performs heat transfer analysis using the polymer thermal diffusivity determined by the polymer thermal diffusivity determination unit and the temperature conditions stored in the memory unit, with the target work model placed on the mold model.
- the target workpiece model is The polymer portion; a joining member joined to the polymer portion,
- the storage unit further includes: storing a contact heat transfer coefficient, which is a heat transfer coefficient between the mold model and the joining member, in a state in which the target workpiece model is disposed on the mold model;
- the crosslinking reaction simulation device described in [22] wherein the analysis unit performs the heat transfer analysis using the polymer thermal diffusivity determined by the polymer thermal diffusivity determination unit, the temperature conditions stored in the memory unit, and the contact heat transfer coefficient with the target work model placed on the mold model.
- the condition input unit The outside air conditions including the ambient temperature of the target workpiece model released from the mold model are input,
- the storage unit further includes: The air heat transfer coefficient is stored as the heat transfer coefficient of air;
- the storage unit further stores a mold model
- the present invention is applied to a crosslinking reaction process in which the polymer part of the target workpiece model is crosslinked in the mold model and then the mold model is demolded, and includes an internal bubble estimation unit that estimates the generation of bubbles inside the polymer part of the target workpiece model due to the demolding of the mold model
- the internal bubble estimation unit includes: A reaction rate acquisition unit that acquires a reaction rate of a cross-linking reaction of the polymer portion of the target workpiece model; An estimation unit that estimates the generation of bubbles inside the polymer portion of the target work model based on the reaction rate at the time of demolding;
- the crosslinking reaction simulation device according to [1] or [2],
- the storage unit further comprises: A crosslinking reaction curve is stored, which defines the relationship between the elapsed time from the start of the crosslinking reaction and a torque that corresponds to the progress of the crosslinking reaction in the polymer part of the target workpiece model and can be measured by a crosslinking reaction characteristic tester using a test target polymer material that corresponds to the polymer part;
- the internal bubble estimation unit further includes: a torque calculation unit that calculates the torque corresponding to the acquired reaction rate based on the reaction rate acquired by the reaction rate acquisition unit and the crosslinking reaction curve stored in the storage unit,
- the estimation unit is The crosslinking reaction simulation device described in [28] estimates the generation of bubbles inside the polymer part of the target work model based on the torque at the time of demolding.
- the reaction rate acquisition unit acquires the reaction rate for each site of the polymer portion
- the torque calculation unit calculates the torque for each portion of the polymer portion
- the crosslinking reaction simulation device according to [29], wherein the estimation unit estimates the generation of bubbles for each portion of the polymer part.
- the crosslinking reaction simulation device described in [29] further includes a display unit that displays the presence or absence of bubbles based on the estimation results by the internal bubble estimation unit, in accordance with the temperature of the mold model and the in-mold reaction time from the start of the crosslinking reaction to the demolding of the mold model.
- a structural analysis unit acquires characteristics of the target work model by performing a structural analysis using the reaction rate analyzed by the crosslinking reaction analysis unit,
- the display unit displays the characteristics corresponding to the temperature of the mold model and the in-mold reaction time from the start of the crosslinking reaction to the demolding of the mold model based on the results of the structural analysis, together with the presence or absence of air bubbles.
Landscapes
- Chemical & Material Sciences (AREA)
- Health & Medical Sciences (AREA)
- Chemical Kinetics & Catalysis (AREA)
- Engineering & Computer Science (AREA)
- Medicinal Chemistry (AREA)
- Organic Chemistry (AREA)
- Polymers & Plastics (AREA)
- Computing Systems (AREA)
- Life Sciences & Earth Sciences (AREA)
- Theoretical Computer Science (AREA)
- Analytical Chemistry (AREA)
- Bioinformatics & Computational Biology (AREA)
- Bioinformatics & Cheminformatics (AREA)
- Crystallography & Structural Chemistry (AREA)
- Physics & Mathematics (AREA)
- Oral & Maxillofacial Surgery (AREA)
- Thermal Sciences (AREA)
- Manufacturing & Machinery (AREA)
- Mechanical Engineering (AREA)
- Moulds For Moulding Plastics Or The Like (AREA)
Abstract
記憶部(2)と、対象ワークモデル(WM)のポリマー部(12)の架橋反応に係る設定条件の解析を行う設定条件解析部(8)と、を備える架橋反応シミュレーション装置(1)であって、記憶部(2)は、ポリマー特性値(PM)と、対象ワークモデル弾性率(Ks)と、ポリマー部(12)の架橋反応における設定条件と、ポリマー部(12)の架橋反応における反応時間と、が関係づけられた関係性データ(CD)と、を記憶し、設定条件解析部(8)は、ポリマー特性値取得部(181)と、対象ワークモデル弾性率取得部(182)と、関係性データ取得部(183)と、ポリマー特性値(PV)に基づいて、関係性データ(CD)の、対象ワークモデル弾性率(Ks)、設定条件、および反応時間の関係を補正する補正部(184)と、を備える。
Description
本開示は、架橋反応シミュレーション装置、および内部気泡推定装置に関する。
従来より、ポリマーを架橋反応させることにより化学物質の物性を向上させることが行われている。このようなポリマーとしてゴムが例示される。ゴムは、原料ゴムに硫黄やその他の架橋剤,加硫促進剤等を加え、加熱を行なうことによって、ゴム分子鎖間あるいはその分子鎖の中に三次元網目状の架橋構造が形成されている。
ゴムの加硫度、すなわち、ゴムの架橋反応の反応率を推定する技術として、非特許文献1に記載のものがある。上記の技術は、アレニウスの式に基づいて、ゴムの温度履歴から加硫度を推定し、適切な加硫条件(金型温度、加硫時間)を推定する。
有松利雄、"加硫工程設計の実際"、日本ゴム協会誌、第59巻,第3号,(1986)
上記の技術を、ゴムだけでなく、樹脂やエラストマー等の架橋反応に適用することが望まれる。架橋反応の反応率は原料ポリマーの特性によって変化する。このため、適切な設定条件を推定するためには、原料ポリマーの特性によって変化するパラメータを用いて設定条件を推定することが考えられる。しかしながら、上記の技術は、原料ポリマーの特性によって変化するパラメータを含まないため、架橋反応の反応率を精度よく推定することができなかった。このため、架橋反応の設定条件を適切に推定することが困難であるという課題があった。
本開示は、かかる背景に鑑みてなされたものであり、架橋反応の設定条件を適切に推定可能な架橋反応シミュレーション装置、および内部気泡推定装置を提供しようとするものである。
本開示の一態様は、
シミュレーションに用いるデータを記憶する記憶部と、
対象ワークモデルのポリマー部の架橋反応に係る設定条件の解析を行う設定条件解析部と、
を備える架橋反応シミュレーション装置であって、
前記記憶部は、
前記対象ワークモデルの前記ポリマー部を構成する原料ポリマーに関する特性値であるポリマー特性値と、
前記対象ワークモデルの前記ポリマー部の弾性率である対象ワークモデル弾性率と、前記対象ワークモデル弾性率を有する前記対象ワークモデルの前記ポリマー部の架橋反応における設定温度と、前記対象ワークモデル弾性率を有する前記対象ワークモデルの前記ポリマー部の架橋反応における反応時間と、が関係づけられた関係性データと、を記憶し、
前記設定条件解析部は、
前記ポリマー特性値を取得するポリマー特性値取得部と、
前記対象ワークモデル弾性率を取得する対象ワークモデル弾性率取得部と、
前記関係性データを取得する関係性データ取得部と、
前記ポリマー特性値に基づいて、前記関係性データの、前記対象ワークモデル弾性率、前記設定温度、および前記反応時間の関係を補正する補正部と、を備える、架橋反応シミュレーション装置にある。
シミュレーションに用いるデータを記憶する記憶部と、
対象ワークモデルのポリマー部の架橋反応に係る設定条件の解析を行う設定条件解析部と、
を備える架橋反応シミュレーション装置であって、
前記記憶部は、
前記対象ワークモデルの前記ポリマー部を構成する原料ポリマーに関する特性値であるポリマー特性値と、
前記対象ワークモデルの前記ポリマー部の弾性率である対象ワークモデル弾性率と、前記対象ワークモデル弾性率を有する前記対象ワークモデルの前記ポリマー部の架橋反応における設定温度と、前記対象ワークモデル弾性率を有する前記対象ワークモデルの前記ポリマー部の架橋反応における反応時間と、が関係づけられた関係性データと、を記憶し、
前記設定条件解析部は、
前記ポリマー特性値を取得するポリマー特性値取得部と、
前記対象ワークモデル弾性率を取得する対象ワークモデル弾性率取得部と、
前記関係性データを取得する関係性データ取得部と、
前記ポリマー特性値に基づいて、前記関係性データの、前記対象ワークモデル弾性率、前記設定温度、および前記反応時間の関係を補正する補正部と、を備える、架橋反応シミュレーション装置にある。
本開示の一態様によれば、架橋反応の対象となる原料ポリマーのポリマー特性値から、所望の対象ワークモデル弾性率を有する製品を得るための、ポリマー部の架橋反応の設定条件を算出することができる。
なお、請求の範囲に記載した括弧内の符号は、後述する実施形態に記載の具体的手段との対応関係を示すものであり、本開示の技術的範囲を限定するものではない。
(実施形態1-1)
1.架橋反応シミュレーション装置1の構成
1-1.架橋反応シミュレーション装置1の全体構成
実施形態1-1の架橋反応シミュレーション装置1(内部気泡推定装置の一例)の全体構成について、図1を参照して説明する。本形態の架橋反応シミュレーション装置1は、原料ポリマーの分子鎖同士を架橋させる架橋反応についてのシミュレーションを行い、架橋反応の設定条件を予測する。
1.架橋反応シミュレーション装置1の構成
1-1.架橋反応シミュレーション装置1の全体構成
実施形態1-1の架橋反応シミュレーション装置1(内部気泡推定装置の一例)の全体構成について、図1を参照して説明する。本形態の架橋反応シミュレーション装置1は、原料ポリマーの分子鎖同士を架橋させる架橋反応についてのシミュレーションを行い、架橋反応の設定条件を予測する。
原料ポリマーは、分子鎖同士が架橋反応可能であれば特に限定されず、フェノール樹脂、エポキシ樹脂、メラミン樹脂、尿素樹脂、不飽和ポリエステル樹脂、アルキド樹脂、シリコーン樹脂、ポリウレタン等の熱硬化性樹脂、架橋ポリエチレン、架橋ポリプロピレン等の熱可塑性樹脂、天然ゴム、スチレン・ブタジエンゴム、ブタジエンゴム、イソプレンゴム、エチレン・プロピレン・ジエンゴム、フッ素ゴム、アクリロニトリル・ブタジエンゴム、クロロプレンゴム、ブチルゴム、シリコーンゴム等の合成ゴム、エラストマー、などの任意のポリマーを適宜に選択できる。本形態においては、天然ゴムおよび合成ゴムを含むゴムがポリマーとして用いられる。なお、ゴムの場合、硫黄等の架橋剤が添加された状態で加熱されることにより、ゴムを構成する分子鎖が架橋し、いわゆる加硫反応が起こる。
図1aに示すように、架橋反応シミュレーション装置1は、記憶部2と、伝熱解析部3と、架橋反応解析部4と、構造解析部5と、内部気泡推定部6と、表示部7と、設定条件解析部8と、を備える。
1-2.記憶部2の構成
図1bに示すように、記憶部2は、シミュレーションに用いるデータを記憶する。データは、成形型モデルMMと、対象ワークモデルWMと、伝熱解析部3が用いる伝熱解析用データTDと、架橋反応解析部4が用いる架橋反応解析用データRDと、内部気泡推定部6が用いる内部気泡推定用データBDと、設定条件解析部8が用いる設定条件解析用データSDと、を含む。
図1bに示すように、記憶部2は、シミュレーションに用いるデータを記憶する。データは、成形型モデルMMと、対象ワークモデルWMと、伝熱解析部3が用いる伝熱解析用データTDと、架橋反応解析部4が用いる架橋反応解析用データRDと、内部気泡推定部6が用いる内部気泡推定用データBDと、設定条件解析部8が用いる設定条件解析用データSDと、を含む。
成形型モデルMMについて図2を参照して説明する。図2に示すように、成形型モデルMMは、金型10と、金型10に取付けられる熱板11と、を含んで構成される。金型10は、下側に位置する下型10Aと、下型10Aに上方から組付けられる上型10Bと、を備える。熱板11は、下型10Aの下面に取付けられる下熱板11Aと、上型10Bの上面に取付けられる上熱板11Bと、を含んで構成される。下型10Aには、上方に開口する下キャビティ100Aが形成されている。また、上型10Bには、下方に開口する上キャビティ100Bが形成されている。下型10Aと上型10Bとが組付けられた状態で、下キャビティ100Aと上キャビティ100Bとによって形成される空間内には、対象ワークモデルWMが配置される。
対象ワークモデルWMについて図3を参照して説明する。図3に示すように、対象ワークモデルWMは、ポリマー部12を備える。ポリマー部12は、原料ポリマーを含む。さらに、ポリマー部12は、酸化防止剤等の添加剤や、カーボンブラック等を含んでも良い。本形態のポリマー部12は、原料ポリマーおよびカーボンブラックを含んで構成される。原料ポリマーは特に限定されず、ゴム、熱硬化性樹脂等、任意の材料を適宜に選択できる。本形態では、原料ポリマーはゴムにより構成される。本形態のポリマー部12は、防振性能を発揮するように構成されたゴム部であり、対象ワークモデルWMは、防振ゴム装置のモデルである。ただし、ポリマー部12は、原料ポリマーとして熱硬化性樹脂を含む構成としてもよいし、また、カーボンブラックを含まない構成としても良い。
本形態のポリマー部12は、上下方向に延びる軸線Aに沿った筒状に形成されている。ポリマー部12の外周部には、上下方向に延びる円筒形状に形成された外側接合部材13(接合部材の一例)が配置されている。外側接合部材13は、金属製、樹脂製、または金属と樹脂との複合体として構成される。本形態の外側接合部材13は金属製であって、ポリマー部12の外周部と接合されている。ポリマー部12の内周部には、上下方向に延びる円筒形状に形成された内側接合部材14(接合部材の一例)が配置されている。内側接合部材14は、金属製、樹脂製、または金属と樹脂との複合体として構成される。本形態の内側接合部材14は金属製であって、ポリマー部12の内周部と接合されている。内側接合部材14の上下方向の長さ寸法は、外側接合部材13の上下方向の長さ寸法よりも大きく形成されている。ポリマー部12の上面、および下面は凹形状に形成されている。ただし、ポリマー部12の形状は上記の形状に限定されない。また、対象ワークモデルWMは、外側接合部材13および内側接合部材14の、双方または一方を備えない構成としても良い。
図2に戻って、成形型モデルMMに対象ワークモデルWMを配置した状態で、成形型モデルMMと外側接合部材13および内側接合部材14との間には、それぞれ、隙間15が形成されている。
図1に戻って、伝熱解析用データTDは、原料ポリマーに対するカーボンブラックの質量比とポリマー部12の熱拡散率との関係を示す熱拡散率特性TSと、成形型モデルMMに対象ワークモデルWMを配置した状態で、成形型モデルMMと外側接合部材13および内側接合部材14との間の熱伝達率である接触熱伝達率CHと、成形型モデルMMから対象ワークモデルWMを脱型した状態で、対象ワークモデルWMの周囲の空気の熱伝達係数である空気熱伝達係数ACと、後述する条件入力部30から入力される成形型モデルMMの温度条件TCと、脱型した対象ワークモデルWMの周囲の気温を含む外気条件OCと、を含む。
架橋反応解析用データRDは、基準反応温度での基準反応時間のときの架橋反応の反応量に対する、対象反応温度での対象反応時間のときの架橋反応の反応量の比を等価反応量として定義し、アレニウスプロットの傾きを表す傾き係数を含んで定義される等価反応量算出モデルEMと、ポリマー部12の架橋反応の進行度に応じて設定された傾き係数SCと、を含む。架橋反応解析用データRDは、さらに、後述する第一関係データマップDM1、第二関係データマップDM2、第一関数F1、第二関数F2および基準反応曲線RCを含む。
内部気泡推定用データBDは、架橋反応開始からの経過時間と、対象ワークモデルWMのポリマー部12における架橋反応の進行度に対応する値であってポリマー部12に相当する試験対象ポリマー材料を用いて架橋反応特性試験機により測定可能なトルクと、の関係を定義する架橋反応曲線CCを含む。
設定条件解析用データSDは、ポリマー特性値PVと、関係性データCDと、を含む。ポリマー特性値PVは、対象ワークモデルWMのポリマー部12を構成する原料ポリマーに関する特性値である。関係性データCDは、対象ワークモデルWMのポリマー部12の弾性率である対象ワークモデル弾性率Ksと、対象ワークモデル弾性率Ksを有する対象ワークモデルWMのポリマー部12の架橋反応における設定温度と、対象ワークモデル弾性率Ksを有する対象ワークモデルのポリマー部12の架橋反応における反応時間と、が関係づけられたデータである。ただし、対象ワークモデル弾性率Ksは、対象ワークモデルWMの軸方向(軸線A方向)の弾性率であっても良いし、また、対象ワークモデルWMの軸直交方向(軸線Aに直交する方向)の弾性率であっても良い。
1-3.伝熱解析部3の構成
伝熱解析部3は、対象ワークモデルWMのポリマー部12の架橋反応時における伝熱解析を行う。図1に示すように、伝熱解析部3は、条件入力部30と、ポリマー熱拡散率決定部31と、解析部32と、を備える。
伝熱解析部3は、対象ワークモデルWMのポリマー部12の架橋反応時における伝熱解析を行う。図1に示すように、伝熱解析部3は、条件入力部30と、ポリマー熱拡散率決定部31と、解析部32と、を備える。
条件入力部30は、対象ワークモデルWMにおける原料ポリマーに対するカーボンブラックの質量比、および、成形型モデルMMの温度条件TCを入力する。条件入力部30としては、キーボード、マウス、トラックボール、ジョイスティック等の入力装置でもよいし、半導体メモリ、ハードディスクメモリ等の外部記憶媒体でもよい。
ポリマー熱拡散率決定部31は、条件入力部30により入力されたカーボンブラックの質量比と、記憶部2に記憶された熱拡散率特性TSと、に基づいて、対象ワークモデルWMのポリマー部12の熱拡散率であるポリマー熱拡散率を決定する。
解析部32は、成形型モデルMMに対象ワークモデルWMを配置した状態で、ポリマー熱拡散率決定部31により決定されたポリマー熱拡散率および記憶部2に記憶された温度条件TCを用いて、対象ワークモデルWMのポリマー部12の架橋反応時における伝熱解析を行う。
1-4.架橋反応解析部4の構成
架橋反応解析部4は、伝熱解析部3による伝熱解析の結果を用いてポリマー部12の架橋反応の反応率の解析を行う。図1に示すように、架橋反応解析部4は、温度取得部40と、反応率算出処理部41と、を備える。
架橋反応解析部4は、伝熱解析部3による伝熱解析の結果を用いてポリマー部12の架橋反応の反応率の解析を行う。図1に示すように、架橋反応解析部4は、温度取得部40と、反応率算出処理部41と、を備える。
温度取得部40は、伝熱解析部3による伝熱解析の結果として、架橋反応における対象ワークモデルWMのポリマー部12の各要素について時刻毎の温度を取得する。
反応率算出処理部41は、取得した架橋反応におけるポリマー部12の各要素についての時刻毎の温度、等価反応量算出モデルEM、対象時刻における架橋反応の進行度に応じた傾き係数SCに基づいて、時刻毎のポリマー部12の等価反応量を算出し、算出した等価反応量に基づいてポリマー部12の架橋反応の反応率を算出する。
1-5.構造解析部5の構成
構造解析部5は、架橋反応解析部4により解析されたポリマー部12の架橋反応の反応率を用いて構造解析を行う。図1に示すように、構造解析部5は、温度取得部50と、反応率取得部51と、弾性率割当部52と、特性取得部53と、を備える。ただし、温度取得部50は省略しても良い。
構造解析部5は、架橋反応解析部4により解析されたポリマー部12の架橋反応の反応率を用いて構造解析を行う。図1に示すように、構造解析部5は、温度取得部50と、反応率取得部51と、弾性率割当部52と、特性取得部53と、を備える。ただし、温度取得部50は省略しても良い。
温度取得部50は、伝熱解析部3による伝熱解析の結果として、架橋反応における対象ワークモデルWMのポリマー部12の各要素について時刻毎の温度を取得する。
反応率取得部51は、架橋反応解析部4の反応率算出処理部41により算出されたポリマー部12の各要素における反応率を取得する。
弾性率割当部52は、ポリマー部12において、取得した反応率に応じた弾性率を割り当てる。
特性取得部53は、ポリマー部12に弾性率を割り当てた状態で構造解析を行うことにより、対象ワークモデルWMの特性を取得する。
1-6.内部気泡推定部6の構成
内部気泡推定部6は、対象ワークモデルWMのポリマー部12を成形型モデルMM内にて架橋反応させた後に成形型モデルMMを脱型する架橋反応工程に適用され、対象ワークモデルWMのポリマー部12の内部において成形型モデルMMの脱型に伴う内部気泡の発生を推定する。図1に示すように、内部気泡推定部6は、反応率取得部60と、トルク算出部61と、推定部62と、を備える。
内部気泡推定部6は、対象ワークモデルWMのポリマー部12を成形型モデルMM内にて架橋反応させた後に成形型モデルMMを脱型する架橋反応工程に適用され、対象ワークモデルWMのポリマー部12の内部において成形型モデルMMの脱型に伴う内部気泡の発生を推定する。図1に示すように、内部気泡推定部6は、反応率取得部60と、トルク算出部61と、推定部62と、を備える。
反応率取得部60は、対象ワークモデルWMのポリマー部12の架橋反応の反応率を取得する。上記の反応率は、金型10を型開きした時点、すなわち型締め圧力が解放される時点での反応率である。なお、ポリマー部12がゴムである場合、上記の反応率は脱型時加硫度とも呼ばれる。
トルク算出部61は、反応率取得部60により取得された反応率(脱型時反応率)と記憶部2に記憶された架橋反応曲線CCとに基づいて、取得された反応率に対応するトルク(脱型時トルクともいう)を算出する。
推定部62は、トルク算出部61が算出したトルク(脱型時トルク)と、ポリマー部12におけるブローポイント加硫度(後に詳述する)から算出したブローポイントトルク(後に詳述する)と、を比較して、ポリマー部12の内部に気泡が発生するか否かを推定する。
1-7.表示部7の構成
表示部7は、架橋反応解析部4の解析結果に基づいて、反応時間に応じた反応率から得られる値を表示する。また、表示部7は、構造解析部5の構造解析の結果に基づいて、ポリマー部12の架橋反応に用いられる成形型モデルMMの温度と、架橋反応開始から成形型モデルMMの脱型までの型内反応時間と、に応じた特性を表示する。
表示部7は、架橋反応解析部4の解析結果に基づいて、反応時間に応じた反応率から得られる値を表示する。また、表示部7は、構造解析部5の構造解析の結果に基づいて、ポリマー部12の架橋反応に用いられる成形型モデルMMの温度と、架橋反応開始から成形型モデルMMの脱型までの型内反応時間と、に応じた特性を表示する。
また、表示部7は、内部気泡推定部6の推定結果に基づいて、成形型モデルMMの温度と、架橋反応開始から成形型モデルMMの脱型までの型内反応時間と、に応じて、内部気泡の発生の有無を表示する。また、表示部7は、架橋反応解析部4の解析結果に基づいて、成形型モデルMMの温度と、架橋反応開始から成形型モデルMMの脱型までの型内反応時間と、に応じた反応率から得られる値を、内部気泡の発生の有無に合わせて表示する。また、表示部7は、構造解析部5の構造解析の結果に基づいて、成形型モデルMMの温度と、架橋反応開始から成形型モデルMMの脱型までの型内反応時間と、に応じた特性を、内部気泡の発生の有無に合わせて表示する。
1-8.設定条件解析部8の構成
設定条件解析部8は、対象ワークモデルWMのポリマー部12の架橋反応における設定条件の解析を行う。設定条件解析部8は、ポリマー特性値取得部181と、対象ワークモデル弾性率取得部182と、関係性データ取得部183と、補正部184と、を備える。
設定条件解析部8は、対象ワークモデルWMのポリマー部12の架橋反応における設定条件の解析を行う。設定条件解析部8は、ポリマー特性値取得部181と、対象ワークモデル弾性率取得部182と、関係性データ取得部183と、補正部184と、を備える。
ポリマー特性値取得部181は、ポリマー特性値PVを取得する。対象ワークモデル弾性率取得部182は、対象ワークモデル弾性率Ksを取得する。関係性データ取得部183は、関係性データCDを取得する。補正部184は、ポリマー特性値PVに基づいて、関係性データCDの、対象ワークモデル弾性率Ks、設定温度、および反応時間の関係を補正する。
2.架橋反応シミュレーション装置1の全体の動作
図4を参照しつつ、本形態に係る架橋反応シミュレーション装置1の全体の動作を説明する。ただし、以下の説明は架橋反応シミュレーション装置1の動作の一例であり、架橋反応シミュレーション装置1の動作は以下の記載に限定されない。
図4を参照しつつ、本形態に係る架橋反応シミュレーション装置1の全体の動作を説明する。ただし、以下の説明は架橋反応シミュレーション装置1の動作の一例であり、架橋反応シミュレーション装置1の動作は以下の記載に限定されない。
架橋反応シミュレーション装置1が起動されると、伝熱解析処理S1が実行される。伝熱解析処理S1により、架橋反応における対象ワークモデルWMのポリマー部12の各要素について時刻毎の温度が得られる。詳細については後述する。
次に、架橋反応解析処理S2が実行される。架橋反応解析処理S2においては、伝熱解析の結果として得られた、架橋反応における対象ワークモデルWMのポリマー部12の各要素についての時刻毎の温度、等価反応量算出モデルEM、対象時刻における架橋反応の進行度に応じた傾き係数SCに基づいて、時刻毎のポリマー部12の等価反応量を算出し、算出した等価反応量に基づいて、ポリマー部12の架橋反応の反応率が算出される。詳細については後述する。
次に、構造解析処理S3が実行される。構造解析処理S3においては、架橋反応解析部4により算出されたポリマー部12の各要素における反応率に応じて弾性率を割り当て、ポリマー部12に弾性率を割り当てた状態で構造解析を行うことにより、対象ワークモデルWMの特性を取得する。詳細については後述する。
次に、内部気泡推定処理S4が実行される。内部気泡推定処理S4においては、架橋反応解析処理により算出されたポリマー部12の反応率と記憶部2に記憶された架橋反応曲線CCとに基づいて、ポリマー部12の反応率に対応するトルクを算出し、脱型時におけるトルクに基づいて、対象ワークモデルWMのポリマー部12の内部における内部気泡の発生を推定する。詳細については後述する。
次に、設定条件解析処理S6が実行される。設定条件解析処理S6においては、ポリマー特性値PVに基づいて、関係性データCDの、対象ワークモデル弾性率Ks、設定温度、および反応時間の関係を補正する。これにより、架橋反応の対象となる原料ポリマーのポリマー特性値PVから、所望の対象ワークモデル弾性率Ksを有する製品を得るための、ポリマー部12の架橋反応の設定条件を算出する。詳細については後述する。
次に、表示処理S5が実行される。表示処理S5においては、内部気泡推定部6による推定結果に基づいて、成形型モデルMMの温度と、架橋反応開始から成形型モデルMMの脱型までの型内反応時間と、に応じて、内部気泡の発生の有無を表示する。また、架橋反応解析部4による解析結果に基づいて、成形型モデルMMの温度と、架橋反応開始から成形型モデルMMの脱型までの型内反応時間と、に応じた反応率から得られる値を、内部気泡の発生の有無に合わせて表示する。また、構造解析部5による構造解析の結果に基づいて、成形型モデルMMの温度と、架橋反応開始から成形型モデルMMの脱型までの型内反応時間と、に応じた特性を、内部気泡の発生の有無に合わせて表示する。また、設定条件解析部8による設定条件の解析結果に基づいて、所望の対象ワークモデル弾性率Ksを有する製品を得るための、ポリマー部12の架橋反応の設定条件を表示する。
表示処理S5が終了すると、架橋反応シミュレーション装置1の動作が終了する。
3.伝熱解析処理S1
3-1.カーボンブラックの質量比
次に、伝熱解析処理S1の詳細について、図2および図5~図8を参照して説明する。図2に示すように、下型10Aと上型10Bとが組合された状態で、下キャビティ100Aと上キャビティ100Bとによって形成される空間内に、外側接合部材13と内側接合部材14とが配置される。さらに、下キャビティ100Aと上キャビティ100Bとによって形成される空間内に原料ポリマーが射出される。その後、金型10内において、ポリマー部12を構成する分子鎖の架橋反応が進行する。
3-1.カーボンブラックの質量比
次に、伝熱解析処理S1の詳細について、図2および図5~図8を参照して説明する。図2に示すように、下型10Aと上型10Bとが組合された状態で、下キャビティ100Aと上キャビティ100Bとによって形成される空間内に、外側接合部材13と内側接合部材14とが配置される。さらに、下キャビティ100Aと上キャビティ100Bとによって形成される空間内に原料ポリマーが射出される。その後、金型10内において、ポリマー部12を構成する分子鎖の架橋反応が進行する。
図5に示すように、熱板11の温度は一定に設定されている。金型10の温度は、熱板11と同じ温度に設定されている。射出時におけるポリマー部12の温度は、金型10の設定温度よりも低い。このため、金型10の温度は原料ポリマーが射出された後、一時的に下がる。その後、金型10の温度は上昇し、熱板11の温度と同じになる。ポリマー部12の温度は、金型10に射出された後、上昇し、十分に時間が経過した場合には金型10の温度と同じになる。内側接合部材14および外側接合部材13の温度は、金型10に配置される前の状態においては、外気温と同じであってもよいし、また、予熱されていても良い。外気温と同じである場合には、例えば冬季には0℃程度まで下がる場合もある。また、予熱される場合には、任意の温度に昇温してもよく、例えば100℃付近まで昇温してもよい。内側接合部材14および外側接合部材13が金型10に配置された後、内側接合部材14および外側接合部材13の温度は金型10からの熱伝達により上昇し、原料ポリマーが射出された後は、さらに上昇し、十分に時間が経過した場合には金型10の温度と同じになる。
図5に示すように、ポリマー部12の温度が熱板11および金型10の温度に達して平衡状態になるまでにある程度の時間が必要となる。平衡状態に達するまでの非定常な過程を計算するために下記の式(1)が用いられる。式(1)は、いわゆる、非定常熱伝導方程式である。

t:時間変数
x:位置変数
T:温度
α:熱拡散率
上記の熱拡散率αは、下記の式(2)で表される。

λ:熱伝導率
ρ:密度
C:比熱
熱拡散率αおよび熱伝導率λが、熱拡散率特性TSに相当する。ただし、熱拡散率特性TSは、熱拡散率αおよび熱伝導率λに限定されない。
熱拡散率αが既知である場合には、熱拡散率αを直接用いて、非定常熱伝導方程式(1)によりポリマー部12の温度を計算することができる。熱拡散率αが既知でない場合には、式(2)から、熱伝導率λ、密度ρおよび比熱Cを用いて熱拡散率αを計算し、算出されたαを用いて、式(1)によりポリマー部12の温度を計算することができる。
しかしながら、式(1)を用いてポリマー部12の温度を計算する際に、一般的なJIS(Japanese Industrial Standards)等においてゴムの熱拡散率αとして記載されている値を用いたり、または式(2)を用いる場合においても、JIS等に熱伝導率λとして記載されている値を用いたりした場合には、図6に示すように、金型10内に配置した対象ワークモデルWMのポリマー部12の温度を実測したときの値と、式(1)に基づいてポリマー部12の温度を予測したときの値が、十分な精度で一致しないという問題が生じた。発明者らが鋭意検討した結果、JIS等に記載されたポリマー部12の原料ポリマーの熱拡散率αまたは熱伝導率λの値と、実際のポリマー部12の熱拡散率αまたは熱伝導率λの値とが、異なっていたことが原因であることが分かった。
そこで、測定対象となる対象ワークモデルWMのポリマー部12の温度を実測し、ポリマー部12の熱拡散率αまたは熱伝導率λを同定することにより、測定対象となる対象ワークモデルWMのポリマー部12の熱拡散率αまたは熱伝導率λを得た。
図7には、対象ワークモデルWMのポリマー部12の温度の実測値と、上記のようにして得られた熱拡散率αまたは熱伝導率λの実測値を用いて計算した温度と、を示す。すると、ポリマー部12の温度について、実測値と予測値とが高い精度で一致することが分かった。
しかしながら、対象ワークモデルWMを構成するポリマー部12の熱拡散率αまたは熱伝導率λは、ポリマー部12の原料ポリマーの種類や、原料ポリマーに添加される添加材料の配合量または種類等により、変化する。このため、異なる配合のすべてのポリマー部12について、熱拡散率αまたは熱伝導率λを実測することは煩雑である。
そこで、発明者らは、ポリマー部12に添加される添加材料のうち、カーボンブラックに着目した。ポリマー部12を構成するゴムは、熱が伝わりにくい材料である。一方、カーボンブラックは熱が伝わりやすい材料である。このため、ポリマー部12の熱拡散率αまたは熱伝導率λは、ポリマー部12を構成する原料ポリマーに対するカーボンブラックの質量比と、関連性が高いと考えられる。カーボンブラックとしては、ファーネスブラック、アセチレンブラック、ケッチェンブラック等が挙げられる。
図8に、複数種の原料ポリマーを用い、異なるカーボンブラックの質量比で実験した場合における、原料ポリマーに対するカーボンブラックの質量比と、ポリマー部12の熱伝導率λとの関係性を示す。図8においては、原料ポリマーに対するカーボンブラックの質量比は、質量部とした。ただし、原料ポリマーに対するカーボンブラックの質量比は、質量%としてもよい。
図8に示すように、ポリマー部12の熱伝導率λは、原料ポリマーに対するカーボンブラックの質量比に対して、線形の関係を有する。また、ポリマー部12の熱伝導率λは、原料ポリマーの種類に依存しない関係であることが分かった。これにより、原料ポリマーの種類によらず、カーボンブラックの配合量に基づいて、ポリマー部12の熱伝導率λを精度よく予測することが可能になった。また、式(2)を用いて熱伝導率λから熱拡散率αを算出することができるので、熱拡散率αについても精度よく予測することが可能となった。
3-2.接触熱伝達率CH
図2に示すように、金型10内に外側接合部材13が配置された状態で、金型10の内面と、外側接合部材13との間には、外側隙間15Aが形成される場合がある。この場合、熱は、金型10の内面から、外側隙間15A内の空気を介して、外側接合部材13に伝わる。伝熱解析処理S1においては、金型10の内面と外側接合部材13とが接触した状態を仮定し、金型10および外側接合部材13において外側隙間15Aを考慮する面を選択し、外側隙間15Aの大きさに応じて、接触熱伝達率CHを設定する。接触熱伝達率CHは、テストピースを用いた実験において、外側隙間15Aの大きさを変化させたときの温度挙動を測定し、それぞれの温度挙動を再現可能な値を解析で求めたものが採用される。
図2に示すように、金型10内に外側接合部材13が配置された状態で、金型10の内面と、外側接合部材13との間には、外側隙間15Aが形成される場合がある。この場合、熱は、金型10の内面から、外側隙間15A内の空気を介して、外側接合部材13に伝わる。伝熱解析処理S1においては、金型10の内面と外側接合部材13とが接触した状態を仮定し、金型10および外側接合部材13において外側隙間15Aを考慮する面を選択し、外側隙間15Aの大きさに応じて、接触熱伝達率CHを設定する。接触熱伝達率CHは、テストピースを用いた実験において、外側隙間15Aの大きさを変化させたときの温度挙動を測定し、それぞれの温度挙動を再現可能な値を解析で求めたものが採用される。
また、金型10内に内側接合部材14が配置された状態で、金型10の内面と内側接合部材14との間には、内側隙間15Bが形成される場合がある。この場合、熱は、金型10の内面から、内側隙間15B内の空気を介して、内側接合部材14に伝わる。伝熱解析処理S1においては、金型10の内面と内側接合部材14とが接触した状態を仮定し、金型10および内側接合部材14において内側隙間15Bを考慮する面を選択し、内側隙間15Bの大きさに応じて、接触熱伝達率CHを設定する。接触熱伝達率CHは、テストピースを用いた実験において、内側隙間15Bの大きさを変化させたときの温度挙動を測定し、それぞれの温度挙動を再現可能な値を解析で求めたものが採用される。
上記したように、記憶部2は、成形型モデルMMに対象ワークモデルWMを配置した状態で、成形型モデルMMと金具との隙間15A,15Bにおける接触熱伝達率CHを記憶している。
伝熱解析処理S1においては、解析部32は、成形型モデルMMに対象ワークモデルWMを配置した状態で、ポリマー熱拡散率決定部31により決定されたポリマー熱拡散率、記憶部2に記憶された温度条件TCおよび接触熱伝達率CHを用いて、伝熱解析を行う構成となっている。これにより、精度よく、ポリマー部12の温度を予測することができる。
3-3.空気熱伝達係数AC
成形型モデルMMから対象ワークモデルWMが脱型された後も、対象ワークモデルWMのポリマー部12の温度はすぐには下がらないので、ポリマー部12において架橋反応が進行する。そこで、本形態においては、成形型モデルMMから対象ワークモデルWMが脱型された後においても、ポリマー部12の温度を予測するために、条件入力部30は、成形型モデルMMから脱型された対象ワークモデルWMの周囲の気温を含む外気条件OCが入力されるようになっている。さらに記憶部2は、成形型モデルMMから脱型された対象ワークモデルWMの周囲の空気の熱伝達係数である空気熱伝達係数ACを記憶する。
成形型モデルMMから対象ワークモデルWMが脱型された後も、対象ワークモデルWMのポリマー部12の温度はすぐには下がらないので、ポリマー部12において架橋反応が進行する。そこで、本形態においては、成形型モデルMMから対象ワークモデルWMが脱型された後においても、ポリマー部12の温度を予測するために、条件入力部30は、成形型モデルMMから脱型された対象ワークモデルWMの周囲の気温を含む外気条件OCが入力されるようになっている。さらに記憶部2は、成形型モデルMMから脱型された対象ワークモデルWMの周囲の空気の熱伝達係数である空気熱伝達係数ACを記憶する。
本形態の解析部32は、対象ワークモデルWMのポリマー部12を成形型モデルMM内にて架橋反応させた後に成形型モデルMMから対象ワークモデルWMを脱型した状態で、ポリマー熱拡散率決定部31により決定されたポリマー熱拡散率、記憶部2に記憶された空気熱伝達係数ACおよび外気条件OCを用いて、伝熱解析を行う。これにより、成形型モデルMMから対象ワークモデルWMが脱型された後の状態において、ポリマー部12の温度を精度よく予測することができる。
図9に示すように、成形型モデルMMに対象ワークモデルWMを配置した状態について解析メッシュを作成する。解析メッシュのサイズは、予め定められていても良いし、条件入力部30から入力されても良い。解析メッシュの作成には、成形型モデルMMおよび対象ワークモデルWMの形状の特性(例えば対称性)を考慮する。メッシュタイプとしては、8節点ソリッド要素を採用した。ただし、メッシュタイプは任意のモデルを採用可能であり、例えば4節点ソリッド要素を用いても良い。
解析メッシュを用いることにより、対象ワークモデルWMの各節点における温度を予測することができる。つまり、対象ワークモデルWMのポリマー部12の温度分布を予測することができる。特に、各時刻における、ポリマー部12の各節点の温度を予測することができる。
なお、成形型モデルMMは上記に限られず、例えば、図33に示す成形型モデルMMaでも良い。成形型モデルMMaは、下型10Aと、上型10Bと、第1中型110Aと、第2中型110Bと、下入子16Aと、上入子16Bと、下軸部17Aと、上軸部17Bと、ヒータ18と、を備える。なお、図33においては、説明の便宜のため、隙間15は省略されている。
下型10Aと、下型10Aの上方に配置される上型10Bと、の間には、下型10A側に配置される第1中型110Aと、上型10B側に配置される第2中型110Bと、が配置される。第1中型110A、および第2中型110Bは、対象ワークモデルWMの径方向の外方に配置される。換言すると、第1中型110A、および第2中型110Bは、対象ワークモデルWMの外側接合部材13の外方に配置される。
下入子16A、および上入子16Bは、対象ワークモデルWMのうちポリマー部12と接触する。これにより、下入子16Aは、ポリマー部12の下縁部の形状を形成し、上入子16Bは、ポリマー部12の上縁部の形状を形成する。
下軸部17Aは、下型10Aを上下方向に貫通した状態で配置されている。下軸部17Aは、対象ワークモデルWMの内側接合部材14の内部に下方から挿入された状態に配置される。下軸部17Aの上面には、内側接合部材14に下方から当接する。
上軸部17Bは、上型10Bに取付けられて、対象ワークモデルWMの内側接合部材14の内部に上方から挿入された状態に配置される。上軸部17Bの下面には、内側接合部材14に上方から当接する。
内側接合部材14は、下軸部17Aの上面と、上軸部17Bの下面との間に挟持されることにより、位置決めされる。
下型10Aの内部には、ヒータ18が配置されている。ヒータ18は、電熱線でも良いし、加熱された流体(水または油)が流通される管でも良い。対象ワークモデルWMaにおいては、下入子16Aの設定温度を用いることにより、ポリマー部12の温度を精度よく予測することができる。
ただし、ヒータ18は、上型10Bに配置されていても良く、その場合には、上入子16Bの設定温度を用いても良い。
4.架橋反応解析処理S2
次に架橋反応解析処理S2について説明する。架橋反応解析処理S2については、まず反応率について説明する。次に従来技術について説明し、続いて従来技術の課題について説明する。その後、本形態の架橋反応解析処理について説明する。
次に架橋反応解析処理S2について説明する。架橋反応解析処理S2については、まず反応率について説明する。次に従来技術について説明し、続いて従来技術の課題について説明する。その後、本形態の架橋反応解析処理について説明する。
4-1.反応率について
架橋反応の反応率は、以下のようにして測定される。図10に示すように、本形態に係るゴムの反応率については、JIS K6300-2に準拠し、加硫試験機70(架橋反応試験機の一例)を使用して、得られたトルクと反応時間との関係性から、反応率(加硫度)を算出する。加硫試験機70としては、例えばキュラストメーター(登録商標)を用いることができる。ただし、上記したJIS K6300-2は反応率の算出方法の一例であり、反応率の算出方法は上記に限られない。また、ポリマー部12を構成する原料ポリマーについても、JIS K6300-2に係るポリマーに限定されず、任意のポリマーを適宜に選択しうる。JIS K6300-2は、ISO 6502:1999を元に作成されているが、対応国際規格にない規定項目が一部追加されている。さらに、対応国際規格の一部が変更および削除されている。
架橋反応の反応率は、以下のようにして測定される。図10に示すように、本形態に係るゴムの反応率については、JIS K6300-2に準拠し、加硫試験機70(架橋反応試験機の一例)を使用して、得られたトルクと反応時間との関係性から、反応率(加硫度)を算出する。加硫試験機70としては、例えばキュラストメーター(登録商標)を用いることができる。ただし、上記したJIS K6300-2は反応率の算出方法の一例であり、反応率の算出方法は上記に限られない。また、ポリマー部12を構成する原料ポリマーについても、JIS K6300-2に係るポリマーに限定されず、任意のポリマーを適宜に選択しうる。JIS K6300-2は、ISO 6502:1999を元に作成されているが、対応国際規格にない規定項目が一部追加されている。さらに、対応国際規格の一部が変更および削除されている。
また、反応率(加硫度)を考慮した振動特性を出力する場合には、例えばゴム加工性試験機(RPA)を用いて、所望の振動条件での反応挙動(加硫挙動)を測定することができる。RPAは、広範な範囲で振動数、振幅の設定が可能に構成されている。
図10に示すように、加硫試験機70は、キャビティ71を有する下ダイ72と上ダイ73の間に、ロータ74の先端に取付けられたディスク75が配置されている。下ダイ72と上ダイ73は所定の温度に設定することができる。ロータ74は、ねじり角が+3°~-3°、または+1°~-1°に選択可能になっている。キャビティ71とディスク75との間に測定試料76が配置され、一定温度下でディスク75から回転トルクを与えながら架橋反応させ、トルクの変化から架橋反応の進行を検出するようになっている。
図11に測定結果の一例を示す。図11(a)は、所定の反応温度における、反応時間に対するトルクの変化量のグラフ(架橋反応曲線CC)である。一方、反応率は、最小トルクを反応率0%とし、最大トルクを反応率100%と定義される。図11(b)に、所定の反応温度における、反応時間に対する反応率の変化を示すグラフ(基準反応曲線RC)を示す。本形態に係るゴムの場合、反応率は加硫度と呼称される。加硫度は、加硫ゴムの物性(弾性率、伸び、引張強さ、硬さなど)を指標としてみた場合の加硫の程度と定義される。なお、図11(a)において、反応時間0から最小トルクを示す反応時間までの領域は、ポリマー部12の架橋反応が未反応であり、可塑的な領域となっている。このため、図11(b)においては、当該領域においては、反応率は0%とする。
4-2.反応率の算出方法
次に、反応率の算出方法について説明する。上記した非特許文献1においては、アレニウスの式(3)を変形することにより得られた等価反応量に係る式(4)を用いて、架橋反応の等価反応量を推定している。なお、等価反応量に係る式(4)は、反応温度T、反応時間tにおける反応量が、ある基準温度T0、基準時間t0における反応量の何倍になっているかを表す。なお、式(4)は、ゴムの加硫反応においては、等価加硫の式と呼称される。この等価加硫の式を用いることにより、後述する反応戻り期における反応率を予測することができる。後に詳述するが、本形態においては、反応戻り期における予測精度を、単に等価加硫の式を用いた場合に比べて、さらに向上させることが可能となる。なお、一般的な解析ソフトにおいて、ゴムやエポキシ等の熱硬化反応の挙動を予測する際に用いられる式(例えば、Kamalの反応速度式)によっては、反応戻り期における反応率を予測することはできない。
次に、反応率の算出方法について説明する。上記した非特許文献1においては、アレニウスの式(3)を変形することにより得られた等価反応量に係る式(4)を用いて、架橋反応の等価反応量を推定している。なお、等価反応量に係る式(4)は、反応温度T、反応時間tにおける反応量が、ある基準温度T0、基準時間t0における反応量の何倍になっているかを表す。なお、式(4)は、ゴムの加硫反応においては、等価加硫の式と呼称される。この等価加硫の式を用いることにより、後述する反応戻り期における反応率を予測することができる。後に詳述するが、本形態においては、反応戻り期における予測精度を、単に等価加硫の式を用いた場合に比べて、さらに向上させることが可能となる。なお、一般的な解析ソフトにおいて、ゴムやエポキシ等の熱硬化反応の挙動を予測する際に用いられる式(例えば、Kamalの反応速度式)によっては、反応戻り期における反応率を予測することはできない。

k:反応速度
A:頻度因子
E:活性化エネルギー
R:ガス定数
T:反応温度

U:等価反応量
E:活性化エネルギー
R:ガス定数
T:反応温度
T0:基準温度
t:反応時間
アレニウスの式(3)から、以下のように式変形して、等価反応量の式(4)が導出される。
反応時間tにおける架橋反応の反応量Zは、式(5)で表される。

Z:反応量
t:反応時間
反応量Zは、アレニウスの式(3)と、上記の式(5)から、下記の式(6)のようになる。

ここで、ある基準になる反応温度T0で、反応時間t0のときの反応量Z0を考えると、Z0は、下記の式(7)で表される。

反応温度T0および反応時間t0における反応量Z0に対する、反応温度Tおよび反応時間tにおける反応量Zの比Uをとると、比Uは下記の式(8)で表される。

式(8)に、式(6)および式(7)を代入すると比Uについて式(9)を得る。

式(9)において、t0=1のとき、式(9)は上記した式(4)のように表される。
反応温度Tが刻々と変わるときは、対象時刻における温度、上記の式(4)、傾き係数SCに基づいて、対象時刻の微小時間における等価反応量増加量を算出し、等価反応量増加量に基づいて、架橋反応開始から対象時刻までの等価反応量積算値を算出し、架橋反応開始から対象時刻までの前記等価反応量積算値に基づいて、対象時刻における反応率を算出する。
式(4)に基づいて、対象時刻の微小時間Δtにおける等価反応量増加量ΔUiは、下記の式(10)により表される。

ΔUi:対象時刻の微小時間における等価反応量増加量
Δt:対象時刻の微小時間
反応温度Tが刻々と変わるときには、下記の式(11)のように単位時間毎に累積することにより、等価反応量Uを求めることができる。

U:等価反応量
E:活性化エネルギー
R:ガス定数
T:反応温度
T0:基準温度
Δt:対象時刻の微小時間
上記した式(4)は、上記の式(11)のうち、Σの内部の式であって、累積される個々の等価反応量に対応する。
式(4)または式(11)を計算するためには、(-E/R)の値が必要となる。従来技術においては、(-E/R)を下記のようにして求めていた。
アレニウスの式(3)の両辺の自然対数をとることにより、下記の式(12)を得る。

k:反応速度
A:頻度因子
E:活性化エネルギー
R:ガス定数
T:反応温度
上記した反応量について、所定の反応率γにおける反応時間tγと、反応速度kとの間に下記の式(13)が成り立つと考える。反応率γは、例えば5%、90%等、0%~100%の任意の値を適宜に採用することができる。

B:任意の定数
tγ:所定の反応率γにおける反応時間
式(13)の両辺の自然対数をとり、式(12)に代入して式変形することにより、式(14)を得る。

式(14)から、ln(1/tγ)を縦軸に、(1/T)を横軸にして、反応率がα%に到達する時間と、各測定温度をプロットすると、直線に近似することが可能であり、この直線の傾きが(-E/R)になることがわかる(図12参照)。
実際の反応においては、図13に示すように、反応時間の経過とともに温度が変化する。このような場合、等価反応量の計算には式(4)および式(11)を用い、下記のように計算する。
まず、図13に示すように、反応時間を所定の間隔(例えば、1分)で区切る。次に、所定間隔ごとの温度を読取る。
次に、所定間隔当たりの等価反応量を、式(4)を用いて計算する。式(4)において、所定間隔Δtを代入して計算する。所定間隔として、例えば、Δt=1とすることにより、計算を簡略化できる。
次に、式(4)によって計算された所定間隔Δt当たりのΔUiを足し合わせる。具体的な計算方法について、図14を参照して説明する。
図14に示すように、反応時間ti-1、反応温度Ti-1における等価反応量Ui-1を式(4)で計算する。同様にして、反応時間ti、反応温度Tiにおける等価反応量Uiを算出する。
次に、Ui-1×Δtと、Ui×Δtとを足す。これにより、反応時間ti-1~tiにおける、等価反応量の積算値が得られる。なお、本形態ではΔt=1/2tである。同様にして、式(11)に従い、t=1~t=nまで所定時間当たりの等価反応量増加量ΔUiを積算することにより、等価反応量Uを得ることができる。
続いて、等価反応量Uから反応率を算出する方法について説明する。まず、反応温度T0、反応時間tにおける反応量Zは式(5)で表される。次に、式(5)から、反応温度T0で、反応時間t0のときの反応量Z0は、下記の式(15)で表される。ここで、式(5)と式(15)の反応温度は同一の値T0であるため、式(3)からそれぞれのkは同一の値となる。

上記した式(8)に、上記した式(5)および式(15)を代入すると、反応速度kが約分されて下記の式(16)を得る。

式(16)において、t0=1とすると、式(16)は下記の式(17)のように表される。

4-3.反応率算出方法の課題
しかしながら、上記した方法に基づいて反応率を推定した場合、実測値との差が大きく、十分な精度が得られないという問題があった。
しかしながら、上記した方法に基づいて反応率を推定した場合、実測値との差が大きく、十分な精度が得られないという問題があった。
図16に、反応時間に対する反応率の変化を示す。式(4)を用いるに際して、基準温度を160℃としたので、反応温度160℃の場合については、実測値と予測値とは精度よく一致している。
しかし、反応温度170℃および180℃については、実測値と予測値とが十分に一致していない。概ね、実測値よりも予測値の方が大きな値となっている。なお、反応率の極大値が一致しているのは、上記したように、反応率の極大値を100%と定義したためである。
図17を参照して、従来技術において、実測値と予測値とが十分に一致しない理由について説明する。図17には、反応時間に対する反応率の変化を表すグラフを示す。本形態に係る架橋反応は、以下の過程を経て進行する。
反応が開始した反応進行初期においては、徐々に反応率が増加する。ある程度、時間が経過して反応進行促進期に達すると、反応率が急激に増加する。その後、反応進行後期になると、反応率の増加量は緩やかになり反応率は極大値に達する。反応率が極大値に達した後は、戻り反応が進行する反応戻り期となる。この反応戻り期においては、反応率は漸減する。
上記した技術においては、反応進行初期から反応戻り期に至るまでを、いわば、1つの架橋反応として捉えていた。このため、1つの活性化エネルギーEを用いて、反応率の予測を行っていた。この結果、反応率の実測値と、予測値とが十分に一致しなかったと考えられる。
4-4.本形態の架橋反応解析処理
本形態においては、反応の進行状態に対応して複数の活性化エネルギーを算出し、得られた活性化エネルギーに基づいて等価反応量を予測する構成とした。この考え方に基づいて、式(4)を下記の式(18)のように変形した。
本形態においては、反応の進行状態に対応して複数の活性化エネルギーを算出し、得られた活性化エネルギーに基づいて等価反応量を予測する構成とした。この考え方に基づいて、式(4)を下記の式(18)のように変形した。

EN:N段階に分けられた、反応の進行段階ごとの活性化エネルギー
図17には、反応の進行状態を、反応進行初期、反応進行促進期、反応進行後期および反応戻り期の4段階に分ける例を示す。ただし、反応の進行状態は2つ~3つ、または5つ以上の任意の段階に分けてもよい。また、反応進行期および反応戻り期を含む全期間を等間隔に区分してもよい。等間隔に区分する指標として、架橋反応の全期間の進行度を基準として、例えば架橋反応の進行度を5%ごとに区分してもよい。ただし、区分の指標は5%に限られず、1%~4%または、6%以上でも良い。
本形態においては、反応率が0%~5%までを反応進行初期とし、反応率が5%~50%までを反応進行促進期とし、反応率が50%~100%までを反応進行後期とし、反応進行後期よりも後の段階において、反応率が100%から90%にまで減少した範囲を反応戻り期とした。
各反応段階において、上記した式(14)を用いて、活性化エネルギーENを含む項(EN/R)の値を求めた。図17に示すように、反応進行初期(反応率が0%~5%)における(E1/R)は約12000であり、反応進行促進期(反応率が5%~50%)における(E2/R)は約9000であり、反応進行後期(反応率が50%~100%)における(E3/R)は約13000であり、反応戻り期(反応率が100%~90%)における(E4/R)は約16000であった。ただし、(EN/R)の数値は上記の値に限定されない。なお、反応進行初期から反応戻り期までを1つの反応段階として捉えたときの(E/R)は11000であった。
図18に、上記のようにして得られた活性化エネルギーE1~E4を用いて反応率を予測した結果を、実測値と合わせて示す。基準温度である160℃において、実測値と予測値とが一致するだけでなく、反応温度170℃および180℃においても、実測値と予測値とが精度よく一致した。これにより、精度よく反応率を予測することができる。
本形態においては、傾き係数SCは、架橋反応の反応率がピークに到達するまでの反応進行期と、反応率がピークを越えた反応戻り期とで、異なる値に設定される。また、本形態においては、傾き係数SCは、反応進行期より反応戻り期の方が小さな値に設定される。
また、本形態においては、傾き係数SCは、反応進行初期、反応進行促進期、反応進行後期および反応戻り期のそれぞれで、異なる値に設定される。また、本形態においては、反応促進期における傾き係数SCが、反応進行初期および反応進行後期より大きな値に設定される。
また、傾き係数SCは、架橋反応の全期間が等間隔に区分された場合には、各区分に応じた値に設定される。ただし、傾き係数SCは、上記した非特許文献1に記載された手法により算出されるものを用いても良い。
4-5.架橋反応の反応率の表現方法
図19を参照して、本形態における架橋反応の反応率の表現方法について説明する。図19は、反応時間に対する、架橋反応の反応率の変化を示すグラフである。実線で示されたグラフは、反応率の実測値である。
図19を参照して、本形態における架橋反応の反応率の表現方法について説明する。図19は、反応時間に対する、架橋反応の反応率の変化を示すグラフである。実線で示されたグラフは、反応率の実測値である。
実線で示す架橋反応の反応率は、極大値に達した後は、戻り反応が進行することによって反応率は漸減する。このため、例えば、反応率が極大値に達する前に反応率が80%なる点と、反応率が極大値に達した後に反応率が80%になる点と、が存在することになる。この場合、単に反応率の数字だけで比較すると、反応率が極大値に達する前の80%の数値と、反応率が極大値に達した後の80%の数値を区別することができない。
そこで、本形態においては、架橋反応の反応率は、架橋反応の反応率がピークに到達するまでの反応進行期において、架橋反応の開始時を0%とし、架橋反応の反応率の増加度を0%~100%までの範囲で定義し、反応率がピークを越えた反応戻り期において、反応率のピークからの反応率の低下度を100%に加算した値として定義する。
図19のグラフで説明すると、反応率が100%の点から横軸に平行に延びる直線を対称軸として、反応率がピークを越えた反応戻り期のグラフを、矢線Bで示すように反転させる。これにより、反応率が極大値に達した後の反応率80%の点は、反応率120%と表現することができる。この結果、反応率が極大値に達する前における反応率と、反応率が極大値に達した後における反応率と、を明確に識別することができる(図20参照)。
4-6.シミュレーションにより算出される値の決定方法
次に、シミュレーションにより算出される値の決定方法について説明する。本形態においては、傾き係数SCおよび反応率は、データベースおよび関数の、一方または双方を用いて決定される。データベースを用いることにより、推定値の精度を向上させることができる。一方、関数を用いることにより、演算速度を向上させることができる。
次に、シミュレーションにより算出される値の決定方法について説明する。本形態においては、傾き係数SCおよび反応率は、データベースおよび関数の、一方または双方を用いて決定される。データベースを用いることにより、推定値の精度を向上させることができる。一方、関数を用いることにより、演算速度を向上させることができる。
(1)データベースを用いる方法
図1に示すように、記憶部2は、ポリマー部12の架橋反応の反応率と傾き係数SCとの対応関係を定義した第一関係データマップDM1を記憶する。反応率算出処理部41は、前回時刻の反応率および第一関係データマップDM1を用いて、傾き係数SCを決定する。
図1に示すように、記憶部2は、ポリマー部12の架橋反応の反応率と傾き係数SCとの対応関係を定義した第一関係データマップDM1を記憶する。反応率算出処理部41は、前回時刻の反応率および第一関係データマップDM1を用いて、傾き係数SCを決定する。
記憶部2は、等価反応量積算値と対象時刻における反応率との対応関係を定義した第二関係データマップDM2を記憶する。反応率算出処理部41は、対象時刻における等価反応量積算値および第二関係データマップDM2を用いて、対象時刻における反応率を決定する。
第二関係データマップDM2は、対象ワークモデルWMのポリマー部12に相当する試験対象ポリマー材料を用いて、加硫試験機70により測定された基準反応温度において架橋反応時間と試験対象ポリマー材料に発生したトルクとの関係に基づく基準反応曲線RCより設定されている。
(2)関数を用いる方法
図1に示すように、記憶部2は、ポリマー部12の架橋反応の反応率と傾き係数SCとの対応関係を定義した第一関数F1を記憶する。反応率算出処理部41は、前回時刻の反応率および第一関数F1を用いて、傾き係数SCを決定する。
図1に示すように、記憶部2は、ポリマー部12の架橋反応の反応率と傾き係数SCとの対応関係を定義した第一関数F1を記憶する。反応率算出処理部41は、前回時刻の反応率および第一関数F1を用いて、傾き係数SCを決定する。
第一関数F1は、ポリマー部12の架橋反応の進行度に応じて設定された複数の反応率区分に応じて、異なる関数に設定されている。架橋反応の進行度の区分数は任意であり、1つまたは2つ以上の複数に区分してもよい。関数については、線形補完を含むn次関数、スプライン曲線等、任意の関数を適宜に選択できる。本形態では、例えば、6次関数が好適に用いられる。なお、第一関数F1の区分数は、N段階に分けられた反応の進行段階ごとの活性化エネルギーENの値を求める際の区分とは独立して設定することができる。
記憶部2は、等価反応量積算値と対象時刻における反応率との対応関係を定義した第二関数F2を記憶する。反応率算出処理部41は、対象時刻における等価反応量積算値および第二関数F2を用いて、対象時刻における反応率を決定する。
第二関数F2は、対象ワークモデルWMのポリマー部12に相当する試験対象ポリマー材料を用いて、加硫試験機70により測定された基準反応温度において架橋反応時間と前記試験対象ポリマー材料に発生したトルクとの関係に基づく基準反応曲線RCより設定されている。
第二関数F2は、ポリマー部12の架橋反応の進行度に応じて設定された複数の反応率区分に応じて、異なる関数に設定されている。架橋反応の進行度の区分数は任意であり、1つまたは2つ以上の複数に区分してもよい。関数については、線形補完を含むn次関数、スプライン曲線等、任意の関数を適宜に選択できる。本形態では、例えば、6次関数が好適に用いられる。なお、第二関数F2の区分数は、N段階に分けられた反応の進行段階ごとの活性化エネルギーENの値を求める際の区分とは独立して設定することができる。
図21に、第二関数F2について、架橋反応の進行度を4つに区分した場合の関数を例示する。本形態では、反応進行初期、反応進行促進期、反応進行後期および反応戻り期に区分されている。各区分において、反応率と、反応時間とが、互いに異なる関数により近似されている。
次に、対象ワークモデルWMの解析メッシュを作成する。解析メッシュのサイズは、予め定められていても良いし、条件入力部30から入力されても良い。解析メッシュの作成には、対象ワークモデルWMの形状の特性(例えば対称性)を考慮して、図22に示すような解析メッシュを作成する。メッシュタイプとしては、8節点ソリッド要素を採用した。ただし、メッシュタイプは任意のモデルを採用可能であり、例えば4節点ソリッド要素を用いても良い。
解析メッシュを用いて、対象ワークモデルWMのポリマー部12のみの各時刻の各節点の温度から、各節点の反応率を算出することができる。
5.構造解析処理S3
5-1.初期処理
次に、構造解析処理S3について説明する。構造解析部5は、対象ワークモデルWMの解析メッシュを作成する。対象ワークモデルWMの解析メッシュは、架橋反応解析処理S2で作成した解析メッシュと同じでも良いし、異なっていても良い。本形態では構造解析処理S3で用いられる解析メッシュは、架橋反応解析処理S2で用いられた解析メッシュと同じものを使用した。
5-1.初期処理
次に、構造解析処理S3について説明する。構造解析部5は、対象ワークモデルWMの解析メッシュを作成する。対象ワークモデルWMの解析メッシュは、架橋反応解析処理S2で作成した解析メッシュと同じでも良いし、異なっていても良い。本形態では構造解析処理S3で用いられる解析メッシュは、架橋反応解析処理S2で用いられた解析メッシュと同じものを使用した。
5-2.温度および反応率取得
次に、構造解析部5は、伝熱解析部3によって解析された対象ワークモデルWMのポリマー部12の温度分布についての解析結果を取得する。また、構造解析部5は、架橋反応解析部4によって解析された対象ワークモデルWMのポリマー部12の反応率についての解析結果を取得する。
次に、構造解析部5は、伝熱解析部3によって解析された対象ワークモデルWMのポリマー部12の温度分布についての解析結果を取得する。また、構造解析部5は、架橋反応解析部4によって解析された対象ワークモデルWMのポリマー部12の反応率についての解析結果を取得する。
5-3.弾性率予測
次に、構造解析部5は、対象ワークモデルWMのポリマー部12の、各時刻における各節点の弾性率を算出する。まず、架橋反応の反応率が100%のテストピースを作成し、このテストピースの弾性率が実測される。次に、対象とする反応率におけるトルクを、反応率100%におけるトルクで除した商に基づいて、補正係数が算出される。上記のトルクは、加硫試験機70で測定可能なトルクである。構造解析部5は、実測された弾性率に、算出された補正係数を乗じることにより、各時刻における各節点の弾性率を算出する。
次に、構造解析部5は、対象ワークモデルWMのポリマー部12の、各時刻における各節点の弾性率を算出する。まず、架橋反応の反応率が100%のテストピースを作成し、このテストピースの弾性率が実測される。次に、対象とする反応率におけるトルクを、反応率100%におけるトルクで除した商に基づいて、補正係数が算出される。上記のトルクは、加硫試験機70で測定可能なトルクである。構造解析部5は、実測された弾性率に、算出された補正係数を乗じることにより、各時刻における各節点の弾性率を算出する。
5-4.特性予測
次に、構造解析部5は、対象ワークモデルWMの特性を予測する。有限要素解析に用いる入力条件は、各時刻の各節点の温度、各時刻の各節点の弾性率、並びに、外側接合部材13および内側接合部材14の境界条件である。
次に、構造解析部5は、対象ワークモデルWMの特性を予測する。有限要素解析に用いる入力条件は、各時刻の各節点の温度、各時刻の各節点の弾性率、並びに、外側接合部材13および内側接合部材14の境界条件である。
入力条件が設定された後、対象ワークモデルWMの軸線Aに対して直角な方向の力または歪を、対象ワークモデルWMに付与する。
構造解析部5は、対象ワークモデルWMの全体の弾性率を出力する。本形態では、対象ワークモデルWMの軸線Aに直角な方向に静的に加えられた力に対する弾性率が、特性として予測される。ただし、予測される特性は、軸線Aに直角な方向の力または歪に対する弾性率に限られず、軸線Aに直角な方向に振動する力に対する弾性率、軸線Aに沿う方向に静的に加えられた力または歪に対する弾性率、軸線Aに沿う方向に振動する力に対する弾性率等、任意の物性値を特性として予測することができる。
6.内部気泡推定処理S4
次に内部気泡推定処理S4について説明する。本形態の一例であるゴム製品は、成形加硫して作られる。このため、元々ゴムに溶解していた気体、または加硫反応によって発生した気体が、加硫の高温高圧条件下でゴム中に溶解した状態になっている。金型10を開放すると、ゴムへかかる圧力が低下し、ゴムへの気体の溶解度が低下するため、加硫が十分に進行していない状態では、ゴムにより構成されるポリマー部12の中に内部気泡80が発生する場合がある(図23参照)。
次に内部気泡推定処理S4について説明する。本形態の一例であるゴム製品は、成形加硫して作られる。このため、元々ゴムに溶解していた気体、または加硫反応によって発生した気体が、加硫の高温高圧条件下でゴム中に溶解した状態になっている。金型10を開放すると、ゴムへかかる圧力が低下し、ゴムへの気体の溶解度が低下するため、加硫が十分に進行していない状態では、ゴムにより構成されるポリマー部12の中に内部気泡80が発生する場合がある(図23参照)。
金型10内にゴムを配置した状態で加硫時間を長くし、加硫を進行させると内部気泡80が発生しなくなる。実際の製品の加硫においては、熱源である金型10からの距離が異なる製品内部の点において、温度上昇履歴の違いから、受ける総熱量が異なり、同じ加硫時間であっても、加硫進行状況が異なる。そのため、最遅加硫部分において、内部気泡80の発生が見られなくなる時間まで金型10内で加熱して加硫する必要がある。この最遅加硫部分において内部気泡80の発生が見られなくなるまでの加硫時間で成形した時の、金型10を開放した時点での、最遅加硫部分のゴムの加硫度をブローポイント加硫度(以下、ブローポイント)という(図24参照)。
内部気泡80を抑制するためには、金型10内での加硫時間はできるだけ長くした方が好ましい。しかし、金型10内での加硫時間を過剰に伸ばすと製品の製造効率が低下する。このため、製品の加硫時間を決めるためには、上記のブローポイントを推定することが重要となる。
図25(a)に、複数種のポリマーに対して、複数種のフィラーを、異なる配合量で添加した場合の、ブローポイント反応率を示す。ブローポイント反応率は、ブローポイントにおけるポリマー部12の架橋反応の反応率である。
原料ポリマーは、A~Hの8種類のポリマーを用いた。サンプルA1~A3は、原料ポリマーAを用いて、フィラーの配合量を変化させたものである。同様に、サンプルB1~B3は、原料ポリマーBに対して、フィラーの配合量を変化させたものであり、サンプルC1~C3は、原料ポリマーCに対して、フィラーの配合量を変化させたものである。サンプルは市販品を用いたため、フィラーの種類および配合量について正確には分からない。
図25(a)に示すように、ブローポイント反応率は、原料ポリマーの種類、フィラーの配合量によって大きく異なる。このため、ブローポイント反応率を用いて、ポリマー部12のブローポイントを予測することは困難であることが分かった。
図26に示すように、内部気泡80が膨張しようとする圧力P1と、ポリマー部が内部気泡80を抑え込もうとする圧力P2とが、P1<P2となったときに、内部気泡80がゴムによって抑え込まれて消失すると考えられる。そこで、ブローポイント反応率を、当該ブローポイント反応率に対応する、加硫試験機70により測定されたトルクに変換して、各サンプルで比較した。
図25(b)に、複数種のポリマーに対して、複数種のフィラーを、異なる配合量で添加した場合の、ブローポイントトルクを示す。ブローポイントトルクは、上記したように、ブローポイント反応率を、当該ブローポイント反応率に対応する、加硫試験機70により測定されたトルクに変換したものである。
図25(b)に示すように、原料ポリマーの種類や、フィラーの配合量によらず、内部気泡80の発生が見られなくなるトルク(ブローポイントトルク)は、ほぼ同等の値となった。つまり、容易に測定可能なトルクを用いることにより、ブローポイントを容易に予測可能となる。図25(b)の縦軸に、閾値を記載した。内部気泡推定部6の推定部62は、対象ワークモデルWMが脱型されるときにおけるトルクが閾値を超えていない場合に、対象ワークモデルWMのポリマー部12において内部気泡80が発生したと推定する。
閾値は、複数種の原料ポリマーに対して統一した値に設定されている。また、閾値は、ポリマー部12のブローポイントにおける架橋反応の反応率よりも大きな反応率に対応するトルクである。ただし、閾値は、複数のグループを設定し、グループごとに閾値を設定してもよい。複数のグループは任意の基準で区分することができる。
反応率取得部51は、ポリマー部12の部位ごとの反応率を取得し、トルク算出部61は、ポリマー部12の部位ごとのトルクを算出し、推定部62は、ポリマー部12の部位ごとの内部気泡80の発生を推定する。
7.設定条件解析処理S6
次に、設定条件解析処理S6について説明する。対象ワークモデルWMの弾性率Ksは、対象ワークモデルWMのポリマー部12の架橋反応における設定条件によって変化しうる。設定条件は、特に限定されず、例えば、架橋反応における金型10の設定温度、架橋反応の反応時間、原料ポリマーが金型10内に注入されるときの原料ポリマーの温度、入子の温度、外側接合部材13の温度、内側接合部材14の温度、下軸部の温度、上軸部の温度等の一次加硫条件、および二次加硫条件等とすることができる。二次加硫条件は、上記した一次加硫条件を含んでも良いし、他の加硫条件を含んでも良い。二次加硫条件は、追加的な架橋反応の条件の一例である。
次に、設定条件解析処理S6について説明する。対象ワークモデルWMの弾性率Ksは、対象ワークモデルWMのポリマー部12の架橋反応における設定条件によって変化しうる。設定条件は、特に限定されず、例えば、架橋反応における金型10の設定温度、架橋反応の反応時間、原料ポリマーが金型10内に注入されるときの原料ポリマーの温度、入子の温度、外側接合部材13の温度、内側接合部材14の温度、下軸部の温度、上軸部の温度等の一次加硫条件、および二次加硫条件等とすることができる。二次加硫条件は、上記した一次加硫条件を含んでも良いし、他の加硫条件を含んでも良い。二次加硫条件は、追加的な架橋反応の条件の一例である。
以下に、設定条件の一例として、金型10の設定温度を例示して説明する。図34(a)に示すように、対象ワークモデルWMの弾性率Ksは、対象ワークモデルWMのポリマー部12の架橋反応における設定温度と相関関係を有する。
一方、対象ワークモデルWMの弾性率Ksは、対象ワークモデルWMのポリマー部12に関する特性値であるポリマー特性値PVと相関関係を有する。ポリマー特性値PVは特に限定されず、原料ポリマーの弾性に関する特性値を含み、さらに、原料ポリマーのスコーチタイムおよびムーニー粘度の少なくとも1つを含む。
ポリマー特性値PVの一例として、RKsについて説明する。RKsは、原料ポリマーを所定の形状に成形、架橋した試験片を用いて、所定の治具を用いて、所定の変位速度で、試験片を圧縮する方向から試験片に荷重を印加し、所定の方法で算出した試験片の弾性率として定義される。
RKsの測定方法の一例について、以下に説明する。原料ポリマーを、直径30.0mm、厚さ30mmのキャビティを有する金型に収容し、150℃で20分間保持することにより架橋して、円柱状のサンプルを製造する。製造したサンプルを用いて、原料ポリマー架橋物の静的ばね定数を測定する。サンプルに対して、サンプルの厚さ方向に10Nの荷重を印加し、変位速度0.33mm/secで圧縮し、JIS K6385:2012に基づき、往路方式にてばね定数を算出する。
ポリマー特性値PVの他の例として、TSについて説明する。TSは、原料ポリマーを所定の形状に成形、架橋した試験片を用いて、厚さ方向について所定の第1荷重を印加し、その後、第1荷重よりも小さな第2荷重を印加し、第1荷重を印加したときと、第2荷重を印加したときの、変形量の差として定義される。
TSの測定方法の一例について、以下に説明する。原料ポリマーを、直径30.0mm、厚さ30mmのキャビティを有する金型に収容し、150℃で20分間保持することにより架橋して、円柱状のサンプルを製造する。製造したサンプルに対して、サンプルの厚さ方向に70kg重の荷重(第1荷重の一例)を印加する。その後、20kg重の荷重(第2荷重の一例)を印加し、70kg重の荷重を印加したときと、20kg重の荷重を印加した時の、サンプルの厚さ方向の変形量の差を測定する。
図34(b)には、ポリマー部12の特性値の一例であるRKsに対する、弾性率Ksの変化を示す。対象ワークモデルWMの弾性率Ksは、RKsと相関関係を有する。本形態では、対象ワークモデルWMの弾性率KSと、RKsとは、直線関係を有する。
さて、原料ポリマーのポリマー特性値PVは、原料ポリマーのロットごとに異なる。ポリマー特性値PVは原料ポリマーのロットごとに事前に測定可能であるため、架橋反応を行う前に知ることが可能である。そうすると、原料ポリマーのポリマー特性値PVに応じて、架橋反応の設定条件を変更することにより、架橋反応後の対象ワークモデルWMの弾性率Ksを所望の値に調節することが可能であると考えられる。
対象ワークモデルWMの弾性率Ksを調節するためには、異なるポリマー特性値PVを有する原料ポリマーごとに、架橋反応の設定温度と、対象ワークモデルWMの弾性率Ksと、の相関関係を明らかにすることが求められる。
図4に記載された伝熱解析処理S1、架橋反応解析処理S2、および構造解析処理S3を実行することにより、複数の設定条件(例えば、金型10の設定温度)における、対象ワークモデルWMの弾性率Ksと、架橋反応の反応時間と、の相関関係を予測することができる。この相関関係に基づいて、所定の反応時間において、対象ワークモデルWMの弾性率Ksと、架橋反応の設定条件との相関関係を算出することができる。
図35(a)に、上記のようにして算出した、対象ワークモデルWMの弾性率Ksと、金型10の設定温度との相関関係を示す。縦軸は、軸直交方向の弾性率の比の値となっており、弾性率Ksそのものの値ではない。図35(a)に示されるグラフは、原料ポリマーのポリマー特性値PVの一例であるRKsについての情報は含まれていない。
一方、図35(b)は、軸直交方向の弾性率の、金型の設定温度に対する変化を示す実測データである。実測された原料ポリマーのRKsは191[N/mm]である。
図35(c)に示すように、図35(a)に示されるグラフのピーク位置と、図35(b)に示されるグラフのピーク位置と、を一致させるように、図35(a)に示されるグラフを、グラフの縦軸方向および/または横軸方向にシフトする。換言すると、グラフを、軸直交方向の弾性率方向、および/または、設定温度方向にシフトする。これにより、図35(c)に示されるように、伝熱解析処理S1、架橋反応解析処理S2、および構造解析処理S3を実行することにより得られたシミュレーション結果を、実測データに合わせて校正することができる。
図34(b)に示すように、弾性率Ksと、RKsとは、直線関係を有するので、RKs=191[N/mm]に対応するグラフを縦軸方向(軸直交方向の弾性率方向)にシフトすることにより、異なるRKsを有する原料ポリマーについて、軸直交方向の弾性率と、設定温度と、の相関関係を得ることができる(図36参照)。
図36には、RKs=191[N/mm]の原料ポリマーに対応するグラフと、RKs=215[N/mm]の原料ポリマーに対応するグラフと、RKs=180[N/mm]の原料ポリマーに対応するグラフと、が示されている。RKs=215[N/mm]の原料ポリマーに対応するグラフは、RKs=191[N/mm]の原料ポリマーに対応するグラフを、縦軸方向(軸直交方向の弾性率方向)について上方にシフトさせることにより得ることができる。同様に、RKs=180[N/mm]の原料ポリマーに対応するグラフは、RKs=191[N/mm]の原料ポリマーに対応するグラフを、縦軸方向(軸直交方向の弾性率方向)について下方にシフトさせることにより得ることができる。このようにして、任意のRKsを有する原料ポリマーについて、軸直交方向の弾性率と、設定温度との、相関関係を得ることができる。
図37(a)には、上記のようにして算出された、軸直交方向の弾性率と、設定温度とのシミュレーション結果と、RKs=143[N/mm]の原料ポリマーの実測データと、を示す。実測データと、よく一致するシミュレーション結果を得ることができる。
同様に、図37(b)に示すように、RKs=178[N/mm]の原料ポリマーの実測データと、よく一致するシミュレーション結果を得ることができる。
8.表示処理S5
次に、表示処理S5について説明する。図1に示すように、表示部7は、架橋反応解析部4の解析結果に基づいて、反応時間に応じた反応率から得られる値を表示する。
次に、表示処理S5について説明する。図1に示すように、表示部7は、架橋反応解析部4の解析結果に基づいて、反応時間に応じた反応率から得られる値を表示する。
さらに、表示部7は、構造解析部5の解析結果に基づいて、ポリマー部12の架橋反応に用いられる成形型モデルMMの温度と、架橋反応開始から成形型モデルMMの脱型までの型内反応時間と、に応じた特性を表示する。
さらに、表示部7は、内部気泡推定部6の推定結果に基づいて、成形型モデルMMの温度と、架橋反応開始から成形型モデルMMの脱型までの型内反応時間と、に応じて、内部気泡80の発生の有無を表示する。
さらに、表示部7は、架橋反応解析部4の解析結果に基づいて、成形型モデルMMの温度と、架橋反応開始から成形型モデルMMの脱型までの型内反応時間と、に応じた反応率から得られる値を、内部気泡80の発生の有無に合わせて表示する。ただし、表示部7が表示する内容は上記に限定されない。
8-1.表による表示方法
(1)反応率を表示する形態
表1~表4を参照して、架橋反応の反応率を、表を用いて表示する形態について説明する。
(1)反応率を表示する形態
表1~表4を参照して、架橋反応の反応率を、表を用いて表示する形態について説明する。

表1は、対象ワークモデルWMのうち、架橋反応の反応率が最小である要素における架橋反応の反応率について、金型温度と、反応時間との関係についてまとめた表である。
表1に記載された反応時間は、金型10の内部に対象ワークモデルWMが配置された状態における反応時間を表す。また、表1に記載された反応率の数値は、金型10の内部に対象ワークモデルWMが配置された状態における反応時間と、対象ワークモデルWMが金型10から脱型された後の時間と、の双方の温度履歴に基づいて算出されたものである。対象ワークモデルWMが金型10から脱型された後も架橋反応が進行することから、上記のような考慮が必要となる。以下の説明において、表2~表4に記載された反応時間および反応率についても同様である。
表1のうち、右上部において太い罫線で囲まれた領域は、反応率が115%より大きい値となっている。この領域においては、架橋反応の戻り反応が過剰に進行しているので、好ましくない。ただし、反応率の範囲は任意に設定可能であり、115%と異なる値を閾値としても良い。
表1の左下部において太い罫線で囲まれた領域は、反応率が95%よりも小さな値となっている。この領域においては、架橋反応が十分に進行していないので、好ましくない。ただし、反応率の範囲は任意に設定可能であり、95%と異なる値を閾値としても良い。
表1のうち、太い罫線で囲まれた、右上部の領域および左下部の領域を除く領域は、架橋反応の反応率の観点からは好ましい領域である。なお、表1には、後述する内部気泡80に関する情報は記載されていない。
表2は、対象ワークモデルWMのすべての要素の架橋反応の平均値について、金型温度と、反応時間との関係についてまとめた表である。

表2のうち、右上部において太い罫線で囲まれた領域は、反応率が115%より大きい値となっている。この領域においては、架橋反応の戻り反応が過剰に進行しているので、好ましくない。ただし、反応率の範囲は任意に設定可能であり、115%と異なる値を閾値としても良い。
表2の左下部において太い罫線で囲まれた領域は、反応率が95%よりも小さな値となっている。この領域においては、架橋反応が十分に進行していないので、好ましくない。ただし、反応率の範囲は任意に設定可能であり、95%と異なる値を閾値としても良い。
表2のうち、右上部の領域と、左下部の領域と、を除く領域は、架橋反応の反応率の観点からは好ましい領域である。なお、表2には、後述する内部気泡80に関する情報は記載されていない。
表3は、対象ワークモデルWMのうち、架橋反応の反応率が最大である要素における架橋反応の反応率について、金型温度と、反応時間との関係についてまとめた表である。

表3のうち、右上部において太い罫線で囲まれた領域は、反応率が115%より大きい値となっている。この領域においては、架橋反応の戻り反応が過剰に進行しているので、好ましくない。ただし、反応率の範囲は任意に設定可能であり、115%と異なる値を閾値としても良い。
表3の左下部において太い罫線で囲まれた領域は、反応率が95%よりも小さな値となっている。この領域においては、架橋反応が十分に進行していないので、好ましくない。ただし、反応率の範囲は任意に設定可能であり、95%と異なる値を閾値としても良い。
表3のうち、右上部の領域と、左下部の領域と、を除く領域は、架橋反応の反応率の観点からは好ましい領域である。なお、表3には、後述する内部気泡80に関する情報は記載されていない。
表4は、表2に、内部気泡80に関する情報を追記したものである。

表4のうち、右上部において太い罫線で囲まれた領域は、反応率が115%より大きい値となっている。この領域においては、架橋反応の戻り反応が過剰に進行しているので、好ましくない。ただし、反応率の範囲は任意に設定可能であり、115%と異なる値を閾値としても良い。
表4のうち、二重線の罫線で囲まれた部分においては、対象ワークモデルWMのポリマー部12において内部気泡80が発生したことを示す。
表4の左下部において二重線の罫線で囲まれた部分のうち破線よりも下方の領域は、反応率が95%よりも小さな値となっている。この領域においては、架橋反応が十分に進行していないので、好ましくない。ただし、反応率の範囲は任意に設定可能であり、95%と異なる値を閾値としても良い。
表4において、二重線の罫線で囲まれた領域のうち、破線よりも上方の領域は、架橋反応の反応率は95%~115%の範囲内であったが、対象ワークモデルWMのポリマー部12に内部気泡80が発生したものであることを示す。この領域については、ポリマー部12に内部気泡80が発生したので、製品として好ましくない。
本形態では、表2に記載された予測結果に、内部気泡80に関する情報を追加することにより表4を作成したが、これに限られず、内部気泡80に関する情報は、任意の温度における反応率の予測結果に追加することができる。
(2)弾性率を表示する形態
表5は、対象ワークモデルWMの弾性率について、金型温度と、反応時間との関係についてまとめた表である。
表5は、対象ワークモデルWMの弾性率について、金型温度と、反応時間との関係についてまとめた表である。
表5に記載された反応時間は、金型10の内部に対象ワークモデルWMが配置された状態における反応時間を表す。また、表5に記載された弾性率の値は、金型10の内部に対象ワークモデルWMが配置された状態における反応時間と、対象ワークモデルWMが金型10から脱型された後の時間と、の双方の温度履歴に基づいて算出されたものである。対象ワークモデルWMが金型10から脱型された後も架橋反応が進行することから、上記のような考慮が必要となる。なお、以下の説明において、図28~図31に記載された反応時間および弾性率についても同様である。

弾性率は、対象ワークモデルWMの軸線Aに直角な方向について静的な力を加えたときの弾性率である。表中の数値は、架橋反応の反応率が100%であるときの弾性率に対する比の値である。ただし、対象ワークモデルWMに加えられる力の方向は限定されず、対象ワークモデルWMの軸線Aに対して平行な方向について静的な力を加えた場合、対象ワークモデルWMの軸線Aを軸にして回転する方向について静的な力を加えた場合、対象ワークモデルWMの軸線Aに対して傾ける方向について静的な力を加えた場合等、任意の方向の力を加えた場合の弾性率を採用しうる。また、対象ワークモデルWMに加えられる力は静的な力に限定されず、例えば、対象ワークモデルWMに振動が加えられた場合の弾性率であってもよい。
表5は、対象ワークモデルWMの各要素に、加硫度に応じた弾性率を割り当てて構造解析を行った結果得られる弾性率を、金型温度と、反応時間との関係についてまとめた表である。表5に記載された、太い罫線、二重線の罫線および破線の罫線の意味は、表4に記載された内容と同じなので、重複する説明を省略する。なお、表5において、「-」が記入されたセルについては、弾性率のシミュレーションにおいて計算エラーが発生した箇所である。
さらに、表5には、例えば内部気泡80に関する情報等、任意の情報を追加することができる。
本形態においては、表に記載された数値を区分するために罫線を用いたが、これに限られず、表に記載された数値の色を変えたり、フォントを変えたり、書体を斜字体や太字に変えたり、数値が記載されたセルの背景色を変えたり、セルの背景のパターンを変えたりする等、任意の手法により、表中の数値を区分することができる。
8-2.ヒートマップ図90による表示方法
図27を参照して、架橋反応の反応率を、ヒートマップ図90を用いて表示する形態について説明する。図27には、対象ワークモデルWMについて、架橋反応の反応率の分布を濃淡で表示したヒートマップ図90を示す。
図27を参照して、架橋反応の反応率を、ヒートマップ図90を用いて表示する形態について説明する。図27には、対象ワークモデルWMについて、架橋反応の反応率の分布を濃淡で表示したヒートマップ図90を示す。
ヒートマップ図90においては、対象ワークモデルWMのうち、外側接合部材13および内側接合部材14は白抜きで表示されている。また、対象ワークモデルWMのうち、ポリマー部12は架橋反応の反応率の大小にしたがって領域91~領域94に分割して表示され、分割された各領域91~領域94が、架橋反応率の大小に従って濃淡表示されている。
領域91は、架橋反応の反応率が最も高く、最も濃い色調で表示されている。領域92は、架橋反応の反応率が二番目に高く、二番目に濃い色調で表示されている。領域93は、架橋反応の反応率が三番目に高く、三番目に濃い色調で表示されている。領域94は、架橋反応の反応率が最も低く、最も薄い色調で表示されている。
表示部7はヒートマップ図90を作業者に表示する。作業者は、対象ワークモデルWMのポリマー部12における架橋反応の反応率について、濃淡表示された領域91~領域94を視認することにより、ポリマー部12の架橋反応の反応率の分布について直感的に理解することができる。
ヒートマップ図90は、対象ワークモデルWMに関するすべての反応条件(例えば、温度、時間等)について、作製し、出力することができる。また、ヒートマップ図90は、所定の反応条件についてのみ作製し、出力する態様としても良い。
表示部7によるヒートマップ図90の表示方法は特に限定されず、例えば、表示部7が上記した表5を表示し、作業者が、表示された表5の各セルを選択することにより、当該セルに対応する反応条件におけるヒートマップ図90が表示される形態としてもよい。また、作業者が架橋反応の反応条件を入力することにより、入力された反応条件に対応するヒートマップ図90が表示される態様としても良い。
本形態においては、ヒートマップ図90は、ポリマー部12が領域91~領域94に分割して表示される構成としたが、これに限られず、ポリマー部12が2個~3個、または5個以上の領域に分割されて表示される構成としても良い。また、ヒートマップ図90において、反応率の高い領域を薄い色調で表示し、反応率の低い領域を濃い色調で表示しても良い。
また、ヒートマップ図90において、反応率の高い領域を赤色などの暖色系の色で表示し、反応率の低い領域を青色などの寒色系の色で表示してもよいし、反応率の高い領域を青色などの寒色系の色で表示し、反応率の低い領域を赤色などの暖色系の色で表示してもよい。
8-3.グラフによる表示方法
(1)弾性率を表示する形態
図28~図30を参照して、対象ワークモデルWMの弾性率について、グラフを用いて表示する形態について説明する。図28~図30は、対象ワークモデルWMの弾性率の、架橋反応の反応時間に対するグラフである。図28は、最も低い金型10の温度で、対象ワークモデルWMのポリマー部12の架橋反応を行ったときのグラフであり、図29は、中程度の金型10の温度で、対象ワークモデルWMのポリマー部12の架橋反応を行ったときのグラフであり、図30は、最も高い金型10の温度で、対象ワークモデルWMのポリマー部12の架橋反応を行ったときのグラフである。図28~図30において、実線は弾性率の実測値を示し、破線は予測値を示す。
(1)弾性率を表示する形態
図28~図30を参照して、対象ワークモデルWMの弾性率について、グラフを用いて表示する形態について説明する。図28~図30は、対象ワークモデルWMの弾性率の、架橋反応の反応時間に対するグラフである。図28は、最も低い金型10の温度で、対象ワークモデルWMのポリマー部12の架橋反応を行ったときのグラフであり、図29は、中程度の金型10の温度で、対象ワークモデルWMのポリマー部12の架橋反応を行ったときのグラフであり、図30は、最も高い金型10の温度で、対象ワークモデルWMのポリマー部12の架橋反応を行ったときのグラフである。図28~図30において、実線は弾性率の実測値を示し、破線は予測値を示す。
図28~図30に示すように、弾性率は、架橋反応が開始してから上昇して極大値に達し、極大値に達した後は減少する。
金型10の温度が最も低い図28においては、弾性率の、実測値と予測値とは精度よく一致した。
金型10の温度が中程度である図29においては、反応開始後2分までは、弾性率の実測値と予測値とが一致しなかったが、2分以後は、実測値と予測値とは精度よく一致した。反応開始後2分までは、弾性率は、実測値よりも小さく予測されていた。しかしながら、反応開始後2分以内の領域については、製品として利用されることは考えられないので、製品への影響は少ない。
金型10温度が最も高い図30においては、反応開始後2分までは、弾性率の実測値と予測値とが一致しなかったが、2分以後は、実測値と予測値とは精度よく一致した。反応開始後2分までは、弾性率は、実測値よりも小さく予測されていた。実測値と予測値との差は、金型10温度が中程度である場合よりも大きかった。しかしながら、上記したように、反応開始後2分以内の領域については、製品として利用されることは考えられないので、製品への影響は少ない。
(2)弾性率と内部気泡80とを併せて表示する形態
図31を参照して、対象ワークモデルWMのポリマー部12の弾性率と、内部気泡80の発生についての予測結果を、グラフを用いて表示する形態について説明する。金型10の温度は、上記した図29と同様に、中程度の温度に設定されている。
図31を参照して、対象ワークモデルWMのポリマー部12の弾性率と、内部気泡80の発生についての予測結果を、グラフを用いて表示する形態について説明する。金型10の温度は、上記した図29と同様に、中程度の温度に設定されている。
図31には、対象ワークモデルWMの軸線Aに直角な方向に力が加えられたときの弾性率の、反応時間に対するグラフを示す。四角形状のシンボルは、対象ワークモデルWMのポリマー部12の温度が最高値である要素における弾性率を示す。丸形状のシンボルは、対象ワークモデルWMのポリマー部12の温度が中央値である要素における弾性率を示す。三角形状のシンボルは、対象ワークモデルWMのポリマー部12の温度が最低値である要素における弾性率を示す。また、図31において、白抜きのシンボルは、内部気泡80が発生すると予測された場合を示し、黒塗りのシンボルは、内部気泡80が発生しないと予測された場合を示す。
なお、ポリマー部12の温度が最高値である要素と、中央値である要素についてのグラフは、反応進行期を過ぎて、反応戻り期におけるグラフとなっている。
ポリマー部12の温度が最高値である要素においては、架橋反応の進行が最も早い。このため、反応時間が3分を超えて、3分30秒経過したときに、内部気泡80が発生しないと予測された。ポリマー部12の温度が最も高い要素においては、架橋反応の戻り反応の進行も早くなるので、反応時間6分経過時の弾性率は、最も低くなっている。
ポリマー部12の温度が中央値である要素においては、架橋反応の進行も中程度である。このため、反応時間が3分30秒を超えて4分経過したときに、内部気泡80が発生しないと予測された。反応時間6分経過時の弾性率は、ポリマー部12の温度が最高値である要素よりも大きい。
ポリマー部12の温度が最低値である要素においては、架橋反応の進行が最も遅い。このため、反応時間が4分より前の状態においては、反応進行期となっており、弾性率は反応時間の経過とともに増加すると予測された。反応時間が4分経過した後は、架橋反応の戻り反応が進行し、弾性率が漸減すると予測された。ポリマー部12の温度が最低値である要素においては、反応時間が5分を超えて、5分30秒経過したときに、内部気泡80が発生しないと予測された。この時点で、対象ワークモデルWMのポリマー部12の全領域において内部気泡80が消失したと予測された。反応時間6分経過時の弾性率は、ポリマー部12の全領域の中で最も大きいと予測された。
上記したように、反応時間が5分30秒経過したときに、対象ワークモデルWMのポリマー部12の全領域において内部気泡80が消失したと予測されたが、危険率を考慮して、反応時間6分経過時を、この対象ワークモデルWMの反応時間として採用した。反応時間6分経過時において、ポリマー部12の弾性率のばらつきは、12%であると予測された。
このように、本形態によれば、対象ワークモデルWMについて、内部気泡80が発生しなくなる反応時間を予測可能であるとともに、当該反応時間におけるポリマー部12の弾性率のばらつきも予測することができる。
(3)内部気泡80を視覚的に表示する形態
図32を参照して、対象ワークモデルWMのポリマー部12における、内部気泡80の発生の予測結果を視覚的に表示する形態について説明する。
図32を参照して、対象ワークモデルWMのポリマー部12における、内部気泡80の発生の予測結果を視覚的に表示する形態について説明する。
図32は、対象ワークモデルWMの断面図を利用して、ポリマー部12における内部気泡80の発生可能性の高さを濃淡で表示した図である。対象ワークモデルWMの外側接合部材13および内側接合部材14は、図32において最も濃いパターンで示されている。
対象ワークモデルWMのポリマー部12は、図32において最も薄いパターンで示されている。ポリマー部12の内部には、楕円形状の領域Pと、領域Pの内部に位置する楕円形状の領域Qが表示されている。領域Pは、ポリマー部12を表す薄いパターンよりもやや濃いパターンで表示されている。領域Qは、領域Pよりもやや濃いパターンで表示されている。
内部気泡推定処理S4の結果、例えば、領域Pが比較的に内部気泡80の発生しやすい領域と判定され、領域Qが領域Pよりも内部気泡80の発生しやすい領域と判定された場合を例にして説明する。領域Pおよび領域Qは、実際に内部気泡80の発生しやすい領域に対応している(図23参照)。
内部気泡推定処理S4が終了すると、表示部7は、図32に示す対象ワークモデルWMを表示する。作業者は、表示部7に表示された図32を見ることにより、比較的に濃いパターンで示される外側接合部材13および内側接合部材14と、比較的に薄いパターンで示されるポリマー部12と、を視認する。作業者は、濃いパターンで示される外側接合部材13および内側接合部材14が、ポリマー部12と異なる部分であることを直感的に理解することができる。これにより、作業者は、内部気泡80を探すためには、比較的に薄いパターンで示されるポリマー部12を確認すればよいことを、直感的に理解することができる。ただし、外側接合部材13および内側接合部材14を白抜きで表示しても良い。
次に、作業者は、薄いパターンで示されるポリマー部12の中に、比較的に濃いパターンで示される領域Pおよび領域Qが表示されていることを視認する。これにより、作業者は、ポリマー部12のうち、領域Pおよび領域Qにおいて、内部気泡80が発生しやすいことを直感的に理解することができる。さらに、領域Qは領域Pよりも濃いパターンで表示されているので、領域Pにおいて最も内部気泡80が発生しやすいことを直感的に理解することができる。これにより、対象ワークモデルWMの製造条件を検討する際に、内部気泡80が発生する可能性の高い領域において内部気泡80を探せばよいので、対象ワークモデルWMの製造条件を効率的に検討することができる。ただし、内部気泡80の発生する可能性の高い領域を比較的に薄いパターンで表示しても良い。
8-4.設定温度と弾性率Ksとの相関についてグラフを用いる形態
図38に、複数(本形態では3つ)の異なるRKsを有する原料ポリマーについて、弾性率Ksと、架橋反応の設定温度と、の相関関係に係るグラフを示す。
図38に、複数(本形態では3つ)の異なるRKsを有する原料ポリマーについて、弾性率Ksと、架橋反応の設定温度と、の相関関係に係るグラフを示す。
図38に示すグラフの横軸は、架橋反応が実行される金型の設定温度である。設定温度には、所定の範囲の製造範囲が定められている。架橋反応は、製造範囲内の設定温度で行われる。
図38に示すグラフの縦軸は、対象ワークモデルWMの弾性率Ksである。弾性率Ksには、規格が定められている。対象ワークモデルWMの弾性率Ksは、規格上限と、規格下限との間の領域内の値であることが求められる。規格上限よりもKsが大きい場合、および、規格下限よりもKsが小さい場合、対象ワークモデルWMは不良品となる。
規格上限と、規格下限との間には、中央値が存在する。弾性率Ksは、規格上限と規格下限との間の値であることが好ましく、中央値の近傍であることがより好ましい。
図38に示すように、RKsが比較的に大きな値を有する場合、製造範囲の下限に近い設定温度で架橋反応を行うと、対象ワークモデルWMの弾性率Ksが、規格上限よりも大きくなってしまう場合が考えられる。この場合、シミュレーション結果に基づいて、設定温度を製造範囲の上限寄りに設定することにより、対象ワークモデルWMの弾性率Ksを、規格上限よりも小さくすることが可能となる。
一方、RKsが比較的に小さな値を有する場合、製造範囲の上限に近い設定温度で架橋反応を行うと、対象ワークモデルWMの弾性率Ksが、規格下限よりも小さくなってしまう場合が考えられる。この場合、シミュレーション結果に基づいて、設定温度を製造範囲の下限寄りに設定することにより、対象ワークモデルWMの弾性率Ksを、規格下限よりも大きくすることが可能となる。
また、RKsが中程度の場合、製造範囲内の設定温度で架橋反応を行うと、対象ワークモデルWMの弾性率Ksが、規格上限と規格下限の間の領域に収まる場合がある。このような場合でも、シミュレーション結果に基づいて、対象ワークモデルWMの弾性率Ksが、規格上限と規格下限の中央値の近傍になるように、設定温度を調節することができる。
表示部7は、図38に示すグラフを作業者に表示しても良い。また、表示部7は、図38において適切に設定された設定温度の数値を作業者に表示しても良い。
設定条件解析部は、図38において適切に設定された設定温度の数値を表示部7に表示せず、図示しない架橋反応装置に送信し、架橋反応装置は、受信した数値に基づいて、原料ポリマーについて架橋反応を実行する構成としても良い。
(実施形態1-2)
次に、図39を参照して、実施形態1-2について説明する。本形態においては、ポリマー特性値PVとして、ポリマー部12の架橋反応の反応時間を適用した点で、実施形態1-2と異なる。
次に、図39を参照して、実施形態1-2について説明する。本形態においては、ポリマー特性値PVとして、ポリマー部12の架橋反応の反応時間を適用した点で、実施形態1-2と異なる。
実施形態1-1の図4に記載された伝熱解析処理S1、架橋反応解析処理S2、および構造解析処理S3を実行することにより、複数の設定条件(例えば、金型10の設定温度)における、対象ワークモデルWMの弾性率Ksと、架橋反応の反応時間と、の相関関係を予測することができる。
図39(a)に、上記のようにして算出した、対象ワークモデルWMの弾性率Ksと、架橋反応の反応時間との相関関係を示す。縦軸は、軸直交方向の弾性率の比の値となっており、弾性率Ksそのものの値ではない。図35(a)に示されるグラフは、原料ポリマーのポリマー特性値PVの一例であるRKsについての情報は含まれていない。
一方、図39(b)は、軸直交方向の弾性率の、架橋反応の反応時間に対する変化を示す実測データである。詳細には記載しないが、原料ポリマーは所定のRKsを有する。
図39(c)に示すように、図39(a)に示されるグラフのピーク位置と、図39(b)に示されるグラフのピーク位置と、を一致させるように、図39(a)に示されるグラフを縦軸方向および/または横軸方向にシフトする。換言すると、グラフを、軸直交方向の弾性率方向、および/または、反応時間方向にシフトする。これにより、図39(c)に示されるように、伝熱解析処理S1、架橋反応解析処理S2、および構造解析処理S3を実行することにより得られたシミュレーション結果を、実測データに合わせて校正することができる。
なお、上記以外の構成については、実施形態1-1と略同様なので、重複する説明を省略する。また、以下の実施形態において用いた符号のうち、既出の実施形態において用いた符号と同一のものは、特に示さない限り、既出の実施形態におけるものと同様の構成要素等を表す。
(実施形態1-3)
次に、図40を参照して、実施形態1-3について説明する。本形態は、表を用いてシミュレーション結果を校正するものであり、設定条件と反応時間とをシフトすることによりシミュレーション結果を校正する。
次に、図40を参照して、実施形態1-3について説明する。本形態は、表を用いてシミュレーション結果を校正するものであり、設定条件と反応時間とをシフトすることによりシミュレーション結果を校正する。
まず、本形態は、実施形態1-1の図4に記載された伝熱解析処理S1、架橋反応解析処理S2、および構造解析処理S3を実行することにより、実施形態1-1の表5に対応する、表6を作成する。
図40に示すように、表6は、対象ワークモデルWMの弾性率Ksと、架橋反応の設定温度と、架橋反応の反応時間と、の関係についてまとめたものである。設定温度は、特に限定されず、金型10の温度でも良いし、入子の温度でも良いし、他の部材の温度でも良い。また、弾性率Ksは、対象ワークモデルWMの、軸直交方向の弾性率でも良いし、軸方向の弾性率でも良い。
表6に示すように、設定温度T1、反応時間t1のとき、対象ワークモデルWMの弾性率Ksはα1となる。以下、設定温度Tl,反応時間tmのとき、対象ワークモデルWMの弾性率Ksはαnとなる。ただし、l、m、nは1以上の自然数である。表6については、RKsについての情報は含まれていない。
上記のようにして得られた表6につき、所定のRKsを有する原料ポリマーを用いて架橋反応を行い、弾性率と、設定温度と、反応時間とについて、実測データを得る。得られた実測データに基づいて、表6に記載された設定温度および反応時間を、変更する。具体的には、実測データの弾性率Ksの値に合わせて、設定温度および反応時間をシフトさせる。これにより、表7を作成する。
表7に示すように、設定温度T’1、反応時間t’のとき、対象ワークモデルWMの弾性率Ksはα1となっている。以下、設定温度T’l,反応時間t’mのとき、対象ワークモデルWMの弾性率Ksはαnとなる。ただし、l、m、nは1以上の自然数である。これにより、伝熱解析処理S1、架橋反応解析処理S2、および構造解析処理S3を実行することにより得られたシミュレーション結果を、実測データに合わせて校正することができる。
なお、上記以外の構成については、実施形態1-1と略同様なので、重複する説明を省略する。
(実施形態1-4)
次に、図41を参照して、実施形態1-4について説明する。本形態は、表を用いてシミュレーション結果を校正するものであり、反応時間をシフトすることにより、シミュレーション結果を校正する。
次に、図41を参照して、実施形態1-4について説明する。本形態は、表を用いてシミュレーション結果を校正するものであり、反応時間をシフトすることにより、シミュレーション結果を校正する。
まず、本形態は、実施形態1-1の図4に記載された伝熱解析処理S1、架橋反応解析処理S2、および構造解析処理S3を実行することにより、実施形態1-1の表5に対応する、表6を作成する。
上記のようにして得られた表6につき、所定のRKsを有する原料ポリマーを用いて架橋反応を行い、弾性率と、設定温度と、反応時間とについて、実測データを得る。得られた実測データに基づいて、表6に記載された反応時間を、変更する。具体的には、実測データの弾性率Ksの値に合わせて、反応時間をシフトさせる。これにより、表8を作成する。
表8に示すように、設定温度T1、反応時間t’1のとき、対象ワークモデルWMの弾性率Ksはα1となっている。以下、設定温度Tl,反応時間t’mのとき、対象ワークモデルWMの弾性率Ksはαnとなる。ただし、l、m、nは1以上の自然数である。これにより、伝熱解析処理S1、架橋反応解析処理S2、および構造解析処理S3を実行することにより得られたシミュレーション結果を、実測データに合わせて校正することができる。
なお、上記以外の構成については、実施形態1-1と略同様なので、重複する説明を省略する。
(実施形態1-5)
次に、図42を参照して、実施形態1-5について説明する。本形態は、表を用いてシミュレーション結果を校正するものであり、設定温度をシフトすることによりシミュレーション結果を校正する。
次に、図42を参照して、実施形態1-5について説明する。本形態は、表を用いてシミュレーション結果を校正するものであり、設定温度をシフトすることによりシミュレーション結果を校正する。
まず、本形態は、実施形態1-1の図4に記載された伝熱解析処理S1、架橋反応解析処理S2、および構造解析処理S3を実行することにより、実施形態1-1の表5に対応する、表6を作成する。
上記のようにして得られた表6につき、所定のRKsを有する原料ポリマーを用いて架橋反応を行い、弾性率と、設定温度と、反応時間とについて、実測データを得る。得られた実測データに基づいて、表6に記載された設定温度を、変更する。具体的には、実測データの弾性率Ksの値に合わせて、設定温度をシフトさせる。これにより、表9を作成する。
表9に示すように、設定温度T’1、反応時間t1のとき、対象ワークモデルWMの弾性率Ksはα1となっている。以下、設定温度T’l,反応時間tmのとき、対象ワークモデルWMの弾性率Ksはαnとなる。ただし、l、m、nは1以上の自然数である。これにより、伝熱解析処理S1、架橋反応解析処理S2、および構造解析処理S3を実行することにより得られたシミュレーション結果を、実測データに合わせて校正することができる。
なお、上記以外の構成については、実施形態1-1と略同様なので、重複する説明を省略する。
(実施形態1-6)
次に、図43を参照して、実施形態1-6について説明する。本形態は、表を用いてシミュレーション結果を校正するものであり、設定温度、反応時間、および対象ワークモデル弾性率Ksをシフトすることによりシミュレーション結果を校正する。
次に、図43を参照して、実施形態1-6について説明する。本形態は、表を用いてシミュレーション結果を校正するものであり、設定温度、反応時間、および対象ワークモデル弾性率Ksをシフトすることによりシミュレーション結果を校正する。
まず、実施形態1-1の図4に記載された伝熱解析処理S1、架橋反応解析処理S2、および構造解析処理S3を実行することにより、実施形態1-1の表5に対応する、表6を作成する。
上記のようにして得られた表6につき、所定のRKsを有する原料ポリマーを用いて架橋反応を行い、弾性率と、設定温度と、反応時間とについて、実測データを得る。得られた実測データに基づいて、表6に記載された設定温度、反応時間、および弾性率Ksを、変更する。具体的には、実測データの弾性率Ksの値に合わせて、設定温度、反応時間、および弾性率Ksをシフトさせる。これにより、表10を作成する。
表10に示すように、設定温度T’1、反応時間t’1のとき、対象ワークモデルWMの弾性率Ksはα’1となっている。以下、設定温度T’l,反応時間t’mのとき、対象ワークモデルWMの弾性率Ksはα’nとなる。ただし、l、m、nは1以上の自然数である。これにより、伝熱解析処理S1、架橋反応解析処理S2、および構造解析処理S3を実行することにより得られたシミュレーション結果を、実測データに合わせて校正することができる。
本形態は、上記した実施形態1-3と、対象ワークモデルWMの弾性率Ksについてもシフトする点で相違する。例えば、実施形態1-3のように、弾性率Ksを固定して、シミュレーション結果と実測データとを構成したとする。この場合に、設定温度T’l,反応時間t’mが小数を含む数値となる場合が想定されうる。このような場合において、補正後の設定温度T’l,反応時間t’mが整数となるように、弾性率Ksをシフトさせることにより、表10を、作業者が理解しやすいものにすることができる。
なお、上記以外の構成については、実施形態1-1と略同様なので、重複する説明を省略する。
(実施形態1-7)
次に、図44を参照して、実施形態1-7について説明する。本形態は、表を用いてシミュレーション結果を校正するものであり、表中の1つのセルについて対象ワークモデル弾性率Ksをシフトすることによりシミュレーション結果を校正する。
次に、図44を参照して、実施形態1-7について説明する。本形態は、表を用いてシミュレーション結果を校正するものであり、表中の1つのセルについて対象ワークモデル弾性率Ksをシフトすることによりシミュレーション結果を校正する。
まず、本形態は、実施形態1-1の図4に記載された伝熱解析処理S1、架橋反応解析処理S2、および構造解析処理S3を実行することにより、実施形態1-1の表5に対応する、表6を作成する。
上記のようにして得られた表6につき、所定のRKsを有する原料ポリマーを用いて架橋反応を行い、弾性率と、設定温度と、反応時間とについて、実測データを得る。得られた実測データに基づいて、表6に記載された弾性率Ksにつき、1つのデータのみ変更する。具体的には、実測データの弾性率Ksの値に合わせて、1つの弾性率Ksの値のみを、シフトさせる。これにより、表11を作成する。
表11に示すように、設定温度T2、反応時間t3のとき、対象ワークモデルWMの弾性率Ksはβ’3となっている。これにより、伝熱解析処理S1、架橋反応解析処理S2、および構造解析処理S3を実行することにより得られたシミュレーション結果を、実測データに合わせて校正することができる。本形態によれば、所望の弾性率Ksの値のみを構成すれば良いので、計算時間を短縮することができる。
なお、上記以外の構成については、実施形態1-1と略同様なので、重複する説明を省略する。
(実施形態2-1)
次に、図45~図50を参照して、実施形態2-1について説明する。本形態は、架橋反応の反応率に係るシミュレーション結果と、機械学習と、を用いて、対象ワークモデル弾性率Ksを予測する。機械学習においては、対象ワークモデルWMの要素の個数と最大で同数の学習済みモデルを生成し、要素の個数と最大で同数の、架橋反応の反応率を用いる。
次に、図45~図50を参照して、実施形態2-1について説明する。本形態は、架橋反応の反応率に係るシミュレーション結果と、機械学習と、を用いて、対象ワークモデル弾性率Ksを予測する。機械学習においては、対象ワークモデルWMの要素の個数と最大で同数の学習済みモデルを生成し、要素の個数と最大で同数の、架橋反応の反応率を用いる。
本形態に係る架橋反応シミュレーション装置1aは、機械学習を行う演算処理部9を備える。本形態に係る架橋反応シミュレーション装置1aは、ポリマー部12の架橋反応の反応率に関するデータから選択された学習用の訓練データTRDを用いて機械学習を行うことにより学習済みモデルTMを生成し、この学習済みモデルTMを用いて、対象ワークモデル弾性率Ksを予測する。
図45に示すように、本形態に係る架橋反応シミュレーション装置1aは、演算処理部9を備える。演算処理部9は機械学習を行う。なお、図45において、伝熱解析部3、架橋反応解析部4、構造解析部5、内部気泡推定部6、および設定条件解析部8は、図1aと同様なので、同一の符号を付して重複する説明を省略する。
演算処理部9は、訓練データTRDを用いて機械学習を行うことにより学習済みモデルTMを生成する。また、演算処理部9は、学習済みモデルTMを用いて目的変数を予測する。目的変数は、特に限定されず、ポリマー部12の最終反応率、ポリマー部12の脱型時反応率、ポリマー部12の最終等価反応量、ポリマー部の脱型時等価反応量、対象ワークモデルWMの弾性率Ks、ポリマー部12の内部気泡の発生等、任意の目的変数を適宜に選択できる。
図46に示すように、記憶部2は、ポリマー部12の架橋反応の反応率または等価反応量に関するデータから選択された学習用の訓練データTRDと、訓練データTRDを用いて機械学習を行うことにより生成された学習済みモデルTMと、しきい値THと、を記憶する。
続いて、本形態に係る架橋反応シミュレーション装置1aの動作について説明する。図47に、本形態に係る架橋反応シミュレーション装置1aの動作のメインフローを示す。図47に示すように、本形態に係る架橋反応シミュレーション装置1aが起動すると、シミュレーション処理S10が実行される。次に、予測処理S20が実行され、動作が終了する。ただし、シミュレーション処理S10を実行する前に、実験計画法により解析条件を決定する工程を実行しても良い。実験計画法により選択されたデータを用いることにより、効率的にシミュレーション処理S10を実行することができる。
図48に示すように、本形態に係るシミュレーション処理S10は、実施形態1の図4に示すメインフローと同じなので、同一の処理については同一の符号を付し、重複する説明を省略する。
図49に、本形態に係る予測処理のフローチャートを示す。予測処理(S20)が開始すると、演算処理部9は、訓練データを生成する(S210)。詳細に説明すると、反応率算出処理部41が算出した複数の反応率から、訓練データを抽出する。訓練データは、複数の反応率からランダムに抽出しても良いし、複数の反応率に関係するデータの分布を考慮して所定のルールに基づいて抽出しても良いし、例えば実験計画法に基づいて抽出しても良い。
次に、演算処理部9は、第1学習済みモデルを生成する(S211)。第1学習済みモデルは、学習済みモデルの一例である。演算処理部9は、対象ワークモデルWMの複数の解析メッシュに対応する各要素について、第1学習済みモデルを生成する。すなわち、対象ワークモデルWMの解析メッシュと最大で同じ個数の第1学習済みモデルが生成される。第1学習済みモデルは、ポリマー部12の架橋反応の設定条件から、ポリマー部12の最終反応率を予測する。なお、最終反応率は、要素番号nの最終反応率である。
次に、演算処理部9は、第2学習済みモデルを生成する(S211)。第2学習済みモデルは、学習済みモデルの一例である。演算処理部9は、設定条件と、複数の第1学習済みモデルに基づいて予測された、対象ワークモデルWMの複数の解析メッシュの各要素の最終反応率と、から、対象ワークモデル弾性率Ksを予測する。
次に、演算処理部9は、反応率を予測する(S213)。これにより、演算処理部9は、設定条件と、第1学習済みモデルおよび第2学習済みモデルに基づいて、対象ワークモデルWMの複数の解析メッシュに対応する各要素について最終反応率を予測する。
次に、演算処理部9は、第1学習済みモデルおよび第2学習済みモデルについて、決定係数R2を算出する(S214)。決定係数R2は、下記の式(19)を採用する。ただし、決定係数R2は、他に定義されるものを用いても良い。また、予測精度の指標は決定係数R2に限定されず、例えば、平均絶対誤差(MEA)、二乗平均平方根誤差(RMSE)等、任意の指標を適宜に選択できる。

ただし、yは標本値であり、fは予測に基づく推定値であり、yavは、標本値の平均値である。
次に、演算処理部9は、第1学習済みモデルの決定係数R2(第1)が、しきい値THよりも小さいかについて判断する(S215)。しきい値THの値は特に限定されず、任意の値を適宜に採用できる。しきい値THは、0.6~0.9が好ましく、0.65~0.75がより好ましい。本形態に係るしきい値THは0.7とされる。
第1学習済みモデルの決定係数R2(第1)が、しきい値THよりも小さい場合(S215:Y)、すべての条件についてシミュレーション処理(S218)が実行される。シミュレーション処理(S218)の内容は、図48のシミュレーション処理(S10)と同様なので、重複する説明を省略する。これにより、対象ワークモデル弾性率Ksが算出される。以上により、予測処理(S20)が終了する。
一方、第1学習済みモデルのR2が、しきい値THよりも小さくない場合(S215:N)、演算処理部9は第2学習済みモデルの決定係数R2(第2)が、しきい値よりも小さいかについて判断する(S216)。
第2学習済みモデルの決定係数R2(第2)が、しきい値THよりも小さい場合(S216:Y)、すべての条件についてシミュレーション処理(S218)が実行される。これにより、対象ワークモデル弾性率Ksが算出される。以上により、予測処理(S20)が終了する。
一方、第2学習済みモデルの決定係数R2(第2)が、しきい値THよりも小さくない場合(S216:N)、演算処理部9は、設定条件と、第1学習済みモデルと、を用いて、対象ワークモデルWMの複数の解析メッシュに対応する各要素の最終反応率を予測する。次に、演算処理部9は、第2学習済みモデルを用いて、設定条件と、対象ワークモデルWMの複数の解析メッシュに対応する各要素の最終反応率と、を用いて、対象ワークモデル弾性率Ksを予測する(S217)。以上により、予測処理(S20)が終了する。
図50には、横軸を、シミュレーション処理により得られた、ポリマー部12の要素番号nの最終反応率とし、縦軸と、機械学習により予測された要素番号nの最終反応率としたときの、相関関係を示す。図51に示された複数の点が、原点から右斜め上方にのびる直線に近いほど、シミュレーション結果と、機械学習の結果との相関が高く、機械学習の予測精度が高いことを意味する。本形態によれば、反応率が1.0以上で高い相関を得た。
本形態によれば、機械学習により最終反応率を予測することができるとともに、機械学習により対象ワークモデル弾性率Ksを予測することができる。これにより、対象ワークモデル弾性率Ksの計算時間を短縮することができる。
また、上記のようにして予測された対象ワークモデル弾性率Ksを用いて、実施形態1と同様にして設定条件を予測することにより、全体として、設定条件の計算時間を短縮することができる。
(実施形態2-2)
次に、図51~図53を参照して、実施形態2-2について説明する。本形態は、架橋反応の反応率に係るシミュレーション結果と、機械学習と、を用いて、対象ワークモデル弾性率Ksを予測する。機械学習においては、架橋反応の反応率について複数の統計量を予測する学習済みモデルを生成し、統計量と同数の、架橋反応の反応率を用いる。
次に、図51~図53を参照して、実施形態2-2について説明する。本形態は、架橋反応の反応率に係るシミュレーション結果と、機械学習と、を用いて、対象ワークモデル弾性率Ksを予測する。機械学習においては、架橋反応の反応率について複数の統計量を予測する学習済みモデルを生成し、統計量と同数の、架橋反応の反応率を用いる。
図51に、本形態の予測処理のフローチャートの一部を示す。本形態の予測処理(S20)が開始すると、演算処理部9は、訓練データを作成する(S2200)。本形態のS2200の処理は、図49のS210と同じなので、重複する説明を省略する。
次に、演算処理部9は、第1学習済みモデルを生成し(S2201)、第3学習済みモデルを生成し(S2202)、第4学習済みモデルを生成する(S2203)。S2201の処理は、図49のS210と同じなので重複する説明を省略する。ただし、第4学習済みモデルは、後述するS2207の後、S2209の前に生成しても良い。
第3学習済みモデルは、設定条件と、対象ワークモデルWMの複数の解析メッシュに対応する各要素の最終反応率の平均値、対象ワークモデルWMの複数の解析メッシュに対応する各要素の最終反応率の最大値、最小値、および標準偏差の少なくとも1つに基づいて、対象ワークモデル弾性率Ksを予測する。ただし、予測する統計量は上記に限定されず、任意の統計量を予測しうる。
第4学習済みモデルは、学習済みモデルの一例である。演算処理部9は、対象ワークモデルWMの複数の解析メッシュに対応する各要素の最終反応率について、平均値、最大値、最小値および標準偏差の少なくとも1つを予測する。第4学習済みモデルの個数は、最終反応率の平均値、最大値、最小値および標準偏差の少なくとも1つを予測するものの合計である。従って、第4学習済みモデルの個数は、最も少ない場合は1つである。1つの第4学習済みモデルを用いる場合には、予測する統計量は平均値が好ましい。ただし、予測する統計量は上記に限定されず、任意の統計量を予測しうる。
次に、演算処理部9は、反応率を予測する(S2204)。これにより、演算処理部9は、設定条件と、第1学習済みモデル、第3学習済みモデル、および第4学習済みモデルに基づいて、対象ワークモデルWMの複数の解析メッシュに対応する各要素について最終反応率を予測する。ただし、第4学習済みモデルを用いた反応率は、後述するS2207の後、S2209の前に予測しても良い。
次に、演算処理部9は、第1学習済みモデル、第3学習済みモデルおよび第4学習済みモデルについて、決定係数R2を算出する(S2205)。ただし、第4学習済みモデルに係る決定係数R2は、後述するS2207の後、S2209の前に予測しても良い。
次に、演算処理部9は、第1学習済みモデルの決定係数R2(第1)が、しきい値THよりも小さいかについて判断する(S2206)。
第1学習済みモデルの決定係数R2(第1)が、しきい値THよりも小さい場合(S2206:Y)、すべての条件についてシミュレーション処理(S2208)が実行される。シミュレーション処理(S2208)の内容は、図48のシミュレーション処理(S10)と同様なので、重複する説明を省略する。これにより、対象ワークモデル弾性率Ksが算出される。以上により、予測処理(S20)が終了する(図52参照)。
一方、第1学習済みモデルのR2が、しきい値THよりも小さくない場合(S2206:N)、演算処理部9は第3学習済みモデルの決定係数R2(第3)が、しきい値よりも小さいかについて判断する(S2207)。
第3学習済みモデルの決定係数R2(第3)が、しきい値THよりも小さい場合(S2207:Y)、すべての条件についてシミュレーション処理(S2208)が実行される。これにより、対象ワークモデル弾性率Ksが算出される。以上により、予測処理(S20)が終了する(図52参照)。
一方、第3学習済みモデルの決定係数R2(第3)が、しきい値THよりも小さくない場合(S2207:N)、図52に示すように、演算処理部9は、第4学習済みモデルの決定係数R2(第4)が、しきい値THよりも小さいかについて判断する(S2209)。
第4学習済みモデルの決定係数R2(第4)が、しきい値THよりも小さくない場合(S2209:N)、演算処理部9は第3学習済みモデルおよび第4学習済みモデルを選択する(S2210)。
次に、演算処理部9は、第4学習済みモデルを用いて、対象ワークモデルWMの複数の解析メッシュに対応する各要素の最終反応率について、平均値、最大値、最小値および標準偏差の少なくとも1つを予測する(S2211)。
次に、演算処理部9は、対象ワークモデル弾性率予測処理を実行する(S2212)。これにより、演算処理部9は、第3学習済みモデルと、設定条件と、対象ワークモデルWMの複数の解析メッシュに対応する各要素の最終反応率について平均値、最大値、最小値および標準偏差の少なくとも1つに基づいて、対象ワークモデル弾性率Ksを予測する。ただし、統計量は上記に限定されず、任意の統計量を予測しうる。以上により、予測処理(S20)が終了する。
一方、第4学習済みモデルの決定係数R2(第4)が、しきい値THよりも小さい場合(S2209:Y)、図53に示すように、演算処理部9は第1学習済みモデルを選択する(S2213)。
次に、演算処理部9は、対象ワークモデルWMの複数の解析メッシュに対応する要素について最終反応率を算出する(S2214)。
次に、演算処理部9は、対象ワークモデルWMの複数の解析メッシュに対応する要素についての統計量を算出する(S2215)。
次に、演算処理部9は、S2215で算出した最終反応率の統計量の予測値と、解析値と、に基づいて決定係数R2(統計)を算出する(S2216)。
次に、演算処理部9は、決定係数R2(統計)が、しきい値THより小さいかについて判断する(S2217)。
決定係数R2(統計)が、しきい値THよりも小さい場合(S2217:Y)、すべての条件についてシミュレーション処理(S2220)が実行される。これにより、対象ワークモデル弾性率Ksが算出される。以上により、予測処理(S20)が終了する(図52参照)。
一方、決定係数R2(統計)が、しきい値THよりも小さくない場合(S2217:N)、演算処理部9は、第3学習済みモデルを選択する(S2218)。
次に、演算処理部9は、第3学習済みモデルと、S2215で算出された統計量と、を用いて、対象ワークモデル弾性率Ksを予測する(S2219)。以上により、予測処理(S20)が終了する(図52参照)。
本形態によれば、最少で2つの第4学習済みモデルを用いるので、対象ワークモデル弾性率Ksの計算時間を短縮できる。
(実施形態2-2の変形例)
次に、図54~図55を参照して、実施形態2-2の変形例について説明する。図54および図55に、本変形例に係る予熱処理のフローチャートの一部を示す。図54に記載されたフローチャートは、図51のフローチャートと、S2201およびS2206が省略されている点で異なる。
次に、図54~図55を参照して、実施形態2-2の変形例について説明する。図54および図55に、本変形例に係る予熱処理のフローチャートの一部を示す。図54に記載されたフローチャートは、図51のフローチャートと、S2201およびS2206が省略されている点で異なる。
また、図55に記載されたフローチャートは、図53のフローチャートと、S2201、S2204、S2205およびS2206が記載されている点で異なる。図55においては、第1学習済みモデルが生成される(S2201)。次に、反応率を予測する(S2204)。その後、第1学習済みモデルについて決定係数R2を算出する(S2205)。次に、演算処理部9は、第1学習済みモデルの決定係数R2(第1)が、しきい値THよりも小さいかについて判断する(S2206)。第1学習済みモデルの決定係数R2(第1)が、しきい値THより小さくない場合(S2206:N)、第1学習済みモデルが選択される(S2213)。
一方、第1学習済みモデルの決定係数R2(第1)が、しきい値THより小さい場合(S2206:Y)、シミュレーション処理(S2220)が実行される。
上記以外は、実施形態2-2と同様なので、重複する説明を省略する。
本形態によれば、第1学習済みモデルは、第3学習済みモデルおよび第4学習済みモデルでは精度が十分に高くない場合に、採用される。第1学習済みモデルは、複数の予測モデルを生成するため、モデルを生成するために時間がかかる。このため、本形態によれば、第3学習済みモデルおよび第4学習済みモデルについて十分に精度が高い場合に、第1学習済みモデルの生成を省略できるので、全体として、処理を高速化することができる。
(実施形態2-3)
次に、図56~図57を参照して、実施形態2-3について説明する。本形態は、架橋反応の等価反応量に係るシミュレーション結果と、機械学習と、を用いて、対象ワークモデル弾性率Ksを予測する。機械学習においては、対象ワークモデルWMの要素の個数と最大で同数の学習済みモデルを生成し、要素の個数と最大で同数の、等価反応量を用いる。
次に、図56~図57を参照して、実施形態2-3について説明する。本形態は、架橋反応の等価反応量に係るシミュレーション結果と、機械学習と、を用いて、対象ワークモデル弾性率Ksを予測する。機械学習においては、対象ワークモデルWMの要素の個数と最大で同数の学習済みモデルを生成し、要素の個数と最大で同数の、等価反応量を用いる。
本形態に係る予測処理(S230)が開始すると、演算処理部9は、訓練データを生成する(S230)。演算処理部9は、反応率算出処理部41が算出した複数の等価反応量から、訓練データを抽出する。訓練データは、複数の等価反応量からランダムに抽出しても良いし、複数の等価反応量に関係するデータの分布を考慮して所定のルールに基づいて抽出しても良いし、例えば実験計画法に基づいて抽出しても良い。
次に、演算処理部9は、第5学習済みモデルを生成する(S231)。第5学習済みモデルは、学習済みモデルの一例である。演算処理部9は、対象ワークモデルWMの複数の解析メッシュに対応する各要素について、第5学習済みモデルを生成する。すなわち、対象ワークモデルWMの解析メッシュと最大で同じ個数の第5学習済みモデルが生成される。第5学習済みモデルは、ポリマー部12の架橋反応の設定条件から、ポリマー部12の等価反応量を予測する。
次に、演算処理部9は、第6学習済みモデルを生成する(S232)。第6学習済みモデルは、学習済みモデルの一例である。演算処理部9は、設定条件と、複数の第6学習済みモデルに基づいて予測された、対象ワークモデルWMの複数の解析メッシュの各要素の等価反応量と、から、対象ワークモデル弾性率Ksを予測する。例えば、予測された複数の等価反応量を、複数の最終反応量に変換し、変換された複数の最終反応量に基づいて、対象ワークモデル弾性率Ksを予測しても良い。
次に、演算処理部9は、等価反応量予測処理を実行する(S233)。これにより、予測処理部は、設定条件と、第5学習済みモデルに基づいて、対象ワークモデルWMの複数の解析メッシュに対応する各要素について等価反応量を予測する。ただし、第6学習済みモデルを生成する処理(S232)と、等価反応量予測処理(S233)の順序は任意である。
なお、上記した式(17)を用いて、図11(b)に示す、縦軸を反応率とし、横軸を反応時間としたグラフから、縦軸を反応率とし、横軸を等価反応量とするグラフへと読替えることができる。これにより、予測した等価反応量から、反応率へ容易に変換することができる。変換された反応率は、後述する内部気泡の判定に用いることができる。
次に、演算処理部9は、第5学習済みモデルおよび第6学習済みモデルについて、決定係数R2を算出する(S234)。
次に、演算処理部9は、第5学習済みモデルの決定係数R2(第5)が、しきい値THよりも小さいかについて判断する(S235)。
第5学習済みモデルの決定係数R2(第5)が、しきい値THよりも小さい場合(S235:Y)、すべての条件についてシミュレーション処理(S238)が実行される。これにより、対象ワークモデル弾性率Ksが算出される。以上により、予測処理(S20)が終了する。
一方、第5学習済みモデルのR2が、しきい値THよりも小さくない場合(S235:N)、演算処理部9は第6学習済みモデルの決定係数R2(第6)が、しきい値よりも小さいかについて判断する(S236)。
第6学習済みモデルの決定係数R2(第6)が、しきい値THよりも小さい場合(S236:Y)、すべての条件についてシミュレーション処理(S238)が実行される。これにより、対象ワークモデル弾性率Ksが算出される。以上により、予測処理(S20)が終了する。
一方、第6学習済みモデルの決定係数R2(第6)が、しきい値THよりも小さくない場合(S236:N)、演算処理部9は、設定条件と、第5学習済みモデルと、を用いて、対象ワークモデルWMの複数の解析メッシュに対応する各要素の等価反応量を予測する。次に、演算処理部9は、第6学習済みモデルを用いて、設定条件と、対象ワークモデルWMの複数の解析メッシュに対応する各要素の等価反応量と、を用いて、対象ワークモデル弾性率Ksを予測する(S237)。以上により、予測処理(S20)が終了する。
図57には、横軸を、シミュレーション処理により得られた、ポリマー部12の要素番号nの最終等価反応量とし、縦軸と、機械学習により予測された要素番号nの最終等価反応量としたときの、相関関係を示す。図55に示された複数の点が、原点から右斜め上方にのびる直線に近いほど、シミュレーション結果と、機械学習の結果との相関が高く、機械学習の予測精度が高いことを意味する。本形態によれば、機械学習により予測された等価反応量の予測精度を向上させることができる。
本形態によれば、機械学習により予測される等価反応量の予測精度を向上させることができる。これにより、対象ワークモデル弾性率Ksの予測精度も向上させることができる。
また、上記のようにして予測された対象ワークモデル弾性率Ksを用いて、実施形態1と同様にして設定条件を予測することにより、全体として、設定条件の予測精度を向上させることができる。計算時間を短縮することができる。
(実施形態2-4)
次に、図58~図60を参照して、実施形態2-4について説明する。本形態は、架橋反応の等価反応量に係るシミュレーション結果と、機械学習と、を用いて、対象ワークモデル弾性率Ksを予測する。機械学習においては、架橋反応の等価反応量について複数の統計量を予測する学習済みモデルを生成し、統計量と同数の、架橋反応の等価反応量を用いる。
次に、図58~図60を参照して、実施形態2-4について説明する。本形態は、架橋反応の等価反応量に係るシミュレーション結果と、機械学習と、を用いて、対象ワークモデル弾性率Ksを予測する。機械学習においては、架橋反応の等価反応量について複数の統計量を予測する学習済みモデルを生成し、統計量と同数の、架橋反応の等価反応量を用いる。
図58に、本形態の予測処理のフローチャートの一部を示す。本形態の予測処理(S20)が開始すると、演算処理部9は、訓練データを作成する(S2400)。本形態のS2400の処理は、図51のS2200と同じなので、重複する説明を省略する。
次に、演算処理部9は、第5学習済みモデルを生成し(S2401)、第7学習済みモデルを生成し(S2402)、第8学習済みモデルを生成する(S24203)。S2401の処理は、図54のS2231と同じなので重複する説明を省略する。ただし、第8学習済みモデルは、後述するS2407の後、S2409の前(S2407とS2409との間)に生成しても良い。
第7学習済みモデルは、設定条件と、対象ワークモデルWMの複数の解析メッシュに対応する各要素の等価反応量の平均値、対象ワークモデルWMの複数の解析メッシュに対応する各要素の等価反応量の最大値、最小値、および標準偏差の少なくとも1つに基づいて、対象ワークモデル弾性率Ksを予測する。
第8学習済みモデルは、学習済みモデルの一例である。演算処理部9は、対象ワークモデルWMの複数の解析メッシュに対応する各要素の等価反応量について、平均値、最大値、最小値および標準偏差の少なくとも1つを予測する。第8学習済みモデルの個数は、等価反応量の平均値、最大値、最小値および標準偏差の少なくとも1つを予測するものの合計である。従って、第8学習済みモデルの個数は、最も少ない場合は1つである。ただし、予測する統計量は上記に限定されず、任意の統計量を予測しうる。
次に、演算処理部9は、等価反応量を予測する(S2404)。これにより、演算処理部9は、設定条件と、第5学習済みモデル、第7学習済みモデル、および第8学習済みモデルに基づいて、対象ワークモデルWMの複数の解析メッシュに対応する各要素について等価反応量を予測する。ただし、第8学習済みモデルを用いた等価反応量は、後述するS2407の後、S2409の前(S2407とS2409との間)に予測しても良い。
次に、演算処理部9は、第5学習済みモデル、第7学習済みモデルおよび第8学習済みモデルについて、決定係数R2を算出する(S2405)。ただし、第8学習済みモデルに係る決定係数R2は、後述するS2407の後、S2409の前(S2407とS2409の間)に予測しても良い。
次に、演算処理部9は、第5学習済みモデルの決定係数R2(第5)が、しきい値THよりも小さいかについて判断する(S2406)。
第5学習済みモデルの決定係数R2(第5)が、しきい値THよりも小さい場合(S2406:Y)、すべての条件についてシミュレーション処理(S2408)が実行される。シミュレーション処理(S2408)の内容は、図48のシミュレーション処理(S10)と同様なので、重複する説明を省略する。これにより、対象ワークモデル弾性率Ksが算出される。以上により、予測処理(S20)が終了する(図59参照)。
一方、第1学習済みモデルのR2が、しきい値THよりも小さくない場合(S2206:N)、演算処理部9は第3学習済みモデルの決定係数R2(第3)が、しきい値よりも小さいかについて判断する(S2207)。
第5学習済みモデルの決定係数R2(第3)が、しきい値THよりも小さい場合(S2407:Y)、すべての条件についてシミュレーション処理(S2408)が実行される。これにより、対象ワークモデル弾性率Ksが算出される。以上により、予測処理(S20)が終了する(図59参照)。
一方、第5学習済みモデルの決定係数R2(第5)が、しきい値THよりも小さくない場合(S2407:N)、図57に示すように、演算処理部9は、第8学習済みモデルの決定係数R2(第8)が、しきい値THよりも小さいかについて判断する(S2409)。
第8学習済みモデルの決定係数R2(第8)が、しきい値THよりも小さくない場合(S2409:N)、演算処理部9は第7学習済みモデルおよび第8学習済みモデルを選択する(S2410)。
次に、演算処理部9は、第8学習済みモデルを用いて、対象ワークモデルWMの複数の解析メッシュに対応する各要素の等価反応量について、平均値、最大値、最小値および標準偏差の少なくとも1つを予測する(S2411)。
次に、演算処理部9は、対象ワークモデル弾性率予測処理を実行する(S2412)。これにより、演算処理部9は、第7学習済みモデルと、設定条件と、対象ワークモデルWMの複数の解析メッシュに対応する各要素の最終反応率について平均値、最大値、最小値および標準偏差の少なくとも1つに基づいて、対象ワークモデル弾性率Ksを予測する。ただし、統計量は上記に限定されず、任意の統計量を予測しうる。以上により、予測処理(S20)が終了する。
一方、第8学習済みモデルの決定係数R2(第8)が、しきい値THよりも小さい場合(S2409:Y)、図58に示すように、演算処理部9は第5学習済みモデルを選択する(S2413)。
次に、演算処理部9は、対象ワークモデルWMの複数の解析メッシュに対応するすべての要素について等価反応量を算出する(S2414)。
次に、演算処理部9は、対象ワークモデルWMの複数の解析メッシュに対応するすべての要素についての統計量を算出する(S2415)。
次に、演算処理部9は、S2415で算出した最終反応率の統計量の予測値と、解析値と、に基づいて決定係数R2(統計)を算出する(S2416)。
次に、演算処理部9は、決定係数R2(統計)が、しきい値THより小さいかについて判断する(S2417)。
決定係数R2(統計)が、しきい値THよりも小さい場合(S2417:Y)、すべての条件についてシミュレーション処理(S2420)が実行される。これにより、対象ワークモデル弾性率Ksが算出される。以上により、予測処理(S20)が終了する(図57参照)。
一方、決定係数R2(統計)が、しきい値THよりも小さくない場合(S2417:N)、演算処理部9は、第7学習済みモデルを選択する(S2418)。
次に、演算処理部9は、第7学習済みモデルと、S2415で算出された統計量と、を用いて、対象ワークモデル弾性率Ksを予測する(S2419)。以上により、予測処理(S20)が終了する(図59参照)。
本形態によれば、最少で1つの第8学習済みモデルを用いるので、対象ワークモデル弾性率Ksの計算時間を短縮できる。
(実施形態2-4の変形例)
上記した実施形態2-2の変形例と同様に、図58に記載されたS2401と、S2406を省略し、図60において、S2401、S2404、S2405、およびS2406を実行する構成としても良い。
上記した実施形態2-2の変形例と同様に、図58に記載されたS2401と、S2406を省略し、図60において、S2401、S2404、S2405、およびS2406を実行する構成としても良い。
本形態によれば、第5学習済みモデルは、第7学習済みモデルおよび第8学習済みモデルでは精度が十分に高くない場合に、採用される。第5学習済みモデルは、複数の予測モデルを生成するため、モデルを生成するために時間がかかる。このため、本形態によれば、第7学習済みモデルおよび第8学習済みモデルについて十分に精度が高い場合に、第5学習済みモデルの生成を省略できるので、全体として、処理を高速化することができる。
(実施形態3-1)
次に、図61を参照して、実施形態3-1について説明する。本形態は、架橋反応の反応率に係るシミュレーション結果と、機械学習と、を用いて、対象ワークモデルWMの内部気泡の発生を予測する。機械学習においては、対象ワークモデルWMの要素の個数と最大で同数の学習済みモデルを生成し、要素の個数と最大で同数の、架橋反応の反応率を用いる。
次に、図61を参照して、実施形態3-1について説明する。本形態は、架橋反応の反応率に係るシミュレーション結果と、機械学習と、を用いて、対象ワークモデルWMの内部気泡の発生を予測する。機械学習においては、対象ワークモデルWMの要素の個数と最大で同数の学習済みモデルを生成し、要素の個数と最大で同数の、架橋反応の反応率を用いる。
図61に、本形態に係る予測処理のフローチャートを示す。予測処理(S20)が開始すると、演算処理部9は、訓練データを生成する(S250)。本形態のS250の処理は、図49のS210と同じなので、重複する説明を省略する。
次に、演算処理部9は、第9学習済みモデルを生成する(S251)。第9学習済みモデルは、学習済みモデルの一例である。演算処理部9は、対象ワークモデルWMの複数の解析メッシュに対応する各要素について、第9学習済みモデルを生成する。すなわち、対象ワークモデルWMの解析メッシュと最大で同じ個数の第9学習済みモデルが生成される。第9学習済みモデルは、ポリマー部12の架橋反応の設定条件から、ポリマー部12の脱型時反応率を予測する。
次に、予測処理部は、脱型時反応率予測処理を実行する(S252)。これにより、予測処理部は、設定条件と、第9学習済みモデルに基づいて、対象ワークモデルWMの複数の解析メッシュに対応する各要素について脱型時反応率を予測する。
次に、演算処理部9は、S252で算出した脱型時反応率と、解析値と、に基づいて決定係数R2(第9)を算出する(S253)。
次に、演算処理部9は、決定係数R2(第9)が、しきい値THより小さいかについて判断する(S254)。
決定係数R2(第9)が、しきい値THよりも小さい場合(S254:Y)、すべての条件についてシミュレーション処理(S256)が実行される。内部気泡の発生の有無を予測する。以上により、予測処理(S20)が終了する。
一方、決定係数R2(第9)が、しきい値THよりも小さくない場合(S254:N)、演算処理部9は、S252で算出した脱型時反応率に基づいて、対象ワークモデルWMの内部気泡の発生を推定する(S255、内部気泡推定処理)。S255の内容は、図4のS4と同じなので、重複する説明を省略する。以上により、予測処理(S20)が終了する。
本形態によれば、機械学習により対象ワークモデルWMの内部気泡の発生を予測することができる。これにより、対象ワークモデルWMの内部気泡の発生を予測するための解析数を少なくすることができるとともに、計算時間を短縮することができる。
(実施形態3-2)
次に、図62を用いて、実施形態3-2について説明する。本形態は、架橋反応の反応率に係るシミュレーション結果と、機械学習と、を用いて、対象ワークモデルWMの内部気泡の発生を予測する。機械学習においては、架橋反応の反応率について複数の統計量を予測する学習済みモデルを生成し、統計量と同数の、架橋反応の反応率を用いる。ただし、複数の統計量として、脱型時反応量の最小値を用いても良い。
次に、図62を用いて、実施形態3-2について説明する。本形態は、架橋反応の反応率に係るシミュレーション結果と、機械学習と、を用いて、対象ワークモデルWMの内部気泡の発生を予測する。機械学習においては、架橋反応の反応率について複数の統計量を予測する学習済みモデルを生成し、統計量と同数の、架橋反応の反応率を用いる。ただし、複数の統計量として、脱型時反応量の最小値を用いても良い。
図62に、本形態の予測処理のフローチャートを示す。本形態の予測処理(S20)が開始すると、演算処理部9は、訓練データを作成する(S260)。本形態のS260の処理は、図49のS210と同じなので、重複する説明を省略する。
次に、演算処理部9は、第10学習済みモデルを生成する(S261)。第10学習済みモデルは、学習済みモデルの一例である。演算処理部9は、対象ワークモデルWMの複数の解析メッシュに対応する各要素の脱型時反応率について、平均値、最大値、最小値および標準偏差の少なくとも1つを予測する。第10学習済みモデルの個数は、脱型時反応率の平均値、最大値、最小値および標準偏差の少なくとも1つを予測するものの合計である。従って、第10学習済みモデルの個数は、最も少ない場合は1つである。ただし、統計量は上記に限定されず、任意の統計量を予測しうる。
次に、予測処理部は、脱型時反応率予測処理を実行する(S262)。これにより、予測処理部は、設定条件と、第10学習済みモデルに基づいて、対象ワークモデルWMの複数の解析メッシュに対応する各要素について脱型時反応率を予測する。
次に、演算処理部9は、S262で算出した脱型時反応率と、解析値と、に基づいて決定係数R2(第10)を算出する(S253)。
次に、演算処理部9は、決定係数R2(第10)が、しきい値THより小さいかについて判断する(S264)。
決定係数R2(第10)が、しきい値THよりも小さい場合(S264:Y)、すべての条件についてシミュレーション処理(S266)が実行される。これにより、内部気泡の発生を予測する。以上により、予測処理(S20)が終了する。
一方、決定係数R2(第10)が、しきい値THよりも小さくない場合(S264:N)、演算処理部9は、S262で算出した脱型時反応率に基づいて、対象ワークモデルWMの内部気泡の発生を推定する(S265、内部気泡推定処理)。S265の内容は、図4のS4と同じなので、重複する説明を省略する。以上により、予測処理(S20)が終了する。
本形態によれば、最少で2つ、最多で4つの第10学習済みモデルを用いるので、対象ワークモデルWMの内部気泡の発生を予測するための計算時間を短縮できる。
(実施形態3-3)
次に、図63を参照して、実施形態3-3について説明する。本形態は、架橋反応の等価反応量に係るシミュレーション結果と、機械学習と、を用いて、対象ワークモデルWMの内部気泡の発生を予測する。機械学習においては、対象ワークモデルWMの要素の個数と同数の学習済みモデルを生成し、要素の個数と最大で同数の、等価反応量を用いる。
次に、図63を参照して、実施形態3-3について説明する。本形態は、架橋反応の等価反応量に係るシミュレーション結果と、機械学習と、を用いて、対象ワークモデルWMの内部気泡の発生を予測する。機械学習においては、対象ワークモデルWMの要素の個数と同数の学習済みモデルを生成し、要素の個数と最大で同数の、等価反応量を用いる。
本形態に係る予測処理(S20)が開始すると、演算処理部9は、訓練データを生成する(S270)。本形態のS270の処理は、図51のS2200と同じなので、重複する説明を省略する。
次に、演算処理部9は、第11学習済みモデルを生成する(S271)。第11学習済みモデルは、学習済みモデルの一例である。演算処理部9は、対象ワークモデルWMの複数の解析メッシュに対応する各要素について、第11学習済みモデルを生成する。すなわち、対象ワークモデルWMの解析メッシュと同じ個数の第11学習済みモデルが生成される。第11学習済みモデルは、ポリマー部12の架橋反応の設定条件から、ポリマー部12の脱型時等価反応量を予測する。
次に、演算処理部9は、等価反応量予測処理を実行する(S272)。これにより、予測処理部は、設定条件と、第11学習済みモデルに基づいて、対象ワークモデルWMの複数の解析メッシュに対応する各要素について脱型時等価反応量を予測する。
次に、演算処理部9は、S272で算出した脱型時等価反応量と、解析値と、に基づいて決定係数R2(第11)を算出する(S273)。
次に、演算処理部9は、決定係数R2(第11)が、しきい値THより小さいかについて判断する(S274)。
決定係数R2(第11)が、しきい値THよりも小さい場合(S274:Y)、すべての条件についてシミュレーション処理(S276)が実行される。これにより、対象ワークモデル弾性率Ksが算出される。以上により、予測処理(S20)が終了する。
一方、決定係数R2(第11)が、しきい値THよりも小さくない場合(S274:N)、演算処理部9は、S272で算出した脱型時等価反応量に基づいて、対象ワークモデルWMの内部気泡の発生を推定する(S275、内部気泡推定処理)。S275の内容は、図4のS4と同じなので、重複する説明を省略する。以上により、予測処理(S20)が終了する。
本形態によれば、機械学習により予測される等価反応量の予測精度を向上させることができる。これにより、対象ワークモデルWMの内部気泡の発生についての予測精度も向上させることができる。
(実施形態3-4)
次に、図64を参照して、実施形態3-4について説明する。本形態は、架橋反応の等価反応量に係るシミュレーション結果と、機械学習と、を用いて、対象ワークモデルWMの内部気泡の発生を予測する。機械学習においては、架橋反応の脱型時等価反応量について複数の統計量を予測する学習済みモデルを生成し、統計量と同数の、架橋反応の等価反応量を用いる。ただし、複数の統計量として、脱型時反応量の最小値を用いても良い。
次に、図64を参照して、実施形態3-4について説明する。本形態は、架橋反応の等価反応量に係るシミュレーション結果と、機械学習と、を用いて、対象ワークモデルWMの内部気泡の発生を予測する。機械学習においては、架橋反応の脱型時等価反応量について複数の統計量を予測する学習済みモデルを生成し、統計量と同数の、架橋反応の等価反応量を用いる。ただし、複数の統計量として、脱型時反応量の最小値を用いても良い。
図64に、本形態の予測処理のフローチャートを示す。本形態の予測処理(S20)が開始すると、演算処理部9は、訓練データを作成する(S280)。本形態のS280の処理は、図51のS2200と同じなので、重複する説明を省略する。
次に、演算処理部9は、第12学習済みモデルを生成する(S281)。第12学習済みモデルは、学習済みモデルの一例である。演算処理部9は、対象ワークモデルWMの複数の解析メッシュに対応する各要素の等価反応量について、平均値、最大値、最小値および標準偏差の少なくとも1つを予測する。第12学習済みモデルの個数は、等価反応量の平均値、最大値、最小値および標準偏差の少なくとも1つを予測するものの合計である。従って、第12学習済みモデルの個数は、最も少ない場合は1つである。ただし、統計量は上記に限定されず、任意の統計量を予測しうる。
次に、演算処理部9は、等価反応量予測処理を実行する(S282)。これにより、予測処理部は、設定条件と、第12学習済みモデルに基づいて、対象ワークモデルWMの複数の解析メッシュに対応する各要素について脱型時等価反応量を予測する。
次に、演算処理部9は、S282で算出した脱型時等価反応量と、解析値と、に基づいて決定係数R2(第12)を算出する(S283)。
次に、演算処理部9は、決定係数R2(第12)が、しきい値THより小さいかについて判断する(S284)。
決定係数R2(第12)が、しきい値THよりも小さい場合(S284:Y)、すべての条件についてシミュレーション処理(S286)が実行される。これにより、対象ワークモデル弾性率Ksが算出される。以上により、予測処理(S20)が終了する。
一方、決定係数R2(第12)が、しきい値THよりも小さくない場合(S284:N)、演算処理部9は、S282で算出した脱型時等価反応量に基づいて、対象ワークモデルWMの内部気泡の発生を推定する(S285、内部気泡推定処理)。S285の内容は、図4のS4と同じなので、重複する説明を省略する。以上により、予測処理(S20)が終了する。
本形態によれば、最少で2つ、最多で4つの第4学習済みモデルを用いるので、対象ワークモデルWMの内部気泡の発生を計算するための時間を短縮できる。
本開示は上記各実施形態に限定されるものではなく、その要旨を逸脱しない範囲において種々の実施形態に適用することが可能である。
本形態においては、内部気泡推定部6は、トルク算出部61を備える構成としたが、これに限られず、対象ワークモデルWMのポリマー部12の架橋反応の反応率(加硫度)を取得する反応率取得部60と、脱型時における反応率に基づいて、対象ワークモデルWMのポリマー部12における気泡の発生を推定する推定部62と、を備える構成としても良い。この場合、加硫反応の反応解析を行う前に、基準反応曲線RCから、閾値となるトルクにおける加硫度を求め、この加硫度をブローポイント加硫度とすることができる。また、ブローポイント加硫度は、例えば、ブローポイントアナライザや、ブローポイントテスタ等の公知の測定機器を用いて直接計測しても良い。その後、加硫反応の反応解析を行い、反応率取得部60の演算結果(加硫度)と、上記のブローポイント加硫度と、を比較して、内部気泡の発生を推定することができる。例えば、加硫度が、ブローポイント加硫度を超えていない場合に、対象ワークモデルWMのポリマー部12において内部気泡80が発生したと推定する。
例えば、架橋反応シミュレーション装置は、以下の[1]~[36]に示す態様を採りうる。
[1] シミュレーションに用いるデータを記憶する記憶部と、
対象ワークモデルのポリマー部の架橋反応時の伝熱解析を行う伝熱解析部と、
前記伝熱解析の結果を用いて前記ポリマー部の架橋反応の反応率の解析を行う架橋反応解析部と、
を備える架橋反応シミュレーション装置であって、
前記記憶部は、
原料ポリマーを含んで構成される前記ポリマー部を有する前記対象ワークモデルと、
基準反応温度での基準反応時間のときの架橋反応の反応量に対する、対象反応温度での対象反応時間のときの架橋反応の反応量の比を等価反応量として定義し、アレニウスプロットの傾きを表す傾き係数を含んで定義される等価反応量算出モデルと、
前記ポリマー部の架橋反応の進行度に応じて設定された前記傾き係数と、を記憶し、
前記架橋反応解析部は、
前記伝熱解析の結果として、架橋反応における前記対象ワークモデルの前記ポリマー部の各要素について時刻毎の温度を取得する温度取得部と、
取得した前記架橋反応における前記ポリマー部の各要素についての時刻毎の温度、前記等価反応量算出モデル、対象時刻における前記架橋反応の前記進行度に応じた前記傾き係数に基づいて、時刻毎の前記ポリマー部の前記等価反応量を算出し、算出した前記等価反応量に基づいて前記ポリマー部の架橋反応の反応率を算出する反応率算出処理部と、を備える、架橋反応シミュレーション装置。
対象ワークモデルのポリマー部の架橋反応時の伝熱解析を行う伝熱解析部と、
前記伝熱解析の結果を用いて前記ポリマー部の架橋反応の反応率の解析を行う架橋反応解析部と、
を備える架橋反応シミュレーション装置であって、
前記記憶部は、
原料ポリマーを含んで構成される前記ポリマー部を有する前記対象ワークモデルと、
基準反応温度での基準反応時間のときの架橋反応の反応量に対する、対象反応温度での対象反応時間のときの架橋反応の反応量の比を等価反応量として定義し、アレニウスプロットの傾きを表す傾き係数を含んで定義される等価反応量算出モデルと、
前記ポリマー部の架橋反応の進行度に応じて設定された前記傾き係数と、を記憶し、
前記架橋反応解析部は、
前記伝熱解析の結果として、架橋反応における前記対象ワークモデルの前記ポリマー部の各要素について時刻毎の温度を取得する温度取得部と、
取得した前記架橋反応における前記ポリマー部の各要素についての時刻毎の温度、前記等価反応量算出モデル、対象時刻における前記架橋反応の前記進行度に応じた前記傾き係数に基づいて、時刻毎の前記ポリマー部の前記等価反応量を算出し、算出した前記等価反応量に基づいて前記ポリマー部の架橋反応の反応率を算出する反応率算出処理部と、を備える、架橋反応シミュレーション装置。
[2] 前記ポリマー部は、防振性能を発揮するように構成されたゴム部であり、
前記対象ワークモデルは、防振ゴム装置のモデルである、[1]に記載の架橋反応シミュレーション装置。
前記対象ワークモデルは、防振ゴム装置のモデルである、[1]に記載の架橋反応シミュレーション装置。
[3] 前記傾き係数は、架橋反応の反応率がピークに到達するまでの反応進行期と、反応率がピークを越えた反応戻り期とで、異なる値に設定される、[1]または[2]に記載の架橋反応シミュレーション装置。
[4] 前記傾き係数は、前記反応進行期および前記反応戻り期を含む全期間を等間隔に区分して、各区分に応じた値に設定される、[3]に記載の架橋反応シミュレーション装置。
[5] 前記傾き係数は、前記反応率がピークに到達するまでの架橋反応において、架橋反応が進行し始める反応進行初期、反応進行速度が反応進行初期よりも早くなる反応促進期、反応進行速度が反応促進期よりも遅くなる反応進行後期のそれぞれで、異なる値に設定される、[3]に記載の架橋反応シミュレーション装置。
[6] 前記傾き係数は、前記反応進行期より前記反応戻り期の方が小さな値に設定される、[3]に記載の架橋反応シミュレーション装置。
[7] 前記傾き係数は、
前記反応進行期より前記反応戻り期の方が小さな値に設定され、
前記反応進行期は、架橋反応が進行し始める反応進行初期、反応進行速度が反応進行初期よりも早くなる反応促進期、反応進行速度が反応促進期よりも遅くなる反応進行後期に区分され、
前記反応促進期が前記反応進行初期および前記反応進行後期より大きな値に設定される、[3]に記載の架橋反応シミュレーション装置。
前記反応進行期より前記反応戻り期の方が小さな値に設定され、
前記反応進行期は、架橋反応が進行し始める反応進行初期、反応進行速度が反応進行初期よりも早くなる反応促進期、反応進行速度が反応促進期よりも遅くなる反応進行後期に区分され、
前記反応促進期が前記反応進行初期および前記反応進行後期より大きな値に設定される、[3]に記載の架橋反応シミュレーション装置。
[8] 前回時刻の反応率に基づいて、対象時刻で使用する前記傾き係数を決定し、
対象時刻における温度、等価反応量算出モデル、前記傾き係数に基づいて、対象時刻の微小時間における等価反応量増加量を算出し、
前記等価反応量増加量に基づいて、架橋反応開始から対象時刻までの等価反応量積算値を算出し、
架橋反応開始から対象時刻までの前記等価反応量積算値に基づいて、対象時刻における反応率を算出する、[1]または[2]に記載の架橋反応シミュレーション装置。
対象時刻における温度、等価反応量算出モデル、前記傾き係数に基づいて、対象時刻の微小時間における等価反応量増加量を算出し、
前記等価反応量増加量に基づいて、架橋反応開始から対象時刻までの等価反応量積算値を算出し、
架橋反応開始から対象時刻までの前記等価反応量積算値に基づいて、対象時刻における反応率を算出する、[1]または[2]に記載の架橋反応シミュレーション装置。
[9] 前記ポリマー部の架橋反応の反応率と前記傾き係数との対応関係を定義した第一関係データマップを記憶し、
前回時刻の反応率および前記第一関係データマップを用いて、前記傾き係数を決定する、[8]に記載の架橋反応シミュレーション装置。
前回時刻の反応率および前記第一関係データマップを用いて、前記傾き係数を決定する、[8]に記載の架橋反応シミュレーション装置。
[10] 前記ポリマー部の架橋反応の反応率と前記傾き係数との対応関係を定義した第一関数を記憶し、
前回時刻の反応率および前記第一関数を用いて、前記傾き係数を決定する、[8]に記載の架橋反応シミュレーション装置。
前回時刻の反応率および前記第一関数を用いて、前記傾き係数を決定する、[8]に記載の架橋反応シミュレーション装置。
[11] 前記第一関数は、前記ポリマー部の架橋反応の進行度に応じて設定された複数の反応率区分に応じて、異なる関数に設定されている、[10]に記載の架橋反応シミュレーション装置。
[12] 前記等価反応量積算値と対象時刻における反応率との対応関係を定義した第二関係データマップを記憶し、
対象時刻における前記等価反応量積算値および前記第二関係データマップを用いて、対象時刻における反応率を決定する、[8]に記載の架橋反応シミュレーション装置。
対象時刻における前記等価反応量積算値および前記第二関係データマップを用いて、対象時刻における反応率を決定する、[8]に記載の架橋反応シミュレーション装置。
[13] 前記等価反応量積算値と対象時刻における反応量との対応関係を定義した第二関数を記憶し、
対象時刻における前記等価反応量積算値および前記第二関数を用いて、対象時刻における反応率を決定する、[8]に記載の架橋反応シミュレーション装置。
対象時刻における前記等価反応量積算値および前記第二関数を用いて、対象時刻における反応率を決定する、[8]に記載の架橋反応シミュレーション装置。
[14] 前記第二関係データマップは、前記対象ワークモデルの前記ポリマー部に相当する試験対象ポリマー材料を用いて、架橋反応特性試験機により測定された基準反応温度において架橋反応時間と前記試験対象ポリマー材料に発生したトルクとの関係に基づく基準反応曲線より設定されている、[12]に記載の架橋反応シミュレーション装置。
[15] 前記第二関数は、前記対象ワークモデルの前記ポリマー部に相当する試験対象ポリマー材料を用いて、架橋反応特性試験機により測定された基準反応温度において架橋反応時間と前記試験対象ポリマー材料に発生したトルクとの関係に基づく基準反応曲線より設定されている、[13]に記載の架橋反応シミュレーション装置。
[16] 前記第二関数は、前記ポリマー部の架橋反応の進行度に応じて設定された複数の反応率区分に応じて、異なる関数に設定されている、[15]に記載の架橋反応シミュレーション装置。
[17] 架橋反応の反応率は、
架橋反応の反応率がピークに到達するまでの反応進行期において、架橋反応の開始時を0%とし、架橋反応の反応率の増加度を0%~100%までの範囲で定義し、
反応率がピークを越えた反応戻り期において、反応率ピークからの反応率の低下度を100%に加算した値として定義する、[1]または[2]に記載の架橋反応シミュレーション装置。
架橋反応の反応率がピークに到達するまでの反応進行期において、架橋反応の開始時を0%とし、架橋反応の反応率の増加度を0%~100%までの範囲で定義し、
反応率がピークを越えた反応戻り期において、反応率ピークからの反応率の低下度を100%に加算した値として定義する、[1]または[2]に記載の架橋反応シミュレーション装置。
[18] さらに、前記架橋反応解析部の解析結果に基づいて、前記対象反応時間に応じた前記反応率から得られる値を表示する表示部を備える、[1]または[2]に記載の架橋反応シミュレーション装置。
[19] さらに、前記架橋反応解析部により解析された前記ポリマー部の架橋反応の反応率を用いて構造解析を行う構造解析部を備え、
前記構造解析部は、
前記架橋反応解析部の前記反応率算出処理部により算出された前記ポリマー部の各要素における前記反応率を取得する反応率取得部と、
前記ポリマー部において、取得した前記反応率に応じた弾性率を割り当てる弾性率割当部と、
前記ポリマー部に前記弾性率を割り当てた状態で構造解析を行うことにより、前記対象ワークモデルの特性を取得する特性取得部と、を備える、[1]または[2]に記載の架橋反応シミュレーション装置。
前記構造解析部は、
前記架橋反応解析部の前記反応率算出処理部により算出された前記ポリマー部の各要素における前記反応率を取得する反応率取得部と、
前記ポリマー部において、取得した前記反応率に応じた弾性率を割り当てる弾性率割当部と、
前記ポリマー部に前記弾性率を割り当てた状態で構造解析を行うことにより、前記対象ワークモデルの特性を取得する特性取得部と、を備える、[1]または[2]に記載の架橋反応シミュレーション装置。
[20] さらに、前記構造解析の結果に基づいて、前記ポリマー部の架橋反応に用いられる成形型モデルの温度と、架橋反応開始から成形型モデルの脱型までの型内反応時間と、に応じた前記特性を表示する表示部を備える、[19]に記載の架橋反応シミュレーション装置。
[21] 前記対象ワークモデルの前記特性は、前記対象ワークモデルの弾性率である、[19]に記載の架橋反応シミュレーション装置。
[22] 前記記憶部は、さらに、
成形型モデルと、
さらにカーボンブラックを含んで構成される前記ポリマー部を有する前記対象ワークモデルと、
前記原料ポリマーに対する前記カーボンブラックの質量比と前記ポリマー部の熱拡散率との関係を表す熱拡散率特性と、を記憶し、
前記伝熱解析部は、
前記対象ワークモデルにおける前記原料ポリマーに対する前記カーボンブラックの質量比、および、前記成形型モデルの温度条件を入力する条件入力部と、
前記条件入力部により入力された前記質量比と前記記憶部に記憶された前記熱拡散率特性とに基づいて、前記対象ワークモデルの前記ポリマー部の熱拡散率であるポリマー熱拡散率を決定するポリマー熱拡散率決定部と、
前記成形型モデルに前記対象ワークモデルを配置した状態で、前記ポリマー熱拡散率決定部により決定された前記ポリマー熱拡散率および前記記憶部に記憶された前記温度条件を用いて、伝熱解析を行う解析部と、を備える、[1]または[2]に記載の架橋反応シミュレーション装置。
成形型モデルと、
さらにカーボンブラックを含んで構成される前記ポリマー部を有する前記対象ワークモデルと、
前記原料ポリマーに対する前記カーボンブラックの質量比と前記ポリマー部の熱拡散率との関係を表す熱拡散率特性と、を記憶し、
前記伝熱解析部は、
前記対象ワークモデルにおける前記原料ポリマーに対する前記カーボンブラックの質量比、および、前記成形型モデルの温度条件を入力する条件入力部と、
前記条件入力部により入力された前記質量比と前記記憶部に記憶された前記熱拡散率特性とに基づいて、前記対象ワークモデルの前記ポリマー部の熱拡散率であるポリマー熱拡散率を決定するポリマー熱拡散率決定部と、
前記成形型モデルに前記対象ワークモデルを配置した状態で、前記ポリマー熱拡散率決定部により決定された前記ポリマー熱拡散率および前記記憶部に記憶された前記温度条件を用いて、伝熱解析を行う解析部と、を備える、[1]または[2]に記載の架橋反応シミュレーション装置。
[23] 前記熱拡散率特性は、前記原料ポリマーの種類に依存しない関係である、[22]に記載の架橋反応シミュレーション装置。
[24] 前記熱拡散率特性は、複数種の原料ポリマーで、異なるカーボンブラックの質量比で実験した場合の実測値より設定された関係である、[22]に記載の架橋反応シミュレーション装置。
[25] 前記熱拡散率特性は、前記カーボンブラックの質量比に対して線形の関係を有する、[22]に記載の架橋反応シミュレーション装置。
[26] 前記対象ワークモデルは、
前記ポリマー部と、
前記ポリマー部に接合された接合部材と、を備え、
前記記憶部は、さらに、
前記成形型モデルに前記対象ワークモデルを配置した状態で、前記成形型モデルと前記接合部材との間の熱伝達率である接触熱伝達率を記憶し、
前記解析部は、前記成形型モデルに前記対象ワークモデルを配置した状態で、前記ポリマー熱拡散率決定部により決定された前記ポリマー熱拡散率、前記記憶部に記憶された前記温度条件および前記接触熱伝達率を用いて、前記伝熱解析を行う、[22]に記載の架橋反応シミュレーション装置。
前記ポリマー部と、
前記ポリマー部に接合された接合部材と、を備え、
前記記憶部は、さらに、
前記成形型モデルに前記対象ワークモデルを配置した状態で、前記成形型モデルと前記接合部材との間の熱伝達率である接触熱伝達率を記憶し、
前記解析部は、前記成形型モデルに前記対象ワークモデルを配置した状態で、前記ポリマー熱拡散率決定部により決定された前記ポリマー熱拡散率、前記記憶部に記憶された前記温度条件および前記接触熱伝達率を用いて、前記伝熱解析を行う、[22]に記載の架橋反応シミュレーション装置。
[27] 前記条件入力部は、
前記成形型モデルから脱型された前記対象ワークモデルの周囲の気温を含む外気条件が入力されるようになっており、
前記記憶部は、さらに、
空気の熱伝達係数である空気熱伝達係数を記憶し、
前記解析部は、前記対象ワークモデルの前記ポリマー部を前記成形型モデル内にて架橋反応させた後に前記成形型モデルから前記対象ワークモデルを脱型した状態で、前記ポリマー熱拡散率決定部により決定された前記ポリマー熱拡散率、前記記憶部に記憶された前記空気熱伝達係数および前記外気条件を用いて、前記伝熱解析を行う、[22]に記載の架橋反応シミュレーション装置。
前記成形型モデルから脱型された前記対象ワークモデルの周囲の気温を含む外気条件が入力されるようになっており、
前記記憶部は、さらに、
空気の熱伝達係数である空気熱伝達係数を記憶し、
前記解析部は、前記対象ワークモデルの前記ポリマー部を前記成形型モデル内にて架橋反応させた後に前記成形型モデルから前記対象ワークモデルを脱型した状態で、前記ポリマー熱拡散率決定部により決定された前記ポリマー熱拡散率、前記記憶部に記憶された前記空気熱伝達係数および前記外気条件を用いて、前記伝熱解析を行う、[22]に記載の架橋反応シミュレーション装置。
[28] 前記記憶部は、さらに、成形型モデルを記憶し、
さらに、前記対象ワークモデルの前記ポリマー部を前記成形型モデル内にて架橋反応させた後に前記成形型モデルを脱型する架橋反応工程に適用され、前記対象ワークモデルの前記ポリマー部の内部において前記成形型モデルの脱型に伴う気泡の発生を推定する内部気泡推定部を備え、
前記内部気泡推定部は、
前記対象ワークモデルの前記ポリマー部の架橋反応の反応率を取得する反応率取得部と、
脱型時における前記反応率に基づいて、前記対象ワークモデルの前記ポリマー部の内部における気泡の発生を推定する推定部と、
を備える、[1]または[2]に記載の架橋反応シミュレーション装置。
さらに、前記対象ワークモデルの前記ポリマー部を前記成形型モデル内にて架橋反応させた後に前記成形型モデルを脱型する架橋反応工程に適用され、前記対象ワークモデルの前記ポリマー部の内部において前記成形型モデルの脱型に伴う気泡の発生を推定する内部気泡推定部を備え、
前記内部気泡推定部は、
前記対象ワークモデルの前記ポリマー部の架橋反応の反応率を取得する反応率取得部と、
脱型時における前記反応率に基づいて、前記対象ワークモデルの前記ポリマー部の内部における気泡の発生を推定する推定部と、
を備える、[1]または[2]に記載の架橋反応シミュレーション装置。
[29] 前記記憶部は、さらに、
架橋反応開始からの経過時間と、前記対象ワークモデルの前記ポリマー部における架橋反応の進行度に対応する値であって前記ポリマー部に相当する試験対象ポリマー材料を用いて架橋反応特性試験機により測定可能なトルクと、の関係を定義する架橋反応曲線を記憶しており、
前記内部気泡推定部は、さらに、
前記反応率取得部により取得された前記反応率と前記記憶部に記憶された前記架橋反応曲線とに基づいて、取得された前記反応率に対応する前記トルクを算出するトルク算出部を備え、
前記推定部は、
脱型時における前記トルクに基づいて、前記対象ワークモデルの前記ポリマー部の内部における気泡の発生を推定する、[28]に記載の架橋反応シミュレーション装置。
架橋反応開始からの経過時間と、前記対象ワークモデルの前記ポリマー部における架橋反応の進行度に対応する値であって前記ポリマー部に相当する試験対象ポリマー材料を用いて架橋反応特性試験機により測定可能なトルクと、の関係を定義する架橋反応曲線を記憶しており、
前記内部気泡推定部は、さらに、
前記反応率取得部により取得された前記反応率と前記記憶部に記憶された前記架橋反応曲線とに基づいて、取得された前記反応率に対応する前記トルクを算出するトルク算出部を備え、
前記推定部は、
脱型時における前記トルクに基づいて、前記対象ワークモデルの前記ポリマー部の内部における気泡の発生を推定する、[28]に記載の架橋反応シミュレーション装置。
[30] 前記推定部は、脱型時における前記トルクが予め設定された閾値を超えていない場合に前記対象ワークモデルの前記ポリマー部の内部において気泡が発生したと推定する、[29]に記載の架橋反応シミュレーション装置。
[31] 前記閾値は、複数種の原料ポリマーに対して統一した値に設定されている、[30]に記載の架橋反応シミュレーション装置。
[32] 前記閾値は、ポリマー材料のブローポイントにおける架橋反応の反応率よりも大きな反応率に対応する前記トルクである、[30]に記載の架橋反応シミュレーション装置。
[33] 前記反応率取得部は、前記ポリマー部の部位ごとの前記反応率を取得し、
前記トルク算出部は、前記ポリマー部の部位ごとの前記トルクを算出し、
前記推定部は、前記ポリマー部の部位ごとに気泡の発生を推定する、[29]に記載の架橋反応シミュレーション装置。
前記トルク算出部は、前記ポリマー部の部位ごとの前記トルクを算出し、
前記推定部は、前記ポリマー部の部位ごとに気泡の発生を推定する、[29]に記載の架橋反応シミュレーション装置。
[34] さらに、前記内部気泡推定部による推定結果に基づいて、前記成形型モデルの温度と架橋反応開始から前記成形型モデルの脱型までの型内反応時間と応じて、前記気泡の発生の有無を表示する表示部を備える、[29]に記載の架橋反応シミュレーション装置。
[35] 前記表示部は、前記架橋反応解析部による解析結果に基づいて、前記成形型モデルの温度と、架橋反応開始から前記成形型モデルの脱型までの型内反応時間と、に応じた前記反応率から得られる値を、前記気泡の発生の有無に合わせて表示する、[34]に記載の架橋反応シミュレーション装置。
[36] さらに、前記架橋反応解析部により解析された前記反応率を用いて構造解析を行うことにより、前記対象ワークモデルの特性を取得する構造解析部を備え、
前記表示部は、前記構造解析の結果に基づいて、前記成形型モデルの温度と、架橋反応開始から前記成形型モデルの脱型までの型内反応時間と、に応じた前記特性を、前記気泡の発生の有無に合わせて表示する、[34]に記載の架橋反応シミュレーション装置。
前記表示部は、前記構造解析の結果に基づいて、前記成形型モデルの温度と、架橋反応開始から前記成形型モデルの脱型までの型内反応時間と、に応じた前記特性を、前記気泡の発生の有無に合わせて表示する、[34]に記載の架橋反応シミュレーション装置。
Claims (26)
- シミュレーションに用いるデータを記憶する記憶部と、
対象ワークモデルのポリマー部の架橋反応に係る設定条件の解析を行う設定条件解析部と、
を備える架橋反応シミュレーション装置であって、
前記記憶部は、
前記対象ワークモデルの前記ポリマー部を構成する原料ポリマーに関する特性値であるポリマー特性値と、
前記対象ワークモデルの前記ポリマー部の弾性率である対象ワークモデル弾性率と、前記対象ワークモデル弾性率を有する前記対象ワークモデルの前記ポリマー部の架橋反応における設定条件と、前記対象ワークモデル弾性率を有する前記対象ワークモデルの前記ポリマー部の架橋反応における反応時間と、が関係づけられた関係性データと、を記憶し、
前記設定条件解析部は、
前記ポリマー特性値を取得するポリマー特性値取得部と、
前記対象ワークモデル弾性率を取得する対象ワークモデル弾性率取得部と、
前記関係性データを取得する関係性データ取得部と、
前記ポリマー特性値に基づいて、前記関係性データの、前記対象ワークモデル弾性率、前記設定条件、および前記反応時間の関係を補正する補正部と、を備える、架橋反応シミュレーション装置。 - 前記ポリマー特性値は、前記原料ポリマーの弾性に関する特性値を含み、さらに、前記原料ポリマーのスコーチタイムおよびムーニー粘度の少なくとも1つを含む、請求項1に記載の架橋反応シミュレーション装置。
- 前記記憶部は、さらに、成形型モデルを記憶し、
前記対象ワークモデルは、
前記ポリマー部と、
前記ポリマー部に接合された接合部材と、を備え、
前記補正部は、前記ポリマー特性値に基づいて、前記関係性データの、前記対象ワークモデル弾性率と、前記設定条件と、前記反応時間と、前記ポリマー部の型内への注入時の温度、前記接合部材の温度、および、前記ポリマー部に対する追加的な架橋反応の条件の少なくとも1つと、の関係を補正する、請求項1に記載の架橋反応シミュレーション装置。 - さらに、
対象ワークモデルのポリマー部の架橋反応時の伝熱解析を行う伝熱解析部と、
前記伝熱解析の結果を用いて前記ポリマー部の架橋反応の反応率の解析を行う架橋反応解析部と、
前記架橋反応解析部により解析された前記ポリマー部の架橋反応の反応率を用いて構造解析を行う構造解析部と、を備え、
前記記憶部は、さらに、
原料ポリマーを含んで構成される前記ポリマー部を有する前記対象ワークモデルと、
基準反応温度での基準反応時間のときの架橋反応の反応量に対する、対象反応温度での対象反応時間のときの架橋反応の反応量の比を等価反応量として定義し、アレニウスプロットの傾きを表す傾き係数を含んで定義される等価反応量算出モデルと、
前記ポリマー部の架橋反応の進行度に応じて設定された前記傾き係数と、を記憶し、
前記架橋反応解析部は、
前記伝熱解析の結果として、架橋反応における前記対象ワークモデルの前記ポリマー部の各要素について時刻毎の温度を取得する温度取得部と、
取得した前記架橋反応における前記ポリマー部の各要素についての時刻毎の温度、前記等価反応量算出モデル、対象時刻における前記架橋反応の前記進行度に応じた前記傾き係数に基づいて、時刻毎の前記ポリマー部の前記等価反応量を算出し、算出した前記等価反応量に基づいて前記ポリマー部の架橋反応の反応率を算出する反応率算出処理部と、を備え、
前記構造解析部は、
前記架橋反応解析部の前記反応率算出処理部により算出された前記ポリマー部の各要素における前記反応率を取得する反応率取得部と、
前記ポリマー部において、取得した前記反応率に応じた弾性率を割り当てる弾性率割当部と、
前記ポリマー部に前記弾性率を割り当てた状態で構造解析を行うことにより、前記対象ワークモデル弾性率を取得する対象ワークモデル弾性率取得部と、を備える、請求項1に記載の架橋反応シミュレーション装置。 - さらに、
対象ワークモデルのポリマー部の架橋反応時の伝熱解析を行う伝熱解析部と、
前記伝熱解析の結果を用いて前記ポリマー部の架橋反応の反応率の解析を行う架橋反応解析部と、
前記架橋反応解析部により解析された前記ポリマー部の架橋反応の反応率を用いて構造解析を行う構造解析部と、
機械学習を行う演算処理部と、を備え、
前記記憶部は、さらに、
原料ポリマーを含んで構成される前記ポリマー部を有する前記対象ワークモデルと、
基準反応温度での基準反応時間のときの架橋反応の反応量に対する、対象反応温度での対象反応時間のときの架橋反応の反応量の比を等価反応量として定義し、アレニウスプロットの傾きを表す傾き係数を含んで定義される等価反応量算出モデルと、
前記傾き係数と、
前記反応率または前記等価反応量に関するデータから選択された訓練データと、
前記訓練データを用いて機械学習を行うことにより生成された学習済みモデルと、を記憶し、
前記架橋反応解析部は、
前記伝熱解析の結果として、架橋反応における前記対象ワークモデルの前記ポリマー部の各要素について時刻毎の温度を取得する温度取得部と、
取得した前記架橋反応における前記ポリマー部の各要素についての時刻毎の温度、前記等価反応量算出モデル、対象時刻における前記傾き係数に基づいて、時刻毎の前記ポリマー部の前記等価反応量を算出し、算出した前記等価反応量に基づいて前記ポリマー部の架橋反応の反応率を算出する反応率算出処理部と、を備え、
前記構造解析部は、
前記架橋反応解析部の前記反応率算出処理部により算出された前記ポリマー部の各要素における前記反応率を取得する反応率取得部と、
前記ポリマー部において、取得した前記反応率に応じた弾性率を割り当てる弾性率割当部と、
前記ポリマー部に前記弾性率を割り当てた状態で構造解析を行うことにより、前記対象ワークモデル弾性率を取得する対象ワークモデル弾性率取得部と、を備え
前記演算処理部は、
前記訓練データを用いて前記機械学習を行うことにより前記学習済みモデルを生成し、
前記学習済みモデルを用いて目的変数を予測する、請求項1に記載の架橋反応シミュレーション装置。 - 前記傾き係数が、前記ポリマー部の架橋反応の進行度に応じて設定される、請求項5に記載の架橋反応シミュレーション装置。
- 前記演算処理部は、前記ポリマー部の架橋反応の反応率を予測する前記学習済みモデルを生成する、請求項5または6に記載の架橋反応シミュレーション装置。
- 前記演算処理部が、
前記ポリマー部の架橋反応の反応率を予測する反応率予測処理と、
前記対象ワークモデル弾性率を予測する対象ワークモデル弾性率予測処理と、を処理する、請求項7に記載の架橋反応シミュレーション装置。 - 前記反応率予測処理が、前記設定条件から、前記対象ワークモデルの前記ポリマー部の最終反応率を予測し、
前記対象ワークモデル弾性率予測処理が、前記設定条件と、前記最終反応率と、に基づいて、前記対象ワークモデル弾性率を予測する、請求項8に記載の架橋反応シミュレーション装置。 - 前記演算処理部は、前記ポリマー部の前記等価反応量を目的変数として、前記学習済みモデルを生成する、請求項5または6に記載の架橋反応シミュレーション装置。
- 前記演算処理部が、
前記ポリマー部の前記等価反応量を予測する等価反応量予測処理と、
前記対象ワークモデル弾性率を予測する対象ワークモデル弾性率予測処理と、を処理する、請求項10に記載の架橋反応シミュレーション装置。 - 前記等価反応量予測処理が、前記設定条件から前記等価反応量を予測するものであり、
前記対象ワークモデル弾性率予測処理は、前記設定条件と、前記等価反応量と、に基づいて、前記対象ワークモデル弾性率を予測する、請求項11に記載の架橋反応シミュレーション装置。 - 前記等価反応量予測処理が、前記設定条件から、前記ポリマー部の前記要素における前記等価反応量についての統計量を予測するものであり、
前記対象ワークモデル弾性率予測処理は、前記設定条件と、前記要素における前記等価反応量の前記統計量と、に基づいて、前記対象ワークモデル弾性率を予測する、請求項12に記載の架橋反応シミュレーション装置。 - 前記記憶部は、さらに、成形型モデルを記憶し、
さらに、前記対象ワークモデルの前記ポリマー部を前記成形型モデル内にて架橋反応させたのちに前記成形型モデルを脱型する架橋反応工程に適用され、前記対象ワークモデルの前記ポリマー部の内部において前記成形型モデルの脱型に伴う気泡の発生を推定する内部気泡推定部を備え、
前記内部気泡推定部は、
前記対象ワークモデルの前記ポリマー部の架橋反応の反応率を反応率取得部と、
脱型時における前記反応率に基づいて、前記対象ワークモデルの内部における気泡の発生を推定する推定部と、を備え、
前記演算処理部は、前記学習済みモデルを用いて、前記対象ワークモデルの内部における前記気泡の発生を予測する、請求項5または6に記載の架橋反応シミュレーション装置。 - 前記演算処理部は、前記ポリマー部の脱型時の反応率を予測する前記学習済みモデルを生成する、請求項14に記載の架橋反応シミュレーション装置。
- 前記演算処理部が、
前記ポリマー部の脱型時の反応率を予測する反応率予測処理と、
前記対象ワークモデルの内部における前記気泡の発生を推定する内部気泡推定処理と、を処理する、請求項15に記載の架橋反応シミュレーション装置。 - 前記反応率予測処理が、前記設定条件から、前記対象ワークモデルの前記ポリマー部の脱型時の反応率を予測し、
前記内部気泡推定処理が、前記設定条件と、前記脱型時の反応率と、に基づいて、前記対象ワークモデルの内部における前記気泡の発生を推定する、請求項16に記載の架橋反応シミュレーション装置。 - 前記演算処理部は、前記ポリマー部の前記等価反応量を目的変数として、前記学習済みモデルを生成する、請求項14に記載の架橋反応シミュレーション装置。
- 前記演算処理部が、
前記ポリマー部の前記等価反応量を予測する等価反応量予測処理と、
前記対象ワークモデルの内部における前記気泡の発生を推定する内部気泡推定処理と、を処理する、請求項18に記載の架橋反応シミュレーション装置。 - 前記等価反応量予測処理が、前記設定条件から、前記対象ワークモデルの前記ポリマー部の前記等価反応量を予測し、
前記内部気泡推定処理が、前記設定条件と、前記等価反応量と、に基づいて、前記対象ワークモデルの内部における前記気泡の発生を推定する、請求項19に記載の架橋反応シミュレーション装置。 - 前記ポリマー特性値は、前記原料ポリマーを所定の形状に成形した試験片を用いて、所定の治具を用いて、所定の変位速度で、前記試験片を圧縮する方向から前記試験片に荷重を印加し、所定の方法で算出した前記試験片の弾性率である、請求項1に記載の架橋反応シミュレーション装置。
- 前記記憶部は、さらに、成形型モデルを記憶し、
さらに、前記対象ワークモデルの前記ポリマー部を前記成形型モデル内にて架橋反応させたのちに前記成形型モデルを脱型する架橋反応工程に適用され、前記対象ワークモデルの前記ポリマー部の内部において前記成形型モデルの脱型に伴う気泡の発生を推定する内部気泡推定部を備え、
前記内部気泡推定部は、
前記対象ワークモデルの前記ポリマー部の架橋反応の反応率を反応率取得部と、
脱型時における前記反応率に基づいて、前記対象ワークモデルの内部における気泡の発生を推定する推定部と、を備える、請求項1に記載の架橋反応シミュレーション装置。 - 前記ポリマー部は、防振性能を発揮するように構成されたゴム部であり、
前記対象ワークモデルは、防振ゴム装置のモデルである、請求項1に記載された架橋反応シミュレーション装置。 - 対象ワークモデルのポリマー部を成形型モデル内にて架橋反応させた後に前記成形型モデルを脱型する架橋反応工程に適用され、前記対象ワークモデルの前記ポリマー部の内部において前記成形型モデルの脱型に伴う気泡の発生を推定する内部気泡推定装置であって、
架橋反応開始からの経過時間と、前記対象ワークモデルの前記ポリマー部における架橋反応の進行度に対応する値であって前記ポリマー部に相当する試験対象ポリマー材料を用いて架橋反応特性試験機により測定可能なトルクと、の関係を定義する架橋反応曲線を記憶する記憶部と、
前記対象ワークモデルの前記ポリマー部の架橋反応の反応率を取得する反応率取得部と、
脱型時における前記反応率、または、基準反応温度での基準反応時間のときの架橋反応の反応量に対する、対象反応温度での対象反応時間のときの架橋反応の反応量の比として定義される等価反応量に基づいて、前記対象ワークモデルの前記ポリマー部の内部における気泡の発生を推定する推定部と、
機械学習を行う演算処理部と、を備え、
前記記憶部は、さらに、
前記反応率に関するデータ、または、前記等価反応量に関するデータから選択された学習用の訓練データと、
前記訓練データを用いて機械学習を行うことにより生成された学習済みモデルと、を記憶し、
前記演算処理部は、
前記訓練データを用いて前記機械学習を行うことにより前記学習済みモデルを生成し、
前記学習済みモデルを用いて、前記反応率または前記等価反応量を予測し、前記反応率または前記等価反応量に基づいて前記対象ワークモデルの前記ポリマー部の内部における気泡の発生を推定する、内部気泡推定装置。 - シミュレーションに用いるデータを記憶する記憶部と、
対象ワークモデルのポリマー部の架橋反応時の伝熱解析を行う伝熱解析部と、
前記伝熱解析の結果を用いて前記ポリマー部の架橋反応の反応率の解析を行う架橋反応解析部と、
機械学習を行う演算処理部と、を備える架橋反応シミュレーション装置であって、
前記記憶部は、
原料ポリマーを含んで構成される前記ポリマー部を有する前記対象ワークモデルと、
基準反応温度での基準反応時間のときの架橋反応の反応量に対する、対象反応温度での対象反応時間のときの架橋反応の反応量の比を等価反応量として定義し、アレニウスプロットの傾きを表す傾き係数を含んで定義される等価反応量算出モデルと、
前記傾き係数と、
前記反応率または前記等価反応量に関するデータから選択された訓練データと、
前記訓練データを用いて機械学習を行うことにより生成された学習済みモデルと、を記憶し、
前記架橋反応解析部は、
前記伝熱解析の結果として、架橋反応における前記対象ワークモデルの前記ポリマー部の各要素について時刻毎の温度を取得する温度取得部と、
取得した前記架橋反応における前記ポリマー部の各要素についての時刻毎の温度、前記等価反応量算出モデル、対象時刻における前記傾き係数に基づいて、時刻毎の前記ポリマー部の前記等価反応量を算出し、算出した前記等価反応量に基づいて前記ポリマー部の架橋反応の反応率を算出する反応率算出処理部と、
を備え、
前記演算処理部は、
前記訓練データを用いて前記機械学習を行うことにより前記学習済みモデルを生成し、
前記学習済みモデルを用いて目的変数を予測する、架橋反応シミュレーション装置。 - 前記傾き係数が、前記ポリマー部の架橋反応の進行度に応じて設定される、請求項25に記載の架橋反応シミュレーション装置。
Applications Claiming Priority (4)
| Application Number | Priority Date | Filing Date | Title |
|---|---|---|---|
| JP2023105451 | 2023-06-27 | ||
| JP2023-105451 | 2023-06-27 | ||
| JP2024028843A JP2025005374A (ja) | 2023-06-27 | 2024-02-28 | 架橋反応シミュレーション装置 |
| JP2024-028843 | 2024-02-28 |
Publications (1)
| Publication Number | Publication Date |
|---|---|
| WO2025004975A1 true WO2025004975A1 (ja) | 2025-01-02 |
Family
ID=93938514
Family Applications (1)
| Application Number | Title | Priority Date | Filing Date |
|---|---|---|---|
| PCT/JP2024/022487 Ceased WO2025004975A1 (ja) | 2023-06-27 | 2024-06-21 | 架橋反応シミュレーション装置、および内部気泡推定装置 |
Country Status (1)
| Country | Link |
|---|---|
| WO (1) | WO2025004975A1 (ja) |
Citations (4)
| Publication number | Priority date | Publication date | Assignee | Title |
|---|---|---|---|---|
| US4551807A (en) * | 1983-08-17 | 1985-11-05 | Lord Corporation | Cure-control method for thermosetting polymeric material |
| JPH08323775A (ja) * | 1995-03-20 | 1996-12-10 | Pirelli Coordinamento Pneumatici Spa | ゴム化合物の加硫を最適化する加硫定数のデータベースを形成する方法及び加硫装置 |
| JP2007203591A (ja) * | 2006-02-01 | 2007-08-16 | Bridgestone Corp | 積層ゴムの加硫後物性シミュレーション方法 |
| JP2012176529A (ja) * | 2011-02-25 | 2012-09-13 | Bridgestone Corp | 積層ゴムの加硫後物性シミュレーション方法 |
-
2024
- 2024-06-21 WO PCT/JP2024/022487 patent/WO2025004975A1/ja not_active Ceased
Patent Citations (4)
| Publication number | Priority date | Publication date | Assignee | Title |
|---|---|---|---|---|
| US4551807A (en) * | 1983-08-17 | 1985-11-05 | Lord Corporation | Cure-control method for thermosetting polymeric material |
| JPH08323775A (ja) * | 1995-03-20 | 1996-12-10 | Pirelli Coordinamento Pneumatici Spa | ゴム化合物の加硫を最適化する加硫定数のデータベースを形成する方法及び加硫装置 |
| JP2007203591A (ja) * | 2006-02-01 | 2007-08-16 | Bridgestone Corp | 積層ゴムの加硫後物性シミュレーション方法 |
| JP2012176529A (ja) * | 2011-02-25 | 2012-09-13 | Bridgestone Corp | 積層ゴムの加硫後物性シミュレーション方法 |
Similar Documents
| Publication | Publication Date | Title |
|---|---|---|
| JP6953926B2 (ja) | ゴム状弾性体の性能の予測方法 | |
| KR101085174B1 (ko) | 고무 재료의 변형 시뮬레이션 방법 | |
| Ghoreishy | A state-of-the-art review on the mathematical modeling and computer simulation of rubber vulcanization process | |
| Erfanian et al. | A three dimensional simulation of a rubber curing process considering variable order of reaction | |
| JP4931430B2 (ja) | タイヤの温度分布予測方法とタイヤの温度分布予測計算プログラム | |
| JP2005306174A (ja) | タイヤ性能予測方法 | |
| JP6492440B2 (ja) | 特定物質の解析結果の評価方法、特定物質の解析結果の評価用コンピュータプログラム、特定物質の解析方法、特定物質のシミュレーション方法及び特定物質のシミュレーション用コンピュータプログラム | |
| JP2014113707A (ja) | ゴム材料の加硫度予測方法 | |
| KR20190007770A (ko) | 플라스틱 부품의 물성 예측 및 분석 방법 | |
| WO2025004975A1 (ja) | 架橋反応シミュレーション装置、および内部気泡推定装置 | |
| JP2025005374A (ja) | 架橋反応シミュレーション装置 | |
| Ramorino et al. | Injection molding of engineering rubber components: A comparison between experimental results and numerical simulation | |
| Milani et al. | A new simple numerical model based on experimental scorch curve data fitting for the interpretation of sulphur vulcanization | |
| Zhang et al. | Rubber curing process simulation based on parabola model | |
| JP7302113B1 (ja) | 架橋反応シミュレーション装置 | |
| JP3442126B2 (ja) | 熱劣化樹脂の劣化度合予測装置及び材料物性予測装置 | |
| JP7302112B1 (ja) | 架橋反応シミュレーション装置 | |
| JP7320153B1 (ja) | 内部気泡推定装置および架橋反応シミュレーション装置 | |
| WO2024202817A1 (ja) | 架橋反応シミュレーション装置、および内部気泡推定装置 | |
| EP4386611A1 (en) | Method for optimizing a physical parameter of an adhesive | |
| US20250005219A1 (en) | Predictive method based upon machine learning for the development of composites for tire tread compounds | |
| JP2007203591A (ja) | 積層ゴムの加硫後物性シミュレーション方法 | |
| JP2007272416A (ja) | ゴム製品の弾性応答性能の予測方法、設計方法、及び弾性応答性能予測装置 | |
| Fernando et al. | Cure simulation of large rubber components: a comparison of compression and extrusion molding | |
| Li et al. | Numerical simulation for rubber curing process using modified KS model |
Legal Events
| Date | Code | Title | Description |
|---|---|---|---|
| 121 | Ep: the epo has been informed by wipo that ep was designated in this application |
Ref document number: 24831836 Country of ref document: EP Kind code of ref document: A1 |
|
| NENP | Non-entry into the national phase |
Ref country code: DE |