WO2024252748A1 - クロマトグラフ装置及びクロマトグラフ装置用制御プログラム - Google Patents
クロマトグラフ装置及びクロマトグラフ装置用制御プログラム Download PDFInfo
- Publication number
- WO2024252748A1 WO2024252748A1 PCT/JP2024/009181 JP2024009181W WO2024252748A1 WO 2024252748 A1 WO2024252748 A1 WO 2024252748A1 JP 2024009181 W JP2024009181 W JP 2024009181W WO 2024252748 A1 WO2024252748 A1 WO 2024252748A1
- Authority
- WO
- WIPO (PCT)
- Prior art keywords
- time range
- measurement time
- measurement
- processing unit
- estimated
- Prior art date
- Legal status (The legal status is an assumption and is not a legal conclusion. Google has not performed a legal analysis and makes no representation as to the accuracy of the status listed.)
- Ceased
Links
Images


Classifications
-
- G—PHYSICS
- G01—MEASURING; TESTING
- G01N—INVESTIGATING OR ANALYSING MATERIALS BY DETERMINING THEIR CHEMICAL OR PHYSICAL PROPERTIES
- G01N27/00—Investigating or analysing materials by the use of electric, electrochemical, or magnetic means
- G01N27/62—Investigating or analysing materials by the use of electric, electrochemical, or magnetic means by investigating the ionisation of gases, e.g. aerosols; by investigating electric discharges, e.g. emission of cathode
-
- G—PHYSICS
- G01—MEASURING; TESTING
- G01N—INVESTIGATING OR ANALYSING MATERIALS BY DETERMINING THEIR CHEMICAL OR PHYSICAL PROPERTIES
- G01N30/00—Investigating or analysing materials by separation into components using adsorption, absorption or similar phenomena or using ion-exchange, e.g. chromatography or field flow fractionation
- G01N30/02—Column chromatography
- G01N30/86—Signal analysis
Definitions
- the present invention relates to a chromatographic device such as a gas chromatograph (GC) device or a liquid chromatograph (LC) device, and a control program for the chromatographic device for controlling the operation of the chromatographic device.
- a chromatographic device such as a gas chromatograph (GC) device or a liquid chromatograph (LC) device
- a control program for the chromatographic device for controlling the operation of the chromatographic device.
- Chromatography devices such as LC and GC devices are widely used in various fields to identify and quantify compounds in samples.
- a chromatography mass spectrometer that combines a chromatography device and a mass spectrometer
- the compounds contained in a sample are separated and eluted in time by each compound using a column in the chromatography device, and the molecules of each compound are ionized in the mass spectrometer and their mass-to-charge ratio (m/z) is measured.
- Various analytical methods can be used in chromatography mass spectrometers, and one of the analytical methods for quantifying compounds known to be contained in a sample is the SIM (Selected Ion Monitoring) measurement method.
- the time to elute from the column (retention time) differs for each compound, the time to perform the SIM measurement must be set for each compound.
- the measurement time range which is the time range over which the measurement is performed, is set to allow a certain amount of time leeway before and after the retention time of the compound of interest.
- a schedule table listing the analytical conditions for each compound is created in advance, and the actual analysis is performed according to the schedule table.
- an "event" is created for each analytical condition, and each event is labeled with an event number as well as the m/z range to be measured and the measurement time range.
- SIM measurement detection of the target ions is repeatedly performed within the measurement time range of one event to improve measurement accuracy.
- Patent Document 1 describes a method in which a setting screen is displayed on the display of a control computer for a chromatographic mass spectrometer, and the user is allowed to perform an operation to input analysis conditions such as the measurement time range for each event.
- the measurement time range for each compound is set with a margin larger than the time period during which the compound actually elutes, so normally there is no problem with the measurement even if the measurement time range is slightly modified. However, because modification of the measurement time range is left to the user's input, if this modification is not appropriate, part of the time period during which the compound actually elutes may fall outside the measurement time range, making it impossible to measure (quantify) correctly.
- the problem that the present invention aims to solve is to provide a chromatographic device and a control program for a chromatographic device that can tell whether an appropriate measurement time range has been set for each compound.
- the chromatographic device which has been made to solve the above problems, comprises: a measurement time range setting processing unit that sets a measurement time range, which is a time range for performing a measurement to detect a compound contained in a sample to be measured and eluted from a column; a predicted elution time period storage unit that stores information regarding a predicted elution time period, which is a time period during which the compound is predicted to be eluted from the column; and a measurement time range/estimated dissolution time zone display processing unit that displays the measurement time range set by the measurement time range setting processing unit and the estimated dissolution time zone stored in the estimated dissolution time zone storage unit in the same display area.
- the present invention provides a control program for a chromatographic apparatus, comprising: a measurement time range setting processing unit that sets a measurement time range, which is a time range for performing a measurement to detect a compound contained in a sample to be measured and eluted from a column; a predicted elution time period storage unit that stores information regarding a predicted elution time period, which is a time period during which the compound is predicted to be eluted from the column;
- the program operates as a measurement time range/estimated dissolution time zone display processing unit that displays the measurement time range set by the measurement time range setting processing unit and the estimated dissolution time zone stored in the estimated dissolution time zone storage unit in the same display area.
- the chromatographic device and control program for the chromatographic device according to the present invention display the measurement time range set by the measurement time range setting processing unit and the expected elution time zone stored in the expected elution time zone storage unit in the same display area for the compounds contained in the sample to be measured, making it possible to confirm whether an appropriate measurement time range has been set for the compound.
- FIG. 1 is a schematic diagram showing the configuration of a chromatographic mass spectrometer which is one embodiment of a chromatographic apparatus according to the present invention.
- FIG. 13 is a diagram for explaining an example of determining a retention time based on a retention index.
- FIG. 4 shows a setting screen displayed in the chromatography mass spectrometer of the present embodiment.
- 4A and 4B are diagrams showing examples of a measurement time range display line, a predicted elution time period display line, and a retention time display symbol displayed on a setting screen in the chromatographic mass spectrometer of the present embodiment.
- FIG. 13 is a diagram showing an example in which an inappropriate measurement time range is set.
- FIG. 13 is a diagram showing another example in which an inappropriate measurement time range is set.
- 11A and 11B are diagrams for explaining a reason why an inappropriate measurement time range is set.
- 5A and 5B are diagrams for explaining why an appropriate measurement time range can be easily set in the chromatography mass spectrometer of the present embodiment.
- 5A and 5B are diagrams showing an example of an operation for changing the measurement time range in the chromatography mass spectrometer of the present embodiment.
- 10A and 10B are diagrams showing another example of the operation for changing the measurement time range in the chromatography mass spectrometer of the present embodiment.
- the chromatography mass spectrometer 1 of this embodiment has a chromatography section 10, a mass spectrometer section 20, a control and processing section 30, an input section 40 consisting of input devices such as a keyboard and a mouse, and a display section 50 which is a display. Touch panels may be used for the input section 40 and the display section 50.
- the chromatographic section 10 has a sample introduction section 11 and a column 12. Either LC or GC may be used for the chromatographic section 10.
- LC liquid mobile phase
- GC a section that mixes the sample into a carrier gas is used.
- the column 12 receives the sample from the sample introduction section 11 and temporally separates and elutes each sample component contained in the sample.
- the mass analysis section 20 is provided with an ionization section 22, an ion lens 23, a quadrupole mass filter 24, and an ion detector 25 in a vacuum chamber 21.
- the ionization section 22 sequentially introduces each sample component separated in time by the column 12, and ionizes each sample component by a known method.
- the generated ions are focused near the central axis of the flight direction (ion optical axis C) by the ion lens 23, then enter the quadrupole mass filter 24, where they are separated according to their mass-to-charge ratio and detected by the ion detector 25.
- the output signals from the ion detector 25 are sequentially input to the control/processing section 30.
- This mass analysis section 20 can perform a scan measurement in which the mass-to-charge ratio m/z of ions passing through the quadrupole mass filter 24 is scanned over a specified range, and a SIM measurement in which only ions with a specific m/z are allowed to pass through.
- the control/processing unit 30 has a memory unit 31, a setting processing unit 32, a display processing unit 33, and a measurement control unit 34.
- the control/processing unit 30 is embodied by hardware such as a computer's CPU and memory, and software that operates the hardware.
- the memory unit 31 stores a compound table that records various information for each of a plurality of compounds.
- the compounds stored in the compound table include compounds contained in the sample to be measured as well as compounds of standard samples used to calibrate the device.
- Information stored in the compound table includes the name of the compound, the m/z when ionized, the retention index, the expected peak width, etc.
- the compound table may be provided by the manufacturer of the chromatographic mass spectrometer 1, or may be created or edited by the user of the device.
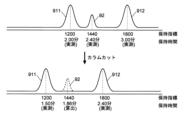
- the retention index here is an index that indicates the relative position of the chromatogram peak of each compound, determined from the retention time under specific measurement conditions, such as the type and flow rate of the carrier gas or mobile phase, and the material and length of the column 12. Of these measurement conditions, the length of the column 12 is changed by performing column cutting. Therefore, after performing column cutting, the retention times of the compounds contained in the standard sample are measured, and the retention times of each compound after column cutting can be determined based on the retention index of the compound in the standard sample, the measured retention time, and the retention index of each compound stored in the compound table. The retention times of each compound determined in this way are also stored in the memory unit 31 for each compound.
- peaks 911 and 912 of two compounds contained in a standard sample and peak 92 of one of the compounds stored in the compound table appear on a chromatogram when column 12 is not cut. From the relative relationship of the retention times of each peak at this time, the retention indices are calculated to be 1200 for peak 911, 1800 for peak 912, and 1440 for peak 92.
- a chromatogram of the standard sample is obtained as shown by the solid line in the lower diagram of Figure 2, and the results obtained are retention times of 1.50 minutes for peak 911 and 2.40 minutes for peak 912.
- the expected peak width is the width of the peak that appears in the chromatogram, and corresponds to the time width over which the compound elutes. Therefore, in order to quantify a specific compound contained in a sample, it is necessary to perform SIM measurements etc. for a time period equal to or longer than the expected peak width of that compound.
- the expected peak width does not change significantly before and after column cut, and since it is sufficient to set it with a margin larger than the actual peak width in order to achieve the goal of accurate quantification, a constant width can be set for each compound regardless of column cut.
- the predicted elution time period which is the time period when each compound is expected to elute from column 12, is calculated from the retention time and expected peak width calculated from the retention index stored in memory unit 31. Therefore, memory unit 31 functionally includes predicted elution time period memory unit 311.
- the memory unit 31 also functionally includes a measurement time range memory unit 312 that stores the measurement time range.
- the setting processing unit 32 performs processing to set various conditions necessary for measurements to be performed in the chromatograph unit 10 and mass spectrometry unit 20.
- the processing performed by the setting processing unit 32 includes processing to set a measurement time range, which is a time range for performing measurements to detect compounds eluted from a column for each of a number of compounds assumed to be contained in the sample to be measured, and to change the measurement time range that has been set. Therefore, the setting processing unit 32 functionally includes a measurement time range setting processing unit 321.
- the set and changed measurement time ranges are stored in the measurement time range storage unit 312.
- the measurement time range is set and changed based on information input by the user of the device by operating the input unit 40.
- the input unit 40 corresponds to a measurement time range change operation unit described later. The operation will be described in detail later.
- the display processing unit 33 performs processing to display a predetermined screen on the display of the display unit 50.
- the display processing unit 33 functionally includes a measurement time range/estimated dissolution time zone display processing unit 331, a warning display processing unit 332, and a measurement time range/estimated dissolution time zone display correction processing unit 333. Details of the screen displayed by the display processing unit 33 will be described later.
- the measurement control unit 34 controls the measurements performed by the chromatograph unit 10 and mass spectrometry unit 20 based on various conditions, including the measurement time range for each compound, set by the setting processing unit 32 or stored in the memory unit 31.
- This setting screen 60 for setting measurement conditions, which is displayed on the display unit 50 by processing by the display processing unit 33, is described.
- This setting screen 60 is broadly divided into a common condition input/display area 61, an event condition input area 62, and an event condition display area 63.
- the common condition input/display area 61 displays an input field for inputting analysis conditions common to each event, and a display field for displaying the set analysis conditions.
- the event condition input area 62 displays a table into which the user inputs the analysis conditions for each event.
- This table includes a table for scan measurement and a table for SIM measurement, and these two tables can be switched by selecting tab 621 with a mouse or the like.
- Figure 3 shows the state in which the table for SIM measurement, which is the main subject of the present invention, is displayed.
- the SIM measurement table has fields for inputting the event number for distinguishing each event, the compound name and its chemical formula, the positive/negative ion ionized by the ionization unit 22, the adduct ion to be added, the m/z of the ion to be detected, the start and end times of the measurement time range, the event time, etc., in characters or numbers.
- the event condition input area 62 shown in FIG. 3 the conditions for the events of event numbers 1 and 3 to 6 are input.
- event number 2 is not displayed in the event condition input area 62 because a scan measurement is performed.
- the measurement time range setting processing unit 321 sets the measurement time range for each compound.
- Event time refers to the time required to perform one measurement of one event. In a time range in which only one event is set, the measurement of that event is repeated multiple times during that time range. On the other hand, in a time range in which multiple events are set, that is, in which the measurement time ranges of multiple events overlap, the operation of performing one measurement for each of those multiple events is treated as a unit, and the operation of that unit is repeated.
- the event condition display area 63 displays the analysis conditions entered in the event condition input area 62 and the analysis conditions that are further set based on those entered analysis conditions for each event as text, numbers, or figures.
- the event count display area 631 which is the left-most area of the event condition display area 63, displays the number of events and sampling rate for each time range.
- the "time range” here is more detailed than the measurement time range for each event, and the time range is determined by the difference between overlapping events.
- the measurement time range for event number 3 is 1,000 to 1,700 minutes, but the "Start-End Time (min)" column in the event count display area 631 displays two time ranges: the time range of 1,000-1,400 minutes where two events, event number 2 (this event is a scan measurement and is performed over the entire time range) and event number 3, overlap, and the time range of 1,400-1,700 minutes where event numbers 2, 3, and event number 4 overlap (a total of three events).
- the number of events indicates the number of events being performed simultaneously in each time range.
- one or two SIM measurements are performed simultaneously with the scan measurement performed over the entire time range as described above, so the number of events in each time range is two or three.
- the sampling rate indicates the number of times the above-mentioned unit operation is performed per unit time, and the more events that overlap in the same time range and the longer the event time, the lower the sampling rate.
- Individual event display area 632 which is the area to the right of event condition display area 63, displays the measurement type (either scan measurement or SIM measurement), event time, scan speed (only for scan measurement), and measurement time for each of events with event numbers 1 to 6, which combine scan measurement and SIM measurement.
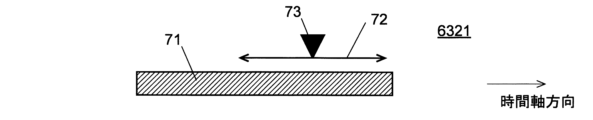
- measurement time display field 6321 which is a field in individual event display area 632 that displays measurement time
- the measurement time range, expected elution time zone, and retention time are displayed in a diagram, as described below.
- FIG. 4 shows the measurement time range display line 71, expected dissolution time zone display line 72, and retention time display symbol 73 shown in the column of event number 1 in the measurement time display field 6321 in FIG. 3.
- the "line” refers to an object having a shape extending in one direction (in this example, the horizontal direction, the time axis direction), and examples include a line, a bar, a band, and a rectangle. In the case of a line or a bar, it is not limited to a solid line (or a bar with a solid line.
- various lines such as a dashed line, a one-dot chain line, a two-dot chain line, and a wavy line can be used.
- a pattern can be added inside the band, rectangle, etc.
- various colors can be added in each example.
- a band is used for the measurement time range display line 71, and a double arrow with arrows on both ends is used for the expected dissolution time zone display line 72.
- the shapes of the measurement time range display line 71 and the expected dissolution time zone display line 72 are not limited to this example, and any two types of shapes can be used in combination as long as the shapes of the two lines are different (that is, as long as they can be distinguished visually).
- an inverted triangle symbol is used for the retention time display symbol 73 in the example shown in Figure 4, symbols of various other shapes may also be used.
- the measurement time range/estimated dissolution time zone display processing unit 331 executes a process of drawing a measurement time range display line 71 in the measurement time display field 6321 so that the start time of the measurement time range is at the left end and the end time is at the right end based on the measurement time range set by the measurement time range setting processing unit 321 through input by the user into the measurement time range input field 622.
- the measurement time range/estimated dissolution time zone display processing unit 331 also executes a process of drawing an expected dissolution time zone display line 72 in the measurement time display field 6321 so that the expected dissolution time zone stored in the expected dissolution time zone storage unit 311 is a zone between both ends of the expected dissolution time zone display line 72 for the corresponding compound.
- the measurement time range/estimated dissolution time zone display processing unit 331 executes a process of drawing a retention time display symbol 73 at a position that matches the retention time stored in the expected dissolution time zone storage unit 311 for the corresponding compound.
- both the measurement time range display line 71 and the expected dissolution time zone display line 72 are displayed in the same measurement time display field 6321. The reason for this will be explained below with reference to Figures 5 to 7 as well as Figure 4.
- the mass spectrometry unit 20 performs measurement (SIM measurement in this embodiment) throughout the entire time zone in which the compound to be measured is expected to elute from the column 12, and the compound can be quantified correctly. Therefore, in this case, it can be said that the measurement time range is set appropriately.
- FIG. 5A and FIG. 5A show that the measurement time range is set appropriately.
- the mass spectrometry unit 20 when a part or the whole of the elution predicted time zone display line 72 is outside the range of the measurement time range display line 71 in the time axis direction, the mass spectrometry unit 20 does not perform measurement during part of the time zone in which the compound to be measured is expected to elute from the column 12, and the compound may not be quantified correctly. Therefore, in this case, it can be said that the measurement time range is set inappropriately.
- the user can determine whether the measurement time range is set appropriately by simply looking at the measurement time range display line 71 and the elution predicted time zone display line 72 displayed in the same measurement time display field 6321 in this way.
- the user has performed an operation to change the measurement time range for some or all of the multiple events to reduce the number of overlapping events in a specific time range.
- the measurement time range of each compound is usually set with a margin larger than the time zone in which the compound actually elutes, so even if the measurement time range is changed slightly, it does not affect the measurement.
- the user can correct the measurement time range display line 71 of the overlapping time period while viewing the measurement time range display line 71 and the expected elution time period display line 72 of each of the multiple events displayed in the measurement time display field 6321, thereby correcting the measurement time range display line 71 while recognizing the expected elution time period for each compound through the expected elution time period display line 72. Therefore, the measurement time range can be corrected so as to reduce the number of overlapping events in a specific time range within a range in which the entire expected elution time period display line 72 is included in the measurement time range display line 71 in the time axis direction.
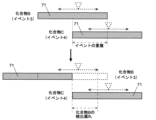
- Figure 7 shows an example of a measurement time range corrected with the device of this embodiment, with the upper figure showing before correction and the lower figure showing after correction.
- the entire expected elution time period display line 72 in the time axis direction is included in the measurement time range display line 71 even after correction.
- the correction even after the correction, there is still a time range where events 3 and 4 overlap, but this overlapping time range is shorter than before the correction, which improves the measurement accuracy.
- the measurement time range display line 71 can be changed by the user inputting the numerical values of the start time and/or end time in the measurement time range input field 622, but it can also be changed by the user changing the position or length of the measurement time range display line 71 on the screen as described below.
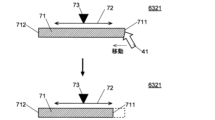
- the mouse of the input unit 40 is operated (in this operation, the input unit 40 functions as a measurement time range change operation unit described later) to drag the mouse pointer 41 on the screen within the measurement time range display line 71 and move the mouse pointer 41 left and right, thereby changing the position of the measurement time range display line 71 in the time axis direction without changing the length of the measurement time range.
- FIG. 8A the mouse of the input unit 40 is operated (in this operation, the input unit 40 functions as a measurement time range change operation unit described later) to drag the mouse pointer 41 on the screen within the measurement time range display line 71 and move the mouse pointer 41 left and right, thereby changing the position of the measurement time range display line 71 in the time axis direction without changing the length
- the measurement time range display line 71 on the screen by dragging either of the ends of the measurement time range display line 71 on the screen (the right end 711 in the example of the figure, but the left end 712 may also be used) with the mouse pointer 41 on the screen and moving the mouse pointer 41 left and right, only the end on the dragged side moves without moving the end on the opposite side to the dragged side.
- This allows the measurement time range to be made longer or shorter (the latter in the example shown in the figure).
- the measurement time range can be freely changed.
- the measurement time range setting processing unit 321 changes the measurement time range for that event according to the time range indicated by the measurement time range display line 71 after the operation. Additionally, when these operations are performed, the numerical value in the measurement time range input field 622 may be changed according to the time range indicated by the measurement time range display line 71 after the operation.
- the warning display processing unit 332 performs processing to display a warning on the screen of the display unit 50.
- the warning can be displayed, for example, by blinking the measurement time range display line 71 for which the measurement time range is set inappropriately, or by displaying it in a color or pattern different from that of an appropriately set range (for example, displaying an appropriate range in black and an inappropriate range in red).
- a warning message may be displayed on the screen.
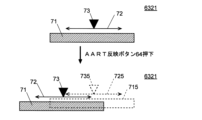
- the setting screen 60 further displays an AART reflection button 64 by the operation of the measurement time range/estimated elution time zone display correction processing unit 333.
- AART Automatic Adjustment of Retention Time
- AART is a function that automatically calculates the retention time of each compound registered in the compound table based on the retention time of the compound contained in the standard sample when a standard sample is measured by performing a predetermined operation after column cutting.
- both the retention time before and the retention time after AART are stored in the memory unit 31 for each compound.
- the measurement time range/estimated elution time zone display correction processing unit 333 automatically corrects the position of the estimated elution time zone display line 72 and the retention time display symbol 73 of each compound (and the length of the estimated elution time zone display line 72 if necessary) to that after AART execution based on the retention time of each compound after AART execution stored in the memory unit 31.
- the measurement time range display line 71 is also corrected to that after AART is performed based on the rate of change in the retention time before and after AART is performed (and, if necessary, the rate of change in the length of the estimated dissolution time zone display line 72).
- the measurement time range display line 715, estimated dissolution time zone display line 725, and retention time display symbol 735 before the correction are superimposed and displayed in a form (different color, pattern, etc.) different from those after the correction (FIG. 9).
- the user may perform a predetermined operation (for example, press a cancel button displayed in the event condition display area 63) to return to the estimated dissolution time zone and retention time before AART is performed.
- the display of the measurement time range display line 71 is automatically corrected, so that the user does not need to correct the measurement time range, making the work easier. Even in this case, the user may manually correct the measurement time range display line 71 after automatic correction, for the purpose of shortening the time overlapping with other events.
- the measurement time range display line 71 may be manually corrected so that the time zones of the automatically corrected expected dissolution time zone display line 72 and retention time display symbol 73 are included. Furthermore, the measurement time range display line 715, expected dissolution time zone display line 725, and retention time display symbol 735 before correction are superimposed, so that the user can easily grasp the changes in the measurement time range before and after column cutting.
- the retention time display symbol 73 is displayed together with the measurement time range display line 71 and the predicted dissolution time zone display line 72, but since the information required to set the measurement time range within the predicted dissolution time zone can be provided as long as the predicted dissolution time zone display line 72 is displayed, the display of the retention time display symbol 73 may be omitted.
- the warning display processing unit 332 in the above embodiment may be omitted.
- the warning instead of providing the warning display processing unit 332 and displaying a warning on the screen, the warning may be issued by a method other than displaying a warning on the screen, such as by issuing a warning message as a voice (sound) or sounding a buzzer, or the issuing of a warning may be omitted.
- the measurement time range/estimated dissolution time zone display correction processing unit 333 in the above embodiment may be omitted. Furthermore, when the measurement time range/estimated dissolution time zone display correction processing unit 333 is provided, the superimposed display of the measurement time range display line 715, the estimated dissolution time zone display line 725, and the retention time display symbol 735 before correction may be omitted.
- a chromatography mass spectrometer has been described as an example, but a configuration having a measurement time range setting processing unit, an expected elution time zone storage unit, and a measurement time range/expected elution time zone display processing unit, etc., similar to that of this embodiment, can also be used for a chromatography device having a detection unit for compounds other than a mass spectrometer.
- a chromatographic apparatus that sets a measurement time range, which is a time range for performing a measurement to detect a compound contained in a sample to be measured and eluted from a column; a predicted elution time period storage unit that stores information regarding a predicted elution time period, which is a time period during which the compound is predicted to be eluted from the column; and a measurement time range/estimated dissolution time zone display processing unit that displays the measurement time range set by the measurement time range setting processing unit and the estimated dissolution time zone stored in the estimated dissolution time zone storage unit in the same display area.
- the chromatographic apparatus according to the 2nd paragraph is the chromatographic apparatus according to the 1st paragraph
- the measurement time range setting processing unit sets the measurement time range for each of a plurality of compounds contained in the sample
- the predicted elution time period storage unit stores information about the predicted elution time period for each of the plurality of compounds
- the measurement time range/estimated dissolution time zone display processing unit displays, for each of the plurality of compounds, the measurement time range set by the measurement time range setting processing unit and the estimated dissolution time zone stored in the estimated dissolution time zone memory unit within the same display area.
- a control program for a chromatographic apparatus includes a chromatographic apparatus, the chromatographic apparatus includes a computer having a storage unit, the computer comprising: a measurement time range setting processing unit that sets a measurement time range, which is a time range for performing a measurement to detect a compound contained in a sample to be measured and eluted from a column; a predicted elution time period storage unit that stores information regarding a predicted elution time period, which is a time period during which the compound is predicted to be eluted from the column;
- the program operates as a measurement time range/estimated dissolution time zone display processing unit that displays the measurement time range set by the measurement time range setting processing unit and the estimated dissolution time zone stored in the estimated dissolution time zone storage unit in the same display area.
- a chromatographic apparatus control program according to Item 9, in the chromatographic apparatus control program according to Item 8, the measurement time range setting processing unit sets the measurement time range for each of a plurality of compounds contained in the sample, the predicted elution time period storage unit stores information about the predicted elution time period for each of the plurality of compounds, The measurement time range/estimated dissolution time zone display processing unit displays, for each of the plurality of compounds, the measurement time range set by the measurement time range setting processing unit and the estimated dissolution time zone stored in the estimated dissolution time zone memory unit within the same display area.
- the measurement time range can be set, for example, by the user of the device inputting the measurement start time and measurement end time using an input device such as a computer keyboard.
- a memory unit that stores the previously set measurement start time and measurement end time for each compound (the memory unit and the above-mentioned predicted elution time period memory unit are functionally different, but in terms of hardware they may be different memory areas within the same storage device) may be provided, and the measurement start time and measurement end time of the corresponding compound may be read from the memory unit to set the measurement time range.
- the predicted elution time zone can be determined by using a database provided by the manufacturer of the chromatograph device or by conducting a preliminary experiment for each compound, and can be stored in the predicted elution time zone storage unit, when a column with a packing material made of a specific material and a specific length is used and a mobile phase made of specific components is flowed at a specific flow rate.
- the predicted elution time zone can be directly stored in the predicted elution time zone storage unit, or information for calculating the predicted elution time zone can be stored and the predicted elution time zone can be calculated from the information.
- the elution time zone of a reference sample (for example, in gas chromatograph mass spectrometers, samples containing multiple types of alkanes with different carbon numbers are often used) can be measured, and the predicted elution time zone of each compound can be corrected (calculated) based on the change from the elution time zone of the reference sample in a new column.
- a reference sample for example, in gas chromatograph mass spectrometers, samples containing multiple types of alkanes with different carbon numbers are often used
- the measurement time range set in the measurement time range setting processing unit and the expected elution time zone stored in the expected elution time zone storage unit are displayed in the same display area for each of one or more compounds contained in the sample to be measured, so that it is possible to check whether an appropriate measurement time zone has been set for each compound.
- the chromatographic device according to clause 3 is the chromatographic device according to clause 1 or 2, in which the measurement time range setting processing unit sets the measurement time range according to an input operation by the user.
- the measurement time range entered by the user may not be appropriate, and so in the past there was a risk that part of the time period during which the compound actually elutes would fall outside the measurement time range, making it impossible to perform accurate quantification.
- the chromatographic device according to paragraph 3 displays the measurement time range and the predicted elution time period in the same display area, making it possible to check whether an appropriate measurement time period has been set for each compound, and therefore making it possible to perform accurate quantification more reliably.
- the chromatographic device according to 4 is the chromatographic device according to 1 to 3, in which the measurement time range/estimated elution time zone display processing unit displays the measurement time range and the estimated elution time zone as linear bodies extending in one direction within the display area as a time axis and having different shapes.
- the form of the linear body includes not only literal "line” display, but also stripe or bar-like shapes with a size (width) in a direction perpendicular to the one direction.
- line In order to display the measurement time range and the predicted dissolution time zone in different linear forms, they can be displayed using different colors, different line types (solid lines, dashed lines, one-dot chain lines, two-dot chain lines, wavy lines, etc.), different widths (in the case of stripes or bars), or a combination of these.
- An arrow may be added to one or both ends of the line (including stripes or bars), and the difference between the display of the measurement time range and the predicted dissolution time zone may be indicated by differences in the shape of the arrow or the presence or absence of an arrow.
- the measurement time range set in the measurement time range setting processing unit and the predicted elution time zone stored in the predicted elution time zone memory unit are represented by a linear body extending in one direction, which is the direction of the time axis, and therefore the measurement time range and the predicted elution time zone can be compared at a glance based on the position and length of the linear body in the time axis direction.
- the measurement time range and the predicted elution time zone are displayed by linear bodies of different shapes, it is possible to distinguish between the measurement time range and the predicted elution time zone.
- the measurement time range and the predicted elution time period may be displayed in a table or the like instead of being displayed by the linear bodies used in the chromatographic device according to paragraph 4.
- the chromatographic device according to claim 5 is the chromatographic device according to claim 4, further comprising a measurement time range change operation unit that changes a position and/or a length in one direction of a linear body indicating the measurement time range by a drag operation by a user;
- the measurement time range setting processing unit changes the measurement time range of a compound for which the position and/or length of a linear body indicating the measurement time range has been changed by the measurement time range change operation unit to a time range corresponding to the changed position and/or length.
- Drag operations in which the user changes the position and/or length of a linear body indicating a measurement time range include, for example, an operation in which the position of the linear body is changed by moving the linear body while clicking it with the mouse, and an operation in which the length of the linear body is changed by moving one end of the linear body while clicking it with the mouse. Even when a linear body indicating a measurement time range is displayed in the display area of a touch panel, the position and length of the linear body can be modified in a manner corresponding to mouse operations.
- the user while viewing the linear body indicating the predicted elution time zone, the user can change the position and/or length in the one direction (time axis direction) of the linear body indicating the measurement time range displayed in the same display area, thereby intuitively and easily changing the measurement time range so that it falls within the predicted elution time zone.
- a chromatographic apparatus is the chromatographic apparatus according to any one of items 1 to 5,
- the predicted elution time period storage unit further stores a retention time for the compound,
- the measurement time range/estimated elution time period display processing section further displays the retention time for the compound in the same display area.
- the retention time is defined as the time when the elution amount peaks within the predicted elution time period.
- the chromatographic device according to paragraph 6 can provide information on retention time together with the predicted elution time period as information for the user to determine whether an appropriate measurement time range has been set for the compound.
- the chromatographic device according to 7 is the chromatographic device according to any one of 1 to 6, further comprising a measurement time range/estimated elution time zone display correction unit that corrects the measurement time range and the estimated elution time zone displayed in the display area based on the measurement results of the retention time of the compound contained in the standard sample.
- the measurement time range and expected elution time zone are automatically corrected based on the measurement results of the retention time of the compounds contained in the standard sample without the user having to input the changed values, making operation easier.
Landscapes
- Chemical & Material Sciences (AREA)
- General Health & Medical Sciences (AREA)
- Life Sciences & Earth Sciences (AREA)
- Health & Medical Sciences (AREA)
- Analytical Chemistry (AREA)
- Biochemistry (AREA)
- Physics & Mathematics (AREA)
- General Physics & Mathematics (AREA)
- Immunology (AREA)
- Pathology (AREA)
- Chemical Kinetics & Catalysis (AREA)
- Electrochemistry (AREA)
- Other Investigation Or Analysis Of Materials By Electrical Means (AREA)
Priority Applications (1)
| Application Number | Priority Date | Filing Date | Title |
|---|---|---|---|
| JP2025525952A JPWO2024252748A1 (enExample) | 2023-06-06 | 2024-03-08 |
Applications Claiming Priority (2)
| Application Number | Priority Date | Filing Date | Title |
|---|---|---|---|
| JP2023-092888 | 2023-06-06 | ||
| JP2023092888 | 2023-06-06 |
Publications (1)
| Publication Number | Publication Date |
|---|---|
| WO2024252748A1 true WO2024252748A1 (ja) | 2024-12-12 |
Family
ID=93795824
Family Applications (1)
| Application Number | Title | Priority Date | Filing Date |
|---|---|---|---|
| PCT/JP2024/009181 Ceased WO2024252748A1 (ja) | 2023-06-06 | 2024-03-08 | クロマトグラフ装置及びクロマトグラフ装置用制御プログラム |
Country Status (2)
| Country | Link |
|---|---|
| JP (1) | JPWO2024252748A1 (enExample) |
| WO (1) | WO2024252748A1 (enExample) |
Citations (6)
| Publication number | Priority date | Publication date | Assignee | Title |
|---|---|---|---|---|
| EP2270491A1 (en) * | 2009-06-30 | 2011-01-05 | Imre Molnar | Method for analyzing the influence of process parameters on the performance of a chromatographic, electro-chromatographic or electrophoretic measurement and its use |
| JP2011141220A (ja) * | 2010-01-08 | 2011-07-21 | Shimadzu Corp | 分析装置制御システム及び該システム用プログラム |
| JP2012132799A (ja) * | 2010-12-22 | 2012-07-12 | Shimadzu Corp | クロマトグラフ質量分析装置 |
| WO2015029101A1 (ja) * | 2013-08-26 | 2015-03-05 | 株式会社島津製作所 | クロマトグラフ質量分析装置 |
| JP2017534060A (ja) * | 2014-11-12 | 2017-11-16 | ジーイー・ヘルスケア・バイオサイエンス・アクチボラグ | 液体クロマトグラフィープロトコルにおける実験パラメータの影響を決定するための方法及びシステム |
| WO2020194955A1 (ja) * | 2019-03-22 | 2020-10-01 | 株式会社島津製作所 | 試料測定装置および測定試料同定方法 |
-
2024
- 2024-03-08 JP JP2025525952A patent/JPWO2024252748A1/ja active Pending
- 2024-03-08 WO PCT/JP2024/009181 patent/WO2024252748A1/ja not_active Ceased
Patent Citations (6)
| Publication number | Priority date | Publication date | Assignee | Title |
|---|---|---|---|---|
| EP2270491A1 (en) * | 2009-06-30 | 2011-01-05 | Imre Molnar | Method for analyzing the influence of process parameters on the performance of a chromatographic, electro-chromatographic or electrophoretic measurement and its use |
| JP2011141220A (ja) * | 2010-01-08 | 2011-07-21 | Shimadzu Corp | 分析装置制御システム及び該システム用プログラム |
| JP2012132799A (ja) * | 2010-12-22 | 2012-07-12 | Shimadzu Corp | クロマトグラフ質量分析装置 |
| WO2015029101A1 (ja) * | 2013-08-26 | 2015-03-05 | 株式会社島津製作所 | クロマトグラフ質量分析装置 |
| JP2017534060A (ja) * | 2014-11-12 | 2017-11-16 | ジーイー・ヘルスケア・バイオサイエンス・アクチボラグ | 液体クロマトグラフィープロトコルにおける実験パラメータの影響を決定するための方法及びシステム |
| WO2020194955A1 (ja) * | 2019-03-22 | 2020-10-01 | 株式会社島津製作所 | 試料測定装置および測定試料同定方法 |
Also Published As
| Publication number | Publication date |
|---|---|
| JPWO2024252748A1 (enExample) | 2024-12-12 |
Similar Documents
| Publication | Publication Date | Title |
|---|---|---|
| JP5821767B2 (ja) | クロマトグラフタンデム四重極型質量分析装置 | |
| JP5811023B2 (ja) | クロマトグラフ質量分析用データ処理装置 | |
| JP6007855B2 (ja) | グラフ表示処理装置 | |
| JP6036304B2 (ja) | クロマトグラフ質量分析用データ処理装置 | |
| JP5365579B2 (ja) | クロマトグラフ質量分析用データ処理装置 | |
| JP5757270B2 (ja) | クロマトグラフ質量分析用データ処理装置 | |
| JP5347932B2 (ja) | クロマトグラフ質量分析装置 | |
| CN101400995B (zh) | 色谱仪质量分析装置 | |
| US9792416B2 (en) | Peak correlation and clustering in fluidic sample separation | |
| WO2018008149A1 (ja) | クロマトグラフ質量分析用データ処理装置 | |
| US11061006B2 (en) | Chromatograph-mass spectrometry system and measurement condition display method | |
| JP6439878B2 (ja) | 分析データ解析装置及び分析データ解析用プログラム | |
| JP5561016B2 (ja) | クロマトグラフ質量分析装置 | |
| JP2009229150A (ja) | クロマトグラフ質量分析装置 | |
| US10203309B2 (en) | Chromatogram display method, chromatogram display device, and chromatograph comprising said device | |
| JP7056767B2 (ja) | クロマトグラフを用いた物質同定方法 | |
| WO2024252748A1 (ja) | クロマトグラフ装置及びクロマトグラフ装置用制御プログラム | |
| WO2020100182A1 (ja) | クロマトグラフ装置 | |
| JP2000171450A (ja) | クロマトグラム処理装置 | |
| JPWO2020255340A1 (ja) | クロマトグラフ質量分析装置 | |
| US6765200B2 (en) | Mass spectrometry and mass spetrometer using the same | |
| CN110546496B (zh) | 试样分析装置 | |
| JP7771876B2 (ja) | 元素分析装置 | |
| US20250329422A1 (en) | Method for quantifying overlapping chemical signals | |
| JP2004028865A (ja) | クロマトグラフ用データ処理装置 |
Legal Events
| Date | Code | Title | Description |
|---|---|---|---|
| 121 | Ep: the epo has been informed by wipo that ep was designated in this application |
Ref document number: 24818987 Country of ref document: EP Kind code of ref document: A1 |
|
| ENP | Entry into the national phase |
Ref document number: 2025525952 Country of ref document: JP Kind code of ref document: A |
|
| NENP | Non-entry into the national phase |
Ref country code: DE |