WO2024218906A1 - 監視制御装置および監視制御システム - Google Patents
監視制御装置および監視制御システム Download PDFInfo
- Publication number
- WO2024218906A1 WO2024218906A1 PCT/JP2023/015628 JP2023015628W WO2024218906A1 WO 2024218906 A1 WO2024218906 A1 WO 2024218906A1 JP 2023015628 W JP2023015628 W JP 2023015628W WO 2024218906 A1 WO2024218906 A1 WO 2024218906A1
- Authority
- WO
- WIPO (PCT)
- Prior art keywords
- monitoring
- abnormality
- occurrence
- items
- causal relationship
- Prior art date
- Legal status (The legal status is an assumption and is not a legal conclusion. Google has not performed a legal analysis and makes no representation as to the accuracy of the status listed.)
- Ceased
Links
Images


Classifications
-
- G—PHYSICS
- G05—CONTROLLING; REGULATING
- G05B—CONTROL OR REGULATING SYSTEMS IN GENERAL; FUNCTIONAL ELEMENTS OF SUCH SYSTEMS; MONITORING OR TESTING ARRANGEMENTS FOR SUCH SYSTEMS OR ELEMENTS
- G05B23/00—Testing or monitoring of control systems or parts thereof
- G05B23/02—Electric testing or monitoring
- G05B23/0205—Electric testing or monitoring by means of a monitoring system capable of detecting and responding to faults
- G05B23/0218—Electric testing or monitoring by means of a monitoring system capable of detecting and responding to faults characterised by the fault detection method dealing with either existing or incipient faults
- G05B23/0224—Process history based detection method, e.g. whereby history implies the availability of large amounts of data
- G05B23/024—Quantitative history assessment, e.g. mathematical relationships between available data; Functions therefor; Principal component analysis [PCA]; Partial least square [PLS]; Statistical classifiers, e.g. Bayesian networks, linear regression or correlation analysis; Neural networks
-
- G—PHYSICS
- G05—CONTROLLING; REGULATING
- G05B—CONTROL OR REGULATING SYSTEMS IN GENERAL; FUNCTIONAL ELEMENTS OF SUCH SYSTEMS; MONITORING OR TESTING ARRANGEMENTS FOR SUCH SYSTEMS OR ELEMENTS
- G05B23/00—Testing or monitoring of control systems or parts thereof
- G05B23/02—Electric testing or monitoring
- G05B23/0205—Electric testing or monitoring by means of a monitoring system capable of detecting and responding to faults
- G05B23/0218—Electric testing or monitoring by means of a monitoring system capable of detecting and responding to faults characterised by the fault detection method dealing with either existing or incipient faults
- G05B23/0243—Electric testing or monitoring by means of a monitoring system capable of detecting and responding to faults characterised by the fault detection method dealing with either existing or incipient faults model based detection method, e.g. first-principles knowledge model
- G05B23/0245—Electric testing or monitoring by means of a monitoring system capable of detecting and responding to faults characterised by the fault detection method dealing with either existing or incipient faults model based detection method, e.g. first-principles knowledge model based on a qualitative model, e.g. rule based; if-then decisions
- G05B23/0248—Causal models, e.g. fault tree; digraphs; qualitative physics
-
- G—PHYSICS
- G05—CONTROLLING; REGULATING
- G05B—CONTROL OR REGULATING SYSTEMS IN GENERAL; FUNCTIONAL ELEMENTS OF SUCH SYSTEMS; MONITORING OR TESTING ARRANGEMENTS FOR SUCH SYSTEMS OR ELEMENTS
- G05B23/00—Testing or monitoring of control systems or parts thereof
- G05B23/02—Electric testing or monitoring
- G05B23/0205—Electric testing or monitoring by means of a monitoring system capable of detecting and responding to faults
- G05B23/0259—Electric testing or monitoring by means of a monitoring system capable of detecting and responding to faults characterized by the response to fault detection
- G05B23/0275—Fault isolation and identification, e.g. classify fault; estimate cause or root of failure
-
- G—PHYSICS
- G06—COMPUTING OR CALCULATING; COUNTING
- G06Q—INFORMATION AND COMMUNICATION TECHNOLOGY [ICT] SPECIALLY ADAPTED FOR ADMINISTRATIVE, COMMERCIAL, FINANCIAL, MANAGERIAL OR SUPERVISORY PURPOSES; SYSTEMS OR METHODS SPECIALLY ADAPTED FOR ADMINISTRATIVE, COMMERCIAL, FINANCIAL, MANAGERIAL OR SUPERVISORY PURPOSES, NOT OTHERWISE PROVIDED FOR
- G06Q10/00—Administration; Management
- G06Q10/06—Resources, workflows, human or project management; Enterprise or organisation planning; Enterprise or organisation modelling
- G06Q10/063—Operations research, analysis or management
-
- G—PHYSICS
- G06—COMPUTING OR CALCULATING; COUNTING
- G06Q—INFORMATION AND COMMUNICATION TECHNOLOGY [ICT] SPECIALLY ADAPTED FOR ADMINISTRATIVE, COMMERCIAL, FINANCIAL, MANAGERIAL OR SUPERVISORY PURPOSES; SYSTEMS OR METHODS SPECIALLY ADAPTED FOR ADMINISTRATIVE, COMMERCIAL, FINANCIAL, MANAGERIAL OR SUPERVISORY PURPOSES, NOT OTHERWISE PROVIDED FOR
- G06Q50/00—Information and communication technology [ICT] specially adapted for implementation of business processes of specific business sectors, e.g. utilities or tourism
- G06Q50/06—Energy or water supply
Definitions
- This disclosure relates to a monitoring and control device, and in particular to a monitoring and control device that monitors plants such as water treatment plants.
- Patent Document 1 discloses a technology that defines possible causal relationships by defining the associations between tags of field devices and other field devices, such as the upstream and downstream positional relationships of piping arranged within a plant, and then uses a Bayesian network to construct a causal relationship model from process data.
- the constructed causal model is converted into a format equivalent to a quality management matrix (QMM) by the analysis section and presented.
- QMM quality management matrix
- the causal relationships are identified by simply defining the association between tags of a field device and another field device, such as the upstream and downstream positional relationship of a pipe, and there is a problem in that the causal relationships that can be identified are limited.
- the present disclosure has been made to solve the problems described above, and aims to provide a monitoring control device that does not limit the causal relationships between identifiable monitoring items and can improve the accuracy of maintenance of monitored objects.
- the monitoring control device is a monitoring control device that monitors multiple monitoring items that are monitoring targets, and includes: an association definition unit that defines associations between the monitoring items in the multiple monitoring items; an association model management database that manages the multiple association models, with the multiple monitoring items defined in the association definition unit as associated models; a monitoring data management database that manages monitoring data for the multiple monitoring items; a causal relationship calculation unit that, when an abnormality is detected in at least one of the multiple monitoring items, calculates which monitoring item of the multiple associated models is causally related to the abnormality based on the multiple associated models managed in the association model management database and the monitoring data managed in the monitoring data management database; and a cause identification unit that identifies the cause of the abnormality based on the monitoring item with the causal relationship calculated by the causal relationship calculation unit, and the causal relationship calculation unit calculates the monitoring item with the causal relationship to the abnormality based on a time series change in the monitoring data before and after the abnormality.
- the monitoring control device calculates, based on multiple related models and monitoring data, which monitoring item of multiple related models the abnormality is causally related to, and identifies the cause of the abnormality based on the monitoring item with which the abnormality is causally related. This means that the causal relationships between the monitoring items that can be identified are not limited, and the accuracy of maintenance of the monitored object can be improved.
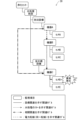
- 1 is a block diagram showing a configuration of a monitoring control device according to the present disclosure
- 1 is a diagram illustrating an example of a monitoring item information management DB of a monitoring control device according to the present disclosure.
- 1 is a diagram illustrating an example of a monitoring data management DB of a monitoring control device according to the present disclosure.
- 1 is a diagram illustrating an example of an association model between monitoring items defined in an inter-monitoring item association definition unit of a monitoring control device according to the present disclosure
- 1 is a diagram illustrating a case where an occurrence of an abnormality is detected in a monitoring control device according to the present disclosure.
- FIG. 1 is a diagram showing a current value and a previous value of a sensor output value in a monitoring data management DB of a monitoring control device according to the present disclosure.
- FIG. 1 is a diagram illustrating an example of calculation of a causal relationship with an occurrence of an abnormality in a monitoring control device according to a first embodiment of the present disclosure.
- FIG. 1 is a diagram showing a time series change in monitoring data before and after the occurrence of an abnormality in a monitoring data management DB of a monitoring control device according to a first embodiment of the present disclosure.
- FIG. 1 is a diagram illustrating identification of a cause of an abnormality in a cause identification unit of a monitoring control device according to a first embodiment of the present disclosure.
- FIG. 1 is a diagram showing a time series change in monitoring data before and after the occurrence of an abnormality in a monitoring data management DB of a monitoring control device according to a first embodiment of the present disclosure.
- FIG. 1 is a diagram showing an example of a display on a display unit of a monitoring control device according to a first embodiment of the present disclosure; 13 is a diagram illustrating an example of calculation of a causal relationship in a causal relationship calculation unit of a monitoring control device according to a second embodiment of the present disclosure.
- FIG. 13 is a diagram showing a time series change in monitoring data before and after the occurrence of an abnormality in a monitoring data management DB of a monitoring control device according to a second embodiment of the present disclosure.
- FIG. 13 is a diagram illustrating an example of calculation of a causal relationship in a causal relationship calculation unit of a monitoring control device according to a third embodiment of the present disclosure.
- 13 is a diagram showing a time series change in monitoring data before and after the occurrence of an abnormality in a monitoring data management DB of a monitoring control device according to a third embodiment of the present disclosure.
- FIG. FIG. 13 is a diagram illustrating an example of calculation of a causal relationship in a causal relationship calculation unit of a monitoring control device according to a fourth embodiment of the present disclosure.
- 13 is a diagram showing a time series change in monitoring data before and after the occurrence of an abnormality in a monitoring data management DB of a monitoring control device according to embodiment 4 of the present disclosure.
- FIG. 13 is a diagram illustrating an example of calculation of a causal relationship in a causal relationship calculation unit of a monitoring control device according to a fifth embodiment of the present disclosure.
- FIG. 23 is a diagram illustrating an example of calculation of a causal relationship in a causal relationship calculation unit of a monitoring control device according to a sixth embodiment of the present disclosure.
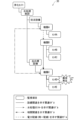
- FIG. 13 is a block diagram showing a configuration of a modified example of a monitoring control device according to the present disclosure.
- FIG. FIG. 2 is a diagram illustrating a hardware configuration for implementing the monitoring and control device according to the first to sixth embodiments of the present disclosure.
- FIG. 2 is a diagram illustrating a hardware configuration for implementing the monitoring and control device according to the first to sixth embodiments of the present disclosure.
- 1 is a block diagram showing a configuration in which a monitoring and control device according to the first to sixth embodiments of the present disclosure is provided in a server computer that constitutes a cloud environment.
- ⁇ First embodiment> 1 is a block diagram showing a configuration of a monitoring control device 100 according to a first embodiment of the present disclosure.
- the monitoring control device 100 includes a monitoring item information management database (DB) 10, a monitoring item relation definition unit 20, a relation model management database (DB) 30, a monitoring data management database (DB) 40, a causal relationship calculation unit 50, a cause identification unit 60, and a display unit 70.
- DB monitoring item information management database
- DB relation model management database
- DB monitoring data management database
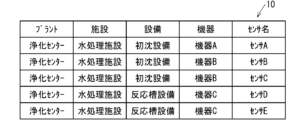
- the monitoring item information management DB10 manages monitoring item information such as facilities, equipment, and sensor information managed by monitoring data.
- Figure 2 is a diagram showing an example of the monitoring item information management DB10 in table format.
- the monitoring items are shown as plants, facilities, equipment, equipment, and sensor names, and the plant is shown as a purification center, the facility is shown as a water treatment facility, the equipment is shown as initial settling equipment and reaction tank equipment, the equipment is shown as equipment A, B, and C, and the sensor names are shown as sensors A to E.
- the monitoring item relationship definition unit 20 defines the relationship between monitoring items.
- the relationship between monitoring items refers to physical relationships such as facility relationships that represent the facility configuration such as facilities, equipment, devices, and sensors, wiring relationships such as power wiring in a power system, and processing flow relationships in water purification plants and sewage treatment plants, as well as correlation relationships such as correlations based on the experience of monitoring experts and correlations derived by statistical analysis.
- System relationships between systems such as a monitoring control system and a facility management system are also included.
- relationships between information from different sensors and data sources for the same object such as a facility, device, or object such as a road, bridge, or tunnel, such as inspection information, point cloud information, water level sensor information, vibration sensor information, camera image information, and weather information, are also included. This makes it possible to expand the relationship between monitoring items.
- defining the relationship between monitoring items means linking the monitoring items together.
- the related model management DB 30 manages the related monitoring items defined in the monitoring item relationship definition section 20 as related models.
- a graph database (DB) is used for this management, and the related models are managed as a tree structure. More specifically, they are managed using a labeled property graph. They can also be managed using an RDB (Relational Database).
- RDB Relational Database
- the monitoring data management DB 40 manages the monitoring data output by monitoring devices such as sensors in chronological order, and the monitoring data is input to the causal relationship calculation unit 50 together with the associated models managed by the associated model management DB 30.
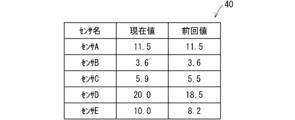
- Figure 3 shows an example of the monitoring data management DB 40 in table format.
- Figure 3 shows the current and previous output values of sensors A to E, respectively.
- the causal relationship calculation unit 50 calculates which monitoring item in which related model the abnormality is causally related to, based on the related model and the time-series changes in the monitoring data before and after the abnormality occurred.
- the cause identification unit 60 identifies the monitoring item that is the cause of the abnormality based on the monitoring items with causal relationships calculated by the causal relationship calculation unit 50.
- the display unit 70 is a display that displays the monitoring items that are causally related to the abnormality identified by the cause identification unit 60 and the cause of the abnormality.
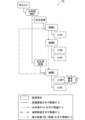
- FIG. 4 shows an example of an association model between monitoring items defined in the monitoring item association definition unit 20, and shows an example of an association model defined based on the monitoring item information management DB 10 shown in FIG. 2.
- FIG 4 multiple monitoring items are laid out in a tree diagram, with the water treatment facility at the purification center plant having initial settling equipment and reaction tank equipment, with the initial settling equipment having equipment A and equipment B, and the reaction tank equipment having equipment C.
- Equipment A has sensor A
- equipment B has sensors B and C
- equipment C has sensors D and E.
- Each monitoring item is surrounded by a frame, and the association model showing equipment relationships is defined by connecting the monitoring items with solid lines.
- the association model showing the water treatment flow is defined by closely spaced dashed arrows pointing from equipment B to equipment C.
- the association model showing the correlation relationship is defined by bidirectional dashed arrows between equipment A and equipment C.
- the association model showing the same power wiring is defined by widely spaced dashed arrows pointing from equipment A to equipment B.
- FIG. 5 shows a schematic diagram of a case in which sensor D detects the occurrence of an abnormality.
- FIG. 6 shows the current and previous values of the output value of sensor D in the monitoring data management DB 40. As shown in FIG. 6, the current output value of sensor D is 20.0, and the previous value is 18.5.
- FIG. 5 shows a schematic diagram of a case where sensor D detects an abnormality
- FIG. 7 shows a schematic diagram of a case where an abnormality may also occur in sensor E.
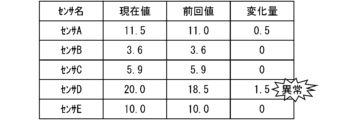
- FIG 8 shows the amount of change calculated from the current and previous output values of sensors A to E in the monitoring data management DB 40 to calculate the time series changes in the monitoring data before and after the abnormality.
- the amount of change from the previous value of the output value of sensor D is 1.5.
- the previous value of the output value of sensor E was 8.2, and the current value is 10.0, so the amount of change from the previous value is 1.8, which is more than the amount of change of sensor D.
- sensor E like sensor D, is causally related to the abnormality.
- the amount of change from the previous value of sensors A to C is all less than 0.5.
- sensors that have time series changes similar to the time series changes of the sensor that detected the abnormality can be calculated as sensors that have a causal relationship with the abnormality.
- causal relationships by calculating time series changes in monitoring data using a statistical method using Euclidean distance.
- Euclidean distance the sensor with the closest point-to-point relationship to the sensor that detected the abnormality is calculated as the sensor that has a causal relationship with the abnormality.
- FIG. 9 shows an example in which sensor E is identified as a sensor that has a causal relationship with the occurrence of an abnormality, similar to sensor D that detected the occurrence of an abnormality, when there is a possibility that an abnormality may also occur in sensor E.
- Figure 10 shows the amount of change calculated from the current and previous output values of sensors A to E in the monitoring data management DB 40 to determine the time series changes in the monitoring data before and after the occurrence of an abnormality.
- the amount of change from the previous value of the output value of sensor D is 1.5
- the amount of change from the previous value of the output value of sensor E is 1.8, both of which are greater than 0.5.
- sensors D and E are sensors related to equipment C, and therefore sensor E, like sensor D, can be identified as having a causal relationship with the abnormality.
- sensors D and E are connected to device C by a common solid line, and an abnormality detected by sensor D is identified as being caused by device C.
- the solid lines connecting sensors D and E to device C are what is called edges in a labeled property graph, and names can be defined for edges.
- the edge in question is labeled as edge 1 as its name, and cause flag 1 as its property (attribute).
- edge 1 is the name that defines "equipment related."
- the cause identification unit 60 is able to determine that sensors D and E are causally related to the occurrence of the abnormality through the detection of the occurrence of the abnormality by sensor D, and is therefore able to determine that device C is the cause of the abnormality. This result is displayed on the display unit 70 and presented to the user of the monitoring and control device 100.
- FIG. 11 An example of the display on the display unit 70 is shown in FIG. 11.
- the detection of an abnormality by sensor D is indicated by a light emission
- sensors D and E are connected to device C by solid lines to indicate that there is a causal relationship with the occurrence of the abnormality
- arrows pointing from sensors D and E to device C indicate that device C is the cause of the abnormality.
- the monitoring control device 100 of embodiment 1 by defining the associations between monitoring items such as devices and sensors that are linked to equipment, which is a unit finer than the components of the equipment, the causal relationship between the monitoring items and the occurrence of an abnormality can be identified, and the equipment that is causing the abnormality can be identified. This makes it possible to reduce the costs spent on plant maintenance compared to a method in which the cause of the abnormality is unknown and all related equipment is replaced.
- sensors that have time series changes similar to the time series changes of the sensor that detected the abnormality can be identified as sensors that are causally related to the abnormality, thereby improving the accuracy of identifying the equipment that is causing the abnormality.
- a monitoring control device 100A according to a second embodiment of the present disclosure will be described. Note that the block diagram showing the configuration of the monitoring control device 100A is the same as that of the monitoring control device 100 according to the first embodiment shown in Fig. 1. In the monitoring control device 100A according to the second embodiment, the processes in the causal relationship calculation unit 50 and the cause identification unit 60 are different from those in the monitoring control device 100.
- FIG. 12 shows a schematic diagram of a case where sensor D detects the occurrence of an abnormality.
- FIG. 13 shows the amount of change calculated as the time series change in the monitoring data before and after the occurrence of an abnormality from the current and previous values of the output values of sensors A to E in the monitoring data management DB 40, and also shows the weights assigned to sensors A to E.
- the causal relationship calculation unit 50 weights the relational model.
- the monitoring items such as device A are nodes in the labeled property graph, and the names of sensors with a high causal relationship can be defined for the nodes.
- sensor A is defined for device A as a sensor that has a causal relationship with device A, and a weight of 1.0 for sensor A is labeled as a property.
- the names of sensors with a high causal relationship are defined for devices B and C, and the weights of the respective sensors are labeled.
- the weight is set as a numerical value by which the current value is multiplied, for example, in the case of a weight of 2.0, the current value is multiplied by 2.0.
- the threshold for the amount of change is 0.5
- the amount of change for sensor D and sensor E exceeds the threshold of 0.5.
- equipment B and equipment C are related models of the water treatment flow and that the cause of the abnormality is also in equipment B, so it is possible to identify that the cause of the abnormality is equipment B and equipment C.
- the equipment causing the abnormality is identified using not only an equipment-related association model defined by the physical connections between the equipment and devices, but also an association model defined by the process flow such as a water treatment flow, so that the cause of the abnormality can be identified even for equipment that is indirectly related. This allows the cause of the abnormality to be identified over a wider range, improving the accuracy of plant maintenance.
- the related model is weighted, making it possible to reliably identify the related model that is highly causally related to the occurrence of an abnormality.
- a monitoring control device 100B according to a third embodiment of the present disclosure will be described. Note that the block diagram showing the configuration of the monitoring control device 100B is the same as that of the monitoring control device 100 according to the first embodiment shown in Fig. 1. In the monitoring control device 100B according to the third embodiment, the processes in the causal relationship calculation unit 50 and the cause identification unit 60 are different from those in the monitoring control device 100.
- FIG. 14 shows a schematic diagram of a case where sensor D detects the occurrence of an abnormality.
- FIG. 15 shows the amount of change calculated as the time series change in the monitoring data before and after the occurrence of an abnormality from the current and previous values of the output values of sensors A to E in the monitoring data management DB 40.
- the amount of change from the previous value of the output value of sensor D is 1.5.
- the previous value of the output value of sensor A was 11.0, and the current value is 11.5, so the amount of change from the previous value is 0.5.
- the amounts of change from the previous values of sensors B, C, and E are 0.
- the threshold for the amount of change is 0.5
- the amounts of change in sensor A and sensor D exceed the threshold of 0.5.
- sensor A is a sensor related to equipment A
- sensor D is a sensor related to equipment C. Since the amount of change in sensor A exceeds the threshold of 0.5, it can be seen that sensor A is causally related to the occurrence of the abnormality. Furthermore, since the amount of change in sensor D exceeds the threshold of 0.5, it can be seen that sensor D is causally related to the occurrence of the abnormality.
- the correlation model showing the correlation relationship shows that device C is correlated with device A, it is possible to identify that the cause of the abnormality detected by sensor D is device A.
- the equipment causing the occurrence of an abnormality is identified using not only an equipment-related association model defined by the physical connections between facilities and devices, but also an association model showing correlation associations, so that the cause of the abnormality can be identified taking into account correlations based on the empirical values of monitoring experts and correlations derived by statistical analysis. Therefore, it is possible to identify causes of abnormalities that cannot be identified using other association models.
- a monitoring control device 100C according to a fourth embodiment of the present disclosure will be described. Note that the block diagram showing the configuration of the monitoring control device 100C is the same as that of the monitoring control device 100 according to the first embodiment shown in Fig. 1. In the monitoring control device 100C according to the fourth embodiment, the processes in the causal relationship calculation unit 50 and the cause identification unit 60 are different from those in the monitoring control device 100.
- FIG. 16 shows a schematic diagram of a case where sensor D detects an abnormality.
- FIG. 17 shows the results of calculating the time series change in the monitoring data before and after the occurrence of an abnormality from the current and previous values of the output values of sensors A to E in the monitoring data management DB 40, as the amount of change.
- the amount of change from the previous value of the output value of sensor D is 1.5.
- the previous value of the output value of sensor A is 11.0, and the current value is 11.5, so the amount of change from the previous value is 0.5.
- the previous value of the output value of sensor B is 3.0, and the current value is 3.6, so the amount of change from the previous value is 0.6.
- the previous value of the output value of sensor C is 5.0, and the current value is 5.9, so the amount of change from the previous value is 0.9.
- the amount of change from the previous value of sensor E is 0.
- the threshold for the amount of change is set to 0.5
- the amounts of change for sensors A, B, C, and D exceed the threshold of 0.5, and so it can be seen that sensors A to D are causally related to the occurrence of the abnormality.
- sensor D is a sensor related to device C
- device C is correlated with device A.
- device A is a device related to device B, so it can be identified that the cause of the abnormality detected by sensor D is device A.
- the equipment causing the abnormality can be identified by combining an equipment-related association model defined by the physical connections between the facilities and devices, an association model showing the correlation, and an association model showing the power wiring. This makes it possible to improve the accuracy of identifying the cause of the abnormality, and therefore improve the accuracy of plant maintenance.
- a monitoring control device 100D according to a fifth embodiment of the present disclosure will be described. Note that the block diagram showing the configuration of the monitoring control device 100D is the same as that of the monitoring control device 100 according to the first embodiment shown in Fig. 1. In the monitoring control device 100D according to the fifth embodiment, the processes in the causal relationship calculation unit 50 and the cause identification unit 60 are different from those in the monitoring control device 100.
- FIG. 18 shows a schematic diagram of a case where sensor D detects an abnormality.
- FIG. 19 shows the result of calculating the time series change in the monitoring data as the amount of change based on the current value, previous value, and value before previous value of the output values of sensors A to E in the monitoring data management DB 40.
- the amount of change is the value calculated at the timing when the time series change occurs, and since the previous value of the output value of sensor C is 5.9, the value before previous is 5.0, and the current value is 5.9, this indicates that the time series change occurred between the previous time and the time before previous.
- the previous value of the output value of sensor D is 18.5, the value before previous is 18.5, and the current value is 20.0, this indicates that the time series change occurred between the present and the previous time.
- sensors C and D are causally related to the occurrence of the abnormality. It can also be determined that a time series change occurred in device B before the time when the abnormality occurred in device C.
- sensor D is a sensor related to device C.
- devices B and C are associated models of the water treatment flow, and since the time series change in the monitoring data of sensor C occurred before the time series change in the monitoring data of sensor D, it can be identified that the cause of the abnormality detected by sensor D is device B.
- an equipment-related association model defined by the physical connections between the facilities and devices and an association model for the water treatment flow are used, and the timing of the time series change in the monitoring data is also taken into consideration to identify the device causing the abnormality. This makes it possible to improve the accuracy of identifying the cause of the abnormality, and to improve the accuracy of plant maintenance.
- a monitoring control device 100E according to a sixth embodiment of the present disclosure will be described. Note that the block diagram showing the configuration of the monitoring control device 100E is the same as that of the monitoring control device 100 according to the first embodiment shown in Fig. 1. In the monitoring control device 100E according to the sixth embodiment, the processes in the causal relationship calculation unit 50 and the cause identification unit 60 are different from those in the monitoring control device 100.
- FIG. 20 shows a schematic diagram of a case where sensor D detects an abnormality.
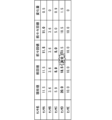
- FIG. 21 shows the result of calculating the time series change of the monitoring data as the amount of change based on the current value, previous value, value before last, and value before last in the output values of sensors A to E in the monitoring data management DB 40.
- the amount of change is the value calculated at the timing when the time series change occurs, and since the current value, previous value, and value before last in the output value of sensor A are all 11.5, and the value before last is 11.0, it is shown that the time series change occurred between the time before last and the time before last.
- the current value and previous value of sensor C are 5.9, and the value before last and value before last are 5.0, it is shown that the time series change occurred between the time before last and the time before last.
- the previous, previous-previous, and previous-previous values of the output value of sensor D are 18.5, and the current value is 20.0, indicating that a time series change is occurring between the present and the previous value.
- sensors C and D are causally related to the occurrence of the abnormality. It can also be determined that there was a time series change in device B before the time when the abnormality occurred in device C, and that there was an even earlier time series change in device A.
- sensor D is a sensor related to device C.
- devices B and C are associated models of the water treatment flow, and from the association model showing the power wiring, it can be seen that device A is a device related to device B.
- a facility-related association model defined by the physical connections between facilities and devices, a water treatment flow association model, and an association model showing power wiring are combined, and the timing of time-series changes in the monitoring data is also taken into consideration to identify the device causing the abnormality. This makes it possible to improve the accuracy of identifying the cause of the abnormality, and to improve the accuracy of plant maintenance.
- correlations between monitoring items defined by the inter-monitoring item relationship definition unit 20 include correlations based on the empirical values of monitoring experts and correlations derived by statistical analysis.
- the empirical values of monitoring experts and statistical values are used as input information, and the correlations can be calculated using machine learning by artificial intelligence (AI), and the calculation results can be input to the inter-monitoring item relationship definition unit 20.
- AI artificial intelligence
- FIG. 22 shows monitoring and control devices 100-100E in which information on the correlation between monitoring items calculated by AI 200 is input to the inter-monitoring item correlation definition unit 20.
- correlations between monitoring items can be defined from vague information such as the experience of an expert monitor, simplifying the processing in the monitoring item correlation definition unit 20.
- Each of the components of the monitoring and control devices 100 to 100E according to the first to sixth embodiments described above can be configured using a computer, and is realized by the computer executing a program. That is, the monitoring and control devices 100 to 100E are realized, for example, by a processing circuit 1000 shown in FIG. 23.
- a processor such as a CPU (Central Processing Unit) or a DSP (Digital Signal Processor) is applied to the processing circuit 1000, and the function of each part is realized by executing a program stored in a storage device.
- CPU Central Processing Unit
- DSP Digital Signal Processor
- dedicated hardware may be applied to the processing circuit 1000.
- the processing circuit 1000 corresponds to, for example, a single circuit, a composite circuit, a programmed processor, a parallel programmed processor, an ASIC (Application Specific Integrated Circuit), an FPGA (Field-Programmable Gate Array), or a combination of these.
- each component can be realized by separate processing circuits, or the functions can be realized together by a single processing circuit.
- FIG. 24 also shows the hardware configuration when the processing circuit 1000 is configured using a processor.
- the functions of each part of the monitoring and control devices 100-100E are realized by a combination of software, etc. (software, firmware, or software and firmware).
- the software, etc. is written as a program and stored in the memory 1002.
- the processor 1001 functioning as the processing circuit 1000 realizes the functions of each part by reading and executing the program stored in the memory 1002 (storage device). In other words, it can be said that this program causes a computer to execute the procedures and methods of operation of the components of the monitoring and control devices 100-100E.
- memory 1002 can be, for example, a non-volatile or volatile semiconductor memory such as RAM, ROM, flash memory, EPROM (Erasable Programmable Read Only Memory), EEPROM (Electrically Erasable Programmable Read Only Memory), etc., a HDD (Hard Disk Drive), a magnetic disk, a flexible disk, an optical disk, a compact disk, a mini disk, a DVD (Digital Versatile Disc) and its drive device, etc., or any storage medium to be used in the future.
- a non-volatile or volatile semiconductor memory such as RAM, ROM, flash memory, EPROM (Erasable Programmable Read Only Memory), EEPROM (Electrically Erasable Programmable Read Only Memory), etc., a HDD (Hard Disk Drive), a magnetic disk, a flexible disk, an optical disk, a compact disk, a mini disk, a DVD (Digital Versatile Disc) and its drive device, etc., or any storage medium to be used in the future.
- each component of the monitoring and control devices 100-100E are realized by either hardware or software, etc.
- this is not limited to the above, and some of the components of the monitoring and control devices 100-100E can be realized by dedicated hardware, and other components can be realized by software, etc.
- the functions of some components can be realized by the processing circuit 1000 as dedicated hardware, and the functions of other components can be realized by the processing circuit 1000 as the processor 1001 reading and executing a program stored in the memory 1002.
- the monitoring and control devices 100 to 100E can realize the above-mentioned functions through hardware, software, etc., or a combination of these.
- the monitoring and control devices 100 to 100E of the above-described embodiments 1 to 6 can be provided within a server computer that constitutes a cloud environment, and monitoring data can be input to a server computer on the cloud via a communication network, causal relationships can be identified in the server computer, and the data can be displayed on a display device connected to the communication network.
- FIG. 25 is a block diagram showing the configuration when the monitoring and control devices 100 to 100E are installed in a server computer 300 that constitutes a cloud environment.
- the server computer 300 has a monitoring item information management DB 10, a monitoring item relation definition unit 20, a relation model management DB 30, a monitoring data management DB 40, a causal relationship calculation unit 50, and a cause identification unit 60. These functions are the same as those of each of the components of the monitoring control devices 100 to 100E.
- Monitoring data detected by multiple sensors SC installed in various locations in the plant is input to a server computer 300 via a communication network, and the server computer 300 identifies causal relationships and displays them on a display device DP connected to the communication network.
- the plant manager uses the causal relationships displayed on the display device DP to maintain and manage the plant.
- the monitoring and control devices 100 to 100E in the server computer 300 that constitutes the cloud environment they can be accessed from anywhere, making them more convenient.
- ⁇ Seventh embodiment> 26 is a block diagram showing a configuration of a monitoring control system 400 according to a seventh embodiment of the present disclosure.
- the monitoring control system 400 includes a monitoring item information management DB 10, a monitoring item relation definition unit 20, a relation model management DB 30, a monitoring data management DB 40, a causal relationship calculation unit 50, a cause identification unit 60, a display unit 70, and a sensor 80.
- the monitoring and control system 400 includes the components of the monitoring and control devices 100 to 100E, as well as multiple sensors 80 installed at various locations in the plant.
Landscapes
- Engineering & Computer Science (AREA)
- Physics & Mathematics (AREA)
- Business, Economics & Management (AREA)
- General Physics & Mathematics (AREA)
- Automation & Control Theory (AREA)
- Economics (AREA)
- Human Resources & Organizations (AREA)
- Strategic Management (AREA)
- Theoretical Computer Science (AREA)
- Entrepreneurship & Innovation (AREA)
- Marketing (AREA)
- Health & Medical Sciences (AREA)
- General Business, Economics & Management (AREA)
- Tourism & Hospitality (AREA)
- Mathematical Physics (AREA)
- Primary Health Care (AREA)
- General Health & Medical Sciences (AREA)
- Water Supply & Treatment (AREA)
- Public Health (AREA)
- Evolutionary Computation (AREA)
- Development Economics (AREA)
- Educational Administration (AREA)
- Artificial Intelligence (AREA)
- Game Theory and Decision Science (AREA)
- Operations Research (AREA)
- Quality & Reliability (AREA)
- Testing And Monitoring For Control Systems (AREA)
Priority Applications (5)
| Application Number | Priority Date | Filing Date | Title |
|---|---|---|---|
| CN202380096506.4A CN120958402A (zh) | 2023-04-19 | 2023-04-19 | 监视控制装置以及监视控制系统 |
| PCT/JP2023/015628 WO2024218906A1 (ja) | 2023-04-19 | 2023-04-19 | 監視制御装置および監視制御システム |
| DE112023005803.2T DE112023005803T5 (de) | 2023-04-19 | 2023-04-19 | Überwachungs-Steuerungseinrichtung und Überwachungs-Steuerungssystem |
| US19/161,329 US20260111020A1 (en) | 2023-04-19 | 2023-04-19 | Monitoring control apparatus |
| JP2025514964A JP7781345B2 (ja) | 2023-04-19 | 2023-04-19 | 監視制御装置 |
Applications Claiming Priority (1)
| Application Number | Priority Date | Filing Date | Title |
|---|---|---|---|
| PCT/JP2023/015628 WO2024218906A1 (ja) | 2023-04-19 | 2023-04-19 | 監視制御装置および監視制御システム |
Publications (1)
| Publication Number | Publication Date |
|---|---|
| WO2024218906A1 true WO2024218906A1 (ja) | 2024-10-24 |
Family
ID=93152458
Family Applications (1)
| Application Number | Title | Priority Date | Filing Date |
|---|---|---|---|
| PCT/JP2023/015628 Ceased WO2024218906A1 (ja) | 2023-04-19 | 2023-04-19 | 監視制御装置および監視制御システム |
Country Status (5)
| Country | Link |
|---|---|
| US (1) | US20260111020A1 (https=) |
| JP (1) | JP7781345B2 (https=) |
| CN (1) | CN120958402A (https=) |
| DE (1) | DE112023005803T5 (https=) |
| WO (1) | WO2024218906A1 (https=) |
Cited By (1)
| Publication number | Priority date | Publication date | Assignee | Title |
|---|---|---|---|---|
| JP7682423B1 (ja) * | 2024-11-13 | 2025-05-23 | 三菱電機株式会社 | データ管理装置及びデータ管理システム |
Citations (3)
| Publication number | Priority date | Publication date | Assignee | Title |
|---|---|---|---|---|
| WO2018073955A1 (ja) * | 2016-10-21 | 2018-04-26 | 日本電気株式会社 | システム分析方法、システム分析装置、および、プログラム |
| JP2020052714A (ja) * | 2018-09-27 | 2020-04-02 | 株式会社日立製作所 | 監視システム及び監視方法 |
| WO2021241576A1 (ja) * | 2020-05-29 | 2021-12-02 | 株式会社ダイセル | 異常変調原因特定装置、異常変調原因特定方法及び異常変調原因特定プログラム |
Family Cites Families (4)
| Publication number | Priority date | Publication date | Assignee | Title |
|---|---|---|---|---|
| JP4882239B2 (ja) * | 2005-02-16 | 2012-02-22 | 東京エレクトロン株式会社 | 半導体製造装置、コンピュータプログラム及び記憶媒体 |
| JP6991833B2 (ja) * | 2017-10-31 | 2022-01-13 | 株式会社日立製作所 | 因果関係モデル構築システムおよび方法 |
| JP7237029B2 (ja) * | 2020-02-12 | 2023-03-10 | 三菱電機株式会社 | 監視制御装置 |
| JP7188470B2 (ja) * | 2021-01-28 | 2022-12-13 | 横河電機株式会社 | 分析方法、分析プログラムおよび情報処理装置 |
-
2023
- 2023-04-19 JP JP2025514964A patent/JP7781345B2/ja active Active
- 2023-04-19 WO PCT/JP2023/015628 patent/WO2024218906A1/ja not_active Ceased
- 2023-04-19 CN CN202380096506.4A patent/CN120958402A/zh active Pending
- 2023-04-19 DE DE112023005803.2T patent/DE112023005803T5/de active Pending
- 2023-04-19 US US19/161,329 patent/US20260111020A1/en active Pending
Patent Citations (3)
| Publication number | Priority date | Publication date | Assignee | Title |
|---|---|---|---|---|
| WO2018073955A1 (ja) * | 2016-10-21 | 2018-04-26 | 日本電気株式会社 | システム分析方法、システム分析装置、および、プログラム |
| JP2020052714A (ja) * | 2018-09-27 | 2020-04-02 | 株式会社日立製作所 | 監視システム及び監視方法 |
| WO2021241576A1 (ja) * | 2020-05-29 | 2021-12-02 | 株式会社ダイセル | 異常変調原因特定装置、異常変調原因特定方法及び異常変調原因特定プログラム |
Cited By (1)
| Publication number | Priority date | Publication date | Assignee | Title |
|---|---|---|---|---|
| JP7682423B1 (ja) * | 2024-11-13 | 2025-05-23 | 三菱電機株式会社 | データ管理装置及びデータ管理システム |
Also Published As
| Publication number | Publication date |
|---|---|
| DE112023005803T5 (de) | 2025-12-11 |
| JP7781345B2 (ja) | 2025-12-05 |
| JPWO2024218906A1 (https=) | 2024-10-24 |
| US20260111020A1 (en) | 2026-04-23 |
| CN120958402A (zh) | 2025-11-14 |
Similar Documents
| Publication | Publication Date | Title |
|---|---|---|
| US9842302B2 (en) | Population-based learning with deep belief networks | |
| CN113590429B (zh) | 一种服务器故障诊断方法、装置及电子设备 | |
| JP6482817B2 (ja) | プラント監視支援システム及びプラント監視支援方法 | |
| US20080316015A1 (en) | System and Method for Suppressing Redundant Alarms | |
| EP3183622B1 (en) | Population-based learning with deep belief networks | |
| JP2013025367A (ja) | 設備状態監視方法およびその装置 | |
| CN110245047A (zh) | 时间序列异常检测方法、装置及设备 | |
| EP3879470B1 (en) | Data management system and data management method | |
| US20250180408A1 (en) | Thermal anomaly management | |
| JP4635194B2 (ja) | 異常検知装置 | |
| JP7391765B2 (ja) | プラント監視支援装置、方法及びプログラム | |
| CN112380073B (zh) | 一种故障位置的检测方法、装置及可读存储介质 | |
| JP6517991B1 (ja) | 異常予兆診断システム、管理装置、及び異常予兆診断方法 | |
| JP7781345B2 (ja) | 監視制御装置 | |
| CN119502355A (zh) | 一种光固化3d打印异常运行的处理方法及系统 | |
| US10318364B2 (en) | Methods and systems for problem-alert aggregation | |
| CN112769615B (zh) | 一种异常分析方法及装置 | |
| JP7215574B2 (ja) | 監視システム、監視方法及びプログラム | |
| Christer | Prototype modelling of irregular condition monitoring of production plant | |
| CN113076216A (zh) | 一种信息科在线故障排除的高效处理方法及系统 | |
| JP7810066B2 (ja) | 設備を保守するための装置、方法、およびプログラム | |
| CN114676021A (zh) | 作业日志监控方法、装置、计算机设备和存储介质 | |
| US9953266B2 (en) | Management of building energy systems through quantification of reliability | |
| JP7815097B2 (ja) | 水道プラント運転支援システムとその方法 | |
| Sudhakar et al. | Implementing an Efficient Alarm Management System Using Cutting-Edge Methods |
Legal Events
| Date | Code | Title | Description |
|---|---|---|---|
| 121 | Ep: the epo has been informed by wipo that ep was designated in this application |
Ref document number: 23934051 Country of ref document: EP Kind code of ref document: A1 |
|
| WWE | Wipo information: entry into national phase |
Ref document number: 2025514964 Country of ref document: JP |
|
| WWE | Wipo information: entry into national phase |
Ref document number: CN2023800965064 Country of ref document: CN |
|
| WWE | Wipo information: entry into national phase |
Ref document number: 112023005803 Country of ref document: DE |
|
| WWP | Wipo information: published in national office |
Ref document number: 112023005803 Country of ref document: DE |
|
| 122 | Ep: pct application non-entry in european phase |
Ref document number: 23934051 Country of ref document: EP Kind code of ref document: A1 |