WO2024190313A1 - 遠心沈降式の測定装置、及び遠心沈降式の測定方法 - Google Patents
遠心沈降式の測定装置、及び遠心沈降式の測定方法 Download PDFInfo
- Publication number
- WO2024190313A1 WO2024190313A1 PCT/JP2024/005978 JP2024005978W WO2024190313A1 WO 2024190313 A1 WO2024190313 A1 WO 2024190313A1 JP 2024005978 W JP2024005978 W JP 2024005978W WO 2024190313 A1 WO2024190313 A1 WO 2024190313A1
- Authority
- WO
- WIPO (PCT)
- Prior art keywords
- light
- light source
- sample
- detector
- cell
- Prior art date
- Legal status (The legal status is an assumption and is not a legal conclusion. Google has not performed a legal analysis and makes no representation as to the accuracy of the status listed.)
- Ceased
Links
Images


Classifications
-
- G—PHYSICS
- G01—MEASURING; TESTING
- G01N—INVESTIGATING OR ANALYSING MATERIALS BY DETERMINING THEIR CHEMICAL OR PHYSICAL PROPERTIES
- G01N15/00—Investigating characteristics of particles; Investigating permeability, pore-volume or surface-area of porous materials
- G01N15/04—Investigating sedimentation of particle suspensions
Definitions
- the present invention relates to a centrifugal sedimentation type measuring device and a centrifugal sedimentation type measuring method.
- the inventors of the present application have investigated a method for analyzing a target substance in a sample containing multiple types of substances using a centrifugal sedimentation type particle size distribution analyzer that utilizes absorptiometry and centrifugation.
- This device can be used to centrifuge the substances in the sample by rotating the cell containing the sample, while shining light on the sample and measuring the absorbance, which makes it possible to analyze a target substance in a sample that contains multiple types of substances.
- the present invention has been made to solve the above-mentioned problems, and aims to use a centrifugal sedimentation-type measuring device to make it possible to analyze a target substance in a sample containing multiple types of substances without the trouble of replacing the light source, while eliminating the need for purification work before analysis.
- the centrifugal sedimentation type measuring device of the present invention is a centrifugal sedimentation type measuring device comprising: a rotating mechanism for rotating a cell containing a sample and sedimenting the sample by centrifugal force; a first light source for irradiating light onto the cell; and a first detector for detecting transmitted light from the first light source that passes through the cell, or secondary light generated when the light from the first light source is irradiated onto the sample, and further comprising: a second light source for irradiating the cell with light having a wavelength different from that of the light from the first light source; and a second detector for detecting transmitted light from the second light source that passes through the cell, or secondary light generated when the light from the second light source is irradiated onto the sample.
- a second light source that irradiates the cell with light of a different wavelength from the light from the first light source, thereby eliminating the need for purification work before analysis and allowing the sample to be irradiated with light of two different wavelengths without the hassle of replacing the light source, thereby making it possible to analyze the target substance in a sample containing multiple types of substances.
- the first light source emits ultraviolet light
- the first detector detects transmitted light that is transmitted through the cell out of the light from the first light source.
- the light emitted from the light source is ultraviolet light, which is suitable for protein analysis, it seems possible to centrifuge the samples to analyze the target protein, even if they contain multiple types of proteins.
- the target substance cannot be analyzed.
- the second light source to emit excitation light having an excitation wavelength corresponding to the sample.
- analytical data corresponding to each protein can be obtained by centrifugation, while the fluorescence of the added fluorescent marker can be used to identify the analytical data corresponding to the target protein, thereby making it possible to analyze the target protein in a sample containing multiple types of proteins.
- the target substance is a fluorescent protein
- the target protein in a sample containing multiple types of proteins can be analyzed without adding a fluorescent marker.
- the second detector detects, as the secondary light, the fluorescence generated when the excitation light is irradiated onto the sample, and it is desirable that a filter be further provided on the optical path of the fluorescence detected by the second detector, and that the transmittance of the excitation light through the filter be smaller than the transmittance of the fluorescence through the filter.
- the apparatus further comprises an output section that outputs time-series data of the detection values detected by each of the detectors in a manner that allows comparison.
- Another example of an example where irradiating a sample with light of a specific wavelength makes it impossible to analyze a target substance in a sample that contains multiple types of substances is checking for protein contamination in a nucleic acid sample. This is because in order to analyze the level of protein contamination in a nucleic acid sample, not only ultraviolet light for analyzing nucleic acids is required, but also ultraviolet light for analyzing proteins.
- the first light source emits ultraviolet light having a wavelength absorbed by proteins
- the second light source emits ultraviolet light having a wavelength absorbed by nucleic acids.
- the first light source emits ultraviolet light with a wavelength of 280 nm
- the second light source emits ultraviolet light with a wavelength of 260 nm.
- the ratio of the detection values calculated by the calculation unit can be used as an index for evaluating the purity of a protein or nucleic acid.
- the centrifugal sedimentation type measurement method is a centrifugal sedimentation type measurement method comprising the steps of rotating a cell containing a sample and sedimenting the sample by centrifugal force, irradiating the cell with light from a first light source, and detecting with a first detector the transmitted light from the first light source that passes through the cell, or secondary light generated by irradiating the sample with the light from the first light source, characterized in that the method further comprises the steps of irradiating the cell with light from a second light source having a wavelength different from that of the light from the first light source, and detecting with a second detector the transmitted light from the second light source that passes through the cell, or secondary light generated by irradiating the sample with the light from the second light source.
- Such a centrifugal sedimentation type measuring method can achieve the same effects as those of the centrifugal sedimentation type measuring device described above.
- the present invention configured in this way, makes it possible to eliminate the need for purification steps prior to analysis, and without the trouble of replacing light sources, by irradiating the sample with light of two different wavelengths, allowing the analysis of target substances in a sample containing multiple types of substances.
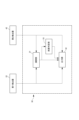
- FIG. 1 is a schematic diagram showing a centrifugal sedimentation type measuring device according to an embodiment of the present invention.
- FIG. 2 is a functional block diagram showing functions of the centrifugal sedimentation type measuring device in the embodiment.
- 2A to 2C are diagrams for explaining the measurement principle of the centrifugal sedimentation type measuring device in the first embodiment.
- FIG. 2 is a diagram for explaining a protein analysis method in the embodiment.
- FIG. 11 is a functional block diagram showing functions of a centrifugal sedimentation type measuring device according to a second embodiment.
- FIG. 11 is a diagram for explaining a method for analyzing the purity of nucleic acid in the second embodiment.
- a centrifugal sedimentation type measuring device 100 according to a first embodiment of the present invention will be described below with reference to the drawings.
- the centrifugal sedimentation measuring device 100 analyzes the substances contained in a sample by centrifugal sedimentation.
- the centrifugal sedimentation measuring device 100 of this embodiment is used to analyze a target substance in a sample containing multiple types of substances, and more specifically, to analyze a target protein in a biological sample containing multiple types of proteins while eliminating the need for purification steps prior to analysis.
- this embodiment includes a rotation mechanism 10 that rotates a measurement cell X to cause the sample to settle by centrifugal force, a first light source 21 that irradiates light onto the measurement cell X that contains the sample, a first detector 22 that detects transmitted light from the first light source 21 that passes through the measurement cell X, or secondary light generated when the light from the first light source 21 is irradiated onto the sample, and an information processing device 30 that receives a detection signal from the first detector 22.
- the rotating mechanism 10 includes a motor M and a rotating disk D fixed to the output shaft of the motor M, and the rotating disk D is configured to rotate with its face plate in a horizontal position, with the output shaft of the motor M as its rotation axis.
- the rotational mode of the rotating disk D can be changed as appropriate, and for example, it may be configured to rotate with the face plate perpendicular to the horizontal plane.
- This rotating disk D is provided with a measurement cell holder in which a measurement cell X is set, and a reference cell holder in which a reference cell R is set, where the reference cell R contains the same solvent as that contained in the measurement cell X.
- the first light source 21 emits light having an absorption wavelength of the substance contained in the sample, and preferably emits light that does not contain infrared light to prevent the temperature of the solvent from rising.
- the first light source 21 emits ultraviolet light, specifically, an LED that emits ultraviolet light of 280 nm, which is the absorption wavelength of proteins.
- the first detector 22 is provided on the opposite side of the rotating disk D to the first light source 21, and detects the transmitted light emitted from the first light source 21 and transmitted through the measurement cell X or the reference cell R, or the secondary light generated when the light from the first light source 21 is irradiated onto the sample, and transmits a first detection signal indicating the magnitude of the transmitted light intensity or secondary light intensity, which is the detection value, to the information processing device 30.
- the first detector 22 in this embodiment detects the transmitted light.
- the transmitted light from the measurement cell X and the transmitted light from the reference cell R are detected by a common first detector 22.
- a magnet sensor for generating a synchronization signal (not shown) is provided so that it is possible to distinguish which cell the first detection signal detected by the first detector 22 originates from.
- the information processing device 30 is a general-purpose or dedicated computer equipped with a CPU, memory, input/output interface, etc., and by making the CPU and peripheral devices work together in accordance with a specific program stored in a specific area of the memory, it has at least the functions of a calculation unit 31 and an output unit 32, as shown in Figure 2.
- the calculation unit 31 calculates the absorbance based on the first detection signal received from the first detector 22, and further calculates physical properties such as the particle size distribution and relative concentration of the substance in the sample based on the absorbance.
- the calculation unit 31 of this embodiment calculates the absorbance (A280) at least at 280 nm based on the first detection signal.
- the calculation unit 31 may calculate the amount of change in absorbance, and may calculate the relative concentration of protein in the sample from this amount of change.
- the output unit 32 outputs the transmitted light intensity or secondary light intensity detected by the first detector 22, and the calculation result calculated by the calculation unit 31 based on the first detection signal, and specifically outputs time series data of absorbance based on the first detection signal.
- the output unit 32 in this embodiment displays, for example, on a display, a graph with measurement time on the horizontal axis and absorbance on the vertical axis.
- This device 100 uses the fact that the settling speed of each particle differs due to differences in mass, density, size, and shape of each particle to separate proteins in a sample while irradiating them with light of the protein's absorption wavelength and measuring the absorbance.
- this device 100 rotates a measurement cell X containing a suspended protein solution (sample), centrifuging the proteins in the sample while measuring the absorbance of the sample at 280 nm, and outputs the measurement results as time-series data.
- a graph as shown in FIG. 3(a) is output, and from this graph, the change in absorbance when the protein D0 precipitates from the measurement surface of the measurement cell X at time t1 can be analyzed.
- a graph such as that shown in FIG. 3(b) is output. From this graph, it is possible to analyze the change in absorbance when proteins D 1 to D 3 settle from the measurement surface at three times t 1 to t 3 , as they settle at speeds corresponding to the mass of each particle.
- a second light source 41 is provided that irradiates the measurement cell X with light having a different wavelength from the light from the first light source 21, and a second detector 42 is provided that detects transmitted light from the second light source 41 that passes through the measurement cell X, or secondary light generated when the light from the second light source 41 is irradiated onto the sample.
- a fluorescent marker is added in advance to the target protein to be analyzed, and the sample is irradiated with excitation light corresponding to the fluorescent marker.
- the resulting secondary light, fluorescence is detected by the second detector 42, making it possible to detect the protein to which the fluorescent marker has been added and distinguish it from other proteins.
- a fluorescent marker is added to the target protein, but if the target substance is a substance that emits fluorescence, it is not necessary to add a fluorescent marker.
- the target substance is a fluorescent protein
- the target protein can be detected and distinguished from other substances by irradiating the sample with excitation light corresponding to the fluorescent protein.
- the second light source 41 irradiates the sample with excitation light having an excitation wavelength corresponding to the sample, which is an excitation wavelength corresponding to a fluorescent marker added to the sample or an excitation wavelength corresponding to a target substance in the sample.
- the second light source 41 is a semiconductor laser that emits light of 488 nm, specifically an argon laser. Note that the second light source 41 may be a combination of an LED or a white light source and a bandpass filter, but is preferably one that emits light that does not include infrared light in order to prevent the temperature of the solvent from increasing.
- the second detector 42 is provided on the opposite side of the rotating disk D from the second light source 41.
- the second detector 42 detects the fluorescence generated by excitation of the fluorescent marker or target substance in the sample as secondary light, and transmits a second detection signal indicating the magnitude of the secondary light (fluorescence) intensity, which is the detection value, to the information processing device 30.
- the second light source 41 is a light source provided at a different position from the first light source 21, and the second detector 42 is a detector provided at a different position from the first detector 22.
- a filter 43 is provided on the optical path of the secondary light (fluorescence) detected by the second detector 42 , and the transmittance of the excitation light through the filter 43 is smaller than the transmittance of the fluorescence through the filter 43 .
- the filter 43 in this embodiment is a bandpass filter that selectively transmits fluorescence emitted by a fluorescent marker or a target substance, but it may also be a bandstop filter that does not transmit excitation light, a dichroic filter, etc., as long as it cuts off the excitation light heading toward the second detector 42.
- the secondary light from the measurement cell X and the secondary light from the reference cell R are detected by a common second detector 42.
- a magnet sensor for generating a synchronization signal (not shown) is provided so that it is possible to distinguish which cell the second detection signal detected by the second detector 42 comes from.
- the output unit 32 outputs the transmitted light intensity or secondary light intensity detected by the second detector 42, and the calculation result calculated by the calculation unit 31 based on the second detection signal.
- the output unit 32 of this embodiment outputs time series data of absorbance based on the first detection signal and time series data of fluorescence intensity based on the second detection signal in a comparable manner, and for example, displays the graphs shown in Figures 4(a) and (b) simultaneously on the same display.
- the two graphs vertically with the horizontal axes of the graphs aligned, or to overlap the two graphs.
- the data based on each detection signal may be displayed in a different color.
- information corresponding to a fluorescent marker or the like added to the sample e.g., the name of the fluorescent marker, the name of the protein corresponding to the fluorescent marker, the name of the fluorescent protein, etc.
- the centrifugal sedimentation measuring device 100 configured in this manner includes a rotating mechanism 10, a first light source 21 that irradiates the measuring cell X with light, and a second light source 41 that irradiates the measuring cell X with light of a different wavelength from the light from the first light source 21.
- the first light source 21 emits ultraviolet light
- the second light source 41 irradiates excitation light with an excitation wavelength corresponding to the fluorescent marker added to the sample. Therefore, when analyzing a sample containing multiple types of proteins, by adding a fluorescent marker to the target protein before analysis, it becomes possible to obtain analytical data corresponding to each protein by centrifugation while identifying the analytical data corresponding to the target protein using the fluorescence of the added fluorescent marker, thereby analyzing the target protein in a sample containing multiple types of proteins.
- a filter 43 is provided on the optical path of the secondary light (fluorescence) detected by the second detector 42, and the transmittance of the excitation light through the filter 43 is smaller than the transmittance of the fluorescence through the filter 43. Therefore, the fluorescence from the sample can be detected by the second detector 42 while cutting out the excitation light that can become noise when detecting the fluorescence, thereby reducing the influence of noise in the measurement results and improving the measurement accuracy.
- this embodiment is equipped with an output section 32 that outputs the time series data of the detection values detected by each detector 22, 42 in a comparable manner, which is convenient when analyzing a target substance in a sample containing multiple types of substances.
- time series data of absorbance and fluorescence intensity are output from the output unit 32 in a comparable manner, making it easy to identify the analysis data corresponding to the target protein from among the analysis data corresponding to each protein, which is convenient when analyzing a target protein in a sample containing multiple types of proteins.
- the centrifugal sedimentation measuring device 100 of this embodiment is adapted to analyze a target protein in a biological sample containing multiple types of proteins, but may also be adapted to analyze substances other than the protein itself in a biological sample, or may analyze organic compounds or inorganic substances that are not derived from living organisms, and may be adapted to analyze a target substance in a sample containing multiple types of substances. Substances other than proteins themselves in biological samples, such as liposomes, exosomes, lipid nanoparticles, etc., may also be analyzed using this device 100.
- the light emitted by the first light source 21 and the second light source 41 is not limited to the above, and can be appropriately selected according to the analysis target, as long as the two light sources emit light having different wavelengths.
- the type of light source can also be changed appropriately.
- the present device 100 may be configured so as to be able to irradiate the measurement cell X with three or more types of light having different wavelengths.
- the light detected by the first detector 22 and the second detector 42 is not limited to that described above, but may be selected from transmitted light, fluorescent light, scattered light, etc., depending on the substance to be analyzed, and the specific aspects of each detector 22, 42 may be modified to detect it.
- a fluorescent marker was added to one protein in a sample and then analyzed, but a fluorescent marker may also be added to multiple proteins in a sample and then analyzed, or multiple types of fluorescent markers may be added; in other words, a fluorescent marker may be added so that the target protein can be detected and distinguished from other proteins.
- a color CCD or the like may be used in the second detector 42 so that the fluorescence of each fluorescent marker can be distinguished, or a spectroscope may be used to separate and detect the light from the multiple markers.
- information corresponding to each fluorescent marker may be added to the data output from the output unit 32.
- the calculation unit 31 may be configured to correct the extinction coefficient for each sedimentation rate of each substance when determining the relative concentration of a substance in a sample from changes in absorbance. By performing such corrections, quantitative accuracy can be improved when a sample contains multiple substances of different sizes.
- the output unit 32 outputs the absorbance calculated by the calculation unit 31, but it may also output the amount of change in absorbance calculated by the calculation unit 31, the particle size distribution, relative concentration, etc. of the substance in the sample. Specifically, it may output a graph with the measurement time on the horizontal axis and the amount of change in absorbance on the vertical axis, a graph with the sedimentation velocity or sedimentation coefficient on the horizontal axis and the relative frequency of the substance on the vertical axis, or the relative concentration or absolute concentration of each substance in the separated sample.
- the centrifugal sedimentation measuring device 100 of this embodiment is used to analyze a target substance in a sample containing multiple types of substances, and more specifically, to analyze the purity of nucleic acids in a biological sample containing multiple types of substances while eliminating the need for purification steps prior to analysis.
- the centrifugal sedimentation type measuring device 100 of this embodiment differs from the first embodiment in the specific aspects of the second light source 41 and the second detector 42 and in the functions of the information processing device 30. Below, these differences will be explained, and explanations of commonalities will be omitted where appropriate.
- the second light source 41 emits ultraviolet light, which is the absorption wavelength of nucleic acids, and is specifically an LED that emits ultraviolet light with a wavelength of 250 nm to 270 nm that is commonly used for analyzing nucleic acids.
- the second light source 41 emits ultraviolet light of 260 nm.
- the second light source 41 preferably emits light that does not contain infrared light, in order to prevent the temperature of the dispersion medium from rising.
- the second detector 42 detects the transmitted light emitted from the second light source 41 and transmitted through the measurement cell X or the reference cell R, or the secondary light generated when the light from the second light source 41 is irradiated onto the sample, and transmits a second detection signal indicating the magnitude of the secondary light intensity, which is the detection value, to the information processing device 30.
- the information processing device 30 has at least the functions of a calculation unit 31, a purity determination unit 33, and an output unit 32.
- the calculation unit 31 calculates the absorbance at 280 nm (A280) based on the first detection signal, and calculates the absorbance at 260 nm (A260) based on the second detection signal.
- the calculation unit 31 calculates the ratio between the detection value detected by the first detector 22 and the detection value detected by the second detector 42, and the ratio between the calculated A260 and A280 (A260/A280).
- the purity determination unit 33 determines the purity of the nucleic acid contained in the sample based on the ratio of the detection values described above and the A260/A280 value. Specifically, the purity determination unit 33 determines that the purity of the nucleic acid in the sample is high when the A260/A280 value is 1.8 or more and 2.0 or less, and determines that the purity is low otherwise.
- the output unit 32 outputs the calculation results of the calculation unit 31 and the judgment results of the purity judgment unit 33, and in this embodiment, outputs the A260/A280 value and the judgment result of the nucleic acid purity.
- the output unit 32 of this embodiment outputs the time series data of A260 and A280 based on each detection signal in a comparable manner, and specifically, displays the graphs shown in Figures 6(a) and (b) simultaneously on the same display, for example.
- the first light source 21 emits ultraviolet light having an absorption wavelength of proteins
- the second light source 41 emits ultraviolet light having an absorption wavelength of nucleic acids, thereby making it possible to analyze the purity of nucleic acids in a biological sample containing multiple types of substances while eliminating the need for purification steps prior to analysis.
- the first light source 21 emits ultraviolet light with a wavelength of 260 nm
- the second light source 41 emits ultraviolet light with a wavelength of 280 nm
- the calculation unit 31 calculates the A260/A280 value based on the first detection value and the second detection value, so that this calculated value can be used as an index for evaluating the purity of a protein or nucleic acid.
- the purity determination unit 33 automatically determines whether the nucleic acid purity is high or low based on the A260/A280 value, reducing the burden on the user.
- the purity determination unit 33 in this embodiment determines the purity of the nucleic acid based on the A260/A280 value, but it may also determine whether the nucleic acid purity is high based on the ratio of the secondary light intensities detected by the detectors 22 and 42, the ratio of relative concentrations, etc. In addition, the criteria for determining the purity are appropriately selected depending on the subject to be determined.
- the centrifugal sedimentation measuring device 100 is for analyzing the purity of nucleic acids, but it may also be for analyzing the purity of proteins.
- the first light source 21 is configured to emit ultraviolet light with a wavelength that is absorbed by phenol (specifically, ultraviolet light of 230 nm) instead of ultraviolet light with a wavelength that is absorbed by protein, the purity of the nucleic acid can be analyzed taking into account the presence of phenol in the sample.
- centrifugal sedimentation measuring device 100 of the present invention According to the centrifugal sedimentation measuring device 100 of the present invention, light of two or more wavelengths can be irradiated onto a sample in one analytical operation, so the number of analytical operations can be reduced compared to the case where an apparatus capable of emitting light of only one wavelength is used, and the number of times the sample needs to be adjusted can also be reduced.
- This device 100 performs analysis while centrifugal sedimentation is taking place, so impurities contained in the sample can be removed by centrifugation, eliminating the need for purification steps prior to analysis.
- the device 100 is equipped with a reference cell R, and detects secondary light by irradiating the reference contained therein with light. Then, based on the detection value from the reference, the calculation unit 31 of the device 100 automatically performs blank correction.
- the calculation of absorbance is performed by the calculation unit 31 of the information processing device 30, but it may also be performed on the side of each detector 22, 42. Also, a detection signal indicating the magnitude of the absorbance may be sent to the information processing device 30.
- the present invention makes it possible to analyze a target substance in a sample containing multiple types of substances by irradiating the sample with light of two different wavelengths without the need for purification work before analysis and without the trouble of replacing the light source.
Landscapes
- Chemical & Material Sciences (AREA)
- Dispersion Chemistry (AREA)
- Physics & Mathematics (AREA)
- Health & Medical Sciences (AREA)
- Life Sciences & Earth Sciences (AREA)
- Analytical Chemistry (AREA)
- Biochemistry (AREA)
- General Health & Medical Sciences (AREA)
- General Physics & Mathematics (AREA)
- Immunology (AREA)
- Pathology (AREA)
- Investigating Or Analysing Materials By Optical Means (AREA)
Priority Applications (1)
| Application Number | Priority Date | Filing Date | Title |
|---|---|---|---|
| JP2025506629A JPWO2024190313A1 (https=) | 2023-03-16 | 2024-02-20 |
Applications Claiming Priority (2)
| Application Number | Priority Date | Filing Date | Title |
|---|---|---|---|
| JP2023-041919 | 2023-03-16 | ||
| JP2023041919 | 2023-03-16 |
Publications (1)
| Publication Number | Publication Date |
|---|---|
| WO2024190313A1 true WO2024190313A1 (ja) | 2024-09-19 |
Family
ID=92755520
Family Applications (1)
| Application Number | Title | Priority Date | Filing Date |
|---|---|---|---|
| PCT/JP2024/005978 Ceased WO2024190313A1 (ja) | 2023-03-16 | 2024-02-20 | 遠心沈降式の測定装置、及び遠心沈降式の測定方法 |
Country Status (2)
| Country | Link |
|---|---|
| JP (1) | JPWO2024190313A1 (https=) |
| WO (1) | WO2024190313A1 (https=) |
Citations (4)
| Publication number | Priority date | Publication date | Assignee | Title |
|---|---|---|---|---|
| US20160376640A1 (en) * | 2015-06-25 | 2016-12-29 | Beckman Coulter, Inc. | Determination of exosome purity methods and apparatus |
| WO2022130916A1 (ja) * | 2020-12-17 | 2022-06-23 | 株式会社堀場製作所 | 粒子径分布測定装置、粒子径分布測定方法及び粒子径分布測定装置用プログラム |
| WO2022168434A1 (ja) * | 2021-02-05 | 2022-08-11 | 株式会社堀場製作所 | 粒子分析装置、粒子分析方法、及び、粒子分析装置用プログラム |
| WO2022224697A1 (ja) * | 2021-04-19 | 2022-10-27 | 国立大学法人大阪大学 | 分子送達用粒子を特徴づけるための方法 |
-
2024
- 2024-02-20 JP JP2025506629A patent/JPWO2024190313A1/ja active Pending
- 2024-02-20 WO PCT/JP2024/005978 patent/WO2024190313A1/ja not_active Ceased
Patent Citations (4)
| Publication number | Priority date | Publication date | Assignee | Title |
|---|---|---|---|---|
| US20160376640A1 (en) * | 2015-06-25 | 2016-12-29 | Beckman Coulter, Inc. | Determination of exosome purity methods and apparatus |
| WO2022130916A1 (ja) * | 2020-12-17 | 2022-06-23 | 株式会社堀場製作所 | 粒子径分布測定装置、粒子径分布測定方法及び粒子径分布測定装置用プログラム |
| WO2022168434A1 (ja) * | 2021-02-05 | 2022-08-11 | 株式会社堀場製作所 | 粒子分析装置、粒子分析方法、及び、粒子分析装置用プログラム |
| WO2022224697A1 (ja) * | 2021-04-19 | 2022-10-27 | 国立大学法人大阪大学 | 分子送達用粒子を特徴づけるための方法 |
Non-Patent Citations (2)
| Title |
|---|
| EDWARDS GARRETT B., MUTHURAJAN UMA M., BOWERMAN SAMUEL, LUGER KAROLIN: "Analytical Ultracentrifugation (AUC): An Overview of the Application of Fluorescence and Absorbance AUC to the Study of Biological Macromolecules", CURRENT PROTOCOLS IN MOLECULAR BIOLOGY, GREENE PUB. ASSOCIATES, vol. 133, no. 1, 1 December 2020 (2020-12-01), pages 1 - 27, XP093212408, ISSN: 1934-3639, DOI: 10.1002/cpmb.131 * |
| ZHAO HUAYING, MAYER MARK L., SCHUCK PETER: "Analysis of Protein Interactions with Picomolar Binding Affinity by Fluorescence-Detected Sedimentation Velocity", ANALYTICAL CHEMISTRY, AMERICAN CHEMICAL SOCIETY, US, vol. 86, no. 6, 18 March 2014 (2014-03-18), US , pages 3181 - 3187, XP093212418, ISSN: 0003-2700, DOI: 10.1021/ac500093m * |
Also Published As
| Publication number | Publication date |
|---|---|
| JPWO2024190313A1 (https=) | 2024-09-19 |
Similar Documents
| Publication | Publication Date | Title |
|---|---|---|
| KR102149318B1 (ko) | 소량 응집 검정 | |
| EP3264096B1 (en) | Method for acquiring information on cause of prolongation of coagulation time and device for performing said method | |
| US9557264B2 (en) | Automatic analysis device, and automatic analysis method | |
| EP0795129B1 (en) | Apparatus for analysing blood and other samples | |
| US10852312B2 (en) | Determination method of blood sample, blood sample analyzer, and computer program | |
| WO2024190313A1 (ja) | 遠心沈降式の測定装置、及び遠心沈降式の測定方法 | |
| JP7241209B2 (ja) | 血液凝固測定装置、血液凝固時間の測定方法、血液凝固反応の完了判定方法、および血液自動遠心分離装置 | |
| JP2008008794A (ja) | 分析装置 | |
| EP4160213B1 (en) | Method, analysis system, analyzer, and computer program for analyzing cause of prolonging coagulation time | |
| JPWO2016136464A1 (ja) | 分析装置およびその分析方法 | |
| JP7250103B2 (ja) | 血液検体を判定するための方法、装置及びコンピュータプログラム、並びに血液検体分析装置 | |
| JPH03180742A (ja) | 自動凝集像判定方法 | |
| JPS63145945A (ja) | 油の汚染及び劣化物質分析方法及びその装置 | |
| JP2001004318A (ja) | 光路長測定装置 | |
| WO2026018498A1 (ja) | 凝集体検出装置及び凝集体検出方法 | |
| JPH0153739B2 (https=) |
Legal Events
| Date | Code | Title | Description |
|---|---|---|---|
| 121 | Ep: the epo has been informed by wipo that ep was designated in this application |
Ref document number: 24770426 Country of ref document: EP Kind code of ref document: A1 |
|
| WWE | Wipo information: entry into national phase |
Ref document number: 2025506629 Country of ref document: JP |
|
| NENP | Non-entry into the national phase |
Ref country code: DE |
|
| 122 | Ep: pct application non-entry in european phase |
Ref document number: 24770426 Country of ref document: EP Kind code of ref document: A1 |