WO2024185286A1 - イメージング質量分析を用いた解析方法 - Google Patents
イメージング質量分析を用いた解析方法 Download PDFInfo
- Publication number
- WO2024185286A1 WO2024185286A1 PCT/JP2024/000366 JP2024000366W WO2024185286A1 WO 2024185286 A1 WO2024185286 A1 WO 2024185286A1 JP 2024000366 W JP2024000366 W JP 2024000366W WO 2024185286 A1 WO2024185286 A1 WO 2024185286A1
- Authority
- WO
- WIPO (PCT)
- Prior art keywords
- analysis
- matrix
- mass spectrometry
- region
- mass
- Prior art date
- Legal status (The legal status is an assumption and is not a legal conclusion. Google has not performed a legal analysis and makes no representation as to the accuracy of the status listed.)
- Ceased
Links
Images


Classifications
-
- H—ELECTRICITY
- H01—ELECTRIC ELEMENTS
- H01J—ELECTRIC DISCHARGE TUBES OR DISCHARGE LAMPS
- H01J49/00—Particle spectrometers or separator tubes
- H01J49/0004—Imaging particle spectrometry
-
- H—ELECTRICITY
- H01—ELECTRIC ELEMENTS
- H01J—ELECTRIC DISCHARGE TUBES OR DISCHARGE LAMPS
- H01J49/00—Particle spectrometers or separator tubes
- H01J49/02—Details
- H01J49/10—Ion sources; Ion guns
- H01J49/105—Ion sources; Ion guns using high-frequency excitation, e.g. microwave excitation, Inductively Coupled Plasma [ICP]
-
- H—ELECTRICITY
- H01—ELECTRIC ELEMENTS
- H01J—ELECTRIC DISCHARGE TUBES OR DISCHARGE LAMPS
- H01J49/00—Particle spectrometers or separator tubes
- H01J49/02—Details
- H01J49/10—Ion sources; Ion guns
- H01J49/16—Ion sources; Ion guns using surface ionisation, e.g. field-, thermionic- or photo-emission
- H01J49/161—Ion sources; Ion guns using surface ionisation, e.g. field-, thermionic- or photo-emission using photoionisation, e.g. by laser
- H01J49/164—Laser desorption/ionisation, e.g. matrix-assisted laser desorption/ionisation [MALDI]
Definitions
- the present invention relates to a method for analyzing a sample using imaging mass spectrometry, which visualizes the spatial distribution of components contained in the sample.
- imaging mass spectrometry which visualizes the spatial distribution of components contained in a sample
- An imaging mass spectrometer (hereinafter sometimes referred to as "MALDI-MS") that uses a matrix-assisted laser desorption/ionization (MALDI) mass spectrometer can perform molecular imaging of various organic compounds such as proteins, amino acids, and lipids present in a sample.
- MALDI-MS matrix-assisted laser desorption/ionization
- LA-ICP-MS laser ablation inductively coupled plasma mass spectrometer
- Non-Patent Document 1 discloses a multimodal imaging system that displays molecular imaging images and elemental imaging images obtained from the above two mass spectrometers side-by-side on the same screen.
- LA-ICP-MS In LA-ICP-MS, most of the material on the sample surface disappears due to irradiation with laser light. Therefore, analysis by LA-ICP-MS is essentially destructive analysis, and it is impossible to subject a sample after analysis by LA-ICP-MS to analysis by MALDI-MS.
- MALDI-MS since a MALDI matrix is applied to the surface of the sample in MALDI-MS analysis, if a sample after analysis by MALDI-MS is subjected to analysis by LA-ICP-MS, the analysis results may be affected by the matrix itself or by impurities related to the work of applying the matrix. There is also a concern that the signal intensity may decrease due to the laser irradiation marks formed during analysis by MALDI-MS.
- the present invention was made to solve these problems, and its main objective is to provide an analytical method using imaging mass spectrometry that can easily perform highly accurate overlay analysis without the need for cumbersome alignment processing between molecular imaging images obtained by MALDI-MS and elemental imaging images obtained by LA-ICP-MS.
- One aspect of an analysis method using imaging mass spectrometry is an analysis method using a matrix-assisted laser desorption/ionization mass spectrometer capable of imaging mass spectrometry and a laser ablation inductively coupled plasma mass spectrometry capable of imaging mass spectrometry, comprising: A first area setting step of setting a first analysis area on the sample coated with a matrix; a first analysis execution step of performing mass analysis on each of a plurality of micro-areas in the first analysis area using a matrix-assisted laser desorption/ionization mass spectrometry apparatus to obtain mass analysis data; a second analysis region setting step of setting a second analysis region on the sample coated with a matrix, the second analysis region including the entire first analysis region and an area where a matrix is present that is different from the first analysis region; a second analysis execution step of performing mass analysis on each of a plurality of micro-areas in the second analysis area by using a laser ablation inductively coupled plasma mass spectrometry apparatus to obtain mass analysis data;
- the second region setting step may be performed after the first analysis execution step, i.e., after imaging mass analysis of the first analysis region is performed.
- the second region setting step may be performed before the first analysis execution step is performed, and the first analysis execution step and the second analysis execution step may be performed sequentially with both the first analysis region and the second analysis region having been determined.
- the analysis method using imaging mass spectrometry it is possible to determine whether or not components (impurities) contained in the matrix or mixed in during the matrix application process affect the mass analysis data obtained by the laser ablation inductively coupled plasma mass spectrometry device. In other words, it is possible to determine the signal intensity information at the mass-to-charge ratio corresponding to the impurities. Furthermore, for example, when the influence of the impurities is large enough to be non-negligible, it is possible to correct the signal intensity information affected by the impurities, and it is possible to create an elemental imaging image using more accurate mass analysis data.
- FIG. 1 is a schematic diagram of an embodiment of a multimodal imaging system for carrying out an analysis method according to the present invention
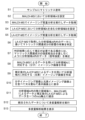
- 4 is a flowchart showing an example of an analysis procedure in the multimodal imaging system of the present embodiment.
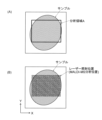
- FIG. 4 is an explanatory diagram of an example of an operation for setting a region to be analyzed by MALDI-MS in the multimodal imaging system of the present embodiment.
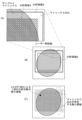
- FIG. 11 is an explanatory diagram of an example of the operation of setting a region to be analyzed by LA-ICP-MS in the multimodal imaging system of this embodiment.
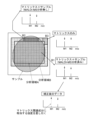
- 5A to 5C are schematic diagrams illustrating the process of determining the influence of impurities in the multimodal imaging system of the present embodiment.
- FIG. 11 is an explanatory diagram of another example of the operation of setting a region to be analyzed by LA-ICP-MS in the multimodal imaging system of the present embodiment.
- FIG. 1 is a schematic diagram of one embodiment of a multimodal imaging system for carrying out this analysis method.
- the multimodal imaging system of this embodiment includes a matrix coating device 1, an imaging mass spectrometer (MALDI-MS device) 2, a laser ablation inductively coupled plasma mass spectrometer (LA-ICP-MS device) 3, and a control and processing device 4.
- the actual control and processing device 4 is a personal computer (or a higher performance computer), and dedicated control and processing software is installed on the personal computer.
- An input unit 5 including a keyboard and the like, and a display unit 6 which is a display monitor are connected to this control and processing device 4.
- the matrix applicator 1 is a device that applies a thin layer of MALDI matrix to the surface of a sample 101 placed on a slide glass 100.
- the matrix applicator 1 for example, "iMLayer” or “iMLayer AERO” manufactured by Shimadzu Corporation can be used.
- the sample 101 is, for example, a slice sample obtained by thinly slicing an organ of a laboratory animal such as a mouse.
- the MALDI-MS device 2 is an imaging mass spectrometer using a matrix-assisted laser desorption/ionization mass spectrometer, and sequentially irradiates positions at a predetermined interval within a predetermined analysis region set on the sample 101 to which a matrix is applied with laser light, and collects mass analysis data by mass analyzing various ions generated from a micro-region including each position of the sample 101.
- the imaging mass spectrometer 2 can acquire ion intensity signals over a predetermined mass-to-charge ratio (m/z) range as mass analysis data for each micro-site within the analysis region.
- m/z mass-to-charge ratio
- the MALDI-MS device 2 for example, Shimadzu Corporation's "iMScope TM QT" can be used.
- the LA-ICP-MS device 3 is a combination of a laser ablation device and an inductively coupled plasma mass spectrometry device, and while linearly scanning the irradiation position of the laser light within a predetermined analysis region set on the sample 101, it can acquire ion intensity signals at one or more pre-set m/z values as mass analysis data every time a predetermined time has elapsed, that is, every time the laser light irradiates a range of a predetermined length on the sample 101.
- the LA-ICP-MS device 3 a combination of Shimadzu Corporation's "ICPMS-2030" and a laser ablation device can be used.
- the control/processing device 4 includes, as functional blocks, a data storage unit 40, a matrix effect determination unit 41, a matrix effect correction unit 42, an imaging image creation unit 43, an integrated spectrum data creation unit 44, a multivariate analysis processing unit 45, a position deviation correction unit 46, an area setting unit 47, a display processing unit 48, and a control unit 49.
- FIG. 2 is a flow chart showing the procedure of this analysis.
- FIG. 3 is an explanatory diagram of an example of the work of setting an area to be analyzed by MALDI-MS on the sample 101.
- FIG. 4 is an explanatory diagram of an example of the work of setting an area to be analyzed by LA-ICP-MS on the sample 101.
- FIG. 5 is a schematic diagram of the work of determining the influence of impurities based on collected mass spectrometry data.
- the user places the sample 101 on the slide glass 100, sets it in the matrix coating device 1, and performs a predetermined operation.
- the matrix coating device 1 then coats a thin layer of matrix on the sample 101 (step S1).
- the matrix is coated almost uniformly over a wide area of the slide glass 100, including the entire sample 101, so that the matrix is coated directly on the slide glass 100 outside the sample 101. Therefore, on the slide glass 100, there are formed areas where both the sample 101 and the matrix exist, and areas where the sample 101 does not exist and only the matrix exists.
- various compounds are used as the matrix, and an appropriate compound is selected depending on the type of sample 101 and the substance to be analyzed.
- the user places the matrix-coated slide glass 100 in a predetermined position in the MALDI-MS device 2 and sets an analysis region A on the sample 101 where molecular imaging is to be performed (step S2).
- This analysis region A is generally called a Region of Interest (ROI).
- step S2 the user performs microscopic observation of the top surface of sample 101 using a microscope attached to MALDI-MS device 2, and designates the range of analysis area A on the microscopic observation image displayed on the screen of display unit 6, as shown in FIG. 3(A).
- This designation of analysis area A can be performed by the user changing the size and position of the area designation frame by operating a pointing device such as a mouse on the microscopic observation image under the control of area setting unit 47.
- the shape of the area designation frame is rectangular, but this shape may be changed as desired.
- the MALDI-MS device 2 performs imaging mass analysis within the analysis area A set on the sample 101 (step S3).
- the slide glass 100 is moved in a step-like manner by a predetermined distance in each of the mutually orthogonal X-axis and Y-axis directions in a plane parallel to the upper surface of the slide glass 100, while a narrowed-down laser beam is irradiated in pulses in the analysis area A on the sample 101, and ions generated from the vicinity of the irradiation position are collected to perform mass analysis.
- Mass analysis data mass spectrum data
- the amount of ions generated by one laser beam irradiation is not necessarily large.
- the same position or a very close position on the sample 101 may be irradiated with laser beam multiple times, and the mass analysis data obtained for each laser beam irradiation may be accumulated.
- the method of performing imaging mass analysis on a predetermined analysis area A on the sample 101 is exactly the same as the analysis method in a conventional imaging mass spectrometer.
- step S3 mass spectrum data in a specified m/z range is obtained for each of the numerous micro-areas (laser light irradiation positions) in analysis area A as shown in FIG. 3(B).
- the large amount of data collected in this way by the MALDI-MS device 2 is sent to the control/processing device 4 and temporarily stored in the data storage unit 40.
- the user removes the analyzed slide glass 100 from the MALDI-MS device 2 and sets it in a predetermined position in the LA-ICP-MS device 3. Then, the user sets an analysis area B to be analyzed by LA-ICP-MS, which includes the entire analysis area A on the sample 101 (step S4).
- the positional deviation correction unit 46 can correct the positional deviation between the two images by simple processing (movement and rotation operations in the XY plane) using the sample image in the microscopic observation image obtained by the MALDI-MS device 2 and the sample image in the microscopic observation image obtained by the LA-ICP-MS device 3.
- the LA-ICP-MS device 3 differs from the MALDI-MS device 2 in that it does not collect all ion intensity data across a specified m/z range, but rather selectively collects ion intensity data at one or more specific m/z values designated in advance.
- this specific m/z value is determined according to the element that the user focuses on, i.e., that he or she wishes to observe. For example, if the user wishes to observe the distribution of iron (Fe) in the sample 101, the m/z value corresponding to Fe is designated as the m/z value to be observed.
- the LA-ICP-MS device 3 does not move the sample 101 in a stepwise manner, but moves the sample 101 continuously in the X-axis direction within the analysis region B.
- the laser light is substantially continuously irradiated onto the sample 101, and each time a predetermined laser irradiation time elapses, the intensity signal for the ions having a specific m/z value collected during that laser irradiation time is integrated for each m/z value. Therefore, ion intensity data at a specific m/z value is obtained as mass analysis data for each predetermined micro-region (region of a predetermined length in the direction along the X-axis) on the sample 101.
- step S5 ion intensity data at specific m/z values is obtained for each of the many micro-regions in analysis region B as shown in FIG. 4(C).
- the data collected by imaging mass spectrometry in step S5 is also sent to the control/processing device 4 and temporarily stored in the data storage unit 40.
- the matrix effect determination unit 41 in the control/processing device 4 performs a process to determine the presence or absence of matrix effects using a portion of the data collected in step S5 (step S6).
- the mass spectrometry data obtained from the micro-region in the third region B3 reflects components (elements) originally contained in the matrix, as well as components that are mixed in when the matrix is applied by the matrix application device 1, such as components that have dissolved from the piping through which the matrix flows (hereinafter, these components are collectively referred to as "matrix-related components").
- matrix-related components components that are mixed in when the matrix is applied by the matrix application device 1, such as components that have dissolved from the piping through which the matrix flows (hereinafter, these components are collectively referred to as "matrix-related components").
- the mass spectrometry data obtained from the micro-regions in the first region B1 and the second region B2 reflects both the matrix-related components and the components contained in the sample 101.
- some of the matrix-related components and the components contained in the sample 101 may be lost due to imaging mass analysis by the MALDI-MS device 2.
- the simplest correction method described above does not take into account the possibility that the amount of matrix-related components may decrease during mass analysis using the MALDI-MS device 2. In other words, if the decrease is negligible compared to the original amount of the components, the simplest method described above can be used. On the other hand, if the decrease in the amount of matrix-related components during mass analysis using the MALDI-MS device 2 cannot be ignored, it is advisable to carry out processing that reflects the decrease during correction.
- the first to third regions B1 to B3 When executing the processes of steps S6 and S7, it is necessary to recognize the first to third regions B1 to B3 within the analysis area B. There is no problem with the first region B1 because it coincides with the analysis area A, but to distinguish between the second region B2 and the third region B3, it is necessary to recognize the presence or absence of the sample 101.
- This recognition can be performed by the user by visually checking the microscopic observation image, for example, when setting the analysis area B or when executing step S6.
- the second region B2 and the third region B3 may be automatically distinguished using image recognition processing.
- the imaging image creation unit 43 creates a molecular imaging image at a predetermined m/z value corresponding to the analysis region A, using the imaging mass spectrometry data acquired by the MALDI-MS device 2 and stored in the data storage unit 40 (step S8).
- the imaging image creation unit 43 also creates an element imaging image at a predetermined m/z value corresponding to the analysis region A, using the imaging mass spectrometry data acquired by the LA-ICP-MS device 3 and corrected in step S7 (step S9).
- the m/z value of each imaging image can be appropriately specified by the user.
- the m/z values of the ions derived from compounds detected by the MALDI-MS device 2 and the ions derived from metal elements detected by the LA-ICP-MS device 3 do not overlap. Therefore, the data can be integrated by simply arranging both sets of data on the m/z axis. However, if there is a large difference in detection sensitivity between the MALDI-MS device 2 and the LA-ICP-MS device 3, it is advisable to investigate the difference in detection sensitivity in advance and correct the signal intensity of one or both of them so that the difference is small before integrating them.
- the m/z values of the ions derived from compounds detected by the MALDI-MS device 2 and the ions derived from metal elements detected by the LA-ICP-MS device 3 overlap, one of them (usually the one with the higher sensitivity) can be used, or the signal intensities of both can be multiplied by an appropriate coefficient and then added together.
- the display processing unit 48 displays the results of the multivariate analysis in a predetermined format on the screen of the display unit 6 (step S13).
- steps S8 to S10 and steps S11 to S12 can be switched as appropriate.
- analysis area B was set by expanding analysis area A outward, but this is merely one example and can be modified as follows.
- Figure 6 is an explanatory diagram of another example of the work of setting analysis area B in the multimodal imaging system of the above embodiment.
- the analysis area A when the analysis area A is set only in a small part of the sample 101, if the analysis area B is set to expand the analysis area A, the area of the analysis area B other than the analysis area A will be considerably large.
- the mass analysis data obtained from the micro-areas present in the analysis area B other than the analysis area A is only used to determine the presence or absence of the influence of the matrix-related components and to correct for the influence, and mass analysis data from a large number of micro-areas is not necessary. Rather, if the area of the analysis area B other than the analysis area A is large, it will take a long time to perform mass analysis on that part using the LA-ICP-MS device 3, resulting in a decrease in analysis efficiency.
- the analysis area A is set only in a small part of the sample 101, it is advisable to set the analysis area C at a position separate from the analysis area A, and combine the analysis area A and the analysis area C to form the analysis area B, as shown in FIG. 6(B) and (C), for example.
- FIG. 6B shows an example in which the analysis region C is defined so as to straddle a portion where the sample 101 is present (the second portion B2) and a portion where the sample 101 is not present (the third portion B3).
- FIG. 6C shows an example in which the analysis region C is defined only in a portion where the sample 101 is not present.
- the mass spectrometry data from a minute region included in the analysis region B other than the analysis region A can be used to estimate the degree of reduction in matrix-related components due to the mass spectrometry being performed by the MALDI-MS device 2 in the analysis region A. In this way, the position and size of the analysis region B can be determined appropriately as long as it includes the entire analysis region A and also includes the area outside the analysis region A where the matrix exists.
- One aspect of an analysis method using imaging mass spectrometry according to the present invention is an analysis method using a matrix-assisted laser desorption/ionization mass spectrometer capable of imaging mass spectrometry and a laser ablation inductively coupled plasma mass spectrometer capable of imaging mass spectrometry, comprising: A first area setting step of setting a first analysis area on the sample coated with a matrix; a first analysis execution step of performing mass analysis on each of a plurality of micro-areas in the first analysis area using a matrix-assisted laser desorption/ionization mass spectrometry apparatus to obtain mass analysis data; a second analysis region setting step of setting a second analysis region on the sample coated with a matrix, the second analysis region including the entire first analysis region and an area where a matrix is present that is different from the first analysis region; a second analysis execution step of performing mass analysis on each of a plurality of micro-areas in the second analysis area by using a laser ablation inductively coupled plasma mass spectrometry apparatus to obtain
- the analysis method described in paragraph 1 makes it possible to ascertain whether components contained in the matrix or components (impurities) mixed in during the matrix application process are affecting the mass analysis data obtained by the laser ablation inductively coupled plasma mass spectrometry device.
- the second analysis area can be an area that is an extension of the first analysis area.
- the range in which the matrix exists in the second analysis region can be a region separate from the first analysis region.
- the area outside the first analysis area where the matrix is present is continuous with the first analysis area, but it does not have to be continuous. If the first analysis area is a very narrow area close to the center of the sample, and an attempt is made to define a second analysis area by expanding the first analysis area to a position where no sample is present but where the matrix is present, the second analysis area will be significantly larger than the first analysis area. If the second analysis area is large, the time required for imaging mass analysis by LA-ICP-MS will be longer.
- the second analysis area can be determined by adding the minimum range required to determine the presence or absence of matrix influence to the first analysis area, so the time required for imaging mass analysis by LA-ICP-MS is not prolonged more than necessary. Therefore, the time required for imaging mass analysis by LA-ICP-MS can be reduced, and the analysis can be performed efficiently.
- the analysis method described in any one of paragraphs 1 to 3 may further include an image creation and display step of creating an imaging image corresponding to the first analysis region based on the mass analysis data obtained in the first analysis execution step, creating an imaging image corresponding to the first region based on the mass analysis data corrected in the information correction step, and displaying both imaging images side by side or overlaid.
- a molecular imaging image corresponding to a first analysis region on a sample and an elemental imaging image showing a highly accurate distribution of a specified element corresponding to the same first analysis region on the same sample can be displayed on the same display screen. This makes it possible to accurately compare, for example, the distribution of molecules and elements.
- the information correction step may include a process of subtracting an intensity corresponding to the contribution of the matrix-related components from the mass spectrometry data obtained in the second analysis execution step if the determination step determines that there is an influence of matrix-related components.
- the analysis method described in any one of paragraphs 1 to 5 may further include a data integration step of creating a mass spectrum that integrates intensity information at the same mass-to-charge ratio using mass spectrometry data obtained in the first analysis execution step and mass spectrometry data obtained in the second analysis execution step for substantially the same position on the sample.
- the analysis method described in 6 may further include an analysis processing step of performing multivariate analysis on the mass spectrum data integrated in the data integration step.
- both sets of data are integrated on a single m/z axis for each micro-region on the sample, so that data pairing m/z values and signal intensity values can be obtained for each micro-region.
- the analysis method described in paragraph 7 by subjecting the data thus obtained to multivariate analysis, it is possible to automatically and objectively perform analyses that have traditionally been mainly visually confirmed by users, such as extracting m/z values with highly similar spatial distributions, or extracting m/z values that show a distribution similar to the spatial distribution of a specific element.
- the area in which the matrix is present can be an area in which only the matrix is applied.
Landscapes
- Physics & Mathematics (AREA)
- Spectroscopy & Molecular Physics (AREA)
- Chemical & Material Sciences (AREA)
- Analytical Chemistry (AREA)
- Other Investigation Or Analysis Of Materials By Electrical Means (AREA)
Priority Applications (3)
| Application Number | Priority Date | Filing Date | Title |
|---|---|---|---|
| CN202480008281.7A CN120604118A (zh) | 2023-03-07 | 2024-01-11 | 使用成像质量分析的解析方法 |
| EP24766661.3A EP4679078A4 (en) | 2023-03-07 | 2024-01-11 | ANALYSIS METHOD USING IMAGING MASS SPECTROMETRY |
| JP2025505092A JP7889719B2 (ja) | 2023-03-07 | 2024-01-11 | イメージング質量分析を用いた解析方法 |
Applications Claiming Priority (2)
| Application Number | Priority Date | Filing Date | Title |
|---|---|---|---|
| JP2023034857 | 2023-03-07 | ||
| JP2023-034857 | 2023-03-07 |
Publications (1)
| Publication Number | Publication Date |
|---|---|
| WO2024185286A1 true WO2024185286A1 (ja) | 2024-09-12 |
Family
ID=92674800
Family Applications (1)
| Application Number | Title | Priority Date | Filing Date |
|---|---|---|---|
| PCT/JP2024/000366 Ceased WO2024185286A1 (ja) | 2023-03-07 | 2024-01-11 | イメージング質量分析を用いた解析方法 |
Country Status (4)
| Country | Link |
|---|---|
| EP (1) | EP4679078A4 (cg-RX-API-DMAC7.html) |
| JP (1) | JP7889719B2 (cg-RX-API-DMAC7.html) |
| CN (1) | CN120604118A (cg-RX-API-DMAC7.html) |
| WO (1) | WO2024185286A1 (cg-RX-API-DMAC7.html) |
Citations (4)
| Publication number | Priority date | Publication date | Assignee | Title |
|---|---|---|---|---|
| US20160005578A1 (en) * | 2013-01-28 | 2016-01-07 | Westfaelische Wilhelms-Universitaet Muenster | Parallel elemental and molecular mass spectrometry analysis with laser ablation sampling |
| JP2019190841A (ja) | 2018-04-18 | 2019-10-31 | 株式会社島津製作所 | 分析方法、分析装置およびプログラム |
| WO2020217334A1 (ja) * | 2019-04-24 | 2020-10-29 | 株式会社島津製作所 | イメージング質量分析装置 |
| JP2022517827A (ja) * | 2019-01-22 | 2022-03-10 | イマビオテク | 生物学的サンプル中の分子効果に関連する分子変化を評価するための方法 |
-
2024
- 2024-01-11 WO PCT/JP2024/000366 patent/WO2024185286A1/ja not_active Ceased
- 2024-01-11 CN CN202480008281.7A patent/CN120604118A/zh active Pending
- 2024-01-11 EP EP24766661.3A patent/EP4679078A4/en active Pending
- 2024-01-11 JP JP2025505092A patent/JP7889719B2/ja active Active
Patent Citations (4)
| Publication number | Priority date | Publication date | Assignee | Title |
|---|---|---|---|---|
| US20160005578A1 (en) * | 2013-01-28 | 2016-01-07 | Westfaelische Wilhelms-Universitaet Muenster | Parallel elemental and molecular mass spectrometry analysis with laser ablation sampling |
| JP2019190841A (ja) | 2018-04-18 | 2019-10-31 | 株式会社島津製作所 | 分析方法、分析装置およびプログラム |
| JP2022517827A (ja) * | 2019-01-22 | 2022-03-10 | イマビオテク | 生物学的サンプル中の分子効果に関連する分子変化を評価するための方法 |
| WO2020217334A1 (ja) * | 2019-04-24 | 2020-10-29 | 株式会社島津製作所 | イメージング質量分析装置 |
Non-Patent Citations (3)
| Title |
|---|
| BIANGA JULIUSZ, BOUSLIMANI AMINA, BEC NICOLE, QUENET FRANÇOIS, MOUNICOU SANDRA, SZPUNAR JOANNA, BOUYSSIERE BRICE, LOBINSKI RYSZARD: "Complementarity of MALDI and LA ICP mass spectrometry for platinum anticancer imaging in human tumor", METALLOMICS, ROYAL SOCIETY OF CHEMISTRY, GB, vol. 6, no. 8, 1 January 2014 (2014-01-01), GB , pages 1382 - 1386, XP093208196, ISSN: 1756-5901, DOI: 10.1039/C4MT00131A * |
| HOLZLECHNER MATTHIAS, BONTA MAXIMILIAN, LOHNINGER HANS, LIMBECK ANDREAS, MARCHETTI-DESCHMANN MARTINA: "Multisensor Imaging—From Sample Preparation to Integrated Multimodal Interpretation of LA-ICPMS and MALDI MS Imaging Data", ANALYTICAL CHEMISTRY, AMERICAN CHEMICAL SOCIETY, US, vol. 90, no. 15, 7 August 2018 (2018-08-07), US , pages 8831 - 8837, XP093208198, ISSN: 0003-2700, DOI: 10.1021/acs.analchem.8b00816 * |
| See also references of EP4679078A1 |
Also Published As
| Publication number | Publication date |
|---|---|
| JPWO2024185286A1 (cg-RX-API-DMAC7.html) | 2024-09-12 |
| JP7889719B2 (ja) | 2026-07-14 |
| EP4679078A4 (en) | 2026-07-22 |
| CN120604118A (zh) | 2025-09-05 |
| EP4679078A1 (en) | 2026-01-14 |
Similar Documents
| Publication | Publication Date | Title |
|---|---|---|
| JP4983451B2 (ja) | クロマトグラフ質量分析データ処理装置 | |
| JP6791373B2 (ja) | クロマトグラフ質量分析データ処理装置及びクロマトグラフ質量分析データ処理用プログラム | |
| CN107430979B (zh) | 分析装置 | |
| JP4973628B2 (ja) | クロマトグラフ質量分析データ解析方法及び装置 | |
| JP5348029B2 (ja) | 質量分析データ処理方法及び装置 | |
| JP4967857B2 (ja) | クロマトグラフ質量分析データ処理装置 | |
| JP6597909B2 (ja) | 質量分析データ処理装置 | |
| CN101400995B (zh) | 色谱仪质量分析装置 | |
| JP2011237311A (ja) | クロマトグラフ質量分析用データ処理装置 | |
| Wille et al. | Liquid chromatography high-resolution mass spectrometry in forensic toxicology: what are the specifics of method development, validation and quality assurance for comprehensive screening approaches? | |
| JP5757264B2 (ja) | クロマトグラフ質量分析データ処理装置 | |
| CN112136041B (zh) | 成像数据处理装置 | |
| US20210217597A1 (en) | Imaging mass spectrometry data processing device | |
| WO2019186965A1 (ja) | イメージング質量分析におけるデータ処理方法及びデータ処理プログラム | |
| Cho et al. | Combining MALDI-TOF and molecular imaging with principal component analysis for biomarker discovery and clinical diagnosis of cancer | |
| EP2069796A2 (en) | Methods and systems for quantifying isobaric labels and peptides | |
| CN112204388B (zh) | 谱数据处理装置以及分析装置 | |
| US12176194B2 (en) | Analysis device | |
| EP4679078A1 (en) | Analysis method employing imaging mass spectrometry | |
| JP7622864B2 (ja) | 質量分析データ解析方法及びイメージング質量分析装置 | |
| WO2021075254A1 (ja) | イメージング質量分析装置 | |
| KR101841369B1 (ko) | 이미지 기반 물질 정량 분석방법 | |
| WO2019229898A1 (ja) | イメージング質量分析データ処理装置 | |
| WO2022003890A1 (ja) | イメージング質量分析装置及びイメージング質量分析データ処理方法 | |
| JP6973638B2 (ja) | イメージングデータ処理装置 |
Legal Events
| Date | Code | Title | Description |
|---|---|---|---|
| 121 | Ep: the epo has been informed by wipo that ep was designated in this application |
Ref document number: 24766661 Country of ref document: EP Kind code of ref document: A1 |
|
| WWE | Wipo information: entry into national phase |
Ref document number: 2025505092 Country of ref document: JP |
|
| WWE | Wipo information: entry into national phase |
Ref document number: 202480008281.7 Country of ref document: CN |
|
| WWP | Wipo information: published in national office |
Ref document number: 202480008281.7 Country of ref document: CN |
|
| WWE | Wipo information: entry into national phase |
Ref document number: 2024766661 Country of ref document: EP |
|
| NENP | Non-entry into the national phase |
Ref country code: DE |
|
| ENP | Entry into the national phase |
Ref document number: 2024766661 Country of ref document: EP Effective date: 20251007 |
|
| ENP | Entry into the national phase |
Ref document number: 2024766661 Country of ref document: EP Effective date: 20251007 |
|
| ENP | Entry into the national phase |
Ref document number: 2024766661 Country of ref document: EP Effective date: 20251007 |
|
| ENP | Entry into the national phase |
Ref document number: 2024766661 Country of ref document: EP Effective date: 20251007 |
|
| WWP | Wipo information: published in national office |
Ref document number: 2024766661 Country of ref document: EP |