WO2024176618A1 - 蛍光画像取得方法、蛍光画像取得装置、及び蛍光画像取得プログラム - Google Patents
蛍光画像取得方法、蛍光画像取得装置、及び蛍光画像取得プログラム Download PDFInfo
- Publication number
- WO2024176618A1 WO2024176618A1 PCT/JP2023/046787 JP2023046787W WO2024176618A1 WO 2024176618 A1 WO2024176618 A1 WO 2024176618A1 JP 2023046787 W JP2023046787 W JP 2023046787W WO 2024176618 A1 WO2024176618 A1 WO 2024176618A1
- Authority
- WO
- WIPO (PCT)
- Prior art keywords
- fluorescence
- image
- fluorescent
- pixel
- images
- Prior art date
- Legal status (The legal status is an assumption and is not a legal conclusion. Google has not performed a legal analysis and makes no representation as to the accuracy of the status listed.)
- Ceased
Links
Images




Classifications
-
- G—PHYSICS
- G01—MEASURING; TESTING
- G01N—INVESTIGATING OR ANALYSING MATERIALS BY DETERMINING THEIR CHEMICAL OR PHYSICAL PROPERTIES
- G01N21/00—Investigating or analysing materials by the use of optical means, i.e. using sub-millimetre waves, infrared, visible or ultraviolet light
- G01N21/62—Systems in which the material investigated is excited whereby it emits light or causes a change in wavelength of the incident light
- G01N21/63—Systems in which the material investigated is excited whereby it emits light or causes a change in wavelength of the incident light optically excited
- G01N21/64—Fluorescence; Phosphorescence
- G01N21/645—Specially adapted constructive features of fluorimeters
- G01N21/6456—Spatial resolved fluorescence measurements; Imaging
-
- G—PHYSICS
- G01—MEASURING; TESTING
- G01N—INVESTIGATING OR ANALYSING MATERIALS BY DETERMINING THEIR CHEMICAL OR PHYSICAL PROPERTIES
- G01N21/00—Investigating or analysing materials by the use of optical means, i.e. using sub-millimetre waves, infrared, visible or ultraviolet light
- G01N21/62—Systems in which the material investigated is excited whereby it emits light or causes a change in wavelength of the incident light
- G01N21/63—Systems in which the material investigated is excited whereby it emits light or causes a change in wavelength of the incident light optically excited
- G01N21/64—Fluorescence; Phosphorescence
- G01N21/6428—Measuring fluorescence of fluorescent products of reactions or of fluorochrome labelled reactive substances, e.g. measuring quenching effects, using measuring "optrodes"
-
- G—PHYSICS
- G01—MEASURING; TESTING
- G01N—INVESTIGATING OR ANALYSING MATERIALS BY DETERMINING THEIR CHEMICAL OR PHYSICAL PROPERTIES
- G01N21/00—Investigating or analysing materials by the use of optical means, i.e. using sub-millimetre waves, infrared, visible or ultraviolet light
- G01N21/62—Systems in which the material investigated is excited whereby it emits light or causes a change in wavelength of the incident light
- G01N21/63—Systems in which the material investigated is excited whereby it emits light or causes a change in wavelength of the incident light optically excited
- G01N21/64—Fluorescence; Phosphorescence
- G01N2021/6417—Spectrofluorimetric devices
- G01N2021/6419—Excitation at two or more wavelengths
-
- G—PHYSICS
- G01—MEASURING; TESTING
- G01N—INVESTIGATING OR ANALYSING MATERIALS BY DETERMINING THEIR CHEMICAL OR PHYSICAL PROPERTIES
- G01N21/00—Investigating or analysing materials by the use of optical means, i.e. using sub-millimetre waves, infrared, visible or ultraviolet light
- G01N21/62—Systems in which the material investigated is excited whereby it emits light or causes a change in wavelength of the incident light
- G01N21/63—Systems in which the material investigated is excited whereby it emits light or causes a change in wavelength of the incident light optically excited
- G01N21/64—Fluorescence; Phosphorescence
- G01N2021/6417—Spectrofluorimetric devices
- G01N2021/6421—Measuring at two or more wavelengths
-
- G—PHYSICS
- G01—MEASURING; TESTING
- G01N—INVESTIGATING OR ANALYSING MATERIALS BY DETERMINING THEIR CHEMICAL OR PHYSICAL PROPERTIES
- G01N21/00—Investigating or analysing materials by the use of optical means, i.e. using sub-millimetre waves, infrared, visible or ultraviolet light
- G01N21/62—Systems in which the material investigated is excited whereby it emits light or causes a change in wavelength of the incident light
- G01N21/63—Systems in which the material investigated is excited whereby it emits light or causes a change in wavelength of the incident light optically excited
- G01N21/64—Fluorescence; Phosphorescence
- G01N21/6428—Measuring fluorescence of fluorescent products of reactions or of fluorochrome labelled reactive substances, e.g. measuring quenching effects, using measuring "optrodes"
- G01N2021/6439—Measuring fluorescence of fluorescent products of reactions or of fluorochrome labelled reactive substances, e.g. measuring quenching effects, using measuring "optrodes" with indicators, stains, dyes, tags, labels, marks
- G01N2021/6441—Measuring fluorescence of fluorescent products of reactions or of fluorochrome labelled reactive substances, e.g. measuring quenching effects, using measuring "optrodes" with indicators, stains, dyes, tags, labels, marks with two or more labels
-
- G—PHYSICS
- G01—MEASURING; TESTING
- G01N—INVESTIGATING OR ANALYSING MATERIALS BY DETERMINING THEIR CHEMICAL OR PHYSICAL PROPERTIES
- G01N21/00—Investigating or analysing materials by the use of optical means, i.e. using sub-millimetre waves, infrared, visible or ultraviolet light
- G01N21/62—Systems in which the material investigated is excited whereby it emits light or causes a change in wavelength of the incident light
- G01N21/63—Systems in which the material investigated is excited whereby it emits light or causes a change in wavelength of the incident light optically excited
- G01N21/64—Fluorescence; Phosphorescence
- G01N21/645—Specially adapted constructive features of fluorimeters
- G01N2021/6463—Optics
- G01N2021/6471—Special filters, filter wheel
Definitions
- One aspect of the embodiment relates to a fluorescence image acquisition method, a fluorescence image acquisition device, and a fluorescence image acquisition program.
- Non-Patent Document 1 discloses the application of a nonnegative matrix factorization (NMF) method to blind unmix fluorescent images in which fluorescence in multiple wavelength ranges is observed to obtain separate images for each substance in the sample.
- NMF nonnegative matrix factorization
- Non-Patent Document 2 discloses a method of unmixing fluorescent images by clustering the fluorescent images, extracting the maximum value of the fluorescent intensity for each clustered pixel group, and generating a separate image based on the maximum value.
- One aspect of the embodiment has been made in consideration of this problem, and aims to provide a fluorescence image acquisition method, a fluorescence image acquisition device, and a fluorescence image acquisition program that are capable of distinguishing between single-color pixels in fluorescent pixels.
- the fluorescence image acquisition method includes an irradiation step of irradiating a sample with each of a plurality of excitation lights having a wavelength distribution, an acquisition step of acquiring a first fluorescence image in a first optical state and a second fluorescence image in a second optical state in which fluorescence is measured with wavelength characteristics different from the first optical state through a fluorescence filter unit having a plurality of reflection wavelength ranges and a plurality of transmission wavelength ranges for each of a plurality of fluorescence corresponding to each of the plurality of excitation lights, a calculation step of calculating an intensity ratio, which is a ratio between the intensity value of a pixel of the first fluorescence image and the intensity value of a pixel of the second fluorescence image corresponding to the pixel, for the first fluorescence image and the second fluorescence image, and calculating the intensity ratio for each of the plurality of excitation lights, and a discrimination step of discriminating whether the pixel is a monochromat
- a fluorescence image acquisition device includes an irradiation device that irradiates a sample with each of a plurality of excitation light beams having a wavelength distribution, an image acquisition device that acquires a first fluorescence image in a first optical state and a second fluorescence image in a second optical state in which fluorescence is measured with wavelength characteristics different from the first optical state through a fluorescence filter unit having a plurality of reflection wavelength ranges and a plurality of transmission wavelength ranges for each of a plurality of fluorescence beams corresponding to each of the plurality of excitation light beams, and an image processing device that processes the plurality of first fluorescence images and the plurality of second fluorescence images, and the image processing device calculates an intensity ratio, which is the ratio between the intensity value of a pixel of the first fluorescence image and the intensity value of a pixel of the second fluorescence image corresponding to the pixel, for the first fluorescence image and the second fluor
- a fluorescence image acquisition program is a fluorescence image acquisition program for determining whether a pixel is a monochromatic pixel based on a first fluorescence image in a first optical state and a second fluorescence image in a second optical state in which fluorescence is measured with wavelength characteristics different from that of the first optical state, the first and second fluorescence images being acquired through a fluorescence filter unit having multiple reflection wavelength ranges and multiple transmission wavelength ranges for each of a plurality of fluorescences corresponding to each of the plurality of excitation lights by irradiating a sample with each of excitation lights having a plurality of wavelength distributions, and causes a computer to function as an intensity ratio calculation unit that calculates an intensity ratio for each of the plurality of excitation lights, the intensity ratio being the ratio between the intensity value of the pixel in the first fluorescence image and the intensity value of the pixel in the second fluorescence image corresponding to the pixel, and calculates the intensity ratio for each of
- a first fluorescence image in a first optical state and a second fluorescence image in a second optical state in which fluorescence is measured with wavelength characteristics different from the first optical state are acquired for each of a plurality of fluorescence corresponding to each of a plurality of excitation lights. Furthermore, an intensity ratio, which is a ratio between the intensity value of the pixel in the first fluorescence image and the intensity value of the pixel in the second fluorescence image, is calculated, and an intensity ratio for each of a plurality of excitation lights is calculated. In addition, based on the intensity ratio for each of the plurality of excitation lights, it is determined whether the pixel is a monochromatic pixel.
- FIG. 1 is a schematic configuration diagram of a fluorescence image acquisition system 1 according to a first embodiment.
- FIG. 2 is a perspective view showing the configuration of the fluorescent image acquisition system 1 of FIG. 1.
- 2 is a block diagram showing an example of a hardware configuration of the image processing device 4 in FIG. 1 .
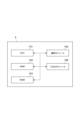
- FIG. 2 is a block diagram showing a functional configuration of the image processing device 4 in FIG. 1 .
- 5A and 5B are diagrams for explaining the fluorescence intensities of a first fluorescent image and a second fluorescent image.
- 10A and 10B are diagrams for explaining characteristics of an intensity ratio in a first pixel for a first excitation light and an intensity ratio in the first pixel for a second excitation light;
- FIG. 13 is a diagram illustrating a schematic diagram of the characteristics of the intensity ratio.
- FIG. 13 is a diagram showing an image of a group of pixels clustered by the clustering unit 204. 13 shows an image of matrix data Y' regenerated by the statistical value calculation unit 205 and its corresponding dye matrix data X'. 4 is a flowchart showing the steps of a fluorescence image acquiring method according to the first embodiment.
- FIG. 11 is a schematic configuration diagram of a fluorescence image acquisition system 1A according to a second embodiment. 11 is a diagram for explaining the intensity ratio of each pixel when a color camera is used.
- FIG. FIG. 13 is a diagram for explaining the intensity ratio of each pixel when a hyperspectral camera is used.
- FIG. 13 is a schematic configuration diagram of a fluorescence image acquisition system 1B according to a third embodiment.
- FIG. 11 is a schematic configuration diagram of a fluorescence image acquisition system 1A according to a second embodiment. 11 is a diagram for explaining the intensity ratio of each pixel when a color camera is used.
- FIG. 13 is a
- FIG. 13 is a schematic configuration diagram of a fluorescence image acquisition system 1C according to a fourth embodiment.
- FIG. 13 is a diagram showing the results of clustering in an example of generating a fluorescent image.
- FIG. 13 is a diagram showing the results of generating fluorescent images from each dye in an example of generating a fluorescent image.
- FIG. 1 is a schematic diagram of a fluorescence image acquisition system 1, which is a fluorescence image acquisition device according to a first embodiment.
- the fluorescence image acquisition system 1 is a device for generating a fluorescence image for identifying the distribution of a pigment in a sample such as a biological tissue to be observed.
- the image generated by the fluorescence image acquisition system 1 is used for purposes such as drug development and treatment method research through analysis of the image.
- the fluorescence image acquisition system 1 includes an irradiation device 2 configured to irradiate excitation light onto a sample S, an image acquisition device 3 that irradiates the sample S with excitation light and acquires an image of the fluorescence generated in response to the irradiation, and an image processing device 4 that processes the image acquired by the image acquisition device 3.
- the image acquisition device 3 and the image processing device 4 may be configured to be capable of transmitting and receiving image data between them using wired communication or wireless communication, or may be configured to be capable of inputting and outputting image data via a recording medium.
- FIG. 2 is a perspective view showing the configuration of the fluorescence image acquisition system 1 in FIG. 1.
- the optical path of the excitation light is indicated by a dotted line with an arrow
- the optical path of the fluorescence is indicated by a solid line with an arrow.
- the irradiation device 2 includes an excitation light source 2a and an excitation light filter section 2b.
- the image acquisition device 3 includes a dichroic mirror 11, a fluorescence filter section 3a, a first optical filter 13, and a first camera 15.
- the excitation light source 2a is a light source capable of switching between and irradiating excitation light of multiple wavelength bands (wavelength distributions), and is, for example, an LED (Light Emitting Diode) light source, a light source consisting of multiple monochromatic laser light sources, or a light source combining a white light source and a wavelength selection optical element.
- the excitation light filter unit 2b is a multi-bandpass filter provided on the optical path of the excitation light of the excitation light source 2a and having the property of transmitting light of multiple predetermined wavelength bands. The transmission wavelength band of this excitation light filter unit 2b is set according to the multiple wavelength bands of the excitation light that can be used.
- the dichroic mirror 11 is provided between the excitation light filter unit 2b and the sample S, and is an optical member that reflects the excitation light toward the sample S and transmits the fluorescence emitted from the sample S accordingly.
- the irradiation device 2 irradiates excitation light of M wavelength bands (M is an integer of 2 or more).
- M is an integer of 2 or more.
- the excitation light of the M wavelength bands is referred to as the first excitation light, the second excitation light, ..., and the M excitation light.
- the fluorescence filter section 3a is a multi-bandpass filter that is provided on the optical path of the fluorescence transmitted by the dichroic mirror 11 and has the property of transmitting light in a predetermined number of wavelength ranges.
- the fluorescence filter section 3a has a number of reflection wavelength ranges and a number of transmission wavelength ranges.
- the reflection wavelength ranges and the transmission wavelength ranges are arranged alternately.
- the reflection wavelength ranges are, for example, wavelength ranges between the transmission wavelength ranges.
- the transmission wavelength ranges of this fluorescence filter section 3a are set according to the wavelength range of the fluorescence generated in the pigment that may be contained in the sample S to be observed.
- the first optical filter 13 is an optical system that is provided on the optical path of the fluorescence transmitted by the fluorescence filter unit 3a and that acquires wavelength information of the fluorescence.
- the first optical filter 13 includes a switching mechanism (not shown) that can switch the position of the first optical filter 13 so as to slide between a position on the optical path of the fluorescence from the fluorescence filter unit 3a and a position off the optical path.
- a state in which the first optical filter 13 is provided on the optical path of the fluorescence and thereby wavelength information of the fluorescence can be acquired via the first optical filter 13 is referred to as a first optical state
- a state in which the first optical filter 13 is not provided on the optical path of the fluorescence and thus wavelength information of the fluorescence can be acquired without the first optical filter 13 is referred to as a second optical state.
- the image acquisition device 3 can measure fluorescence in the first optical state and in the second optical state in which fluorescence is measured with wavelength characteristics different from those of the first optical state.
- the first optical filter 13 is a filter having a different transmittance in each reflection wavelength range or each transmission wavelength range of the fluorescent filter section 3a.
- the first optical filter 13 is a gradient filter having a wavelength characteristic of transmittance such that the transmittance increases linearly as the wavelength increases. That is, the transmittance of the first optical filter 13 increases monotonically across each transmission wavelength range of the fluorescent filter section 3a.
- the first optical filter 13, which is such a gradient filter is also referred to as the first gradient filter 13.
- the first optical filter 13 may be a gradient filter having a wavelength characteristic of transmittance such that the transmittance decreases linearly as the wavelength increases.
- the first optical filter 13 may be a gradient filter whose transmittance changes monotonically across each reflection wavelength range of the fluorescent filter section 3a.
- the first camera 15 is an imaging device that captures a two-dimensional image composed of N pixels (N is an integer equal to or greater than 2, for example, 2048 ⁇ 2048), and is a camera that captures the fluorescence passing through the first gradient filter 13 when the first gradient filter 13 is placed on the optical path of the fluorescence to obtain a first fluorescence image. That is, the first fluorescence image is a fluorescence image acquired in the first optical state. Also, when the first gradient filter 13 is removed from the optical path of the fluorescence, the first camera 15 captures the fluorescence to obtain a second fluorescence image. That is, the second fluorescence image is a fluorescence image acquired in the second optical state.
- the first camera 15 outputs the acquired first and second fluorescence images to the image processing device 4 by communication or via a recording medium.
- the N pixels are respectively referred to as a first pixel, a second pixel, ..., and an Nth pixel.
- Figure 3 is a block diagram showing an example of the hardware configuration of the image processing device 4
- Figure 4 is a block diagram showing the functional configuration of the image processing device 4.
- the image processing device 4 is physically a computer or the like including a processor, a CPU (Central Processing Unit) 101, a recording medium, a RAM (Random Access Memory) 102 or a ROM (Read Only Memory) 103, a communication module 104, and an input/output module 106, each of which is electrically connected.
- the image processing device 4 may include a display, keyboard, mouse, touch panel display, etc. as input/output devices, or may include a data recording device such as a hard disk drive or semiconductor memory.
- the image processing device 4 may also be composed of multiple computers.
- the image processing device 4 includes, as functional components, an image acquisition unit 201, an intensity ratio calculation unit 202, a single-color pixel discrimination unit 203, a clustering unit 204, a statistical value calculation unit 205, and an image generation unit 206.
- Each functional unit of the image processing device 4 shown in FIG. 4 is realized by loading a program (a fluorescent image acquisition program according to the embodiment) onto hardware such as the CPU 101 and the RAM 102, and operating the communication module 104 and the input/output module 106 under the control of the CPU 101, and reading and writing data in the RAM 102.
- the CPU 101 of the image processing device 4 executes this computer program to cause each functional unit of FIG.
- the CPU 101 may be a standalone piece of hardware, or may be implemented in a programmable logic such as an FPGA, like a software processor.
- the RAM and ROM may also be standalone pieces of hardware, or may be built into a programmable logic such as an FPGA. All of the various data required to execute this computer program and all of the various data generated by executing this computer program are stored in built-in memories such as ROM 103 and RAM 102, or in storage media such as a hard disk drive.
- the functions of the functional components of the image processing device 4 are described in detail below.
- the image acquisition unit 201 acquires a first fluorescence image and a second fluorescence image for each of the first to Mth excitation lights from the image acquisition device 3.
- the first fluorescence image is a fluorescence image acquired in a first optical state for a plurality of fluorescence lights corresponding to each of the first to Mth excitation lights irradiated from the irradiation device 2.
- the second fluorescence image is a fluorescence image acquired in a second optical state for a plurality of fluorescence lights corresponding to each of the first to Mth excitation lights irradiated from the irradiation device 2.
- part (a) shows the wavelength characteristic of the fluorescence intensity of the first fluorescence image acquired in the first optical state
- part (b) shows the wavelength characteristic of the fluorescence intensity of the second fluorescence image acquired in the second optical state.
- FI1, FI2, and FI3 respectively indicate the fluorescence intensity of the first fluorescence, the second fluorescence, and the third fluorescence that have passed through the first gradient filter 13.
- FI4, FI5, and FI6 respectively indicate the fluorescence intensity of the first fluorescence, the second fluorescence, and the third fluorescence that have not passed through the first gradient filter.
- T1 typically indicates the transmittance in the transmission wavelength range of the fluorescence filter section 3a.
- the magnitudes of the fluorescence intensities are approximately the same, but as shown in part (a) of FIG. 5, in the first optical state, the fluorescence intensity FI1 of the first fluorescence increases, followed by the fluorescence intensity FI2 of the second fluorescence and the fluorescence intensity FI3 of the third fluorescence. This is because the transmittance of the first gradient filter 13 increases linearly as the wavelength increases.
- the intensity ratio calculation unit 202 calculates an intensity ratio that is a ratio between an intensity value of a pixel of the first fluorescence image and an intensity value of a pixel of the second fluorescence image corresponding to the pixel for the first to Mth excitation lights, for the first and second fluorescence images acquired for each of the first to Mth excitation lights.
- the intensity ratio calculation unit 202 calculates the intensity ratio R mn based on the measured intensity values.
- the intensity ratio is a ratio of the intensity value of the pixel of the first fluorescence image to the intensity value of the pixel of the second fluorescence image.
- the intensity ratio may be a ratio of the intensity value of the pixel of the second fluorescence image to the intensity value of the pixel of the first fluorescence image.
- the characteristics of the intensity ratio R 11 in the first pixel for the first excitation light and the intensity ratio R 21 in the first pixel for the second excitation light will be described as an example with reference to Fig. 6.
- Fig. 6 it is assumed as an example that one type of first dye is irradiated with the first excitation light and the second excitation light.
- the excitation light spectra ES1 and ES2 of the first excitation light and the second excitation light are shown for the absorption spectrum AS of the first dye.
- the transmittance T1 in the transmission wavelength range of the fluorescent filter unit 3a and the transmittance T2 of the first gradient filter 13 taking the transmittance T1 into account are shown for the fluorescence spectrum FS of the first dye.
- the intensity value I 11 of the first pixel acquired in the first optical state when the first excitation light is irradiated can be calculated as shown in the following formula (1).
- the intensity value I12 of the first pixel acquired in the second optical state when irradiated with the first excitation light can be calculated as in the following formula (2).
- An intensity value I21 of the first pixel acquired in the first optical state when irradiated with the second excitation light can be calculated as in the following formula (3):
- an intensity value I22 of the first pixel acquired in the second optical state when irradiated with the second excitation light can be calculated as in the following formula (4):
- the intensity ratio R11 at the first pixel corresponding to the first excitation light is calculated as shown in the following formula (5).
- the intensity ratio R21 at the first pixel corresponding to the second excitation light is calculated as shown in the following formula (6).
- the intensity ratio R'11 in the first pixel corresponding to the first excitation light and the intensity ratio R'21 in the first pixel corresponding to the second excitation light will be described.
- the absorption spectrum of the second dye is f'AS ( ⁇ )
- the fluorescence spectrum of the second dye is f'FS ( ⁇ ).
- the intensity ratios R'11 and R'21 are calculated according to the following formulas (7) and (8).
- the intensity ratio R'11 depends on the first excitation light.
- the intensity ratio R'21 depends on the second excitation light. That is, the intensity ratio R'11 and the intensity ratio R'21 do not have the same value.
- FIG. 7 is a graph that shows a schematic of the intensity ratio RX1 when the first pixel reflects the fluorescence from the first dye, the intensity ratio RX2 when the first pixel reflects the fluorescence from the second dye, and the intensity ratio RX3 when the first pixel reflects a mixture of the fluorescence from the first dye and the second dye.
- FIG. 7 shows the intensity ratios for the first to third excitation lights. As shown in FIG. 7, the intensity ratios RX1 and RX2 have the same value for each excitation light, whereas the intensity ratio RX3 has a different value for each excitation light. Furthermore, as shown in FIG. 7, the intensity ratios RX1 and RX2 have different values from each other.
- the transmittance T2 (i.e., S T2 ) of the first inclined filter 13 taking into account the transmittance T1 is a value that depends on the wavelength ⁇
- the transmittance T1 (i.e., S T1 ) in the transmission wavelength range of the fluorescent filter section 3a is a value that depends on the wavelength ⁇ . If S T1 and S T2 are constants independent of the wavelength ⁇ , the intensity ratio will be a constant, and the intensity ratios RX1 and RX2 will be the same value.
- the monochrome pixel discrimination section 203 described later can determine whether a pixel is a monochrome pixel based on the characteristics of such intensity ratios.
- the monochromatic pixel discrimination unit 203 discriminates whether each pixel is a monochromatic pixel based on the intensity ratio for each of the first to Mth excitation lights.
- the monochromatic pixel discrimination unit 203 calculates indices V1 to VN of the variation in the intensity ratio for each of the first to Mth excitation lights for each of the first to Nth pixels, and discriminates whether each pixel is monochromatic based on the indices.
- the method of calculating the index V1 for the first pixel by the monochromatic pixel discrimination unit 203 will be described below.
- the monochromatic pixel discrimination unit 203 calculates the indices V2 to VN in the same manner as the index V1 .
- the monochromatic pixel discrimination unit 203 calculates the index V1 by, for example, the following formula (9).
- R ave1 is the average value of the intensity ratios R 11 to R M1 of the first to Mth excitation lights in the first pixel.
- the monochromatic pixel discrimination unit 203 can easily calculate the index V1 .
- R ave1 is calculated by, for example, the following formula (10) or (11).
- y 1i is the intensity of the first pixel in the first optical state when irradiated with the ith excitation light
- y 2i is the intensity of the first pixel in the second optical state when irradiated with the ith excitation light.
- R ave1 is not limited to the following formulas (10) and (11), and may be a weighted average or an intermediate value of R 11 to R M1 .
- the monochromatic pixel discrimination unit 203 calculates the index V 1 by the following formula (12).
- ⁇ i1 is the noise of R i1 .
- the noise ⁇ i1 is calculated by the following formula (13).
- y′ 1i is the intensity when y 1i is converted into the number of electrons
- y′ 2i is the intensity when y 2i is converted into the number of electrons
- ⁇ is the readout noise of the CMOS camera. Note that if shot noise is dominant, the readout noise ⁇ can be ignored.
- the monochromatic pixel discrimination unit 203 follows a chi-square distribution with degrees of freedom M ⁇ 1, so that the threshold value described later can be set regardless of the sample S.
- the single-color pixel discrimination unit 203 calculates the index V1 by the following formula (14).
- p is a constant equal to or greater than 1
- w i is a weight corresponding to the i-th excitation light
- RF i is, for example, R ave1 , an intensity ratio calculated from dye reference information, or a statistical value of intensity ratios calculated from a plurality of pixels.
- RF i may be changed for each excitation light in consideration of the measurement conditions for each excitation light, noise, the influence of background light, and the like. Alternatively, it may be an arbitrary value.
- R i1 may be replaced with a function G(R i1 ) related to R i1 .
- the indicators V 1 to V N are not limited to the indicators of the above formulas (9) to (14), and may be indicators other than the above formulas (9) to (14) as long as they can evaluate the variation in the intensity ratio.
- the monochromatic pixel discrimination unit 203 discriminates whether each of the first to Nth pixels is a monochromatic pixel based on the indices V 1 to V N calculated as described above. As an example, the monochromatic pixel discrimination unit 203 discriminates a pixel whose variation index is equal to or smaller than a threshold value as a monochromatic pixel, and discriminates a pixel whose variation index is greater than the threshold value as not being a monochromatic pixel.
- the threshold value may be a value preset by the user, or may be determined by the monochromatic pixel discrimination unit 203.
- the threshold value is determined by the monochromatic pixel discrimination unit 203 is not limited to the case where it is automatically determined by the monochromatic pixel discrimination unit 203, and the monochromatic pixel discrimination unit 203 may determine the threshold value according to parameters input by the user.
- the clustering unit 204 performs clustering on a plurality of pixels (hereinafter, referred to as "a plurality of monochromatic pixels") that are determined to be monochromatic pixels by the monochromatic pixel determination unit 203. Prior to the clustering process, the clustering unit 204 generates matrix data Y in which the values of fluorescence intensity of N pixels that constitute each of the C fluorescent images, each of which is composed of N pixels, are arranged in parallel in a one-dimensional manner, and the C fluorescent images are obtained by irradiating a sample with each of excitation lights having a wavelength distribution of C (C is an integer of 2 or more).
- the C fluorescent images may be a compilation of M first fluorescent images and M second fluorescent images acquired by the image acquisition device 3 by irradiating the sample with the first to Mth excitation lights, or may be M second fluorescent images.
- the C fluorescent images may be C fluorescent images captured in the second optical state by irradiating the sample with C excitation lights separately from the first to Mth excitation lights.
- the clustering unit 204 clusters the multiple monochrome pixels into L pixel groups (L is an integer between 2 and N-1) based on the average value of the intensity ratios of each of the multiple monochrome pixels.
- the number L of pixel groups to be clustered is set in advance as a parameter stored in the image processing device 4, for example, corresponding to the number of types of dyes that can be present in the sample S.
- the number L of pixel groups may be determined according to the type of excitation light or the number C of wavelength distributions of the excitation light, or may be determined independently of the type of excitation light or the number C of wavelength distributions of the excitation light.
- the average values of the intensity ratios of monochrome pixels of the same color are the same or close to each other.
- the clustering unit 204 clusters the multiple monochrome pixels into L pixel groups by determining the distance (closeness of value) between the average values of the intensity ratios for each of the multiple monochrome pixels.
- the clustering unit 204 divides and regenerates matrix data Y, in which the fluorescence intensity values of the pixels of the C fluorescent images are arranged in parallel in one dimension, into cluster matrices for each of the L pixel groups.
- the average value of the intensity ratios of the multiple single-color pixels is, for example, a simple average or a weighted average. The average value may be calculated using other calculation methods.
- the clustering unit 204 may perform clustering based on the median value of the intensity ratios of the multiple single-color pixels.
- the clustering unit 204 may perform clustering based on the intensities of each of the C excitation lights of the multiple single-color pixels.
- Fig. 8 shows an image of pixel groups clustered by the clustering unit 204.
- the sample S contains three types of dyes, dye C1 , dye C2 , and dye C3 , and the clustering unit 204 clusters a plurality of single-color pixels into three pixel groups PGr1 to PGr3 .
- the statistical value calculation unit 205 obtains a mixing matrix A for generating K dye images showing the respective distributions of K dyes (K is an integer between 2 and C) from C fluorescent images, based on L cluster matrices obtained for the sample S.
- K is an integer between 2 and C
- NMF non-negative matrix factorization
- the relationship between matrix data Y, which is an observation matrix, and dye matrix data X, in which K dye images are arranged in parallel in a one-dimensional manner for each pixel is expressed by the following formula using the mixing matrix A:
- Y AX
- Y matrix data of C rows and N columns
- A matrix data of C rows and K columns
- X matrix data of K rows and N columns.
- the statistical value calculation unit 205 regenerates matrix data Y' by compressing the matrix data Y generated by the clustering unit 204 in units of pixel groups clustered by the clustering unit 204.
- the statistical value calculation unit 205 calculates a statistical value for each pixel group of the clustered cluster matrix for the fluorescence intensity of each row of the matrix data Y, and compresses the pixel group of each row into one pixel having the calculated statistical value.
- the statistical value calculation unit 205 regenerates matrix data Y' which is matrix data of C rows and L columns.
- the statistical value calculation unit 205 may calculate, as the statistical value, an average value based on the integrated value of the fluorescence intensity, may calculate the most frequent value of the fluorescence intensity, or may calculate the median value of the fluorescence intensity.
- Fig. 9 shows an image of the matrix data Y' regenerated by the statistical value calculation unit 205, and the corresponding dye matrix data X'.
- One square shown in Fig. 9 represents one element of the matrix data.
- the dye matrix data X and matrix data Y divided into three pixel groups PGr 1 to PGr 3 are compressed into three columns of dye matrix data X' and matrix data Y', with the statistical values for each of the pixel groups PGr 1 to PGr 3 being used as representative values.
- the statistical value calculation unit 205 derives the mixing matrix A based on the matrix data Y' as follows. That is, the statistical value calculation unit 205 sets an initial value to the mixing matrix A, calculates the loss function (loss value) Los of the following formula (15) while sequentially changing the value of the mixing matrix A, and derives the mixing matrix A that reduces the value of the loss function Los. Note that a regularization term such as the L1 norm ⁇
- j is a parameter indicating the row position of the matrix data (corresponding to the wavelength band of the excitation light)
- the matrix subscript 1j indicates the matrix data of the jth row of the first cluster matrix
- the matrix subscript 2j indicates the matrix data of the jth row of the second cluster matrix
- the matrix subscript 3j indicates the matrix data of the jth row of the third cluster matrix
- the parameters a, b, and c indicate the average values of the statistics of each column of the matrix data Y'.
- the statistical value calculation unit 205 calculates a loss function for each of the L cluster matrices divided by the clustering unit 204 by referring to the statistical values of the C pieces of matrix data Y', calculates the loss function Los based on the sum of the L loss functions, and obtains the mixing matrix A based on the loss function Los. At this time, the statistical value calculation unit 205 corrects the loss function calculated for each of the L cluster matrices by dividing it by the average values a, b, and c of the statistical values of the C pieces of matrix data Y', and then obtains the loss function Los by calculating the sum of the corrected loss functions.
- the statistical value calculation unit 205 may calculate the loss function for each of the L cluster matrices by correcting the row components of the difference value Y'-AX' for each wavelength band of the excitation light by dividing them by the C statistical values corresponding to each wavelength band of the excitation light.
- the statistical value calculation unit 205 may generate the mixing matrix A as follows. For each of the C fluorescent images, the statistical value calculation unit 205 may calculate the above statistical value for each of the L clustered pixel groups, and then arrange the calculated statistical values for each of the C fluorescent images to generate a mixing matrix A with C rows and L columns. That is, the mixing matrix A may be the same as the matrix data Y'. In this case, the number of clusters and the number of dyes are equal, making it easier to generate the mixing matrix A.
- the image generating unit 206 obtains K dye images by unmixing C fluorescent images obtained from the sample S to be observed using the mixing matrix A derived by the statistical value calculating unit 205. Specifically, the image generating unit 206 calculates dye matrix data X by applying the inverse matrix A ⁇ 1 of the mixing matrix A to matrix data Y generated by the clustering unit 204 based on the C fluorescent images. Then, the image generating unit 206 reproduces K dye images from the dye matrix data X, and outputs the reproduced K dye images.
- the output destination at this time may be an output device of the image processing device 4, such as a display or a touch panel display, or may be an external device connected to the image processing device so as to be able to communicate data with the image processing device.
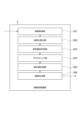
- FIG. 10 is a flowchart showing the procedure for the observation process using the fluorescence image acquisition system 1.
- the irradiation device 2 irradiates the sample S with each of the excitation lights having a plurality of wavelength distributions (step S1; irradiation step).
- the image acquisition unit 201 of the image processing device 4 acquires a first fluorescence image in the first optical state and a second fluorescence image in the second optical state in which the fluorescence is measured with wavelength characteristics different from the first optical state through the fluorescence filter unit 3a for each of the plurality of fluorescence corresponding to each of the plurality of excitation lights (step S2; acquisition step).
- step S2 includes a first acquisition step of imaging the fluorescence in the first optical state and acquiring the first fluorescence image, and a second acquisition step of imaging the fluorescence in the second optical state and acquiring the second fluorescence image.
- steps S1 and S2 may be repeated alternately. For example, after irradiating the first excitation light in the irradiation step and acquiring the first fluorescence image in the first acquisition step, the irradiation step may be returned to and the first excitation light may be irradiated and the second fluorescence image may be acquired in the second acquisition step, or the irradiation step may be returned to and the second excitation light may be irradiated thereafter.
- the intensity ratio calculation section 202 of the image processing device 4 calculates an intensity ratio for the first and second fluorescent images, which is the ratio between the intensity value of a pixel in the first fluorescent image and the intensity value of a pixel in the second fluorescent image corresponding to that pixel, and calculates the intensity ratio for each of the multiple excitation lights (step S3; calculation step).
- the monochromatic pixel discrimination section 203 of the image processing device 4 discriminates whether the pixel is a monochromatic pixel based on the intensity ratio for each of the multiple excitation lights (step S4; discrimination step).
- the clustering unit 204 of the image processing device 4 clusters a plurality of pixels determined to be monochromatic pixels in the discrimination step into L pixel groups for C fluorescence images obtained by irradiating the sample with excitation light of each of C wavelength distributions, each of which is composed of N pixels (step S5; clustering step).
- the clustering unit 204 of the image processing device 4 generates matrix data Y in which the N pixels of the C fluorescence images are arranged in parallel (step S6; clustering step).
- the statistical value calculation unit 205 of the image processing device 4 calculates the statistical values of the L pixel groups, thereby regenerating matrix data Y' based on the matrix data Y generated by the clustering unit 204 (step S7; calculation step).
- the statistical value calculation unit 205 of the image processing device 4 derives a mixing matrix A based on the matrix data Y' (step S8; image generation step).
- the image generation unit 206 of the image processing device 4 unmixes the matrix data Y generated based on the C fluorescent images of the sample S using the mixing matrix A, thereby regenerating K dye images (step S9; image generation step).
- the image generation unit 206 of the image processing device 4 outputs the regenerated K dye images (step S10).
- a first fluorescence image in a first optical state and a second fluorescence image in a second optical state in which the fluorescence is measured with wavelength characteristics different from the first optical state are acquired. Furthermore, an intensity ratio, which is the ratio between the intensity value of the pixel in the first fluorescence image and the intensity value of the pixel in the second fluorescence image, is calculated, and an intensity ratio for each of the multiple excitation lights is calculated. In addition, based on the intensity ratio for each of the multiple excitation lights, it is determined whether the pixel is a monochromatic pixel.
- the intensity ratio calculation unit 202 calculates the intensity ratio R mn , which is the ratio of intensity values at the n-th pixel.
- the intensity ratios R 1n to R Mn have the same value, or the intensity ratios R 1n to R Mn have values closer to each other than when the n-th pixel is not a monochromatic pixel.
- the monochromatic pixel discrimination unit 203 calculates an index of variation for the intensity ratios R 1n to R Mn and determines whether the index is equal to or less than a threshold value, thereby making it possible to discriminate whether the n-th pixel is a monochromatic pixel.
- the acquisition step (step S2) includes a first acquisition step of capturing an image of the fluorescence in a first optical state using a first optical filter 13 having a different transmittance in each reflection wavelength range or each transmission wavelength range of the fluorescence filter unit 3a for each of the multiple fluorescences to acquire a first fluorescence image, and a second acquisition step of capturing an image of the fluorescence in a second optical state for each of the multiple fluorescences to acquire a second fluorescence image.
- This improves the accuracy of discrimination of monochromatic pixels.
- the transmission characteristics or reflection characteristics of the multiple fluorescences can be changed between multiple wavelength ranges, and monochromatic images of multiple colors can be further distinguished.
- the first optical state can be easily established, and the first fluorescence image can be easily acquired.
- the first optical filter 13 is a first gradient filter 13 whose transmittance changes monotonically across each transmission wavelength range.
- the transmittance can be changed monotonically across each transmission wavelength range, and monochromatic images of multiple colors can be distinguished with even greater accuracy.
- the first optical state can be easily achieved, and the first fluorescent image can be easily acquired.
- the fluorescence is imaged in the second optical state in which the first optical filter 13 is removed. Since the second optical state can be achieved by removing the first optical filter 13, the second optical state can be achieved more easily. Therefore, the second fluorescence image can be acquired more easily.
- the image processing device 4 targets C fluorescence images, each of which is composed of N pixels (N is an integer of 2 or more) and is obtained by irradiating a sample with excitation light having each of C wavelength distributions (C is an integer of 2 or more), and clusters a plurality of pixels determined to be monochromatic pixels into L pixel groups (L is an integer of 2 or more and N-1 or less), generates L cluster matrices in which the C fluorescence images are arranged for each clustered pixel group, calculates statistics of the intensity values of the pixel groups constituting the C fluorescence images for each of the L cluster matrices, and performs unmixing on the C fluorescence images using the statistics of the C fluorescence images for each of the L cluster matrices, thereby generating K fluorescence images showing the distribution of each of K dyes (K is an integer of 2 or more and C or less).
- a plurality of pixels determined to be monochromatic pixels are clustered into L pixel groups, and L cluster matrices are generated in which the C fluorescence images, each of which is obtained by irradiating a sample with excitation light having each of C wavelength distributions, are arranged for each clustered pixel group.
- the statistical values of the intensity values of the pixel groups that make up the C fluorescent images are calculated for each of the L cluster matrices, and the C fluorescent images are unmixed using the statistical values of each of the C fluorescent images to generate K fluorescent images. This makes it possible to obtain separated images for each dye with high accuracy.
- the clustering unit 204 can cluster the monochrome pixels into L pixel groups by, for example, determining the distance (closeness of value) between the average values of the intensity ratios of the monochrome pixels.
- the average value of the intensity ratios of the monochrome pixels is, for example, a simple average or a weighted average. The average value may be calculated using other calculation methods.
- the clustering unit 204 may perform clustering by determining the distance between the median values of the intensity ratios of the monochrome pixels.
- the clustering unit 204 may perform clustering based on the intensity of each of the C excitation lights for each of the monochrome pixels.
- Fig. 11 is a schematic configuration diagram of a fluorescence image acquisition system 1A which is a fluorescence image acquisition device according to the second embodiment.
- the configuration of an image acquisition device 3A differs from the configuration of the image acquisition device 3 of the fluorescence image acquisition system 1.
- the image acquisition device 3A does not include a first optical filter 13.
- the image acquisition device 3A includes a first camera 15A having a different configuration from the first camera 15.
- the first camera 15A is a camera that acquires at least two or more fluorescence images obtained by measuring the fluorescence from the sample S with different wavelength characteristics.
- the first camera 15A can capture each of the multiple fluorescence images and acquire multiple fluorescence images including at least a first fluorescence image and a second fluorescence image.
- a color camera or a hyperspectral camera can be used as the first camera 15A.
- the color camera captures multiple images separated for RGB components as follows.
- the color camera is provided with specific color filters, for example red, green, and blue color filters, corresponding to each pixel on the solid-state imaging element.
- An element with a red filter is referred to as an R element
- an element with a green filter is referred to as a G element
- an element with a blue filter is referred to as a B element.
- the R element, G element, and B element are arranged in a mosaic pattern.
- the B element captures only the B component (blue component) of the fluorescent light, and the R component (red component) and G component (green component) of the fluorescent light in the B element are interpolated by Bayer conversion processing.
- the color camera can capture multiple images separated for RGB components.
- the Bayer conversion processing is a process that uses a certain algorithm to supplement the missing colors from the surrounding elements.
- the image acquisition unit 201 can acquire a first fluorescence image and a second fluorescence image from multiple images separated into RGB components.
- the image of the G component is referred to as the first fluorescence image
- the image of the B component is referred to as the second fluorescence image.
- FIG. 12 is a diagram showing the spectral characteristics of each filter with respect to the fluorescence spectrum.
- SC1 is the spectral characteristic of a red filter
- SC2 is the spectral characteristic of a green filter
- SC3 is the spectral characteristic of a blue filter.
- the spectral characteristic of the green filter is S G ( ⁇ )
- the spectral characteristic of the blue filter is S B ( ⁇ ).
- the intensity ratio does not depend on the first excitation light. Therefore, in the second embodiment, it is possible to determine whether each pixel is a monochromatic pixel by calculating the intensity ratio for each of the multiple excitation lights.
- the intensity of each pixel may be multiplied by a coefficient generated during the Bayer conversion process. Since this coefficient does not depend on the excitation light, even when this coefficient is applied, the intensity ratio of a single-color pixel does not depend on the excitation light.
- the hyperspectral camera When a hyperspectral camera is used as the first camera 15A, multiple images separated according to different wavelength characteristics can be obtained by capturing an image of each of the multiple fluorescent lights once.
- the hyperspectral camera acquires multiple images separated according to different wavelength characteristics as follows.
- filters of various wavelength bands are arranged in a mosaic pattern at each pixel on the solid-state imaging element.
- the image acquisition unit 201 acquires a first fluorescent image and a second fluorescent image from the multiple images separated according to different wavelength characteristics.
- the 16 wavelength bands of the hyperspectral camera correspond to, for example, wavelengths of 465 nm, 474 nm, 485 nm, 496 nm, 510 nm, 522 nm, 534 nm, 546 nm, 548 nm, 562 nm, 578 nm, 586 nm, 600 nm, 608 nm, 624 nm, and 630 nm, respectively, and the image acquired using a filter in the wavelength band corresponding to 474 nm is referred to as the first fluorescence image, and the image acquired using a filter in the wavelength band corresponding to 630 nm is referred to as the second fluorescence image.
- FIG. 13 is a diagram showing the spectral characteristics of each filter for the fluorescence spectrum.
- SC4 is the spectral characteristic of a filter of a wavelength band corresponding to 474 nm
- SC5 is the spectral characteristic of a filter of a wavelength band corresponding to 630 nm.
- the spectral characteristic of the filter of the wavelength band corresponding to 474 nm is S 474 ( ⁇ )
- the spectral characteristic of the filter of the wavelength band corresponding to 630 nm is S 630 ( ⁇ ).
- the intensity ratio does not depend on the first excitation light. Therefore, in the second embodiment, it is possible to determine whether each pixel is a monochromatic pixel by calculating the intensity ratio for each of the multiple excitation lights.
- the hyperspectral camera may disperse the fluorescence using a spectrometer rather than using a filter on a solid-state imaging element.
- the fluorescence is dispersed into multiple wavelength bands by entering the spectrometer through a lens, and the fluorescence for each wavelength band is received by the imaging element, so that each pixel has information on multiple wavelength bands.
- the image acquisition unit 201 can acquire the first fluorescence image and the second fluorescence image from the multiple images separated according to different wavelength characteristics.
- the image acquisition device 3A also captures each of the multiple fluorescent lights, thereby acquiring a first fluorescence image and a second fluorescence image. Therefore, the fluorescence image acquisition system 1A also achieves the same effects as the fluorescence image acquisition system 1 according to the first embodiment. Furthermore, both the first fluorescence image and the second fluorescence image can be acquired by capturing each of the multiple fluorescent lights once. Therefore, the first fluorescence image and the second fluorescence image can be acquired efficiently.
- the image acquisition device 3A captures each of the multiple fluorescent lights using, for example, a color camera.
- a color camera By capturing an image of each of the multiple fluorescent lights once using the color camera, multiple images separated for each RGB component, for example, can be acquired. From these multiple images, a first fluorescent image and a second fluorescent image can be acquired.
- the image acquisition device 3A captures each of the multiple fluorescent lights using, for example, a hyperspectral camera.
- a hyperspectral camera By capturing an image of each of the multiple fluorescent lights once using the hyperspectral camera, multiple images separated according to different wavelength characteristics can be acquired. From these multiple images, a first fluorescent image and a second fluorescent image can be acquired.
- FIG. 14 is a schematic configuration diagram of a fluorescence image acquisition system 1B which is a fluorescence image acquisition device according to the third embodiment.
- An image acquisition device 3B of the fluorescence image acquisition system 1B further includes a second camera 17 in addition to the configuration of the image acquisition device 3 of the fluorescence image acquisition system 1.
- the second camera 17 is a camera having the same configuration as the first camera 15, for example.
- the second camera 17 is a camera that captures the fluorescence reflected by the first gradient filter 13 when the first gradient filter 13 is placed on the optical path of the fluorescence to obtain a second fluorescence image. That is, in the fluorescence image acquisition system 1B, the fluorescence passing through the first gradient filter 13 is captured by the first camera 15 to obtain a first fluorescence image, and the fluorescence reflected by the first gradient filter 13 is captured by the second camera 17 to obtain a second fluorescence image.
- the fluorescence that passes through the first gradient filter 13 is captured by the first camera 15, and the fluorescence that is reflected by the first gradient filter 13 is captured by the second camera 17, thereby acquiring a first fluorescence image and a second fluorescence image. Therefore, the fluorescence image acquisition system 1B also achieves the same effects as the fluorescence image acquisition system 1 according to the first embodiment.
- FIG. 15 is a schematic configuration diagram of a fluorescence image acquisition system 1C that is a fluorescence image acquisition device according to the fourth embodiment.
- An image acquisition device 3C of the fluorescence image acquisition system 1C further includes a second optical filter 19 in addition to the configuration of the image acquisition device 3 of the fluorescence image acquisition system 1.
- the image acquisition device 3C is provided with a switching mechanism (not shown) that can switch between the first optical filter 13 and the second optical filter 19 so as to switch from a state in which the first optical filter 13 is provided on the optical path of the fluorescence from the fluorescence filter unit 3a to a state in which the second optical filter 19 is provided on the optical path of the fluorescence from the fluorescence filter unit 3a.
- a switching mechanism (not shown) that can switch between the first optical filter 13 and the second optical filter 19 so as to switch from a state in which the first optical filter 13 is provided on the optical path of the fluorescence from the fluorescence filter unit 3a to a state in which the second optical filter 19 is provided on the optical path of the fluorescence from the fluorescence filter unit 3a.
- the second optical filter 19 has a transmittance different from that of the first optical filter 13, and is a filter whose transmittance differs in each reflection wavelength range or each transmission wavelength range of the fluorescent filter section 3a.
- the second optical filter 19 is a gradient filter having a wavelength characteristic of transmittance such that the transmittance decreases linearly as the wavelength increases. That is, the transmittance of the second optical filter 19 decreases monotonically across each transmission wavelength range of the fluorescent filter section 3a.
- the second optical filter 19, which is such a gradient filter is also referred to as the second gradient filter 19.
- the second gradient filter 19 exhibits a change in transmittance different from that of the first gradient filter 13.
- the second optical filter 19 may be a gradient filter having a wavelength characteristic of transmittance such that the transmittance increases linearly as the wavelength increases.
- the second optical filter 19 may be a gradient filter whose transmittance changes monotonically across each reflection wavelength range of the fluorescent filter section 3a.
- the first camera 15 captures the fluorescence and obtains a first fluorescence image. Also, when the second gradient filter 19 is provided on the optical path of the fluorescence, the first camera 15 captures the fluorescence and obtains a second fluorescence image.
- the fluorescence image acquisition system 1C In the fluorescence image acquisition system 1C according to the fourth embodiment described above, the fluorescence is imaged when the first gradient filter 13 is provided on the optical path of the fluorescence, and the fluorescence is imaged when the second gradient filter 19 is provided on the optical path of the fluorescence, thereby acquiring a first fluorescence image and a second fluorescence image. Therefore, the fluorescence image acquisition system 1C also achieves the same effects as the fluorescence image acquisition system 1 according to the first embodiment.
- the image acquisition device 3C captures fluorescence in a second optical state using a second gradient filter 19 that exhibits a different change in transmittance than the first gradient filter 13.
- the transmittance can be changed monotonically across each transmission wavelength range, making it possible to more accurately distinguish monochromatic images of multiple colors.
- the second optical state can be easily achieved, and the second fluorescence image can be easily acquired.
- the image acquisition device 3C captures fluorescence in a second optical state using a second optical filter 19 that has a transmittance different from that of the first optical filter 13.
- the second optical filter 19 By using the second optical filter 19, the second optical state can be easily achieved, and the second fluorescence image can be easily acquired.
- samples S11 and S21 which are red fluorescent tapes
- samples S12 and S22 which are orange fluorescent tapes
- samples S13 and S23 which are green fluorescent tapes
- samples S14 and S24 which are blue fluorescent tapes
- Part (a) of FIG. 16 is a fluorescent image obtained by capturing images of these fluorescent tapes with a monochrome camera.
- Part (b) of FIG. 16 shows a pixel group composed of blue monochrome pixels among the pixel groups clustered by the clustering unit 204. As shown in part (b) of FIG. 16, in this example, monochrome pixels are clustered with high accuracy.
- Part (a) of FIG. 17 shows a fluorescent image from a blue dye (samples S14, S24) among the dye images generated by the image generation unit 206
- part (b) of FIG. 17 shows a fluorescent image from a green dye (samples S13, S23)
- part (c) of FIG. 17 shows a fluorescent image from an orange dye (samples S12, S22)
- part (d) of FIG. 17 shows a fluorescent image from a red dye (samples S11, S21).
- fluorescent images from each dye are generated with high accuracy.
- the first camera may have a filter on the solid-state imaging element that can arbitrarily switch between a transmission wavelength range or a reflection wavelength range.
- filters include a variable bandpass filter that has the functions of a variable filter and a bandpass filter, a liquid crystal tunable filter, and an AOTF (Acousto-Optic Tunable Filter).
- the first camera may separate the fluorescence into different wavelength characteristics using a spectroscope such as a prism.
- the image processing device 4 may generate the data in which N pixels constituting the image are arranged in the row direction according to a prescribed rule, or may generate the data in which N pixels constituting the image are arranged in the row direction according to a random rule.
- the data of the fluorescence image of C rows constituting one piece of matrix data Y is set as data in which N pixels are arranged according to the same rule. Even if matrix data Y generated by random arrangement is used, the same matrix data Y' can be regenerated by clustering.
- the image processing device 4 may generate the matrix data Y by excluding background pixels (pixels that do not contain dye) contained in the fluorescence image.
- a method using machine learning such as the K-means method, a method using deep learning, etc. may be adopted.
- the image acquisition device may acquire, in addition to the first and second fluorescence images, a third fluorescence image, ..., a Qth fluorescence image in a third optical state, ..., a Qth optical state (Q is an integer equal to or greater than 3) in which fluorescence is measured with wavelength characteristics different from those of the first and second optical states. Fluorescence is measured with wavelength characteristics different from each other in the third to Qth optical states.
- the intensity ratio and variability index for each excitation light may be calculated from a combination of two fluorescence images from among the first to Qth fluorescence images, and the average of the variability indexes for all combinations may be calculated to determine whether a pixel is a monochromatic pixel.
- the acquisition step includes a first acquisition step of imaging the fluorescence in a first optical state using a first optical filter having a different transmittance in each reflection wavelength range or each transmission wavelength range of the fluorescence filter unit for each of the multiple fluorescences and acquiring a first fluorescence image, and a second acquisition step of imaging the fluorescence in a second optical state for each of the multiple fluorescences and acquiring a second fluorescence image.
- the image acquisition device images the fluorescence in a first optical state using a first optical filter having a different transmittance in each reflection wavelength range or each transmission wavelength range of the fluorescence filter unit for each of the multiple fluorescences and acquires a first fluorescence image, and images the fluorescence in a second optical state for each of the multiple fluorescences and acquires a second fluorescence image.
- the accuracy of discrimination of monochromatic pixels can be improved.
- the transmission characteristics or reflection characteristics of the multiple fluorescences can be changed between multiple wavelength ranges, and monochromatic pixels of multiple colors can be further discriminated.
- the first optical state can be easily achieved by using the first optical filter, and the first fluorescent image can be easily acquired.
- the first optical filter is a first gradient filter in which the transmittance changes monotonically across each reflection wavelength range, or the transmittance changes monotonically across each transmission wavelength range.
- the first gradient filter by using the first gradient filter, the transmittance can be changed monotonically across each reflection wavelength range, or the transmittance can be changed monotonically across each transmission wavelength range, and monochrome pixels of multiple colors can be distinguished with even greater accuracy.
- the first gradient filter by using the first gradient filter, the first optical state can be easily achieved, and the first fluorescence image can be easily acquired.
- the fluorescence is imaged in the second optical state using a second gradient filter that exhibits a different change in transmittance from the first gradient filter.
- the image acquisition device images the fluorescence in the second optical state using a second gradient filter that exhibits a different change in transmittance from the first gradient filter.
- the transmittance can be monotonically changed across each reflection wavelength range, or the transmittance across each transmission wavelength range, and monochromatic images of multiple colors can be distinguished with even greater accuracy.
- the second gradient filter the second optical state can be easily established, and the second fluorescence image can be easily acquired.
- the fluorescence is imaged in a second optical state using a second optical filter having a different transmittance from the first optical filter.
- the image acquisition device images the fluorescence in a second optical state using a second optical filter having a different transmittance from the first optical filter. In this case, the second optical state can be easily achieved by using the second optical filter, and the second fluorescence image can be easily acquired.
- the fluorescence is imaged in the second optical state in which the first optical filter is removed.
- the image acquisition device images the fluorescence in the second optical state in which the first optical filter is removed. In this case, since the second optical state can be achieved by removing the first optical filter, it is possible to more easily achieve the second optical state. Therefore, it is possible to more easily acquire the second fluorescence image.
- each of the multiple fluorescent lights is imaged and a first fluorescent image and a second fluorescent image are acquired.
- the image acquisition device images each of the multiple fluorescent lights and acquires a first fluorescent image and a second fluorescent image. In this case, both the first fluorescent image and the second fluorescent image can be acquired by imaging each of the multiple fluorescent lights once. Therefore, the first fluorescent image and the second fluorescent image can be acquired efficiently.
- each of the multiple fluorescence rays is imaged using a color camera.
- the image acquisition device images each of the multiple fluorescence rays using a color camera.
- each of the multiple fluorescences is imaged using a hyperspectral camera.
- the image acquisition device images each of the multiple fluorescences using a hyperspectral camera.
- the method further includes a clustering step for clustering a plurality of pixels determined to be monochromatic pixels in the discrimination step into L pixel groups (L is an integer greater than or equal to 2 and less than N-1) and generating L cluster matrices in which the C fluorescence images are obtained by irradiating a sample with excitation light having a wavelength distribution of C (C is an integer greater than or equal to 2), each of the C fluorescence images being composed of N pixels (N is an integer greater than or equal to 2), and for generating L cluster matrices in which the C fluorescence images are arranged for each clustered pixel group; a calculation step for calculating statistics of the intensity values of the pixel groups constituting the C fluorescence images for each of the L cluster matrices; and an image generation step for unmixing the C fluorescence images using the statistics of the C fluorescence images for each of the L cluster matrices, and generating K fluorescence images
- the image processing device targets C fluorescence images, each of which is composed of N pixels (N is an integer of 2 or more) and is obtained by irradiating a sample with excitation light having each of C wavelength distributions (C is an integer of 2 or more), clusters a plurality of pixels determined to be monochromatic pixels into L pixel groups (L is an integer of 2 or more and N-1 or less), generates L cluster matrices in which the C fluorescence images are arranged for each of the clustered pixel groups, calculates statistics of the intensity values of the pixel groups constituting the C fluorescence images for each of the L cluster matrices, and performs unmixing on the C fluorescence images using the statistics of the C fluorescence images for each of the L cluster matrices, thereby generating K fluorescence images showing the distribution for each of K dyes (K is an integer of 2 or more and C or less).
- a plurality of pixels determined to be monochromatic pixels are clustered into L pixel groups, and L cluster matrices are generated in which the C fluorescence images, each of which is obtained by irradiating a sample with excitation light having each of C wavelength distributions, are arranged for each of the clustered pixel groups.
- the statistical values of the intensity values of the pixel groups that make up the C fluorescent images are calculated for each of the L cluster matrices, and the C fluorescent images are unmixed using the statistical values of each of the C fluorescent images to generate K fluorescent images. This makes it possible to obtain separated images for each dye with high accuracy.
- the fluorescence image acquisition method of the embodiment is a fluorescence image acquisition method including: [1] "an irradiation step of irradiating a sample with each of excitation lights having a plurality of wavelength distributions; an acquisition step of acquiring a first fluorescence image in a first optical state and a second fluorescence image in a second optical state in which fluorescence is measured with wavelength characteristics different from the first optical state via a fluorescence filter unit having a plurality of reflection wavelength ranges and a plurality of transmission wavelength ranges for each of a plurality of fluorescence corresponding to each of the plurality of excitation lights; a calculation step of calculating an intensity ratio, which is a ratio between the intensity value of a pixel of the first fluorescence image and the intensity value of a pixel of the second fluorescence image corresponding to the pixel, for the first fluorescence image and the second fluorescence image, and calculating the intensity ratio for each of the plurality of excitation lights; and a discrimination step of discriminating
- the fluorescence image acquisition method of the embodiment may be the fluorescence image acquisition method described in [1] above, [2] including a first acquisition step of capturing an image of the fluorescence in a first optical state using a first optical filter having a different transmittance in each reflection wavelength range or each transmission wavelength range of the fluorescence filter unit for each of the multiple fluorescences to acquire a first fluorescence image, and a second acquisition step of capturing an image of the fluorescence in a second optical state for each of the multiple fluorescences to acquire a second fluorescence image.
- the fluorescence image acquisition method of the embodiment may be [3] "the fluorescence image acquisition method described in [2] above, in which the first optical filter is a first gradient filter whose transmittance changes monotonically across each reflection wavelength range, or whose transmittance changes monotonically across each transmission wavelength range.”
- the fluorescence image acquisition method of the embodiment may be [4] "the fluorescence image acquisition method described in [3] above, in which in the second acquisition step, fluorescence is captured in a second optical state using a second gradient filter that exhibits a different change in transmittance from the first gradient filter.”
- the fluorescence image acquisition method of the embodiment may be [5] "the fluorescence image acquisition method described in [2] or [3] above, in which in the second acquisition step, fluorescence is imaged in a second optical state using a second optical filter having a transmittance different from that of the first optical filter.”
- the fluorescence image acquisition method of the embodiment may be [6] "the fluorescence image acquisition method described in [2] or [3] above, in which in the second acquisition step, the fluorescence is imaged in a second optical state in which the first optical filter is removed.”
- the fluorescence image acquisition method of the embodiment may be [7] "the fluorescence image acquisition method described in [1] above, in which, in the acquisition step, each of the multiple fluorescent lights is imaged to acquire a first fluorescence image and a second fluorescence image.”
- the fluorescence image acquisition method of the embodiment may be [8] "the fluorescence image acquisition method described in [7] above, in which, in the acquisition step, a color camera is used to capture an image of each of the multiple fluorescent lights.”
- the fluorescence image acquisition method of the embodiment may be [9] "the fluorescence image acquisition method described in [7] above, in which, in the acquisition step, each of the multiple fluorescent lights is imaged using a hyperspectral camera.”
- the fluorescence image acquisition method of the embodiment may be [10] "a fluorescence image acquisition method according to any one of [2] to [9] above, further comprising: a clustering step of clustering a plurality of pixels determined to be monochromatic pixels in the discrimination step into L pixel groups (L is an integer between 2 and N-1) for the C fluorescence images obtained by irradiating a sample with excitation light having a wavelength distribution of C (C is an integer between 2 and 1), each of which is composed of N pixels (N is an integer between 2 and 1), and generating L cluster matrices in which the C fluorescence images are arranged for each of the clustered pixel groups; a calculation step of calculating statistics of the intensity values of the pixel groups constituting the C fluorescence images for each of the L cluster matrices; and an image generation step of performing unmixing on the C fluorescence images using the statistics of the C fluorescence images for each of the L cluster matrices, and generating K fluorescence images showing the
- the fluorescence image acquisition device of the embodiment is [11] "a fluorescence image acquisition device that includes an irradiation device that irradiates a sample with each of a plurality of excitation light beams having a wavelength distribution, an image acquisition device that acquires a first fluorescence image in a first optical state and a second fluorescence image in a second optical state in which fluorescence is measured with wavelength characteristics different from the first optical state through a fluorescence filter unit having a plurality of reflection wavelength ranges and a plurality of transmission wavelength ranges for each of a plurality of fluorescence beams corresponding to each of the plurality of excitation light beams, and an image processing device that processes the plurality of first fluorescence images and the plurality of second fluorescence images, and the image processing device calculates an intensity ratio that is a ratio between the intensity value of a pixel of the first fluorescence image and the intensity value of a pixel of the second fluorescence image corresponding to the pixel for the first fluorescence image and the
- the fluorescence image acquisition device of the embodiment may be the fluorescence image acquisition device described in [11] above, [12] "which captures the fluorescence in a first optical state using a first optical filter having a different transmittance in each reflection wavelength range or each transmission wavelength range of the fluorescence filter section for each of the multiple fluorescences, and acquires a first fluorescence image, and captures the fluorescence in a second optical state for each of the multiple fluorescences, and acquires a second fluorescence image.”
- the fluorescence image acquisition device of the embodiment may be [13] "the fluorescence image acquisition device described in [12] above, in which the first optical filter is a first gradient filter whose transmittance changes monotonically across each reflection wavelength range, or whose transmittance changes monotonically across each transmission wavelength range.”
- the fluorescence image acquisition device of the embodiment may be [14] "the fluorescence image acquisition device described in [13] above, which captures fluorescence in a second optical state using a second gradient filter that exhibits a different change in transmittance from the first gradient filter.”
- the fluorescence image acquisition device of the embodiment may be [15] "the fluorescence image acquisition device described in [12] or [13] above, which captures fluorescence in a second optical state using a second optical filter having a transmittance different from that of the first optical filter.”
- the fluorescence image acquisition device of the embodiment may be [16] "the fluorescence image acquisition device described in [12] or [13] above, which captures fluorescence in a second optical state in which the first optical filter is removed.”
- the fluorescence image acquisition device of the embodiment may be [17] "the fluorescence image acquisition device described in [11] above, which captures each of the multiple fluorescences and acquires a first fluorescence image and a second fluorescence image.”
- the fluorescence image acquisition device of the embodiment may be [18] "the fluorescence image acquisition device described in [17] above, which uses a color camera to capture each of the multiple fluorescence images.”
- the fluorescence image acquisition device of the embodiment may be [19] "the fluorescence image acquisition device described in [17] above, which uses a hyperspectral camera to capture each of the multiple fluorescent lights.”
- the fluorescence image acquisition device of the embodiment may be the fluorescence image acquisition device described in any of [12] to [19] above, [20] "wherein the image processing device targets C fluorescence images obtained by irradiating a sample with excitation light of C wavelength distributions (C is an integer of 2 or more), each of which is composed of N pixels (N is an integer of 2 or more), clusters a plurality of pixels determined to be monochromatic pixels into L pixel groups (L is an integer of 2 or more and N-1 or less), generates L cluster matrices arranged for each pixel group into which the C fluorescence images are clustered, calculates statistics of intensity values of pixel groups constituting the C fluorescence images for each of the L cluster matrices, and performs unmixing on the C fluorescence images using the statistics of the C fluorescence images for each of the L cluster matrices, thereby generating K fluorescence images showing the distribution of each of K dyes (K is an integer of 2 or more and C or less).
- the fluorescence image acquisition program of the embodiment is "a fluorescence image acquisition program for determining whether a pixel is a monochromatic pixel based on a first fluorescence image in a first optical state, which is acquired through a fluorescence filter unit having multiple reflection wavelength ranges and multiple transmission wavelength ranges for each of a plurality of fluorescence corresponding to each of the plurality of excitation lights by irradiating a sample with each of excitation lights having a plurality of wavelength distributions, and a second fluorescence image in a second optical state in which fluorescence is measured with wavelength characteristics different from that of the first optical state, and causes a computer to function as an intensity ratio calculation unit that calculates an intensity ratio for each of the plurality of excitation lights, which is a ratio between the intensity value of the pixel of the first fluorescence image and the intensity value of the pixel of the second fluorescence image corresponding to the pixel, and calculates the intensity ratio for each of the plurality of excitation lights, and a monochromatic pixel discrimin
Landscapes
- Health & Medical Sciences (AREA)
- Immunology (AREA)
- Chemical & Material Sciences (AREA)
- Physics & Mathematics (AREA)
- Biochemistry (AREA)
- Nuclear Medicine, Radiotherapy & Molecular Imaging (AREA)
- Life Sciences & Earth Sciences (AREA)
- Analytical Chemistry (AREA)
- General Health & Medical Sciences (AREA)
- General Physics & Mathematics (AREA)
- Pathology (AREA)
- Optics & Photonics (AREA)
- Chemical Kinetics & Catalysis (AREA)
- Investigating, Analyzing Materials By Fluorescence Or Luminescence (AREA)
- Image Analysis (AREA)
Priority Applications (4)
| Application Number | Priority Date | Filing Date | Title |
|---|---|---|---|
| CN202380094634.5A CN120731357A (zh) | 2023-02-24 | 2023-12-26 | 荧光图像获取方法、荧光图像获取装置、及荧光图像获取程序 |
| EP23924262.1A EP4653849A1 (en) | 2023-02-24 | 2023-12-26 | Fluorescent image acquisition method, fluorescent image acquisition device, and fluorescent image acquisition program |
| JP2024539324A JP7549759B1 (ja) | 2023-02-24 | 2023-12-26 | 蛍光画像取得方法、蛍光画像取得装置、及び蛍光画像取得プログラム |
| JP2024148540A JP2024163162A (ja) | 2023-02-24 | 2024-08-30 | 蛍光画像取得方法、蛍光画像取得装置、及び蛍光画像取得プログラム |
Applications Claiming Priority (2)
| Application Number | Priority Date | Filing Date | Title |
|---|---|---|---|
| JP2023-027521 | 2023-02-24 | ||
| JP2023027521 | 2023-02-24 |
Publications (1)
| Publication Number | Publication Date |
|---|---|
| WO2024176618A1 true WO2024176618A1 (ja) | 2024-08-29 |
Family
ID=92500833
Family Applications (1)
| Application Number | Title | Priority Date | Filing Date |
|---|---|---|---|
| PCT/JP2023/046787 Ceased WO2024176618A1 (ja) | 2023-02-24 | 2023-12-26 | 蛍光画像取得方法、蛍光画像取得装置、及び蛍光画像取得プログラム |
Country Status (4)
| Country | Link |
|---|---|
| EP (1) | EP4653849A1 (https=) |
| JP (2) | JP7549759B1 (https=) |
| CN (1) | CN120731357A (https=) |
| WO (1) | WO2024176618A1 (https=) |
Citations (4)
| Publication number | Priority date | Publication date | Assignee | Title |
|---|---|---|---|---|
| WO2005036143A1 (ja) * | 2003-10-10 | 2005-04-21 | Hamamatsu Photonics K.K. | 蛍光色素の濃度を定量する方法およびシステム |
| JP2008541179A (ja) * | 2005-05-18 | 2008-11-20 | オリンパス・ソフト・イメージング・ソリューションズ・ゲゼルシャフト・ミト・ベシュレンクテル・ハフツング | 多色画像、特に顕微鏡多色透過画像におけるスペクトル重畳またはカラー重畳画像寄与の分離 |
| US20210208076A1 (en) * | 2020-01-03 | 2021-07-08 | Korea Advanced Institute Of Science And Technology | Method and Apparatus for Multiplexed Imaging of Spectrally-Similar Fluorophores |
| WO2023026742A1 (ja) * | 2021-08-25 | 2023-03-02 | 浜松ホトニクス株式会社 | 色素画像取得方法、色素画像取得装置、及び色素画像取得プログラム |
-
2023
- 2023-12-26 CN CN202380094634.5A patent/CN120731357A/zh active Pending
- 2023-12-26 JP JP2024539324A patent/JP7549759B1/ja active Active
- 2023-12-26 WO PCT/JP2023/046787 patent/WO2024176618A1/ja not_active Ceased
- 2023-12-26 EP EP23924262.1A patent/EP4653849A1/en active Pending
-
2024
- 2024-08-30 JP JP2024148540A patent/JP2024163162A/ja active Pending
Patent Citations (4)
| Publication number | Priority date | Publication date | Assignee | Title |
|---|---|---|---|---|
| WO2005036143A1 (ja) * | 2003-10-10 | 2005-04-21 | Hamamatsu Photonics K.K. | 蛍光色素の濃度を定量する方法およびシステム |
| JP2008541179A (ja) * | 2005-05-18 | 2008-11-20 | オリンパス・ソフト・イメージング・ソリューションズ・ゲゼルシャフト・ミト・ベシュレンクテル・ハフツング | 多色画像、特に顕微鏡多色透過画像におけるスペクトル重畳またはカラー重畳画像寄与の分離 |
| US20210208076A1 (en) * | 2020-01-03 | 2021-07-08 | Korea Advanced Institute Of Science And Technology | Method and Apparatus for Multiplexed Imaging of Spectrally-Similar Fluorophores |
| WO2023026742A1 (ja) * | 2021-08-25 | 2023-03-02 | 浜松ホトニクス株式会社 | 色素画像取得方法、色素画像取得装置、及び色素画像取得プログラム |
Non-Patent Citations (2)
| Title |
|---|
| MCRAE TRISTAN D., OLEKSYN DAVID, MILLER JIM, GAO YU-RONG: "Robust blind spectral unmixing for fluorescence microscopy using unsupervised learning", PLOS ONE, vol. 14, no. 12, 2 December 2019 (2019-12-02), US , pages 1 - 24, XP093202947, ISSN: 1932-6203, DOI: 10.1371/journal.pone.0225410 * |
| See also references of EP4653849A1 * |
Also Published As
| Publication number | Publication date |
|---|---|
| JPWO2024176618A1 (https=) | 2024-08-29 |
| JP2024163162A (ja) | 2024-11-21 |
| EP4653849A1 (en) | 2025-11-26 |
| CN120731357A (zh) | 2025-09-30 |
| JP7549759B1 (ja) | 2024-09-11 |
Similar Documents
| Publication | Publication Date | Title |
|---|---|---|
| JP7537029B2 (ja) | 色素画像取得方法、色素画像取得装置、及び色素画像取得プログラム | |
| ElMasry et al. | Principles of hyperspectral imaging technology | |
| US20040218172A1 (en) | Application of spatial light modulators for new modalities in spectrometry and imaging | |
| US20140093147A1 (en) | System and method for gross anatomic pathology using hyperspectral imaging | |
| JP2006526783A (ja) | 色分解および組織試料内の対象となる領域の検出 | |
| US8160331B2 (en) | Image processing apparatus and computer program product | |
| US20020135770A1 (en) | Hybrid-imaging spectrometer | |
| JP2023063240A (ja) | イメージセンサのスペクトルデータを処理する装置及びその方法 | |
| US20230309834A1 (en) | Hadamard-transform fluorescence excitation-emission-matrix imaging systems | |
| EP3896429B1 (en) | Quality evaluation method | |
| JP7549759B1 (ja) | 蛍光画像取得方法、蛍光画像取得装置、及び蛍光画像取得プログラム | |
| KR20220104817A (ko) | 튜닝 가능한 발광 다이오드 소스의 현장 최적화를 위한 시스템 및 방법 | |
| JP7566216B1 (ja) | 分離画像取得方法、分離画像取得装置、及び分離画像取得プログラム | |
| CN120084706A (zh) | 高光谱定量成像细胞术系统 | |
| WO2026042403A1 (ja) | 画像取得方法、装置、及びプログラム | |
| CA2480463A1 (en) | Hybrid-imaging spectrometer | |
| JP7564408B1 (ja) | 色素データ取得方法、色素データ取得装置、及び色素データ取得プログラム | |
| Lu et al. | A programmable optical filter with arbitrary transmittance for fast spectroscopic imaging and spectral data post-processing | |
| WO2026042344A1 (ja) | 色素データ取得方法、色素データ取得装置、及び色素データ取得プログラム | |
| WO2026042345A1 (ja) | 色素データ取得方法、色素データ取得装置、及び色素データ取得プログラム | |
| EP4653850A1 (en) | Image acquisition device | |
| WO2026042343A1 (ja) | 生成方法、生成装置、及びプログラム | |
| Fonseca et al. | Optical Implementation of Learned Spectral Band Selection for Material Classification | |
| CN119487382A (zh) | 计算机实现的多光谱成像方法和系统 | |
| Kelman | Techniques for capture and analysis of hyperspectral data |
Legal Events
| Date | Code | Title | Description |
|---|---|---|---|
| WWE | Wipo information: entry into national phase |
Ref document number: 2024539324 Country of ref document: JP |
|
| 121 | Ep: the epo has been informed by wipo that ep was designated in this application |
Ref document number: 23924262 Country of ref document: EP Kind code of ref document: A1 |
|
| WWE | Wipo information: entry into national phase |
Ref document number: 202380094634.5 Country of ref document: CN |
|
| NENP | Non-entry into the national phase |
Ref country code: DE |
|
| WWP | Wipo information: published in national office |
Ref document number: 202380094634.5 Country of ref document: CN |
|
| WWP | Wipo information: published in national office |
Ref document number: 2023924262 Country of ref document: EP |