WO2024142654A1 - 計測システム、制御装置、計測方法、及びプログラム - Google Patents
計測システム、制御装置、計測方法、及びプログラム Download PDFInfo
- Publication number
- WO2024142654A1 WO2024142654A1 PCT/JP2023/041325 JP2023041325W WO2024142654A1 WO 2024142654 A1 WO2024142654 A1 WO 2024142654A1 JP 2023041325 W JP2023041325 W JP 2023041325W WO 2024142654 A1 WO2024142654 A1 WO 2024142654A1
- Authority
- WO
- WIPO (PCT)
- Prior art keywords
- unit
- motor
- spindle
- correction
- test operation
- Prior art date
- Legal status (The legal status is an assumption and is not a legal conclusion. Google has not performed a legal analysis and makes no representation as to the accuracy of the status listed.)
- Ceased
Links
Images









Classifications
-
- H—ELECTRICITY
- H02—GENERATION; CONVERSION OR DISTRIBUTION OF ELECTRIC POWER
- H02P—CONTROL OR REGULATION OF ELECTRIC MOTORS, ELECTRIC GENERATORS OR DYNAMO-ELECTRIC CONVERTERS; CONTROLLING TRANSFORMERS, REACTORS OR CHOKE COILS
- H02P5/00—Arrangements specially adapted for regulating or controlling the speed or torque of two or more electric motors
- H02P5/46—Arrangements specially adapted for regulating or controlling the speed or torque of two or more electric motors for speed regulation of two or more dynamo-electric motors in relation to one another
-
- G—PHYSICS
- G05—CONTROLLING; REGULATING
- G05B—CONTROL OR REGULATING SYSTEMS IN GENERAL; FUNCTIONAL ELEMENTS OF SUCH SYSTEMS; MONITORING OR TESTING ARRANGEMENTS FOR SUCH SYSTEMS OR ELEMENTS
- G05B19/00—Program-control systems
- G05B19/02—Program-control systems electric
- G05B19/18—Numerical control [NC], i.e. automatically operating machines, in particular machine tools, e.g. in a manufacturing environment, so as to execute positioning, movement or co-ordinated operations by means of program data in numerical form
- G05B19/401—Numerical control [NC], i.e. automatically operating machines, in particular machine tools, e.g. in a manufacturing environment, so as to execute positioning, movement or co-ordinated operations by means of program data in numerical form characterised by control arrangements for measuring, e.g. calibration and initialisation, measuring workpiece for machining purposes
-
- G—PHYSICS
- G05—CONTROLLING; REGULATING
- G05B—CONTROL OR REGULATING SYSTEMS IN GENERAL; FUNCTIONAL ELEMENTS OF SUCH SYSTEMS; MONITORING OR TESTING ARRANGEMENTS FOR SUCH SYSTEMS OR ELEMENTS
- G05B19/00—Program-control systems
- G05B19/02—Program-control systems electric
- G05B19/18—Numerical control [NC], i.e. automatically operating machines, in particular machine tools, e.g. in a manufacturing environment, so as to execute positioning, movement or co-ordinated operations by means of program data in numerical form
- G05B19/404—Numerical control [NC], i.e. automatically operating machines, in particular machine tools, e.g. in a manufacturing environment, so as to execute positioning, movement or co-ordinated operations by means of program data in numerical form characterised by control arrangements for compensation, e.g. for backlash, overshoot, tool offset, tool wear, temperature, machine construction errors, load, inertia
-
- G—PHYSICS
- G05—CONTROLLING; REGULATING
- G05D—SYSTEMS FOR CONTROLLING OR REGULATING NON-ELECTRIC VARIABLES
- G05D3/00—Control of position or direction
- G05D3/12—Control of position or direction using feedback
-
- H—ELECTRICITY
- H02—GENERATION; CONVERSION OR DISTRIBUTION OF ELECTRIC POWER
- H02P—CONTROL OR REGULATION OF ELECTRIC MOTORS, ELECTRIC GENERATORS OR DYNAMO-ELECTRIC CONVERTERS; CONTROLLING TRANSFORMERS, REACTORS OR CHOKE COILS
- H02P25/00—Arrangements or methods for the control of AC motors characterised by the kind of AC motor or by structural details
- H02P25/02—Arrangements or methods for the control of AC motors characterised by the kind of AC motor or by structural details characterised by the kind of motor
- H02P25/06—Linear motors
Definitions
- This disclosure generally relates to a measurement system, a control device, a measurement method, and a program. More specifically, this disclosure relates to a measurement system that measures a position correction amount applied to a synchronous drive system that synchronously drives two parallel spindles, a control device for the synchronous drive system, a measurement method, and a program.
- Patent Document 1 discloses a position control system.
- the position control system has a general-purpose personal computer (PC), an X-axis servo amplifier, a Y1-axis servo amplifier, and a Y2-axis servo amplifier.
- the Y2-axis servo amplifier controls the drive of the Y2-axis linear motor based on a Y-axis position command input from the general-purpose PC.
- the Y2-axis servo amplifier has a correction value table storage unit that stores inter-axis correction values corresponding to each predetermined value of the Y-axis position command.
- a correction value is calculated based on the positions (deviation) between the Y1 axis and the Y2 axis.
- correction based on position deviation may not be able to suppress the effects that may occur due to interference between the Y1 axis (first spindle) and the Y2 axis (second spindle) (for example, device deterioration due to twisting of the axes, etc.).
- This disclosure has been made in consideration of the above-mentioned reasons, and aims to provide a measurement system, control device, measurement method, and program that can reduce the effects that may occur due to interference between axes.
- a measurement system measures a position correction amount applied to a synchronous drive system.
- the synchronous drive system includes a first spindle and a second spindle, and a first control unit and a second control unit.
- the first spindle and the second spindle are connected in parallel to each other via a countershaft.
- the first spindle and the second spindle have a first motor and a second motor, respectively.
- the first control unit and the second control unit control the first motor and the second motor, respectively, so that the first spindle and the second spindle move synchronously in the axial direction.
- the measurement system includes a command unit, a first acquisition unit, a second acquisition unit, and a calculation unit.
- the command unit provides the first control unit and the second control unit with the same position command to control the first motor and the second motor so as to perform a test operation in which the first spindle and the second spindle move synchronously to a specified position.
- the first acquisition unit acquires first information regarding a first force applied to the first spindle and a second force applied to the second spindle during the test operation.
- the second acquisition unit acquires second information regarding the positions of the first motor and the second motor during the test operation.
- the calculation unit calculates the position correction amount of at least one of the first motor and the second motor based on the first information and the second information so as to correct the positional deviation between the first spindle and the second spindle.
- a control device includes one of the first control unit and the second control unit to which the position command is input from the measurement system.
- the control unit controls the corresponding one of the first motor and the second motor based on the position command so as to perform the test operation in which the corresponding one of the first spindle and the second spindle moves to the specified position.
- the control device further includes a first output unit and a second output unit.
- the first output unit outputs the first information related to the force applied to the spindle during the test operation.
- the second output unit outputs the second information related to the position of the motor during the test operation.
- a control device includes one of the first control unit and the second control unit to which the position command is input from the measurement system.
- the control device has at least some of the functions related to the command unit, the first acquisition unit, the second acquisition unit, and the calculation unit in the measurement system.
- a control device includes one of the first control unit and the second control unit to which the position command is input from the measurement system.
- the control device further includes a storage unit that stores correction information including the position correction amount calculated by the calculation unit. During the test operation or normal operation, the control unit executes control of the corresponding one of the first motor and the second motor based on the correction information stored in the storage unit.
- a measurement method measures a position correction amount applied to a synchronous drive system.
- the synchronous drive system includes a first spindle and a second spindle, and a first control unit and a second control unit.
- the first spindle and the second spindle are connected in parallel to each other via a countershaft.
- the first spindle and the second spindle have a first motor and a second motor, respectively.
- the first control unit and the second control unit control the first motor and the second motor, respectively, so that the first spindle and the second spindle move axially in a synchronous manner.
- the measurement method includes a command processing step, a first acquisition processing step, a second acquisition processing step, and a calculation processing step.
- the same position command is given to the first control unit and the second control unit to control the first motor and the second motor so as to perform a test operation in which the first spindle and the second spindle move synchronously to a specified position.
- first information regarding a first force applied to the first spindle and a second force applied to the second spindle during the test operation is acquired.
- second information regarding the positions of the first motor and the second motor during the test operation is acquired.
- the position correction amount of at least one of the first motor and the second motor is calculated based on the first information and the second information so as to correct the positional deviation between the first spindle and the second spindle.
- a further aspect of the present disclosure is a program for causing one or more processors to execute the above-mentioned measurement method.
- FIG. 1 is a schematic block diagram of a measurement system according to an embodiment and a synchronous drive system to which the measurement system is applied.
- FIG. 2 is a schematic diagram of the synchronous drive system and its peripheral configuration.
- FIG. 3 is a flowchart for explaining an operation related to a correction amount measurement process in the measurement system.
- FIG. 4 is a flowchart for explaining operations related to the correction amount optimization process in the measurement system.
- FIG. 5 is a schematic block diagram for explaining a first modified example of the above measurement system.
- FIG. 6 is a schematic block diagram for explaining a second modified example of the measurement system.
- FIG. 7 is a schematic block diagram for explaining a third modified example of the above measurement system.
- FIG. 1 is a schematic block diagram of a measurement system according to an embodiment and a synchronous drive system to which the measurement system is applied.
- FIG. 2 is a schematic diagram of the synchronous drive system and its peripheral configuration.
- FIG. 3 is a flowchart for explaining an operation related to a
- FIG. 21A is a conceptual diagram of a screen for explaining the fourth function (function of conversion to chart format) of the fifth modified example.
- FIG. 21B is a conceptual diagram of a screen for explaining the fourth function (function of conversion to chart format) of the fifth modified example.
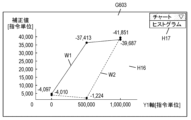
- FIG. 22A is a conceptual diagram of a screen for explaining the fifth function (function of conversion to a histogram format) of the fifth modified example.
- FIG. 22B is a conceptual diagram of a screen for explaining the fifth function (function of conversion to a histogram format) of the fifth modified example.
- FIG. 23 is a conceptual diagram of a screen for explaining the sixth function (a function for comparatively displaying past data) of the fifth modified example.
- FIG. 21A is a conceptual diagram of a screen for explaining the fourth function (function of conversion to chart format) of the fifth modified example.
- FIG. 21B is a conceptual diagram of a screen for explaining the fourth function (function of conversion to chart format) of the fifth modified example.
- FIG. 22A is
- FIG. 24A is a conceptual diagram of a screen for explaining the seventh function (a comparative display function for past data in a different display format) of the fifth modified example.
- FIG. 24B is a conceptual diagram of a screen for explaining the seventh function (a comparative display function for past data in a different display format) of the fifth modified example.
- FIG. 1 is a schematic block diagram of a measurement system 1 according to one embodiment, and a synchronous drive system 2 to which the measurement system 1 is applied.
- FIG. 2 is a schematic diagram of the synchronous drive system 2 according to one embodiment, and the peripheral configuration.
- the measurement system 1 according to one aspect (see FIG. 1) measures the position correction amount applied to the synchronous drive system 2 (see FIG. 2).
- the synchronous drive system 2 is a synchronous drive device (system) having a so-called gantry mechanism, as shown in FIG. 2.
- the Y1 axis, Y2 axis, and X axis in the gantry mechanism correspond to the first main axis Y1, the second main axis Y2, and the sub-axis X1 (see FIG. 2), respectively, in this disclosure.
- the synchronous drive system 2 may be a multi-axis synchronous drive device (system) having a mechanism other than a gantry mechanism.
- the synchronous drive system 2 includes a first spindle Y1 and a second spindle Y2, a first control unit 31 and a second control unit 32.
- the first spindle Y1 and the second spindle Y2 are connected in parallel to each other via a countershaft X1 (see FIG. 2).
- the first spindle Y1 and the second spindle Y2 have a first motor M1 and a second motor M2, respectively.
- the first control unit 31 and the second control unit 32 control the first motor M1 and the second motor M2, respectively, so that the first spindle Y1 and the second spindle Y2 move synchronously in the axial direction D1 (see FIG. 2).
- the first spindle Y1 has a first motor M1 (linear servo motor), a position detection unit 81 (linear scale), a thrust detection unit 82, and a vibration detection unit 83.
- the thrust detection unit 82 of the first spindle Y1 is not an essential component and may be omitted as appropriate.
- the first spindle Y1 may further have a speed sensor that detects the speed of the first motor M1, a thrust sensor that detects the thrust of the first motor M1, etc.
- the drive system A1 on the first spindle Y1 side may be referred to as the first drive system A11.
- the first motor M1 is a rotary servo motor and is connected to a ball screw mechanism, the rotary servo motor and the ball screw mechanism also become part of the first drive system A11.
- one test operation is a movement operation in which the spindles (first spindle Y1 and second spindle Y2) move synchronously from the origin position (start position) of the Y axis to a position (end position) on the positive side of the Y axis specified by a position command.
- the start position may be other than the origin position.
- the position command includes, for example, information on the correction range.
- the first output unit 41 of the processing unit P1 outputs first information regarding the force (thrust) applied to the spindle during the test operation. Specifically, the processing unit P1 calculates a first thrust value based on the command value of the thrust of the first motor M1, etc. The processing unit P1 generates first information including the first thrust value and outputs it from the first output unit 41.
- the command value of the thrust of the first motor M1 is one of the parameters of the control value that can be determined based on the position detection signal (i.e., the current position of the first motor M1) from the position detection unit 81 and the current speed of the first motor M1, etc.
- the first amplifier B1 and second amplifier B2 configured in this manner receive synchronized control signals from the host controller 6, and drive the first spindle Y1 and second spindle Y2 synchronously to a predetermined position.
- the sub-axis servo amplifier B3 also determines the control values of the drive system according to the control signal for the X-axis from the host controller 6 and the position detection signal from the position detector, and drives the sub-axis X1 to a predetermined position on the X-axis.
- the synchronous drive system 2 performs drive control of the X-Y coordinate position for the head Z1.
- the display unit 70 is configured, for example, by a liquid crystal display or an organic EL (Electro-Luminescence) display.
- the display unit 70 may be configured by a touch panel display.
- the measurement system 1 includes a computer system having one or more processors and a memory. At least some of the functions of the measurement system 1 are realized by the processor of the computer system executing a program recorded in the memory of the computer system.
- the program may be recorded in the memory, or may be provided via a telecommunications line such as the Internet, or may be recorded on a non-transitory recording medium such as a memory card and provided.
- each of the first amplifier B1 and the second amplifier B2 has a function of transmitting the second information acquired by the second acquisition unit 12 of the own machine to the other spindle servo amplifier side directly or via a terminal 7 or the like.
- the communication method may be wireless or wired.
- the third acquisition unit 13 of the second measurement processing unit G2 acquires third information about frequency characteristics (e.g., resonant frequency and anti-resonant frequency) of vibration in the second drive system A12 including the second motor M2 based on the detection value included in the vibration detection signal from the vibration detection unit 83 of the second spindle Y2.
- the third acquisition unit 13 of the second measurement processing unit G2 inputs the third information to the calculation unit 14 of the own machine.
- each of the first amplifier B1 and the second amplifier B2 has a function of transmitting the third information acquired by the third acquisition unit 13 of the own machine to the other spindle servo amplifier side directly or via a terminal 7 or the like.
- the communication method may be wireless or wired.
- the vibration detection unit 83 it is not essential to use the vibration detection unit 83 as a means for obtaining the frequency characteristics of the vibration.
- the means for measuring the frequency characteristics of the vibration is not particularly limited.
- the frequency characteristics of the vibration may be indirectly measured based on the output information (actual values of the motor speed, thrust, etc.) from the first drive system A11 and the second drive system A12 in response to the input information (command values of the motor speed, thrust, etc.) from the first amplifier B1 and the second amplifier B2 to the first drive system A11 and the second drive system A12.
- the frequency of the vibration applied is not particularly limited.
- a signal including all frequency components may be generated and applied to the first drive system A11 and the second drive system A12 (measurement using white noise).
- a signal with a waveform whose frequency changes over time may be generated and applied to the first drive system A11 and the second drive system A12 (measurement using a sine wave sweep).
- a signal with a waveform that is a combination of multiple sine waves within a predetermined frequency range may be generated and applied to the first drive system A11 and the second drive system A12 (measurement using a multi-sine).
- the measurement system 1 may separate the test operation for obtaining the first information (thrust force) from the test operation for obtaining the frequency characteristics (e.g., using white noise) and execute them at different times.
- the calculation unit 14 calculates a correction amount for the position of at least one of the first motor M1 and the second motor M2, i.e., a position correction amount, based on the first information and the second information so as to correct the positional deviation between the first spindle Y1 and the second spindle Y2 (executes a correction amount measurement process).
- the calculation unit 14 stores the calculated position correction amount in the memory unit 5 (of its own machine) (newly added or updated).
- the position correction amount may be calculated individually for each of the first amplifier B1 and the second amplifier B2.
- the calculation unit 14 of the first measurement processing unit G1 may calculate the position correction amount of the first motor M1 based on the position of the second motor M2 in the second information acquired from the second amplifier B2, and store it in the first storage unit 51.
- the calculation unit 14 of the second measurement processing unit G2 may calculate the position correction amount of the second motor M2 based on the position of the first motor M1 in the second information acquired from the first amplifier B1, and store it in the second storage unit 52.
- the position correction amount is calculated individually for each of the first amplifier B1 and the second amplifier B2 in this way, it may not be easy to adjust the motor position when viewed as a whole synchronous drive system 2.
- the correction coefficient by which the difference value is multiplied may be a predetermined value stored in the memory unit 5, but the measurement system 1 of this embodiment has a function of calculating this correction coefficient. That is, the coefficient calculation unit 15 calculates the correction coefficient based on the load mass of each of the first spindle Y1 and the second spindle Y2 and the third information. The coefficient calculation unit 15 calculates the correction coefficient upon receiving a calculation command from the calculation unit 14, for example.
- the correction information stored in the memory unit 5 by the measurement system 1 may include, in addition to information on the position correction amount, information on the difference value (thrust difference) between the first force (first thrust value) and the second force (second thrust value), information on the correction coefficient, information on the correction position, and information on the vibration frequency characteristics.
- the measurement system 1 causes only the calculation unit 14 of the first amplifier B1 to execute the correction amount measurement process, and the calculation unit 14 of the first amplifier B1 calculates the position correction amount of the first motor M1 based on the position of the second motor M2 of the second information from the second amplifier B2.
- the operator has completed the installation of various devices of the synchronous drive system 2 in a new installation in a facility such as a factory.
- a slight positional misalignment may occur between the first spindle Y1 and the second spindle Y2.
- the operator connects the terminal 7 to the first amplifier B1 and the second amplifier B2 so that they can communicate with each other (this may be a wireless or wired connection).
- the operator launches dedicated application software on the terminal 7 and performs an operation input to send a test signal that serves as a trigger to execute a test operation.
- the command unit 10 of the terminal 7 (part of the measurement system 1) sends a synchronized position command test signal to the first amplifier B1 and the second amplifier B2 (ST1: communication synchronization between the Y1 axis and the Y2 axis).
- the step of sending this position command test signal corresponds to the command processing step of the measurement method according to one embodiment.
- the first amplifier B1 (first control unit 31) and the second amplifier B2 (second control unit 32) control the first motor M1 and the second motor M2 to perform a test operation (movement operation from the start position to the end position of the correction range) based on the position command. That is, the first control unit 31 and the second control unit 32 move the first spindle Y1 and the second spindle Y2 to the start position of the correction range specified by the position command (ST2). Then, the first control unit 31 and the second control unit 32 start moving the first spindle Y1 and the second spindle Y2 to the end position of the correction range specified by the position command (ST3).
- the measurement system 1 acquires the first information (thrust), the second information (position), and the third information (vibration frequency characteristics) during the test operation, i.e., while the first spindle Y1 and the second spindle Y2 continue to move synchronously from the start position to the end position (ST4).
- the step of acquiring the first information and the step of acquiring the second information correspond to the first acquisition processing step and the second acquisition processing step, respectively, of the measurement method according to one embodiment.
- the measurement system 1 executes a correction amount measurement process and calculates a difference value (thrust difference) between the first force (first thrust value) applied to the first spindle Y1 and the second force (second thrust value) applied to the second spindle Y2 (ST5). Furthermore, in the correction amount measurement process, the measurement system 1 (coefficient calculation unit 15 of the first amplifier B1) calculates a correction coefficient, and the measurement system 1 (calculation unit 14 of the first amplifier B1) multiplies the thrust difference by the correction coefficient to calculate the position correction amount (ST6). This step of calculating the position correction amount corresponds to the calculation process step of the measurement method according to one embodiment.
- the measurement system 1 stores the position correction amounts for the multiple positions calculated at the sampling period or at intervals longer than that in the storage unit 5 in table format as correction information. That is, the calculation unit 14 of the first amplifier B1 stores the information on the position correction amounts for the multiple positions of the first motor M1 in the first storage unit 51 of the own machine. Then, the measurement system 1 ends the test operation. Until the movement of both spindles to the end position is completed (ST7: No), the measurement system 1 repeats steps ST4 to ST6.
- the measurement system 1 repeats the correction amount measurement process that calculates the position correction amount while the first spindle Y1 and the second spindle Y2 continue to move synchronously from the start position to the end position.
- the position correction amount can be measured by continuous movement without temporarily stopping the first spindle Y1 and the second spindle Y2 during the movement from the start position to the end position.
- the measurement system 1 may display the correction information stored in the memory unit 5 on the display unit 70 of the terminal 7 so that the worker can visually check the correction information.
- the worker may manually correct part of the correction information on the terminal 7 using the operation unit 72.
- the terminal 7 may update the correction information stored in the first memory unit 51 of the first amplifier B1 in the first amplifier B1 in response to the operation input of the worker.
- the operator disconnects the terminal 7 that is connected to the first amplifier B1 and the second amplifier B2.
- the measurement system 1 performs a test operation once, stores the calculated position correction amount (correction information) in the storage unit 5, and ends the process.
- the measurement system 1 may be configured to perform a test operation again, but taking into account the position correction amount (correction information) stored in the storage unit 5, and then execute the correction amount measurement process to optimize the position correction amount (execution of correction amount optimization process). Specifically, the measurement system 1 repeats the test operation and the correction amount measurement process as the correction amount optimization process until a specific condition is satisfied.
- the measurement system 1 is configured so that the enable/disable of the correction amount optimization process can be selected, for example, through the terminal 7.
- the measurement system 1 executes the operation flow as described above in the section "(6) Operation of the measurement system (correction amount measurement process)."
- the enable of the correction amount optimization process executes the operation flow described below.
- FIG. 4 is a flowchart for explaining the operation related to the correction amount optimization process in the measurement system 1 of one embodiment.
- the flowchart shown in FIG. 4 is merely one example of the operation flow related to the measurement system 1, and the order of the processes may be changed as appropriate, and processes may be added or omitted as appropriate.
- Note that the operation flow related to the calculation of the position correction amount is the same as the operation flow explained in the section "(6) Operation of the measurement system (correction amount measurement process)" above, and therefore a detailed explanation will be omitted here as appropriate.
- the first amplifier B1 and the second amplifier B2 start the second test operation (ST14).
- the first amplifier B1 determines a control value at a position corrected based on the most recent position correction amount (the position correction amount of the first test operation) stored in the first storage unit 51, and controls the first motor M1.
- the measurement system 1 in the present disclosure includes a computer system.
- the computer system is mainly composed of a processor and a memory as hardware.
- the processor executes a program recorded in the memory of the computer system to realize the functions of the measurement system 1 in the present disclosure.
- the program may be pre-recorded in the memory of the computer system, may be provided through a telecommunications line, or may be recorded and provided on a non-transitory recording medium such as a memory card, an optical disk, or a hard disk drive that can be read by the computer system.
- the processor of the computer system is composed of one or more electronic circuits including a semiconductor integrated circuit (IC) or a large scale integrated circuit (LSI).
- IC semiconductor integrated circuit
- LSI large scale integrated circuit
- the integrated circuits such as ICs or LSIs referred to here are called different names depending on the degree of integration, and include integrated circuits called system LSIs, VLSIs (Very Large Scale Integration), or ULSIs (Ultra Large Scale Integration).
- a field-programmable gate array (FPGA) that is programmed after the LSI is manufactured, or a logic device that allows the reconfiguration of the connection relationships within the LSI or the reconfiguration of the circuit partitions within the LSI, can also be used as a processor.
- FPGA field-programmable gate array
- Multiple electronic circuits may be integrated into one chip, or may be distributed across multiple chips. Multiple chips may be integrated into one device, or may be distributed across multiple devices.
- the computer system referred to here includes a microcontroller having one or more processors and one or more memories.
- the microcontroller is also composed of one or more electronic circuits including a semiconductor integrated circuit or a large-scale integrated circuit.
- multiple functions in the measurement system 1 may be integrated into one housing.
- at least some of the functions of the measurement system 1, for example, some of the functions of the measurement system 1, may be realized by the cloud (cloud computing) or the like.
- the measurement system 1 also calculates the position correction amount at any time during the test operation, but the position correction amount may also be calculated after the test operation is completed using the first information, second information, and third information acquired during the test operation.
- the measurement system 1 acquires the third information (vibration frequency characteristics) during the same test operation as the first information (thrust force).
- the third information may be acquired through a test operation other than the above test operation.
- FIG. 5 is a schematic block diagram for explaining a first modified example of the measurement system 1.
- the command unit 10 of the upper controller 6 transmits a synchronized position command test signal to the first amplifier B1 and the second amplifier B2.
- the first information, the second information, and the third information during the test operation may be exchanged by direct communication between the first amplifier B1 and the second amplifier B2, or may be exchanged by indirect communication via another device (such as the upper controller 6).
- FIG. 6 is a schematic block diagram for explaining a second modified example in the measurement system 1.
- the function of the command unit 10 is implemented only in the first amplifier B1, but it may be implemented only in the second amplifier B2, or it may be implemented in both spindle servo amplifiers.
- the operator uses a user interface attached to the first amplifier B1 to perform an operation input for transmitting a test signal.
- the command unit 10 of the first amplifier B1 transmits a synchronized position command test signal to the first measurement processing unit G1 in the machine and the second measurement processing unit G2 of the second amplifier B2.
- the first information, the second information, and the third information during the test operation may be exchanged by direct communication between the first amplifier B1 and the second amplifier B2, or may be exchanged by indirect communication via another device (for example, the upper controller 6, etc.).
- FIG. 7 is a schematic block diagram for explaining a third modified example of the measurement system 1.
- the first output unit 41 of each of the first amplifier B1 and the second amplifier B2 outputs the first information (thrust) during the test operation to the terminal 7.
- the second output unit 42 of each of the first amplifier B1 and the second amplifier B2 outputs the second information (position of the motor) during the test operation to the terminal 7.
- each of the first amplifier B1 and the second amplifier B2 outputs the third information (vibration frequency characteristics) during the test operation to the terminal 7.
- the terminal 7 transmits correction information including the position correction amount calculated by the calculation unit 14 to at least one of the first amplifier B1 and the second amplifier B2, and stores it in the memory unit 5.
- the calculation unit 14 obtains the difference between the first force (thrust or torque) and the second force (thrust or torque) at the same time, and multiplies the difference by a correction coefficient to calculate the position correction amount. Also, in the above embodiment, the coefficient calculation unit 15 calculates this correction coefficient using a function F (f1, f2, M) of the resonance frequency f1, anti-resonance frequency f2, and load mass M for the first drive system A11 and the second drive system A12.
- the measurement system 1 of this modified example includes a coefficient calculation unit 15 that calculates a correction coefficient, similar to the measurement system 1 of the above embodiment. However, the measurement system 1 of this modified example differs from the measurement system 1 of the above embodiment in the calculation method. In the measurement system 1 of this modified example, the command unit 10 controls the first motor M1 and the second motor M2 to perform a test operation for calculating the correction coefficient.
- the test operation further includes a "specific test operation" in which different position commands are given so that a predetermined amount of displacement occurs between the first spindle Y1 and the second spindle Y2, and the first spindle Y1 and the second spindle Y2 move synchronously to a specified position.
- the coefficient calculation unit 15 calculates a correction coefficient based on the fourth information related to the first force and the second force during the specific test operation and the predetermined amount of displacement.
- the predetermined amount of deviation is set, for example, on the first main axis Y1. That is, the first main axis Y1 can be set to deviate by a predetermined amount of deviation on the positive side (or negative side) of the Y axis (axial direction D1) relative to the second main axis Y2 that moves to a reference position.
- the "reference position" referred to here is, for example, a position to which the position correction amount described in the above embodiment is not taken into account.
- the predetermined amount of displacement may be set, for example, on the second main axis Y2.
- the second main axis Y2 may be set to be displaced by a predetermined amount on the positive (or negative) side of the Y axis with respect to the first main axis Y1 that moves to the reference position.
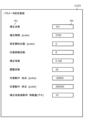
- the processing unit 71 of the terminal 7 displays the operation screen G102 (see FIG. 10) on the screen of the display unit 70.
- the parameter "number of adjustments" is the number of times the correction value is adjusted.
- the measurement system 1 executes the correction amount optimization process by repeating the test operation for measuring the correction amount and the correction amount measurement process until a specific condition is satisfied.
- the measurement system 1 executes the correction amount optimization process by repeating the test operation for measuring the correction amount and the correction amount measurement process the number of times specified by this "number of adjustments".
- the parameter "reciprocating motion end point [pulse]" is the second origin position of the test motion, i.e., the end point of the reciprocating motion performed when obtaining thrust difference data, and is expressed in units of the amount of command pulses to the motor (e.g., first motor M1). It is preferable to set the parameter "reciprocating motion end point [pulse]" to a value greater than the position of the last correction point.
- the measurement system 1 issues different position commands so that a predetermined amount of displacement (10 [pulses] in the example of FIG. 11) occurs between the first spindle Y1 and the second spindle Y2, and executes a "specific test operation" in which the first spindle Y1 and the second spindle Y2 move synchronously to a specified position (step ST24).
- a predetermined amount of displacement (10 [pulses] in the example of FIG. 11) occurs between the first spindle Y1 and the second spindle Y2
- a "specific test operation” in which the first spindle Y1 and the second spindle Y2 move synchronously to a specified position.
- One of the first spindle Y1 and the second spindle Y2 (here, the first spindle Y1) moves so as to be displaced by the predetermined amount of displacement at all of the correction points.
- At least some of the parameters set on the parameter setting screen G103 e.g., the amount of displacement, the number
- the correction coefficient obtained in this manner is automatically updated as the parameter "correction coefficient.”
- the initial correction coefficient "0.100" (see FIG. 11) is automatically updated to the new correction coefficient obtained (e.g., "0.080").
- the operator can check the updated parameter "correction coefficient" on the parameter setting screen G103 (see FIG. 11).
- the number of correction points may be specified by the operator. That is, in order to simplify the table design of the position correction amount, three parameters: the number of correction points (number of divisions), the start point of the reciprocating motion, and the end point of the reciprocating motion, may be input by the operator, and the measurement system 1 may automatically calculate and set the correction interval.
- the amount of memory (such as the memory unit 5) required to store the position correction amount data is increased, and the design is guaranteed to be based on the amount of memory.
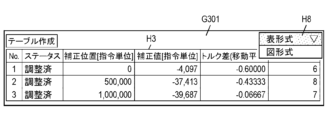
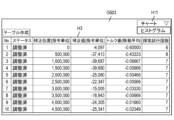
- the user screen G201 also includes a table display area H3 that displays the measurement results related to the correction positions and correction values (position correction amounts) in table format.
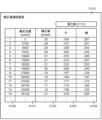
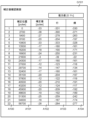
- This table display area H3 can be considered a modified example of the display example of the correction value confirmation screen G101 that includes the correction positions and correction values shown in FIG. 9.
- the correction positions and correction values corresponding to three correction point numbers ("No. 1" to "No. 3") are displayed, but the number of correction points is not particularly limited and can be, for example, 10 or more.
- the [Command unit] displayed on the user screen G201 is, for example, [pulse], which is the unit of the command pulse amount to the motors (M1, M2), similar to the correction value confirmation screen G101 in FIG. 9.
- FIG. 18 shows user screen G202 in which the [Command unit] has been converted to distance [mm] by the user selecting distance [mm] as the display unit in selection area H7.
- the corresponding numerical value is converted and displayed on user screen G202.
- User screen G202 is the same as user screen G201 in FIG. 17 except for the display unit [mm] and its numerical value. If the user selects [Command unit (pulse)] again in selection area H7, the display returns to user screen G201 in FIG. 17.
- the numerical value may be automatically displayed in the unit selected on the user screen G201 on the user screens related to the second to seventh functions described below. Specifically, for example, when distance [mm] is selected on the user screen G201, the numerical value may be automatically displayed in the unit of distance [mm] on the user screens G301 and G302 shown in Figures 19A and 19B, respectively.
- the selection area H7 may also be displayed on the user screens related to the second to seventh functions, allowing the user to select the display unit on the user screens related to the second to seventh functions.
- the measurement system 1 according to the fifth modification has a second function (a function of converting to a graphic format) as one of the support functions.
- the second function will be described below with reference to Figs. 19A and 19B.
- the measurement system 1 can display the user screen G301 shown in FIG. 19A and the user screen G302 shown in FIG. 19B on the display unit 70 of the terminal 7.
- User screen G301 includes a table display area H3, similar to user screen G201 in FIG. 17 and user screen G202 in FIG. 18, for example.
- User screen G301 may be a part of user screen G201 or G202, or may be a screen displayed separately from user screens G201 and G202.
- User screen G301 may be a screen displayed by performing an operation to open a past data file FL1, which will be described later.
- the list includes two display formats, [Table format] and [Graphic format], and [Table format], as shown in the table display area H3, is selected as the initial setting.
- the user can select one of the display formats other than [table format] from the list, [graphic format] in this case, and as shown in FIG. 19B, a user screen G302 is displayed in which data including the correction position, correction value, and torque difference are displayed in a graphical format.
- the user screen G302 may be displayed in addition to the user screen G301 while it is still displayed, or the user screen G301 may be closed and displayed in place of it.
- the measurement system 1 has a second function of converting data including correction values and the like displayed in a specific display format on the screen into another display format selected in response to a user selection operation (from table format to graphical format in this example) and displaying it.
- the second function allows the user to easily display data including correction values, etc., in a table format or in a diagram format, depending on the selection operation. This makes it easier for the user to check data including correction values, etc. In particular, the user can more intuitively understand data including correction values, etc., when the data is displayed in a diagram format.
- the processing unit of the measurement system 1 may display data including at least the position correction amount (correction value) on the display unit 70 in a display format (table format or diagram format in this case) selected in response to a (user's) selection operation.
- the measurement system 1 according to the fifth modification has a third function (a function for linking date information) as one of the support functions.
- the third function will be described below with reference to FIG.
- the measurement system 1 can display the user screen G401 shown in FIG. 20 on the display unit 70 of the terminal 7.
- the user screen G401 includes, for example, a table display area H3 and a setting area H4, similar to the user screen G201 in FIG. 17 and the user screen G202 in FIG. 18.
- the user screen G401 may be a part of the user screen G201 or G202, or may be a screen displayed separately from the user screens G201 and G202.
- User screen G401 is a screen that can be displayed, for example, when a user selects one of one or more data files FL1 (see FIG. 20) with a pointer on the screen or the like and performs an operation to open this data file FL1.
- Data file FL1 can contain at least some data such as measurement results, such as correction values (position correction amounts), when test operations were performed in the past, and setting conditions (numerical values of parameters) that were set during measurement.
- measurement results when test operations were performed in the past are displayed in the table display area H3, and the numerical values of the parameters that were set during the measurement are displayed in the setting area H4.
- Data file FL1 does not necessarily need to include both the measurement results and the setting conditions. For example, out of the measurement results and the setting conditions, data file FL1 may include only the setting conditions for managing the setting conditions, or conversely, may include only the measurement results for managing the measurement results. Data file FL1 is saved in storage unit 73 etc. after the measurement is completed, and the contents can be displayed at any time.
- the measurement system 1 has a third function of linking the above data with date information on when the test operation (measurement of the correction value) was performed when generating the data file FL1.
- the measurement system 1 generates and saves a data file FL1 in which the above data is linked with date information for each test operation.
- the user screen G401 displayed by opening the data file FL1 further includes a date display area H10.
- the date display area H10 shows date information on the test operation that was performed using the parameter values displayed in the setting area H4 and from which the measurement results displayed in the table display area H3 were obtained.
- the date information shows the date and time when the measurement of the correction value was performed (for example, the time when the measurement of the correction value ended), such as "Measurement date: 2023/07/10 14:27".
- User screen G501 includes a table display area H3, similar to user screen G201 in FIG. 17, user screen G202 in FIG. 18, user screen G301 in FIG. 19A, and user screen G401 in FIG. 20.
- User screen G501 may be a part of user screen G201 or G202, may be user screen G301, or may be a screen displayed separately from user screens G201, G202, and G301.
- user screen G501 may be a screen displayed upon start of a test operation like user screen G201, or may be a screen displayed upon execution of an operation to open a past data file FL1 like user screen G401 in FIG. 20.
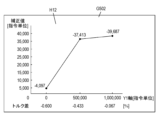
- User screen G502 includes a chart display area H12 in which the horizontal axis represents the correction point (also shows the position on the Y1 axis) and the vertical axis represents the correction value of the position on the Y2 axis relative to the position on the Y1 axis.
- the chart display area H12 a line graph based on the measurement results shown in the table display area H3 is displayed. The torque difference of the measurement results is also shown in the chart display area H12.
- the fourth function allows the user to easily display data including correction values, etc., in a table format or a chart format. This makes it easier for the user to check data including correction values, etc. In particular, by displaying data including correction values, etc., in a chart format, the user can more intuitively understand the rate of change in the correction values between correction points.
- the measurement system 1 according to the fifth modification has a fifth function (conversion function into a histogram format) as one of the support functions.
- the fifth function will be described below with reference to Figs. 22A and 22B.
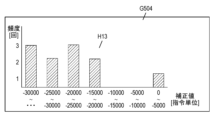
- the fifth function is a function equivalent to a modification of the fourth function described with reference to Figs. 21A and 21B.
- a user screen G504 is displayed in histogram format based on data including correction values, as shown in FIG. 22B.
- User screen G504 may be displayed in addition to user screen G503 while it is still displayed, or user screen G503 may be closed and displayed in place of it.
- the processing unit of the measurement system 1 may display data including at least the position correction amount (correction value) on the display unit 70 in a display format (here, a histogram format) selected in response to a (user's) selection operation.
- a display format here, a histogram format
- the display format of the data selected in response to the selection operation is any one of a table format, a diagram format, a chart format, and a histogram format.
- chart display area H12 in FIG. 21B and the histogram display area H13 in FIG. 22B may not only be switched between alternatively, but may also be displayed simultaneously on one screen.
- the chart display area H12 and the histogram display area H13, including the table display area H3, may be displayed simultaneously on one screen.
- the measurement system 1 according to the fifth modification has a sixth function (a function for comparatively displaying past data) as one of the support functions.
- the sixth function will be described below with reference to FIG.
- the second data file FL12 may contain the most recent data
- the first data file FL11 may contain data that is older than the data in the second data file FL12.
- the user may select the second data file FL12 generated by the current measurement and the first data file FL11 generated by the previous measurement, and compare the correction values, etc., to determine the degree of deterioration of the device over time, such as the Y1 axis and Y2 axis.
- the measurement system 1 highlights H15 in the table display area H14 the numerical values of the measurement results in the second data file FL12 that are determined to have a difference greater than a predetermined value compared to the numerical values of the measurement results in the first data file FL11.
- the measurement system 1 highlights H15, for example, by surrounding the numerical values in question with a frame or displaying them in color. In other words, the measurement system 1 highlights H15 in the table display area H14 to alert the user to the presence of such numerical values.
- the measurement system 1 has a sixth function of displaying two or more pieces of past data (two pieces as an example here) specified in response to a user's selection operation in a table format for easy comparison.
- the measurement system 1 also has a function of automatically comparing and judging two or more pieces of past data (two pieces as an example here) specified, and highlighting H15 the numerical value if there is a numerical value whose difference is judged to be greater than a predetermined value.
- the highlighting H15 may be performed based on the judgment criterion that "if there is a numerical value whose difference is judged to be greater than (or less than) 5% of the numerical value to be compared (for example, the first data file FL11),” that is, based on a judgment criterion using a "ratio.” Furthermore, the judgment criterion may be changed as appropriate depending on the type of parameter with the difference.
- the measurement system 1 according to the fifth modification has a seventh function (a comparative display function in a chart format and a comparative display function in a histogram format) as one of the support functions.
- the seventh function will be described below with reference to Figs. 24A and 24B.
- the seventh function is a function equivalent to a modified example of the sixth function described with reference to Fig. 23.
- the histogram display area H18 shows, for example, a distribution characteristic Q1 of the number of correction values for each interval based on the measurement results of the first data file FL11, and a distribution characteristic Q2 of the number of correction values for each interval based on the measurement results of the second data file FL12.
- the user can compare two (or more) sets of data, new data and old data displayed in histogram format, and more intuitively understand the degree of deterioration of the device on the Y1 axis, Y2 axis, etc. from the difference in the degree of variation of the correction value.
- chart display area H16 and the histogram display area H18 may not only be switched between alternatives, but may also be displayed simultaneously on one screen.
- the chart display area H16 and the histogram display area H18 may be displayed simultaneously on one screen, including the table display area H14 in FIG. 23.
- the position correction amount applied to the synchronous drive system (2) is calculated based on the first information and the second information regarding the first force applied to the first spindle (Y1) and the second force applied to the second spindle (Y2). Therefore, the measurement system (1) has the advantage of being able to suppress the effects that may occur due to interference between the axes.
- the calculation unit (14) calculates the difference between the first force and the second force at the same time, and multiplies the difference by a correction coefficient to calculate the position correction amount.
- the above aspect further improves the accuracy of the position correction amount, and can further reduce the effects of interference between axes.
- the measurement system (1) in the second aspect, further includes a third acquisition unit (13) and a coefficient calculation unit (15).
- the third acquisition unit (13) acquires third information related to frequency characteristics of vibrations in a drive system (A1) including each of the first motor (M1) and the second motor (M2).
- the coefficient calculation unit (15) calculates a correction coefficient based on the load masses of each of the first spindle (Y1) and the second spindle (Y2) and the third information.
- the measurement system (1) according to the fourth aspect further includes a coefficient calculation unit (15) that calculates a correction coefficient in the second aspect.
- the test operation further includes a specific test operation in which the first spindle (Y1) and the second spindle (Y2) move synchronously to a specified position by giving different position commands so that a deviation of a predetermined movement amount occurs between the first spindle (Y1) and the second spindle (Y2).
- the coefficient calculation unit (15) calculates the correction coefficient based on the fourth information related to the first force and the second force during the specific test operation and the predetermined movement amount.
- the amount of memory (such as the memory unit 5) required to store the data on the amount of position correction is increased, and the design is guaranteed to be based on the amount of memory.
Landscapes
- Engineering & Computer Science (AREA)
- Physics & Mathematics (AREA)
- General Physics & Mathematics (AREA)
- Automation & Control Theory (AREA)
- Power Engineering (AREA)
- Human Computer Interaction (AREA)
- Manufacturing & Machinery (AREA)
- Control Of Multiple Motors (AREA)
- Numerical Control (AREA)
- Control Of Position Or Direction (AREA)
Priority Applications (4)
| Application Number | Priority Date | Filing Date | Title |
|---|---|---|---|
| CN202380085663.5A CN120303871A (zh) | 2022-12-28 | 2023-11-16 | 测量系统、控制装置、测量方法以及程序 |
| JP2024567284A JPWO2024142654A1 (https=) | 2022-12-28 | 2023-11-16 | |
| KR1020257020220A KR20250111163A (ko) | 2022-12-28 | 2023-11-16 | 계측 시스템, 제어 장치, 계측 방법, 및 프로그램 |
| EP23911436.6A EP4645674A4 (en) | 2022-12-28 | 2023-11-16 | MEASURING SYSTEM, CONTROL DEVICE, MEASURING METHOD AND PROGRAM |
Applications Claiming Priority (6)
| Application Number | Priority Date | Filing Date | Title |
|---|---|---|---|
| JP2022212351 | 2022-12-28 | ||
| JP2022-212351 | 2022-12-28 | ||
| JP2023-088233 | 2023-05-29 | ||
| JP2023088233 | 2023-05-29 | ||
| JP2023125072 | 2023-07-31 | ||
| JP2023-125072 | 2023-07-31 |
Publications (1)
| Publication Number | Publication Date |
|---|---|
| WO2024142654A1 true WO2024142654A1 (ja) | 2024-07-04 |
Family
ID=91717027
Family Applications (1)
| Application Number | Title | Priority Date | Filing Date |
|---|---|---|---|
| PCT/JP2023/041325 Ceased WO2024142654A1 (ja) | 2022-12-28 | 2023-11-16 | 計測システム、制御装置、計測方法、及びプログラム |
Country Status (5)
| Country | Link |
|---|---|
| EP (1) | EP4645674A4 (https=) |
| JP (1) | JPWO2024142654A1 (https=) |
| KR (1) | KR20250111163A (https=) |
| CN (1) | CN120303871A (https=) |
| WO (1) | WO2024142654A1 (https=) |
Citations (3)
| Publication number | Priority date | Publication date | Assignee | Title |
|---|---|---|---|---|
| JP2017041075A (ja) | 2015-08-19 | 2017-02-23 | 株式会社安川電機 | モータ制御装置、位置制御システム、及びモータ制御方法 |
| JP2019145032A (ja) * | 2018-02-23 | 2019-08-29 | ファナック株式会社 | 数値制御装置 |
| JP2020171166A (ja) * | 2019-04-04 | 2020-10-15 | オムロン株式会社 | 制御装置、トルクバランス調整方法及びプログラム |
Family Cites Families (3)
| Publication number | Priority date | Publication date | Assignee | Title |
|---|---|---|---|---|
| JP4258262B2 (ja) * | 2003-04-22 | 2009-04-30 | 株式会社安川電機 | ツイン同期制御方法及び装置 |
| US11003154B2 (en) * | 2016-05-10 | 2021-05-11 | Panasonic Intellectual Property Managenent Co., Ltd. | Motor control system |
| CN110311594B (zh) * | 2019-05-05 | 2021-05-14 | 苏州汇川技术有限公司 | 双电机同步控制方法、系统及计算机可读存储介质 |
-
2023
- 2023-11-16 EP EP23911436.6A patent/EP4645674A4/en active Pending
- 2023-11-16 KR KR1020257020220A patent/KR20250111163A/ko active Pending
- 2023-11-16 WO PCT/JP2023/041325 patent/WO2024142654A1/ja not_active Ceased
- 2023-11-16 JP JP2024567284A patent/JPWO2024142654A1/ja active Pending
- 2023-11-16 CN CN202380085663.5A patent/CN120303871A/zh active Pending
Patent Citations (3)
| Publication number | Priority date | Publication date | Assignee | Title |
|---|---|---|---|---|
| JP2017041075A (ja) | 2015-08-19 | 2017-02-23 | 株式会社安川電機 | モータ制御装置、位置制御システム、及びモータ制御方法 |
| JP2019145032A (ja) * | 2018-02-23 | 2019-08-29 | ファナック株式会社 | 数値制御装置 |
| JP2020171166A (ja) * | 2019-04-04 | 2020-10-15 | オムロン株式会社 | 制御装置、トルクバランス調整方法及びプログラム |
Non-Patent Citations (1)
| Title |
|---|
| See also references of EP4645674A1 |
Also Published As
| Publication number | Publication date |
|---|---|
| EP4645674A4 (en) | 2026-04-15 |
| CN120303871A (zh) | 2025-07-11 |
| JPWO2024142654A1 (https=) | 2024-07-04 |
| KR20250111163A (ko) | 2025-07-22 |
| EP4645674A1 (en) | 2025-11-05 |
Similar Documents
| Publication | Publication Date | Title |
|---|---|---|
| US6885909B2 (en) | Numerical controller | |
| US20190266296A1 (en) | Machining simulation device of machine tool | |
| JP5766756B2 (ja) | 駆動軸の停止要因及びそれに関連する情報を取得するデータ取得装置 | |
| US7548795B2 (en) | Numerical control system | |
| CN101859096A (zh) | 采用pid控制器的控制方法及控制装置与机器人 | |
| US11506489B2 (en) | Contour accuracy measuring system and contour accuracy measuring method | |
| US20160243780A1 (en) | Servo press, control method, and program | |
| WO2014192525A1 (ja) | データ処理装置およびデータ処理方法 | |
| JP2009122852A (ja) | パステーブル運転時の運転履歴を記憶する数値制御装置 | |
| WO2024142654A1 (ja) | 計測システム、制御装置、計測方法、及びプログラム | |
| US20210311454A1 (en) | Maintenance support system, numerical controller, and control method of maintenance support system | |
| CN114647257B (zh) | 多轴控制调整装置、系统以及方法 | |
| JP6320162B2 (ja) | 開発支援装置及び開発支援方法及び開発支援プログラム | |
| EP3385798B1 (en) | Information processing device, information processing method, and information processing program | |
| KR100437964B1 (ko) | 위치제어장치 | |
| WO2009141006A1 (en) | A method and a system for controlling an industrial robot in accordance with a set of motion control parameters | |
| CN107272576B (zh) | 进给轴控制装置中的频率特性测定方法 | |
| WO2024236686A1 (ja) | 周波数応答測定装置 | |
| KR20100015121A (ko) | 제어기의 성능을 시험하기 위한 시험장치 | |
| JP2018124722A (ja) | 制御装置 | |
| US20250370444A1 (en) | Bot software for machine control | |
| CN108445833B (zh) | 精加工中轨迹智能修正系统及其方法 | |
| WO2025182929A1 (ja) | 調整支援方法、プログラム及び調整支援システム | |
| WO2025182928A1 (ja) | 調整支援方法、プログラム及び調整支援システム | |
| WO2025182930A1 (ja) | 調整支援方法、プログラム及び調整支援システム |
Legal Events
| Date | Code | Title | Description |
|---|---|---|---|
| 121 | Ep: the epo has been informed by wipo that ep was designated in this application |
Ref document number: 23911436 Country of ref document: EP Kind code of ref document: A1 |
|
| WWE | Wipo information: entry into national phase |
Ref document number: 202380085663.5 Country of ref document: CN |
|
| WWE | Wipo information: entry into national phase |
Ref document number: 1020257020220 Country of ref document: KR Ref document number: 2024567284 Country of ref document: JP |
|
| WWP | Wipo information: published in national office |
Ref document number: 202380085663.5 Country of ref document: CN |
|
| WWP | Wipo information: published in national office |
Ref document number: 1020257020220 Country of ref document: KR |
|
| WWE | Wipo information: entry into national phase |
Ref document number: 2023911436 Country of ref document: EP |
|
| NENP | Non-entry into the national phase |
Ref country code: DE |
|
| ENP | Entry into the national phase |
Ref document number: 2023911436 Country of ref document: EP Effective date: 20250728 |
|
| ENP | Entry into the national phase |
Ref document number: 2023911436 Country of ref document: EP Effective date: 20250728 |
|
| WWP | Wipo information: published in national office |
Ref document number: 2023911436 Country of ref document: EP |