WO2023218641A1 - 付着液体量計測システム - Google Patents
付着液体量計測システム Download PDFInfo
- Publication number
- WO2023218641A1 WO2023218641A1 PCT/JP2022/020225 JP2022020225W WO2023218641A1 WO 2023218641 A1 WO2023218641 A1 WO 2023218641A1 JP 2022020225 W JP2022020225 W JP 2022020225W WO 2023218641 A1 WO2023218641 A1 WO 2023218641A1
- Authority
- WO
- WIPO (PCT)
- Prior art keywords
- liquid
- adhering
- amount
- distribution
- time
- Prior art date
- Legal status (The legal status is an assumption and is not a legal conclusion. Google has not performed a legal analysis and makes no representation as to the accuracy of the status listed.)
- Ceased
Links
Images


Classifications
-
- G—PHYSICS
- G01—MEASURING; TESTING
- G01N—INVESTIGATING OR ANALYSING MATERIALS BY DETERMINING THEIR CHEMICAL OR PHYSICAL PROPERTIES
- G01N13/00—Investigating surface or boundary effects, e.g. wetting power; Investigating diffusion effects; Analysing materials by determining surface, boundary, or diffusion effects
-
- G—PHYSICS
- G01—MEASURING; TESTING
- G01N—INVESTIGATING OR ANALYSING MATERIALS BY DETERMINING THEIR CHEMICAL OR PHYSICAL PROPERTIES
- G01N17/00—Investigating resistance of materials to the weather, to corrosion, or to light
-
- G—PHYSICS
- G06—COMPUTING OR CALCULATING; COUNTING
- G06T—IMAGE DATA PROCESSING OR GENERATION, IN GENERAL
- G06T7/00—Image analysis
- G06T7/20—Analysis of motion
-
- G—PHYSICS
- G06—COMPUTING OR CALCULATING; COUNTING
- G06T—IMAGE DATA PROCESSING OR GENERATION, IN GENERAL
- G06T2207/00—Indexing scheme for image analysis or image enhancement
- G06T2207/10—Image acquisition modality
- G06T2207/10016—Video; Image sequence
-
- G—PHYSICS
- G06—COMPUTING OR CALCULATING; COUNTING
- G06T—IMAGE DATA PROCESSING OR GENERATION, IN GENERAL
- G06T2207/00—Indexing scheme for image analysis or image enhancement
- G06T2207/10—Image acquisition modality
- G06T2207/10048—Infrared image
-
- G—PHYSICS
- G06—COMPUTING OR CALCULATING; COUNTING
- G06T—IMAGE DATA PROCESSING OR GENERATION, IN GENERAL
- G06T2207/00—Indexing scheme for image analysis or image enhancement
- G06T2207/20—Special algorithmic details
- G06T2207/20084—Artificial neural networks [ANN]
Definitions
- the present invention relates to an adhering liquid amount measurement system that measures the distribution of the amount of adhering liquid adhering to a structure.
- the present invention relates to a technique for utilizing a moisture content estimation method using a near-infrared (NIR) spectrum camera in the design of new structures.
- NIR near-infrared
- Non-Patent Document 1 the NIR spectrum of rice crackers is measured using an NIR image measuring device equipped with a NIR spectrum camera, and the amount of moisture attached to the rice crackers is estimated from the measured NIR spectrum image using a moisture content estimation device. Discloses a technique for calculating.
- the present invention has been made in view of the above circumstances, and an object of the present invention is to appropriately control temporal changes in the distribution of the amount of liquid adhering to the surface of a new structure designed using a computer or the like.
- the objective is to provide a technology that can be estimated.
- a system for measuring the amount of adhered liquid images a test specimen placed in a test object observation area from multiple directions, and closely measures the distribution of the amount of adhered liquid adhered to the surface of the test specimen at predetermined time intervals.
- a measuring device that measures and records by infrared spectroscopy;
- a photographing device that photographs a particle tracking area adjacent to the test object observation area and tracks and records liquid particles in the particle tracking area;
- Using a spray device that sprays liquid particles into a particle tracking area, and time-series image data recorded by the measuring device and the imaging device the amount of liquid adhering to the surface of the structure to be installed in the planned installation area is calculated.
- an estimation device that estimates and calculates a change in the distribution over time.
- FIG. 1 is a diagram showing a specific example of a structure and an example of installation.
- FIG. 2 is a diagram showing an example of the device configuration of the adhering moisture amount measuring system.
- FIG. 3 is a diagram showing an example of the construction and configuration of a time-series estimator for surface moisture content.
- FIG. 4 is a diagram showing a flow for estimating the temporal change in the distribution of the amount of moisture adhering to the surface of a structure.
- FIG. 5 is a diagram showing an example of estimating a change over time in the distribution of the amount of moisture adhering to the surface of a structure.
- FIG. 6 is a diagram illustrating an example of the hardware configuration of a time-series estimator for surface moisture content.
- the present invention provides a method for estimating changes over time in the distribution of the amount of liquid adhering to the surface of a new structure designed using a computer, etc., and the acquisition of data necessary to construct the method. Regarding methods and.
- the present invention does not use only an NIR image measurement device or a water content estimation device as in the past, but also includes a particle tracer imaging device that tracks and records liquid particles in an area adjacent to the planned installation area of a structure, and The present invention is characterized in that it further uses a spray processing device that sprays liquid fine particles. That is, the present invention utilizes time-series image data of liquid particles recorded by a particle tracer imaging device in addition to time-series image data of the amount of adhered liquid recorded by an NIR image measuring device.
- Time-series image data recorded by a particle tracer imaging device records the ever-changing movement of liquid particles that reach a structure, so it is possible to determine the distribution of the amount of liquid adhering to the surface of a structure. It becomes possible to appropriately estimate changes over time. As a result, it becomes possible to appropriately estimate the amount of moisture adhering to the surface of a structure on a computer before creating the structure, making it easier to design the shape and select materials for a structure that is resistant to corrosion.
- FIG. 1 is a diagram showing a specific example and an installation example of a structure 100 that is planned to be designed.
- the structure 100 is a structure (for example, a surveillance camera, etc.) that is newly designed on a computer, and is installed outdoors or semi-outdoors (for example, a building, a bridge, etc.).
- the present invention estimates changes over time in the distribution of the amount of liquid adhering to the surface of the structure 100 in order to contribute to the search for the optimal shape and optimal material for a structure resistant to corrosion.
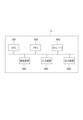
- FIG. 2 is a diagram showing an example of the device configuration of the adhesion moisture content measurement system 1.
- the adhering moisture amount measuring system 1 is an example of an adhering liquid amount measuring system. Water is an example of a deposit, and the system is applicable to any liquid.
- the attached moisture content measurement system 1 includes, for example, an NIR image measurement device 11, a particulate tracer imaging device 12, a spray processing device 13, an electric fan 14, and a surface moisture content time series estimator 15.
- AR1 in FIG. 2 is a test object observation area where a test object 200 corresponding to the structure 100 is placed and the surface of the test object 200 is imaged from multiple directions.
- AR2 is a particle tracking area adjacent to the test object observation area AR1.
- the NIR image measuring device 11 is a measuring device that is equipped with a NIR spectrum camera and measures changes over time in the distribution of adhering moisture due to water adhesion and water evaporation after spraying on the test specimen 200.
- the NIR image measurement device 11 is mounted on the tip of a robot arm and images the surface of the test specimen 200 placed in the specimen observation area AR1 from multiple directions, and uses its near-infrared spectroscopy function to Time-series image data of the distribution of the amount of moisture adhering to the surface of the test specimen 200 is measured and recorded at predetermined time intervals.
- the particulate tracer photographing device 12 is a photographing device that photographs a particulate tracking area AR2 adjacent to the test object observation area AR1, and tracks and records the movement of water particles floating and scattering within the space of the particulate tracking area AR2 during spray processing. be.
- the particle tracer imaging device 12 tracks and records time-series image data of water particles in the particle tracking area AR2 at predetermined time intervals.
- the spray processing device 13 operates in conjunction with the NIR image measurement device 11 and the particulate tracer imaging device 12, and sprays water particles to the test object observation area AR1 and the particulate tracking area AR2. This is a spray device that sprays water particles onto a test specimen 200.
- the electric fan 14 is an auxiliary tool that operates in conjunction with the spray processing device 13 and allows water particles to reach the test specimen 200.
- the electric fan 14 controls the amount of water particles sprayed onto the test object observation area AR1.
- the surface water content time series estimator 15 is communicatively connected to the NIR image measuring device 11, the particulate tracer photographing device 12, the spray processing device 13, and the electric fan 14, and is connected to the NIR image measuring device 11 and the particulate tracer photographing device 12, respectively.
- estimate and calculate the change over time in the distribution of the amount of moisture adhering to the surface of the structure 100 (see Figure 1) to be installed in the planned installation area ( ⁇ test object observation area AR1) This is an estimation device that
- the surface moisture content time series estimator 15 uses shape data of the test body 200 in the test body observation area AR1, time series image data of the distribution of adhering moisture content on the surface of the test body 200, Using time-series image data of water particles in the particulate tracking area AR2, changes over time in the distribution of the amount of water adhering to the surface of the test specimen 200 are learned.
- the surface moisture time series estimator 15 also uses shape data of structures to be installed in the planned installation area, time series image data of water particles in a particulate tracking area adjacent to the planned installation area, and information on the amount of attached moisture. Using the learning results of the changes in the distribution over time, the changes over time in the distribution of the amount of moisture adhering to the surface of the structure 100 are estimated and calculated.
- the user of the attached moisture content measurement system 1 prepares a plurality of basic element shapes of the test specimen 200.
- the attached moisture content measurement system 1 performs the spraying process multiple times on the test specimen observation area AR1 and the particulate tracking area AR2. Then, the attached moisture content measurement system 1 acquires image data of the sprayed water particles, and further acquires image data obtained by measuring the amount of attached moisture attached to the surface of the test specimen 200 using an NIR spectrum camera.
- the adhesion moisture measurement system 1 uses the acquired two types of video data to generate a surface moisture content time series for estimating the temporal change in the distribution of adhesion moisture adhering to the surface of the arbitrarily shaped test specimen 200.
- An estimator 15 is constructed.
- the adhesion moisture measurement system 1 obtains an estimated value of the change over time in the distribution of adhesion moisture adhering to the surface of the structure 100 whose shape has been newly designed, using the constructed surface moisture amount time series estimator 15. .
- the attached moisture content measurement system 1 includes an NIR image measurement device 11 that photographs a test specimen 200 placed on a mount M from multiple directions using an NIR spectrum camera, and a particulate matter tracking area AR2 in which floating/scattering particles are detected. and a particulate tracer imaging device 12 that generates image data of water particles.
- a test specimen 200 having a predetermined basic element shape is placed on a mount M, and the spraying process is performed multiple times according to a spraying process condition pattern in which the spraying conditions such as spray amount, spray time, spray angle, etc. are adjusted and changed. .
- image data in the particulate tracking area AR2 is measured by the particulate tracer imaging device 12.
- the amount of water attached to the surface of the test specimen 200 is measured by the NIR image measurement device 11 at predetermined time intervals.
- the NIR image measurement device 11 obtains time-series image data of a two-dimensional image of the amount of moisture adhering to the surface of the test piece 200 by photographing the test piece 200 from a fixed position with an NIR spectrum camera having a near-infrared spectroscopy function. get.
- the NIR image measuring device 11 acquires time-series image data of three-dimensional images using an NIR spectrum camera having a movable mechanism.
- the particulate tracer imaging device 12 uses a laser sheet based on particle image velocimetry (PIV) at a fixed position to capture time-series image data of two-dimensional images of the state of water particle scattering. get.
- the particulate tracer imaging device 12 acquires time-series image data of a three-dimensional image by time-divisionally scanning the observation space with a plurality of laser sheets.
- test specimens 200 in which the shapes of basic elements are changed are prepared, and the above processing procedure is performed for each of them.
- each time series image data of the movement of water particles with respect to the test body 200 and each video data of the distribution of the amount of adhering moisture on the surface of the test body 200 are obtained. Multiple sets are acquired.
- the basic element shape of the test specimen 200 is a shape that reflects the partial structure and partial shape of the structure 100 to be designed.
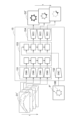
- FIG. 3 is a diagram showing an example of the construction and configuration of the surface water content time series estimator 15.
- the shape pattern P of the basic elements of the test body 200 For a plurality of test bodies 200 having different shapes, the shape pattern P of the basic elements of the test body 200, the video data D1 of the movement of water particles within the particle tracking area AR2 with respect to the shape pattern P, and the Based on the video data D2 of the distribution of the amount of water adhering to the surface, the shape pattern P of the basic element and the video data D1 of the movement of water particles are input, and the amount of adhering water adhering to the surface of the test specimen 200 is calculated.
- a surface water content time series estimator 15 is constructed to estimate and calculate distribution video data D2.
- the surface moisture content time series estimator 15 includes a plurality of first encoding layers 151 that extract image features of water particles from each time series image data of the video data D1, and shape patterns of basic elements included in the test specimen 200. and a second encoding layer 152 that extracts shape features of P.
- the first encoding layer 151 is a feature extractor such as a CNN (Convolutional Neural Network).
- the surface water content time series estimator 15 inputs the time series image features of each water particle extracted by each first encoding layer 151 to the estimation unit 153, which is a series estimation layer.
- the estimation unit 153 is, for example, an LSTM (Long Short Term Memory) or a GRU (Gated Recurrent Unit).
- the surface moisture content time series estimator 15 inputs the shape features of the basic element shape pattern P extracted in the second encoding layer 152 to the estimation unit 153, and inputs the shape features of the shape pattern P of the basic elements extracted in the second encoding layer 152 into the water content of the video data D1 extracted in the first encoding layer 151. It is input to each decoding layer 154 that constructs video data D2 along with the image characteristics of the particles.
- autoencoder #1 whose input/output is the shape pattern P of the basic element included in the test object 200 and autoencoder #2 whose input/output is the video data D2 are trained. I'll keep it.
- an encoder/decoder that connects the encoding layer of autoencoder #1 and the decoding layer of autoencoder #2 generates an average image (for example, The encoder/decoder is trained in advance to output time-averaged images captured during observation periods ranging from several minutes to several hours.
- the encoding and decoding of this encoder/decoder are respectively defined as the second encoding layer 152 and the decoding layer 154, and each variable parameter of the encoding and decoding at the time of average image output is set as the initial value of the variable parameter of each layer 152, 154,
- an estimating unit 153 capable of estimating and calculating time-series data of the distribution of the amount of moisture adhering to the surface of the test specimen 200 is constructed.
- each independently constructed decoding layer 154 further repeats the parameters for image sequence estimation, which is the original purpose, using the parameters at that time as initial values. learn. Eventually, each decoding layer 154 converges into a network having different parameters, thereby generating time-series image data.
- FIG. 4 is a diagram showing a flow for estimating the temporal change in the distribution of the amount of moisture adhering to the surface of the newly designed structure 100.
- Step S1; The surface moisture content time series estimator 15 inputs the shape data of the newly designed shape pattern P' of the structure 100 (see FIG. 5).
- Step S2 Next, water particles are scattered from the spray treatment device 13 in the planned installation area where the structure 100 is to be installed.
- the surface water content time series estimator 15 acquires image data D1' of water particles floating and scattering in a particle tracking area adjacent to the planned installation area from the particle tracer imaging device 12 (see FIG. 5).
- Step S3 the surface moisture content time series estimator 15 uses the shape data of the shape pattern P' of the structure 100, the image data D1' of water particles in the particulate tracking area, and the distribution of the adhering moisture content learned so far.
- the video data D2' of the distribution of the amount of moisture adhering to the surface of the structure 100 is estimated and calculated using the learning results of changes over time (see FIG. 5).
- the user repeatedly changes the design of the structure 100 so that the time course of the moisture content shown in the video data D2' falls within the predetermined usage conditions of the structure 100.
- the adhering moisture content measurement system 1 images the test specimen 200 placed in the test specimen observation area AR1 from multiple directions, and determines the distribution of the adhering moisture amount adhering to the surface of the test specimen 300 in a predetermined manner.
- NIR image measuring device 11 measures and records by near-infrared spectroscopy at time intervals of When recorded by the particulate tracer photographing device 12, the spray processing device 13 that sprays water particles onto the test object observation area AR1 and the particulate tracking area AR2, the NIR image measuring device 11, and the particulate tracer photographing device 12, respectively.
- the surface moisture content time series estimator 15 of this embodiment described above includes, for example, a CPU 901, a memory 902, a storage 903, a communication device 904, an input device 905, and an output device 906, as shown in FIG. It can be realized using a general-purpose computer system equipped with and. Memory 902 and storage 903 are storage devices. In the computer system, each function of the surface moisture time series estimator 15 is realized by the CPU 901 executing a predetermined program loaded onto the memory 902.
- the surface moisture content time series estimator 15 may be implemented by one computer.
- the surface moisture content time series estimator 15 may be implemented using multiple computers.
- the surface moisture content time series estimator 15 may be a virtual machine implemented in a computer.
- the program for the surface moisture content time series estimator 15 can be stored in a computer-readable recording medium such as an HDD, SSD, USB memory, CD, or DVD.
- the program for the surface moisture content time series estimator 15 can also be distributed via a communication network.
- Adhesive moisture content measurement system 11 NIR image measurement device 12: Particle tracer imaging device 13: Spray processing device 14: Electric fan 15: Surface moisture content time series estimator 151: First encoding layer 152: Second encoding layer 153: Estimation unit 154: Decode layer 100: Structure 200: Test object 901: CPU 902: Memory 903: Storage 904: Communication device 905: Input device 906: Output device
Landscapes
- Engineering & Computer Science (AREA)
- General Physics & Mathematics (AREA)
- Physics & Mathematics (AREA)
- Life Sciences & Earth Sciences (AREA)
- Chemical & Material Sciences (AREA)
- General Health & Medical Sciences (AREA)
- Health & Medical Sciences (AREA)
- Pathology (AREA)
- Immunology (AREA)
- Analytical Chemistry (AREA)
- Biochemistry (AREA)
- Multimedia (AREA)
- Theoretical Computer Science (AREA)
- Computer Vision & Pattern Recognition (AREA)
- Biodiversity & Conservation Biology (AREA)
- Ecology (AREA)
- Environmental & Geological Engineering (AREA)
- Environmental Sciences (AREA)
- Investigating Or Analysing Materials By Optical Means (AREA)
Abstract
Description
本発明は、計算機等で設計される新規構造物において、その構造物の表面に付着する付着液体量の分布の経時変化を推定する手法と、その手法を構築するために必要なデータを取得する手法と、に関する。
図1は、設計予定である構造物100の具体例及び設置例を示す図である。構造物100は、計算機上で新規設計される構造物(例えば、監視カメラ等)であり、屋外や半屋外(例えば、建築物や橋梁等)に設置される。本発明は、腐食に強い構造物の最適形状や最適材料の探索に資するため、この構造物100の表面に付着する付着液体量の分布の経時変化を推定する。
図2は、付着水分量計測システム1の装置構成例を示す図である。なお、付着水分量計測システム1は、付着液体量計測システムの例である。水は付着物の例であり、本システムは任意の液体に応用可能である。
付着水分量計測システム1のユーザは、試験体200の基本要素形状を複数種類用意する。
[表面に付着する水分量のシステム構成と表面水分量データ取得]
まず、試験体200を配置する架台Mと試験体200へ水を噴霧する噴霧処理装置13とを用いて、試験体200の表面各部に付着する水分量とその経時変化を計測する付着水分量計測システム1を用意する。
図3は、表面水分量時系列推定機15の構築例・構成例を示す図である。
図4は、新規に設計された構造物100の表面付着水分量の分布の経時変化の推定フローを示す図である。
表面水分量時系列推定機15は、新規に設計された構造物100の形状パターンP’の形状データを入力する(図5参照)。
次に、構造物100を設置する設置予定エリアにおいて、噴霧処理装置13から水粒子を飛散させる。表面水分量時系列推定機15は、微粒子トレーサ撮影装置12から、その設置予定エリアに隣接する微粒子追跡エリア内を浮遊・飛散する水粒子の映像データD1’を取得する(図5参照)。
最後に、表面水分量時系列推定機15は、構造物100の形状パターンP’の形状データと、微粒子追跡エリア内の水粒子の映像データD1’と、これまでに学習した付着水分量の分布の経時変化の学習結果と、を用いて、構造物100の表面に付着する付着水分量の分布の映像データD2’を推定計算する(図5参照)。
本実施形態によれば、付着水分量計測システム1が、試験体観測エリアAR1に配置された試験体200を複数方向から撮像し、前記試験体300の表面に付着した付着水分量の分布を所定の時間間隔で近赤外分光法により計測記録するNIR画像計測装置11と、前記試験体観測エリアAR1に隣接する微粒子追跡エリアAR2を撮影し、前記微粒子追跡エリアAR2内の水粒子を追跡記録する微粒子トレーサ撮影装置12と、前記試験体観測エリアAR1と前記微粒子追跡エリアAR2に水粒子を噴霧する噴霧処理装置13と、前記NIR画像計測装置11と前記微粒子トレーサ撮影装置12でそれぞれ記録された時系列画像データを用いて、設置予定エリアに設置される構造物100の表面に付着する付着水分量の分布の経時変化を推定計算する表面水分量時系列推定機15と、を備えるので、計算機等で設計される新規の構造物において、その構造物の表面に付着する付着液体量の分布の経時変化を適切に推定可能な技術を提供できる。
本発明は、上記実施形態に限定されない。本発明は、本発明の要旨の範囲内で数々の変形が可能である。
11:NIR画像計測装置
12:微粒子トレーサ撮影装置
13:噴霧処理装置
14:扇風機
15:表面水分量時系列推定機
151:第1エンコード層
152:第2エンコード層
153:推定部
154:デコード層
100:構造物
200:試験体
901:CPU
902:メモリ
903:ストレージ
904:通信装置
905:入力装置
906:出力装置
Claims (4)
- 試験体観測エリアに配置された試験体を複数方向から撮像し、前記試験体の表面に付着した付着液体量の分布を所定の時間間隔で近赤外分光法により計測記録する計測装置と、
前記試験体観測エリアに隣接する微粒子追跡エリアを撮影し、前記微粒子追跡エリア内の液体微粒子を追跡記録する撮影装置と、
前記試験体観測エリアと前記微粒子追跡エリアに液体微粒子を噴霧する噴霧装置と、
前記計測装置と前記撮影装置でそれぞれ記録された時系列画像データを用いて、設置予定エリアに設置される構造物の表面に付着する付着液体量の分布の経時変化を推定計算する推定装置と、
を備える付着液体量計測システム。 - 前記推定装置は、
前記試験体の形状データと、前記試験体の表面に付着した付着液体量の分布の時系列画像データと、前記微粒子追跡エリア内の液体微粒子の時系列画像データと、を用いて、前記試験体の表面に付着する付着液体量の分布の経時変化を学習する請求項1に記載の付着液体量計測システム。 - 前記推定装置は、
前記構造物の形状データと、前記設置予定エリアに隣接する微粒子追跡エリア内の液体微粒子の時系列画像データと、前記付着液体量の分布の経時変化の学習結果と、を用いて、前記構造物の表面に付着する付着液体量の分布の経時変化を推定計算する請求項2に記載の付着液体量計測システム。 - 前記液体は、
水である請求項1乃至3のいずれかに記載の付着液体量計測システム。
Priority Applications (3)
| Application Number | Priority Date | Filing Date | Title |
|---|---|---|---|
| JP2024520214A JPWO2023218641A1 (ja) | 2022-05-13 | 2022-05-13 | |
| PCT/JP2022/020225 WO2023218641A1 (ja) | 2022-05-13 | 2022-05-13 | 付着液体量計測システム |
| US18/863,269 US20250297936A1 (en) | 2022-05-13 | 2022-05-13 | Adhesion Amount Measurement System |
Applications Claiming Priority (1)
| Application Number | Priority Date | Filing Date | Title |
|---|---|---|---|
| PCT/JP2022/020225 WO2023218641A1 (ja) | 2022-05-13 | 2022-05-13 | 付着液体量計測システム |
Publications (1)
| Publication Number | Publication Date |
|---|---|
| WO2023218641A1 true WO2023218641A1 (ja) | 2023-11-16 |
Family
ID=88730181
Family Applications (1)
| Application Number | Title | Priority Date | Filing Date |
|---|---|---|---|
| PCT/JP2022/020225 Ceased WO2023218641A1 (ja) | 2022-05-13 | 2022-05-13 | 付着液体量計測システム |
Country Status (3)
| Country | Link |
|---|---|
| US (1) | US20250297936A1 (ja) |
| JP (1) | JPWO2023218641A1 (ja) |
| WO (1) | WO2023218641A1 (ja) |
Citations (4)
| Publication number | Priority date | Publication date | Assignee | Title |
|---|---|---|---|---|
| JP2009294176A (ja) * | 2008-06-09 | 2009-12-17 | Espec Corp | 環境試験装置における試料表面への水膜形成方法及び環境試験装置 |
| JP2015230290A (ja) * | 2014-06-06 | 2015-12-21 | 株式会社村田製作所 | 結露試験方法および結露試験装置 |
| JP2019184510A (ja) * | 2018-04-16 | 2019-10-24 | 日本電信電話株式会社 | 腐食試験方法および腐食試験装置 |
| JP2021193347A (ja) * | 2020-06-08 | 2021-12-23 | 株式会社東芝 | 絶縁耐性診断装置及び絶縁耐性診断方法 |
Family Cites Families (3)
| Publication number | Priority date | Publication date | Assignee | Title |
|---|---|---|---|---|
| JP2012132848A (ja) * | 2010-12-22 | 2012-07-12 | Mitsubishi Heavy Ind Ltd | 排煙挙動試験装置 |
| JP6673715B2 (ja) * | 2016-02-18 | 2020-03-25 | 一般財団法人電力中央研究所 | 構造物の付着物検出装置及び鉄塔の腐食管理システム |
| JP7499634B2 (ja) * | 2020-07-17 | 2024-06-14 | アズビル株式会社 | 結露予測装置、空調機器制御装置及び結露予測方法 |
-
2022
- 2022-05-13 US US18/863,269 patent/US20250297936A1/en active Pending
- 2022-05-13 WO PCT/JP2022/020225 patent/WO2023218641A1/ja not_active Ceased
- 2022-05-13 JP JP2024520214A patent/JPWO2023218641A1/ja active Pending
Patent Citations (4)
| Publication number | Priority date | Publication date | Assignee | Title |
|---|---|---|---|---|
| JP2009294176A (ja) * | 2008-06-09 | 2009-12-17 | Espec Corp | 環境試験装置における試料表面への水膜形成方法及び環境試験装置 |
| JP2015230290A (ja) * | 2014-06-06 | 2015-12-21 | 株式会社村田製作所 | 結露試験方法および結露試験装置 |
| JP2019184510A (ja) * | 2018-04-16 | 2019-10-24 | 日本電信電話株式会社 | 腐食試験方法および腐食試験装置 |
| JP2021193347A (ja) * | 2020-06-08 | 2021-12-23 | 株式会社東芝 | 絶縁耐性診断装置及び絶縁耐性診断方法 |
Also Published As
| Publication number | Publication date |
|---|---|
| US20250297936A1 (en) | 2025-09-25 |
| JPWO2023218641A1 (ja) | 2023-11-16 |
Similar Documents
| Publication | Publication Date | Title |
|---|---|---|
| Schindelholz et al. | Wetting phenomena and time of wetness in atmospheric corrosion: a review. | |
| Garrido González et al. | Automatic detection of moistures in different construction materials from thermographic images | |
| Grediac et al. | The Grid Method for In‐plane Displacement and Strain Measurement: A Review and Analysis | |
| US20200284686A1 (en) | Vision-based fatigue crack detection using feature tracking | |
| Rebmann et al. | Data acquisition and flux calculations | |
| Wu et al. | Non-contact measurement method of beam vibration with laser stripe tracking based on tilt photography | |
| Guo et al. | Structural vibration measurement based on improved phase-based motion magnification and deep learning | |
| CN120123697B (zh) | 一种多模态强化学习驱动的pm2.5化学组分垂直廓线反演系统及方法 | |
| Wanishsakpong et al. | Optimal time series model for forecasting monthly temperature in the southwestern region of Thailand | |
| CN117784864A (zh) | 自适应状态控制的光伏板清洗机器人环境调节方法及系统 | |
| CN120370716B (zh) | 一种适用于无人机的清洗应用和数据处理系统 | |
| CN115439463A (zh) | 焊接质量的确定方法、装置、处理器及焊接质量诊断系统 | |
| Liu et al. | Real-time 3D surface measurement in additive manufacturing using deep learning | |
| Yan et al. | A review of video‐based rainfall measurement methods | |
| Wang et al. | A vision-based method for estimating shallow cable tension via vibrational properties | |
| Morlier et al. | New image processing tools for structural dynamic monitoring | |
| Nsugbe et al. | Monitoring the particle size distribution of a powder mixing process with acoustic emissions: a review | |
| US20250297936A1 (en) | Adhesion Amount Measurement System | |
| CN118567953B (zh) | 一种设备功耗确定方法、设备、程序产品及介质 | |
| CN114798393A (zh) | 一种液态金属涂层的处理方法及系统 | |
| CN120065375A (zh) | 云团移动轨迹的预测方法、装置、设备、介质及程序产品 | |
| Liu et al. | In-situ subsurface defect detection in directed energy deposition using pulse phase thermography and thermal motion magnification | |
| CN118533908A (zh) | 金属屋面损伤检测设备、方法、系统及介质 | |
| Laidi et al. | Novel approach for estimating monthly sunshine duration using artificial neural networks: A case study | |
| Schmidt et al. | Towards autonomous shotcrete construction: Semantic 3D reconstruction for concrete deposition using stereo vision and deep learning |
Legal Events
| Date | Code | Title | Description |
|---|---|---|---|
| 121 | Ep: the epo has been informed by wipo that ep was designated in this application |
Ref document number: 22941718 Country of ref document: EP Kind code of ref document: A1 |
|
| WWE | Wipo information: entry into national phase |
Ref document number: 2024520214 Country of ref document: JP |
|
| WWE | Wipo information: entry into national phase |
Ref document number: 18863269 Country of ref document: US |
|
| NENP | Non-entry into the national phase |
Ref country code: DE |
|
| 122 | Ep: pct application non-entry in european phase |
Ref document number: 22941718 Country of ref document: EP Kind code of ref document: A1 |
|
| WWP | Wipo information: published in national office |
Ref document number: 18863269 Country of ref document: US |