WO2023218619A1 - 圧延生産性向上支援装置 - Google Patents
圧延生産性向上支援装置 Download PDFInfo
- Publication number
- WO2023218619A1 WO2023218619A1 PCT/JP2022/020125 JP2022020125W WO2023218619A1 WO 2023218619 A1 WO2023218619 A1 WO 2023218619A1 JP 2022020125 W JP2022020125 W JP 2022020125W WO 2023218619 A1 WO2023218619 A1 WO 2023218619A1
- Authority
- WO
- WIPO (PCT)
- Prior art keywords
- productivity
- data
- index
- plant
- rolling
- Prior art date
- Legal status (The legal status is an assumption and is not a legal conclusion. Google has not performed a legal analysis and makes no representation as to the accuracy of the status listed.)
- Ceased
Links
Images



Classifications
-
- B—PERFORMING OPERATIONS; TRANSPORTING
- B21—MECHANICAL METAL-WORKING WITHOUT ESSENTIALLY REMOVING MATERIAL; PUNCHING METAL
- B21B—ROLLING OF METAL
- B21B37/00—Control devices or methods specially adapted for metal-rolling mills or the work produced thereby
-
- B—PERFORMING OPERATIONS; TRANSPORTING
- B21—MECHANICAL METAL-WORKING WITHOUT ESSENTIALLY REMOVING MATERIAL; PUNCHING METAL
- B21B—ROLLING OF METAL
- B21B38/00—Methods or devices for measuring, detecting or monitoring specially adapted for metal-rolling mills, e.g. position detection, inspection of the product
-
- G—PHYSICS
- G05—CONTROLLING; REGULATING
- G05B—CONTROL OR REGULATING SYSTEMS IN GENERAL; FUNCTIONAL ELEMENTS OF SUCH SYSTEMS; MONITORING OR TESTING ARRANGEMENTS FOR SUCH SYSTEMS OR ELEMENTS
- G05B19/00—Program-control systems
- G05B19/02—Program-control systems electric
- G05B19/418—Total factory control, i.e. centrally controlling a plurality of machines, e.g. direct or distributed numerical control [DNC], flexible manufacturing systems [FMS], integrated manufacturing systems [IMS] or computer integrated manufacturing [CIM]
-
- Y—GENERAL TAGGING OF NEW TECHNOLOGICAL DEVELOPMENTS; GENERAL TAGGING OF CROSS-SECTIONAL TECHNOLOGIES SPANNING OVER SEVERAL SECTIONS OF THE IPC; TECHNICAL SUBJECTS COVERED BY FORMER USPC CROSS-REFERENCE ART COLLECTIONS [XRACs] AND DIGESTS
- Y02—TECHNOLOGIES OR APPLICATIONS FOR MITIGATION OR ADAPTATION AGAINST CLIMATE CHANGE
- Y02P—CLIMATE CHANGE MITIGATION TECHNOLOGIES IN THE PRODUCTION OR PROCESSING OF GOODS
- Y02P90/00—Enabling technologies with a potential contribution to greenhouse gas [GHG] emissions mitigation
- Y02P90/30—Computing systems specially adapted for manufacturing
Definitions
- the present invention relates to a rolling productivity improvement support device that supports improvement of plant productivity in a plant that rolls ferrous and non-ferrous materials.
- a plant that rolls ferrous and non-ferrous materials has a hot rolling line.
- a typical hot rolling line has a series of equipment such as a heating furnace, a rough rolling mill, a finishing mill, and a winding machine. The material that has gone through the processing process in each facility is finally wound up by a winding machine to become a product.
- mill pacing is known as a technology that optimally adjusts the timing of introducing material into the hot rolling line, taking into account the time required for material processing (rolling) and transportation. ing.
- Various methods for optimal adjustment have also been proposed (for example, see Patent Documents 1 to 3). However, these methods are technologies based on current material processing (rolling) and transportation time, and do not improve these assumptions.
- productivity varies greatly depending on the material, rolling conditions, equipment status, etc., and even the productivity of the same rolled material has large fluctuations. For this reason, it is difficult to discover and determine whether or not the productivity of the material is decreasing every time it is rolled for each product. Furthermore, since the amount of production information in a plant is enormous, even if it is determined that productivity has decreased, it is difficult to determine with high accuracy what factors are causing the decrease in productivity. difficult.
- this disclosure specifies productivity using productivity parameters for each management category and indicators obtained by breaking them down into their constituent elements, and uses these indicators as potential causes of productivity decline for plant managers and operators.
- the purpose is to contribute to rapid improvement and improvement of productivity by presenting the information to the employees.
- a rolling productivity improvement support device includes a data collection unit that collects plant data including a production plan, production results, and operating status from the plant, and a data collection unit that collects plant data from the plant in a plant that rolls ferrous and non-ferrous materials.
- An indicator calculation unit that calculates productivity, components of productivity, and index values for each of the components based on the plant data acquired by the data collection unit;
- a data storage unit that stores index data, which is data of calculated index values, and a comparison between the productivity index to be evaluated and past productivity index results each time plant data is collected.
- the productivity evaluation department evaluates the productivity decline, the results of the evaluation of the productivity decline conducted by the productivity evaluation department, the productivity that was the basis for the evaluation results, and the components of productivity.
- a display unit that displays the values of the indices of each of the constituent elements.
- productivity is identified using productivity parameters for each management category and indicators obtained by breaking them down into their constituent elements, and these indicators are used by plant managers and operators as possible causes of productivity decline.
- productivity parameters for each management category and indicators obtained by breaking them down into their constituent elements are used by plant managers and operators as possible causes of productivity decline.
- FIG. 1 is a diagram showing an example of the configuration of a rolling productivity improvement support device according to a first embodiment. It is a flowchart which shows an example of operation of the rolling productivity improvement support device concerning a 1st embodiment. It is a figure showing an example of composition of a rolling productivity improvement support device concerning a 2nd embodiment. It is a flow chart which shows an example of operation of a rolling productivity improvement support device concerning a 2nd embodiment. It is a figure showing an example of composition of a rolling productivity improvement support device concerning a 3rd embodiment. It is a flow chart which shows an example of operation of a rolling productivity improvement support device concerning a 3rd embodiment. 8 is a conceptual diagram showing an example of the hardware configuration of a processing circuit included in the rolling productivity improvement support device in the embodiment shown in FIGS. 1 to 7. FIG.
- FIG. 1 is a schematic diagram showing an example of a hot rolling line 100 in a plant.
- FIG. 1 shows an example of a hot rolling line 100 viewed from the side.
- the hot rolling line 100 is provided, for example, in a plant that rolls rolling materials such as ferrous or non-ferrous materials (not shown).
- the rolled material is controlled to flow from the left side to the right side in FIG.
- the hot rolling line 100 is also referred to as a "plant 100.”
- the rolled material is also referred to as "rolled material” or simply "material.”
- the hot rolling line (plant) 100 is managed in stages of the manufacturing process, including main equipment such as a heating furnace 1, a rough rolling mill 3, a finishing rolling mill 5, and a winding machine 7, as well as conveying equipment between these equipment. Ru.
- the hot rolling line 100 divides the heating furnace 1, rough rolling mill 3, finishing rolling mill 5, winding machine 7, and each conveying device into management divisions called zones, and improves the productivity of each process. managed.
- the hot rolling line 100 includes, for example, a heating furnace zone 11, a first conveying zone 12, a rough rolling mill zone 13, a second conveying zone 14, a finishing rolling mill zone 15, a third conveying zone 16, It has a winder zone 17. As a general rule, each zone cannot contain more than one rolled material.
- the heating furnace zone 11 has a heating furnace 1 that heats the rolled material.
- the heating furnace 1 receives and heats a rolled material to be rolled, for example in the form of a slab.
- the heat-treated rolled material is extracted from the heating furnace 1 and introduced into the first conveyance zone 12 .
- the heating furnace 1 then receives the next subsequent rolling material and heats the received next rolling material.
- the heating furnace 1 sequentially repeats such a rolled material receiving process, a rolled material heating process, and a rolled material extraction process for each rolled material. Note that the timing of receiving and extracting the rolled material from the heating furnace 1 is controlled by, for example, mill pacing.
- the first conveyance zone 12 includes, for example, a first conveyance device 2 that conveys the rolled material heated in the heating furnace 1 from the exit side of the heating furnace 1 to the input side of the rough rolling mill 3.
- the first conveyance device 2 is realized using, for example, a conveyance table, a conveyor, or a plurality of conveyance rolls.
- the first conveying device 2 conveys the rolled material extracted from the heating furnace 1 to the rough rolling mill 3 . Note that, for example, if there is a waiting time until the rolled material being transported can be processed, the first conveying device 2 reciprocates the rolled material being transported back and forth, so that a plurality of rolled materials are simultaneously processed into the next rough material. It may be arranged so that it is not fed into the rolling mill 3.
- the rough rolling mill zone 13 has a rough rolling mill 3 that roughly rolls the rolled material.
- the rough rolling mill 3 is realized using, for example, a rolling mill with one or more stands.
- the rough rolling mill 3 receives the rolled material extracted from the heating furnace 1 and transported by the first transport device 2 . Thereafter, the rough rolling mill 3 roughly rolls the received rolled material.
- the rolled material roughly rolled by the rough rolling mill 3 is sent to the second conveyance zone 14.
- the second conveyance zone 14 includes, for example, a second conveyance device 4 that conveys the rolled material rough rolled by the rough rolling mill 3 from the exit side of the rough rolling mill 3 to the input side of the finishing rolling mill 5.
- the second conveyance device 4 is realized using, for example, a conveyance table, a conveyor, or a plurality of conveyance rolls.
- the second conveying device 4 conveys the rolled material sent out from the rough rolling mill 3 to the finishing rolling mill 5. Note that, for example, if there is a waiting time until the rolled material being transported can be processed, the second conveying device 4 reciprocates the rolled material being transported back and forth, so that a plurality of rolled materials are simultaneously processed for the next finishing.
- the rolling mill 5 may not be charged with it.
- the finishing mill zone 15 has a finishing mill 5.
- the finishing rolling mill 5 is realized using, for example, a rolling mill with multiple stands.
- the finishing mill 5 receives the rolled material sent out from the rough rolling mill 3 and conveyed via the second conveying device 4 . Thereafter, the finish rolling mill 5 performs finish rolling on the received rolled material.
- the strip-shaped rolled material finish-rolled by the finish-rolling mill 5 is delivered to the third conveyance zone 16.
- the third conveying zone 16 includes, for example, a third conveying device 6 that guides the rolled material finish-rolled by the finishing rolling mill 5 from the exit side of the finishing rolling mill 5 to the winding machine 7.
- the third conveyance device 6 is realized using, for example, pinch rolls and side guide sections.
- the third conveying device 6 guides the rolled material that has been finish rolled into a strip shape and sent out from the finishing mill 5 to the winding machine 7 .
- the third conveyance zone having the third conveyance device 6 may have a cooling step in which the rolled material finish-rolled by the finish rolling mill 5 is cooled, for example.
- the winder zone 17 has a winder 7 that winds up the rolled material that has been finished rolled into a strip.
- the winding machine 7 performs, for example, a winding process of winding up the rolled material after the finish rolling process to form a coil.
- the winding machine 7 receives the strip-shaped rolled material sent out from the finishing rolling mill 5 and guided through the third conveying device 6 .
- the winder 7 winds up the received strip-shaped rolled material into a coil shape.
- the coiled rolled material wound up by the winder 7 is bound by, for example, a binding machine (not shown) or the like, and then transported to the outside by a transport vehicle (not shown) or the like.
- Each of the above-mentioned zones of the hot rolling line 100 is provided with various sensors (not shown), and the values detected by the various sensors are output to the rolling productivity improvement support device 20 (described later) and sent to a data collection unit (described later). 21 etc. (see FIG. 2 etc.).
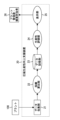
- FIG. 2 is a diagram showing an example of the configuration of the rolling productivity improvement support device 20 according to the first embodiment.
- the rolling productivity improvement support device 20 is placed, for example, in a hot rolling line 100 in a plant.
- the rolling productivity improvement support device 20 may be part of the functions of a control device (not shown) that controls part or all of the plant.
- the rolling productivity improvement support device 20 has the configuration or functions of a data collection section 21, an index calculation section 22, a data storage section 23, a productivity evaluation section 24, and a display section 25. .
- the data collection unit 21 is connected to each sensor (not shown) of the hot rolling line 100 in the plant, for example, via a signal line (not shown) or the like.
- the data collection unit 21 acquires data such as the plant's production plan and production results from the plant. Further, the data collection unit 21 sequentially collects plant data indicating the operating state of the plant, which is acquired by various sensors (not shown) in each zone in the hot rolling line 100 of the plant. The data collection unit 21 outputs the acquired data to the index calculation unit 22.
- the index calculation unit 22 acquires the data output from the data collection unit 21.
- the index calculation unit 22 calculates productivity, its constituent elements, and the value of each index for the data acquired from the plant by the data collection unit 21.
- the index calculation unit 22 causes the data storage unit 23 to store the plant data acquired by the data collection unit 21, the calculated index values, and the like.
- the data storage unit 23 is, for example, a volatile or nonvolatile storage medium such as an HDD (Hard Disk Drive), SSD (Solid State Drive), DRAM (Dynamic Random Access Memory), or other semiconductor memory.
- the data storage unit 23 stores, for example, programs necessary for the operation of each part of the rolling productivity improvement support device 20, and various information is written and read by each part of the rolling productivity improvement support device 20.
- the data storage unit 23 stores current or past plant data, calculated index values, etc. Further, the data storage unit 23 stores various current or past values, calculation results, predetermined threshold values, etc. used for various determinations of the rolling productivity improvement support device 20.
- the data storage unit 23 is connected to each part of the rolling productivity improvement support device 20 by, for example, a bus (not shown). Note that the data storage unit 23 may be provided outside the rolling productivity improvement support device 20 and connected to the rolling productivity improvement support device 20 by wire or wirelessly. Further, the data storage unit 23 may be an external storage medium such as a memory card or a DVD (Digital Versatile Disc), or may be an online storage. Further, the data storage unit 23 may be shared with a memory 92 (see FIG. 8), which will be described later.
- the productivity evaluation unit 24 acquires various values and various data stored in the data storage unit 23, and compares the productivity index to be evaluated with past productivity index performance each time the plant data is collected. , evaluate productivity decline.
- the productivity evaluation unit 24 outputs to the display unit 25 the evaluation result of productivity decline, the productivity that is the basis for the evaluation, its constituent elements, and the values of the respective indicators.
- the display unit 25 displays the evaluation result of productivity decline output from the productivity evaluation unit 24, the productivity on which the evaluation is based, its constituent elements, and the values of each index. Note that the display section 25 may also display information such as various values and various data managed by each section of the rolling productivity improvement support device 20. This information displayed (presented) by the display unit 25 is monitored by a plant manager/operator 26.
- the display unit 25 may include an operation unit (not shown) such as a GUI (Graphical User Interface) type touch panel, etc., so that desired information can be displayed by the plant manager/operation person 26. It may also be operable.
- an operation unit such as a GUI (Graphical User Interface) type touch panel, etc.
- the plant manager/operating person 26 monitors the operating status, production status, etc. of the plant and the hot rolling line 100 in the plant via the display unit 25.
- the plant manager/operator 26 understands the cause of productivity decline in the plant or the hot rolling line 100 in the plant through the display (presentation) on the display unit 25, the plant manager/operator 26 quickly takes countermeasures and improves production. It is possible to quickly improve and improve sexual performance.
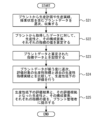
- FIG. 3 is a flowchart showing an example of the operation of the rolling productivity improvement support device 20 according to the first embodiment.
- the flowchart shown in FIG. 3 starts, for example, when the operation of the hot rolling line 100 shown in FIG. 1 in the plant is started. Note that the flowchart shown in FIG. 3 may be in operation all the time during the operation of the hot rolling line 100 shown in FIG. The operation may be started according to instructions from the operator 26, predetermined conditions, or control.
- step S21 the data collection unit 21 of the rolling productivity improvement support device 20 sequentially collects plant data indicating the production plan, production results, operating status, etc. from the plant.
- step S22 the index calculation unit 22 of the rolling productivity improvement support device 20 calculates productivity, its constituent elements, and the value of each index for the data acquired from the plant. That is, the index calculation unit 22 acquires plant data, which is data related to the plant, from the plant via a sensor (not shown), etc., and calculates the productivity index.
- productivity indicator the productivity of the entire plant (first layer) is broken down into a hierarchical structure of productivity parameters for each management category (second layer) and its components (third layer). be done. Note that the method of decomposing productivity is not limited to three levels, as long as a similar structure can be realized.
- Productivity is, for example, the value obtained by dividing the production amount by the cycle time. By evaluating this productivity index, it is possible to detect a decrease in productivity. Furthermore, productivity can be defined in terms of productivity parameters for each zone, which is a management division of a production line.
- the zones include a heating furnace zone 11, a first conveyance zone 12, a rough rolling mill zone 13, a second conveyance zone 14, a finishing mill zone 15, and a third conveyance zone.
- Time that does not contribute to production includes downtime or stoppage due to planning or accidents, or waiting time until it is possible to process the own material following the preceding material.
- the waiting time includes oscillation and gap time.
- oscillation means for example, in FIG. 1, when the next material comes out of the rough rolling mill 3 while the finishing rolling mill 5 is rolling the material, the next material is moved to the second conveyance zone 14. , refers to the act of reciprocating back and forth. Thereby, in the second conveyance zone 14, it is possible to prevent the next hot material from being stuck in one place and seize it, and it is possible to air-cool the material to an appropriate temperature for entering the finishing rolling mill 5.
- the gap time refers to, for example, the time that must elapse before the next material in the second conveyance zone 14 enters the finishing mill 5 for safety reasons in the above case.
- cycle time is broken down into components such as rolling time in a rolling mill and inter-pass time, which is the interval between passes through the rolling mill.
- step S23 the data storage unit 23 of the rolling productivity improvement support device 20 stores the plant data and the calculated index data. That is, the data storage unit 23 stores the plant data acquired by the data collection unit 21, the productivity index data calculated by the index calculation unit 22, and the performance data of its components. Note that the data storage unit 23 may directly acquire and store the plant data from the data storage unit 23 via a bus (not shown) or the like, or may acquire and store the plant data via the index calculation unit 22.
- productivity indicators include the productivity of the entire plant mentioned above and ton/h, which is a productivity parameter for each zone.
- the data storage unit 23 stores data each time performance data of materials and products is acquired so that productivity can be evaluated each time a product is produced. Furthermore, the data storage unit 23 also stores attribute values such as material quality and dimensions for each material or product so that performance data under the same conditions can be easily compared during evaluation. Note that the data storage unit 23 stores these current or past data.
- step S24 the productivity evaluation unit 24 of the rolling productivity improvement support device 20 sequentially compares the productivity index to be evaluated with past productivity index results each time the plant data is collected, and Evaluate. That is, for example, every time a product is produced, the productivity evaluation unit 24 evaluates a recently produced arbitrary product and compares the productivity index of the evaluation target with past productivity index results. The comparison is performed to evaluate productivity and to detect factors causing productivity decline.
- the past productivity index may be the average value of all productivity indexes related to products produced in the past, statistical values of data such as champion data, worst data, etc. Any statistical value may be selected depending on the intention of evaluating productivity. For example, when evaluation is performed while avoiding the influence of variations in past productivity performance data, an average value or a median value may be adopted. On the other hand, for example, when evaluation is performed to pursue better productivity, champion data may be employed.
- the productivity evaluation unit 24 When the productivity evaluation unit 24 performs the evaluation, the comparison is performed under conditions where the productivity index is not influenced by the specifications of the materials or products, such as material quality and dimensions. Therefore, as the past productivity index used as the evaluation standard, for example, data of a group having the same attribute values such as material and dimensions as the material or product to be evaluated, that is, data of the same stratification is used. This is because it is not possible to properly determine superiority or inferiority unless items under the same conditions are compared.
- the productivity evaluation unit 24 quantitatively calculates the quality of the productivity index by comparing the evaluation target with the evaluation criteria. For example, the productivity evaluation unit 24 determines how much the two compared results differ, whether the degree of decrease in productivity is within the allowable range defined by the standard value, or whether the index to be evaluated meets the evaluation standard. Quantitative evaluation of the position of the population in the distribution of the population. For example, quantitative evaluation may be based on percentage, statistical distribution, deviation value, or the like.
- the productivity evaluation unit 24 not only evaluates the productivity decline of the entire plant, but also compares the productivity parameters of each zone and the indicators of its constituent elements with past results to detect productivity decline. Detect factors. Factors include, for example, as mentioned above, the rolling time for each zone that makes up the cycle time, the time between passes, the downtime or downtime due to planning or accidents that make up the time that does not contribute to production, oscillations, and gaps. Possible factors include time. Furthermore, the event that caused the pause or stop is also a factor.
- past productivity index performance data used as the basis for evaluation is not limited to data for all periods dating back from a certain point, but may be limited to data for any period in the past.
- production performance may deteriorate due to aging of equipment, or production performance may change due to changes in operating conditions. Therefore, in order to avoid these influences, regarding past productivity index performance data, data from the most recent period in which conditions are expected to be equivalent to some extent can be selected as the evaluation standard.
- the targets for productivity evaluation are selected depending on the frequency of evaluation. For example, each time a product is produced, it is not necessary to limit the evaluation to the most recently produced product. In other words, for example, in order to evaluate productivity for each shift, such as a morning shift or a night shift, each time a shift is completed, the material or product group produced in that shift will be evaluated.
- the evaluation may be performed on productivity indicators related to. For example, in order to evaluate productivity for each business day, each time a business day is completed, an evaluation is made against productivity indicators related to materials and product groups of a predetermined stratification produced on that business day. may be performed. Note that when a predetermined material or product group is to be evaluated, the above-mentioned statistical value may be employed as an evaluation index value.
- productivity evaluation unit 24 may detect the cause of the productivity decrease only when the productivity evaluation results in an evaluation that the productivity has decreased.
- step S25 the display unit 25 of the rolling productivity improvement support device 20 displays the evaluation result of productivity decline, the productivity on which the evaluation was based, its constituent elements, and the value of each index. , and present it to the plant manager/operation person 26.
- the display unit 25 displays predetermined data on the most recently produced predetermined product as an evaluation target. For example, the display unit 25 displays the evaluation result of productivity decline, the productivity index on which the evaluation is based, the productivity parameter for each zone, the index of its constituent elements, and the production plan related to the productivity index. Displays production results and data indicating operational status.
- the data displayed by the display unit 25 is not limited to evaluating a certain manufactured product each time a product is produced, and may not be limited to data related to this. That is, for example, each time a product is produced, the display unit 25 may display several products of the same stratum produced most recently as evaluation targets. For example, the display unit 25 displays the evaluation result of productivity decline obtained by evaluating the productivity index regarding the material/product group, the productivity index on which the evaluation was based, and the productivity of each zone. Parameters and indicators of their constituent elements may also be displayed. Further, the display unit 25 may display data indicating the production plan and production results related to the productivity index, and the operating status, and present the data to the plant manager/operation person 26.
- the display unit 25 may display all of the judgments made by the productivity evaluation unit 24 and the calculated data items, or may display information that is selectively displayed in response to requests from the plant manager, operation personnel 26, etc. The selected item may be displayed. Note that the display unit 25 is not limited to one screen, and may be provided with a plurality of screens depending on the viewpoint of productivity evaluation.
- productivity is specified by productivity parameters for each management category and indicators obtained by breaking them down into their constituent elements, and the indicators are This is presented to the plant manager/operator 26 as a candidate factor.
- the plant manager/operator 26 can efficiently grasp the cause of the decline in productivity from among a huge amount of information, and can therefore quickly take countermeasures. Therefore, according to the first embodiment shown in FIGS. 1 to 3, it is possible to contribute to rapid improvement and improvement of productivity.
- FIG. 4 is a diagram showing an example of the configuration of the rolling productivity improvement support device 30 according to the second embodiment.
- the same or similar configurations or functions as those in the first embodiment shown in FIGS. 1 to 3 are denoted by the same reference numerals, and detailed description thereof will be omitted or simplified.
- the rolling productivity improvement support device 30 includes a data collection section 21, an index calculation section 22, a data storage section 23A, a productivity evaluation section 24A, a display section 25A, and a standard index calculation section 32. It has the structure or function of That is, in the rolling productivity improvement support device 30 according to the second embodiment, the configurations or functions of the data storage section 23A, the productivity evaluation section 24A, and the display section 25A are the same as those in the first embodiment shown in FIGS. 1 to 3. The form is partially different. Further, the rolling productivity improvement support device 30 according to the second embodiment differs from the first embodiment shown in FIGS. 1 to 3 in that it further has the configuration or function of a standard index calculation section 32.
- the standard index calculation unit 32 acquires the data output from the data collection unit 21.
- the standard index calculation unit 32 calculates equipment specifications for each material or product based on equipment specification data, production plan data such as materials and dimensions of materials and products to be produced, and control parameters to be applied during production. Calculate the ideal productivity indicator based on the original.
- the specifications or specification data of the equipment indicate, for example, the specifications and data of individual elements constituting the equipment, such as the performance, properties, form, shape, material, and quality of the equipment.
- the standard index calculation unit 32 stores the plant data acquired by the data collection unit 21, the calculated ideal productivity index value, etc. in the data storage unit 23A.
- the data storage unit 23A has the configuration or function of the data storage unit 23 in the first embodiment shown in FIGS. 1 to 3. Furthermore, the data storage unit 23A stores an ideal productivity index output from the standard index calculation unit 32 and based on the specifications of equipment for each material or product calculated by the standard index calculation unit 32.
- the productivity evaluation section 24A has the configuration or function of the productivity evaluation section 24 in the first embodiment shown in FIGS. 1 to 3. Furthermore, the productivity evaluation section 24A compares the performance of the productivity index to be evaluated with the ideal productivity index calculated by the standard index calculation section as the evaluation standard, and evaluates the productivity. Detection of factors causing productivity decline.
- the display section 25A has the configuration or function of the display section 25 in the first embodiment shown in FIGS. 1 to 3. Furthermore, each time a product is produced, the display unit 25A displays the evaluation results of the performance of the productivity index against the ideal productivity index, the productivity index that was the basis of the evaluation, and the results for each zone. Display productivity parameters and indicators of their components. Furthermore, the display section 25A displays data indicating the production plan, production results, operating status, etc. related to the productivity index. Present to plant manager. This information displayed (presented) by the display unit 25A is monitored by the plant manager/operation person 26.
- FIG. 5 is a flowchart showing an example of the operation of the rolling productivity improvement support device 30 according to the second embodiment.
- FIG. 5 detailed descriptions of operations that are the same or similar to those of the first embodiment shown in FIGS. 1 to 3 are omitted or simplified as appropriate.
- the flowchart shown in FIG. 5 starts its operation at the same timing as the flowchart shown in FIG. 3.
- step S31 is the same as or similar to the operation in step S21 of the first embodiment shown in FIG. 3, so a detailed explanation will be omitted.
- step S32 the standard index calculation unit 32 of the rolling productivity improvement support device 30, instead of or in parallel with the performance-based index calculation unit 22, calculates the following based on the equipment specification data and production plan data. Calculate (calculate) ideal productivity indicators based on equipment specifications. That is, the standard index calculation unit 32 calculates the equipment for each material or product based on equipment specification data and production plan data such as the material, dimensions, and control parameters to be applied during production of the material or product to be produced. Calculate an ideal productivity index based on the specifications of
- the standard index calculation unit 32 uses a simulator consisting of a physical model, a statistical model, etc. regarding the entire plant 100 and each piece of equipment constituting the plant 100 in order to calculate an ideal productivity index based on the specifications of the equipment. have The standard index calculation unit 32 calculates productivity under the assumption that the product will be produced under the conditions of the given productivity planning data, and calculates the ideal productivity index based on the specifications of the equipment as described above. Calculate by performing simulation with a simulator. In addition, in the calculation process, the standard index calculation unit 32 also calculates simulation data of productivity parameters for each zone and their constituent elements. Note that the standard index calculation unit 32 may calculate the simulation data by changing the conditions many times.
- step S32 the operation of step S22 shown in FIG. 3 by the index calculation section 22 is also performed in parallel. be exposed.
- the data storage unit 23A of the rolling productivity improvement support device 30 stores the plant data and the calculated index data. That is, the data storage unit 23A stores the plant data acquired by the data collection unit 21, the productivity index data calculated by the index calculation unit 22, and the performance data of its components. In addition, instead of acquiring data from the performance-based index calculation section 22, or in parallel, the data storage section 23A stores ideal productivity based on the specifications of the equipment, which is calculated by the standard index calculation section 32. Memorize index data. Note that the data storage unit 23A may store ideal productivity index data based on current or past equipment specifications, which are calculated by the standard index calculation unit 32 under various conditions.
- step S33 is the same as or similar to the operations in step S23 of the first embodiment shown in FIG. 3, so detailed explanations will be omitted.
- step S34 the productivity evaluation unit 24A of the rolling productivity improvement support device 30 sequentially calculates the productivity index to be evaluated and the past productivity for each material or collection period and for each stratum, each time the plant data is collected. Compare indicator performance or standard productivity indicators.
- the productivity evaluation unit 24A then evaluates the productivity decline and the factor candidates based on the comparison results. That is, the productivity evaluation section 24A compares the performance of the productivity index to be evaluated with the ideal productivity index calculated by the standard index calculation section 32, which is the evaluation standard, and based on the comparison result. , evaluate productivity and detect factors that cause productivity decline.
- the productivity evaluation unit 24A quantitatively calculates the quality of the productivity index by comparing the evaluation target with the evaluation criteria. Furthermore, the productivity evaluation unit 24A not only evaluates the productivity decline of the entire plant 100, but also calculates productivity parameters for each zone and indicators of their constituent elements using data calculated by the standard index calculation unit 32. Detect factors contributing to productivity decline.
- step S34 when the standard index calculation section 32 operates in parallel with the performance-based index calculation section 22, in step S34, the operation of step S24 shown in FIG. 3 may also be performed in parallel. Note that in that case, the other operations in step S34 are the same or similar to the operations in step S24 of the first embodiment shown in FIG. 3, so a detailed explanation will be omitted.
- step S35 the display unit 25A of the rolling productivity improvement support device 30 displays the evaluation result of productivity decline, the productivity on which the evaluation is based, its components, and the values of each index. , and present it to the plant manager/operation person 26.
- the display unit 25A displays the evaluation results of the performance of the productivity index with respect to the ideal productivity index every time a product is produced. For example, the display unit 25A displays the evaluation results, the productivity index on which the evaluation is based, the productivity parameters for each zone, the indicators of its constituent elements, the production plan and production results related to the productivity index, Displays data indicating operating status, etc.
- step S35 is the same or similar to the operations in step S25 of the first embodiment shown in FIG. 3, so detailed explanations will be omitted.
- the second embodiment shown in FIGS. 4 and 5 has the same effects as the first embodiment shown in FIGS. 1 to 3.
- the standard index calculation unit 32 has a simulator, and uses the simulator etc. to change various conditions of the equipment many times, for example.
- the ideal productivity based on the original, that is, the theoretical highest productivity of the equipment is calculated.
- the productivity evaluation section 24A calculates the comparison result between the theoretically highest performance productivity calculated by the standard index calculation section 32 and the current productivity index. Based on this, it is possible to evaluate productivity decline and candidate factors.
- the productivity is calculated based on the comparison result between the ideal productivity calculated by the standard index calculation unit 32 and the current productivity index.
- Candidates for the cause of the decrease are presented to the plant manager/operator 26.
- the plant manager/operator 26 can understand the causes of productivity decline based on a comparison between ideal productivity and the current productivity index, so the ideal productivity You can understand what the current problems (bottlenecks) are in relation to gender.
- FIG. 6 is a diagram showing an example of the configuration of a rolling productivity improvement support device 40 according to the third embodiment.
- the same or similar configurations or functions as those in the first embodiment shown in FIGS. 1 to 3 are denoted by the same reference numerals, and detailed description thereof will be omitted or simplified.
- the rolling productivity improvement support device 40 includes a data collection section 21, an index calculation section 22, a data storage section 23, a productivity evaluation section 24, a display section 25B, and a factor candidate detection section 44. It has the structure or function of That is, the rolling productivity improvement support device 40 according to the third embodiment is partially different from the first embodiment shown in FIGS. 1 to 3 in the configuration or function of the display section 25B. Further, the rolling productivity improvement support device 40 according to the third embodiment differs from the first embodiment shown in FIGS. 1 to 3 in that it further includes the configuration or function of a factor candidate detection section 44.
- the factor candidate detection unit 44 acquires various values and various data stored in the data storage unit 23, and when the productivity index changes (deteriorates), the factor candidate detection unit 44 determines whether the index has deteriorated for the component of the productivity index. Find plant data items that are correlated with components. Note that the data storage unit 23 stores, as examples of various values and data, equipment stoppages and stops, equipment alarms, interlock history, actual values of rolling time and waiting time, and the like.
- the display section 25B has the configuration or function of the display section 25 in the first embodiment shown in FIGS. 1 to 3. Furthermore, when a plant data item correlated with a component whose index has changed (deteriorated) is detected, the display unit 25B displays the evaluation result of productivity decline, the productivity that was the basis for the evaluation, and the component. It displays data showing candidate factors for productivity change and the values of each index. This information displayed (presented) by the display unit 25B is monitored by the plant manager/operator 26.
- FIG. 7 is a flowchart showing an example of the operation of the rolling productivity improvement support device 40 according to the third embodiment.
- FIG. 7 detailed descriptions of operations that are the same or similar to those of the first embodiment shown in FIGS. 1 to 3 are omitted or simplified as appropriate.
- the flowchart shown in FIG. 7 starts its operation at the same timing as the flowchart shown in FIG. 3.
- step S41 to step S43 are the same as or similar to the operations from step S21 to step S23 of the first embodiment shown in FIG. 3, so a detailed explanation will be omitted.
- step S44 when the productivity index changes (deteriorates), the factor candidate detection unit 44 of the rolling productivity improvement support device 40 detects a correlation between the component of the productivity index and the component whose index has deteriorated. Find a certain plant data item. That is, when the productivity decreases, the factor candidate detection unit 44 detects, for example, by what factor the rolling time for each zone and the inter-pass time, which constitute the cycle time, have changed. The factor candidate detection unit 44 also determines, for example, what kind of time that does not contribute to production includes downtime or stoppage due to plans or accidents, waiting time such as oscillation or gap time, and productivity components. Detect whether there has been a change due to a factor. Then, the factor candidate detection unit 44 determines the detected data item as a factor candidate for productivity decline.
- events such as scheduled downtime for maintenance, equipment failure, or failure of interlocks occur.
- Data of these events is recorded in the data storage unit 23, for example, as a record of suspension or stoppage, equipment alarm, interlock history, etc.
- the factor candidate detection unit 44 detects data items that are correlated with a decrease in productivity from among these data items by comparing the difference between when productivity decreases and the difference between normal times or the ideal state. do. Note that statistical methods, machine learning methods, etc. can be applied as means for determining the correlation.
- the factor candidate detection unit 44 refers to the physical model that constitutes the standard index calculation unit 32 shown in the second embodiment shown in FIGS. 4 and 5, the specifications and specifications of the equipment, the algorithm of the control device, etc. It is also possible. This makes it possible to exclude data items that do not have a causal relationship with productivity decline or its constituent elements, thereby improving the detection accuracy of factor candidates.
- the factor candidate detection unit 44 can determine that the failure of the interlock has no causal relationship with the detected productivity decline.
- step S45 the display unit 25B of the rolling productivity improvement support device 40 displays the evaluation result of productivity decline, the productivity on which the evaluation was based, its constituent elements, and candidate factors for productivity change.
- the value of the index is displayed and presented to the plant manager/operator 26.
- the display unit 25B displays the evaluation result of productivity decline, the productivity index on which the evaluation is based, and the productivity parameters for each zone, so that the plant manager and Present it to the person in charge of operations 26.
- the display section 25B displays indicators of those constituent elements, data indicating production plans, production results, operating conditions, etc. related to the productivity indicators, and factor candidates detected by the factor candidate detection section. and present it to the plant manager/operation person 26.
- step S45 is the same as or similar to the operations in step S25 of the first embodiment shown in FIG. 3, so detailed explanations will be omitted.
- the third embodiment shown in FIGS. 6 and 7 has the same effects as the first embodiment shown in FIGS. 1 to 3.
- the factor candidate detection unit 44 detects whether the index has deteriorated for the component of the productivity index. Find plant data items that are correlated with components. Then, the display section 25B displays the factor candidates detected by the factor candidate detection section and presents them to the plant manager/operator 26. As a result, the plant manager/operation personnel 26 can grasp the plant data items during normal times and the factor candidates detected by the factor candidate detection unit 44, so that they can understand the current situation in relation to the plant during normal times. It is possible to understand whether productivity is decreasing due to a problem.
- FIG. 8 is a conceptual diagram showing an example of the hardware configuration of the processing circuit 90 included in the rolling productivity improvement support devices 20, 30, and 40 in the embodiments shown in FIGS. 1 to 7.
- processing circuit 90 includes at least one processor 91 and at least one memory 92.
- processing circuitry 90 includes at least one dedicated hardware 93.
- each function is realized by software, firmware, or a combination of software and firmware. At least one of the software and firmware is written as a program. At least one of software and firmware is stored in memory 92.
- the processor 91 implements each function by reading and executing programs stored in the memory 92.
- the processing circuit 90 When the processing circuit 90 includes dedicated hardware 93, the processing circuit 90 is, for example, a single circuit, a composite circuit, a programmed processor, or a combination thereof. Each function is realized by a processing circuit 90.
- Each of the functions of the rolling productivity improvement support devices 20, 30, and 40 may be partially or entirely configured by hardware, or may be configured as a program executed by a processor. That is, the rolling productivity improvement support devices 20, 30, and 40 can be realized by a computer and a program, and the program can be stored in a storage medium or provided through a network.
- the rolling productivity improvement support apparatuses 20, 30, and 40 have been described as an example of one aspect of the present disclosure, but the invention is not limited to this.
- the present disclosure can also be realized as a rolling productivity improvement support system in which the plant 100 and the rolling productivity improvement support devices 20, 30, and 40 are combined.
- the present disclosure can also be realized as a rolling productivity improvement support method in which processing steps are performed in each part of the rolling productivity improvement support devices 20, 30, and 40.
- the present disclosure can also be realized as a rolling productivity improvement support program that causes a computer to execute processing steps in each part of the rolling productivity improvement support devices 20, 30, and 40.
- the present disclosure can also be realized as a storage medium (non-temporary computer-readable medium) in which a rolling productivity improvement support program is stored.
- the rolling productivity improvement support program can be stored and distributed on, for example, a removable disk such as a CD (Compact Disc), DVD (Digital Versatile Disc), or USB (Universal Serial Bus) memory.
- the rolling productivity improvement support program may be uploaded onto the network via a network interface (not shown) included in the rolling productivity improvement support devices 20, 30, and 40. Further, the rolling productivity improvement support program may be downloaded from the network via the network interface or the like and stored in the data storage units 23 and 23A or the memory 92 or the like.
Landscapes
- Engineering & Computer Science (AREA)
- Mechanical Engineering (AREA)
- General Engineering & Computer Science (AREA)
- Manufacturing & Machinery (AREA)
- Quality & Reliability (AREA)
- Physics & Mathematics (AREA)
- General Physics & Mathematics (AREA)
- Automation & Control Theory (AREA)
- Control Of Metal Rolling (AREA)
- General Factory Administration (AREA)
Abstract
Description
図1は、プラントにおける熱間圧延ライン100の一例を示す模式図である。図1は、熱間圧延ライン100の一例を横から見た様子を示している。熱間圧延ライン100は、例えば、不図示の鉄又は非鉄材料等の圧延材料を圧延するプラントに設けられる。圧延材料は、図1中、左側から右側に流れていくよう制御されている。なお、以下、本明細書において、熱間圧延ライン100は、「プラント100」とも称される。また、以下、本明細書において、圧延材料は、「圧延材」又は単に「材」とも称される。
図3は、第1実施形態に係る圧延生産性向上支援装置20の動作の一例を示すフローチャートである。図3に示すフローチャートは、例えば、プラントにおける図1に示す熱間圧延ライン100の操業が開始されたときに開始する。なお、図3に示すフローチャートは、図1に示す熱間圧延ライン100の操業中は、常に動作していても良く、所定間隔毎に定期的に動作が開始されても良く、プラント管理者・操業担当者26の指示や所定の条件又は制御に従って動作が開始されてもよい。
以上、図1から図3に示す第1実施形態では、生産性が、管理区分別の生産性パラメータやその構成要素に分解して得られる指標で特定され、当該指標が、生産性の低下の要因候補としてプラント管理者・操業担当者26に提示される。これにより、プラント管理者・操業担当者26は、膨大な情報の中から効率的に生産性の低下の要因を把握することが出来るため、迅速に対処策を取ることができる。このため、図1から図3に示す第1実施形態によれば、生産性の迅速な改善・向上に寄与することができる。
図4は、第2実施形態に係る圧延生産性向上支援装置30の構成の一例を示す図である。図4においては、図1~図3に示す第1実施形態と同一又は同様の構成又は機能については同一の符号を付し、詳細な説明は省略又は簡略化する。
図5は、第2実施形態に係る圧延生産性向上支援装置30の動作の一例を示すフローチャートである。図5においては、図1~図3に示す第1実施形態と同一又は同様の動作については、詳細な説明は、適宜省略又は簡略化する。図5に示すフローチャートは、図3に示すフローチャートと同様のタイミングで動作が開始される。
以上、図4及び図5に示す第2実施形態では、図1から図3に示した第1実施形態と同様の効果を奏する。
図6は、第3実施形態に係る圧延生産性向上支援装置40の構成の一例を示す図である。図6においては、図1~図3に示す第1実施形態と同一又は同様の構成又は機能については同一の符号を付し、詳細な説明は省略又は簡略化する。
図7は、第3実施形態に係る圧延生産性向上支援装置40の動作の一例を示すフローチャートである。図7においては、図1~図3に示す第1実施形態と同一又は同様の動作については、詳細な説明は、適宜省略又は簡略化する。図7に示すフローチャートは、図3に示すフローチャートと同様のタイミングで動作が開始される。
以上、図6及び図7に示す第3実施形態では、図1から図3に示した第1実施形態と同様の効果を奏する。
図8は、図1~図7に示した実施形態における圧延生産性向上支援装置20,30,40が有する処理回路90のハードウェア構成例を示す概念図である。上述した各機能は処理回路90により実現される。一態様として、処理回路90は、少なくとも1つのプロセッサ91と少なくとも1つのメモリ92とを備える。他の態様として、処理回路90は、少なくとも1つの専用のハードウェア93を備える。
以上、図1~図8に示す実施形態によれば、図1~図3に示す圧延生産性向上支援装置20と、図4~図5に示す圧延生産性向上支援装置30と、図6~図7に示す圧延生産性向上支援装置40とに分けて説明したが、これには限られない。圧延生産性向上支援装置20,30,40の一部又は全部の構成及び動作が、直列又は並列に組み合わされてもよい。これらの構成及び動作が組み合わされることにより、組み合わされた構成及び動作は、組み合わされる前の各構成及び動作によって奏される各作用効果を奏することができる。
Claims (3)
- 鉄・非鉄材料を圧延するプラントにおいて、
前記プラントから生産計画、生産実績、操業状態を含むプラントデータを収集するデータ収集部と、
前記データ収集部によって取得された前記プラントデータに対して、生産性と、前記生産性の構成要素と、前記構成要素のそれぞれの指標の値とを算定する指標算定部と、
前記データ収集部によって取得された前記プラントデータと、前記指標算定部によって算定された前記指標の値のデータである指標データとを記憶するデータ記憶部と、
前記プラントデータが揃う度に、逐次、評価対象の生産性の指標と、過去の生産性の指標の実績とを比較して、生産性低下の評価を行う生産性評価部と、
前記生産性評価部によって行われた前記生産性低下の評価結果と、前記評価結果の評価根拠となった前記生産性と、前記生産性の前記構成要素と、前記構成要素のそれぞれの前記指標の値とを表示する表示部と、
を備えることを特徴とする圧延生産性向上支援装置。 - 請求項1に記載の圧延生産性向上支援装置において、
前記指標算定部の代わりに、又は前記指標算定部とともに、前記プラントの設備の諸元データと生産計画データとに対して、前記設備の諸元に基づく理想的な生産性の指標を算定する規範指標算定部をさらに備え、
前記生産性評価部は、材ごと又は集計期間毎に、かつ層別毎に、前記プラントデータが揃う度に、逐次、評価対象の生産性の指標と、過去の生産性の指標の実績、又は規範の生産性の指標とを比較して、生産性低下の評価と、前記生産性低下の要因候補の検出とを行う
ことを特徴とする圧延生産性向上支援装置。 - 請求項1又は請求項2に記載の圧延生産性向上支援装置において、
生産性の指標が変化したときに、前記生産性の指標の構成要素について、前記指標が変化した構成要素と相関のある前記プラントデータの項目を検出する要因候補検出部をさらに備え、
前記表示部は、前記生産性低下の評価結果と、前記評価結果の評価根拠となった前記生産性と、前記生産性の前記構成要素と、前記生産性低下の要因候補と、前記構成要素のそれぞれの前記指標の値とを表示する
ことを特徴とする圧延生産性向上支援装置。
Priority Applications (3)
| Application Number | Priority Date | Filing Date | Title |
|---|---|---|---|
| CN202280035005.0A CN117396283A (zh) | 2022-05-12 | 2022-05-12 | 轧制生产性提高辅助装置 |
| JP2023527061A JP7509321B2 (ja) | 2022-05-12 | 2022-05-12 | 圧延生産性向上支援装置 |
| PCT/JP2022/020125 WO2023218619A1 (ja) | 2022-05-12 | 2022-05-12 | 圧延生産性向上支援装置 |
Applications Claiming Priority (1)
| Application Number | Priority Date | Filing Date | Title |
|---|---|---|---|
| PCT/JP2022/020125 WO2023218619A1 (ja) | 2022-05-12 | 2022-05-12 | 圧延生産性向上支援装置 |
Publications (1)
| Publication Number | Publication Date |
|---|---|
| WO2023218619A1 true WO2023218619A1 (ja) | 2023-11-16 |
Family
ID=88730174
Family Applications (1)
| Application Number | Title | Priority Date | Filing Date |
|---|---|---|---|
| PCT/JP2022/020125 Ceased WO2023218619A1 (ja) | 2022-05-12 | 2022-05-12 | 圧延生産性向上支援装置 |
Country Status (3)
| Country | Link |
|---|---|
| JP (1) | JP7509321B2 (ja) |
| CN (1) | CN117396283A (ja) |
| WO (1) | WO2023218619A1 (ja) |
Citations (7)
| Publication number | Priority date | Publication date | Assignee | Title |
|---|---|---|---|---|
| JP2007257339A (ja) * | 2006-03-23 | 2007-10-04 | Nippon Steel Corp | 製造仕様決定支援システム、製造仕様決定支援方法、コンピュータプログラム、及びコンピュータ読み取り可能な記録媒体 |
| JP2009265699A (ja) * | 2008-04-21 | 2009-11-12 | Nippon Steel Corp | 処理時間予測装置、方法、プログラム、及びコンピュータ読み取り可能な記憶媒体 |
| JP2013145521A (ja) * | 2012-01-16 | 2013-07-25 | Nippon Steel & Sumitomo Metal | 製造プロセスの能率予測方法、装置及びプログラム |
| JP2014035590A (ja) * | 2012-08-07 | 2014-02-24 | Toshiba Mitsubishi-Electric Industrial System Corp | データ解析装置 |
| JP2019035123A (ja) * | 2017-08-17 | 2019-03-07 | 新日鐵住金株式会社 | 操業スケジュール作成方法、装置及びプログラム |
| JP2021030264A (ja) * | 2019-08-23 | 2021-03-01 | Jfeスチール株式会社 | 学習モデル生成方法、データベース構築方法、ミルセットアップ設定方法、圧延材の製造方法、処理対象の製造方法、及び学習モデル生成装置 |
| CN113219910A (zh) * | 2021-03-19 | 2021-08-06 | 苏州数杰智能技术有限公司 | 一种全流程的生产自诊断及优化系统 |
Family Cites Families (8)
| Publication number | Priority date | Publication date | Assignee | Title |
|---|---|---|---|---|
| JP2007061870A (ja) | 2005-08-31 | 2007-03-15 | Nippon Steel Corp | 圧延スケジュール作成装置、圧延スケジュール作成方法、コンピュータプログラム、及びコンピュータ読み取り可能な記憶媒体 |
| JP2010020495A (ja) * | 2008-07-09 | 2010-01-28 | Toshiba Corp | 工場診断方法、工場診断装置及び工場診断プログラム |
| JP2011003126A (ja) * | 2009-06-22 | 2011-01-06 | Toppan Printing Co Ltd | 製造工場における工程診断システム |
| JP5471725B2 (ja) | 2010-03-31 | 2014-04-16 | Jfeスチール株式会社 | 製造ロット作成方法、装置及びシステム |
| JP2012143782A (ja) | 2011-01-12 | 2012-08-02 | Toshiba Mitsubishi-Electric Industrial System Corp | 省エネ運転支援システム |
| JP6688115B2 (ja) | 2016-03-18 | 2020-04-28 | 株式会社神戸製鋼所 | 制御方法選択支援システム |
| JP7061469B2 (ja) * | 2018-01-25 | 2022-04-28 | 株式会社日立製作所 | 生産性評価システムおよびその方法 |
| CN110909995A (zh) * | 2019-11-13 | 2020-03-24 | 张家口卷烟厂有限责任公司 | 一种生产效能的分析方法和装置 |
-
2022
- 2022-05-12 WO PCT/JP2022/020125 patent/WO2023218619A1/ja not_active Ceased
- 2022-05-12 CN CN202280035005.0A patent/CN117396283A/zh active Pending
- 2022-05-12 JP JP2023527061A patent/JP7509321B2/ja active Active
Patent Citations (7)
| Publication number | Priority date | Publication date | Assignee | Title |
|---|---|---|---|---|
| JP2007257339A (ja) * | 2006-03-23 | 2007-10-04 | Nippon Steel Corp | 製造仕様決定支援システム、製造仕様決定支援方法、コンピュータプログラム、及びコンピュータ読み取り可能な記録媒体 |
| JP2009265699A (ja) * | 2008-04-21 | 2009-11-12 | Nippon Steel Corp | 処理時間予測装置、方法、プログラム、及びコンピュータ読み取り可能な記憶媒体 |
| JP2013145521A (ja) * | 2012-01-16 | 2013-07-25 | Nippon Steel & Sumitomo Metal | 製造プロセスの能率予測方法、装置及びプログラム |
| JP2014035590A (ja) * | 2012-08-07 | 2014-02-24 | Toshiba Mitsubishi-Electric Industrial System Corp | データ解析装置 |
| JP2019035123A (ja) * | 2017-08-17 | 2019-03-07 | 新日鐵住金株式会社 | 操業スケジュール作成方法、装置及びプログラム |
| JP2021030264A (ja) * | 2019-08-23 | 2021-03-01 | Jfeスチール株式会社 | 学習モデル生成方法、データベース構築方法、ミルセットアップ設定方法、圧延材の製造方法、処理対象の製造方法、及び学習モデル生成装置 |
| CN113219910A (zh) * | 2021-03-19 | 2021-08-06 | 苏州数杰智能技术有限公司 | 一种全流程的生产自诊断及优化系统 |
Also Published As
| Publication number | Publication date |
|---|---|
| JP7509321B2 (ja) | 2024-07-02 |
| JPWO2023218619A1 (ja) | 2023-11-16 |
| CN117396283A (zh) | 2024-01-12 |
Similar Documents
| Publication | Publication Date | Title |
|---|---|---|
| KR102042368B1 (ko) | 제조 설비 진단 지원 장치 및 제조 설비 진단 지원 방법 | |
| JP6252675B2 (ja) | 製造設備診断支援装置 | |
| JP5441824B2 (ja) | 金属帯材料の製造条件決定システム | |
| KR102516612B1 (ko) | 금속 피가공재 제조 방법 | |
| JP7070796B2 (ja) | 絞り発生予測システム | |
| JP5821363B2 (ja) | 製品欠陥要因分析装置 | |
| KR102925368B1 (ko) | 이상 진단 모델의 구축 방법, 이상 진단 방법, 이상 진단 모델의 구축 장치 및 이상 진단 장치 | |
| JP6136743B2 (ja) | 冷間タンデム圧延機における走間板厚変更方法 | |
| CN103567226B (zh) | 数据分析装置 | |
| JP6102659B2 (ja) | 圧延制御装置および圧延制御方法 | |
| WO2023218619A1 (ja) | 圧延生産性向上支援装置 | |
| Cuznar et al. | Optimization of cold rolling process recipes based on historical data | |
| JP2021133415A (ja) | モデル学習方法、走間板厚変更方法、鋼板の製造方法、モデル学習装置、走間板厚変更装置および鋼板の製造装置 | |
| JP7024800B2 (ja) | 鉄鋼プラントのメンテナンス支援装置 | |
| JP7610102B2 (ja) | 予測装置、学習装置、予測プログラム、及び学習プログラム | |
| JP7767241B2 (ja) | 圧延設定支援システム及び圧延設定支援方法 | |
| TW201134567A (en) | Method of determining rolling setting through data mining | |
| JP2017170456A (ja) | 制御方法選択支援システム | |
| Ruiz-Sarmiento et al. | Analysis of Data from the Industrial Machinery Within the Hot Rolling Process for Predictive Maintenance. | |
| JP2022170101A (ja) | 圧延荷重予測方法、圧延制御方法、及び圧延荷重予測装置 | |
| JP2014108451A (ja) | タンデム圧延機のライン加速時の最高圧延速度設定支援方法及び装置 | |
| Petkov | Analysis of Data from the Industrial Machinery Within the Hot Rolling Process | |
| Souza et al. | Data mining and modelling | |
| CN115407727A (zh) | 设备控制装置、设备控制方法以及程序 | |
| JP2014087841A (ja) | 圧延順決定装置及び圧延順決定方法 |
Legal Events
| Date | Code | Title | Description |
|---|---|---|---|
| ENP | Entry into the national phase |
Ref document number: 2023527061 Country of ref document: JP Kind code of ref document: A |
|
| WWE | Wipo information: entry into national phase |
Ref document number: 202317077445 Country of ref document: IN Ref document number: 202280035005.0 Country of ref document: CN |
|
| 121 | Ep: the epo has been informed by wipo that ep was designated in this application |
Ref document number: 22941698 Country of ref document: EP Kind code of ref document: A1 |
|
| NENP | Non-entry into the national phase |
Ref country code: DE |
|
| 122 | Ep: pct application non-entry in european phase |
Ref document number: 22941698 Country of ref document: EP Kind code of ref document: A1 |