WO2023175921A1 - Dispositif d'analyse de modèle, procédé d'analyse de modèle et support d'enregistrement - Google Patents
Dispositif d'analyse de modèle, procédé d'analyse de modèle et support d'enregistrement Download PDFInfo
- Publication number
- WO2023175921A1 WO2023175921A1 PCT/JP2022/012675 JP2022012675W WO2023175921A1 WO 2023175921 A1 WO2023175921 A1 WO 2023175921A1 JP 2022012675 W JP2022012675 W JP 2022012675W WO 2023175921 A1 WO2023175921 A1 WO 2023175921A1
- Authority
- WO
- WIPO (PCT)
- Prior art keywords
- model
- evaluation
- importance
- index
- models
- Prior art date
Links
Images


Classifications
-
- G—PHYSICS
- G06—COMPUTING; CALCULATING OR COUNTING
- G06N—COMPUTING ARRANGEMENTS BASED ON SPECIFIC COMPUTATIONAL MODELS
- G06N20/00—Machine learning
Definitions
- This disclosure relates to analysis of machine learning models.
- Patent Document 1 relates to a system for learning and/or optimizing processes related to semiconductor manufacturing, and describes a method for ranking candidate process models based on quality values and diversity values.
- One purpose of the present disclosure is to evaluate models and select an appropriate model by considering multiple evaluation indicators.
- the model analysis device includes: an index acquisition means for acquiring designations of a plurality of evaluation indexes regarding the model; Importance degree acquisition means for acquiring importance degrees for the plurality of evaluation indicators; index value acquisition means for acquiring values of the plurality of evaluation indicators for the plurality of models; an analysis means for analyzing the ranking of the plurality of models based on the obtained evaluation index value and importance; Equipped with
- the model analysis method includes: obtain multiple evaluation metric specifications for the model; Obtaining the importance of the plurality of evaluation indicators, obtaining values of the plurality of evaluation indicators for the plurality of models; The ranking of the plurality of models is analyzed based on the obtained evaluation index value and importance level.
- the recording medium includes: obtain multiple evaluation metric specifications for the model; Obtaining the importance of the plurality of evaluation indicators, obtaining values of the plurality of evaluation indicators for the plurality of models; A program is recorded that causes a computer to execute a process of analyzing the rankings of the plurality of models based on the obtained evaluation index values and degrees of importance.
- FIG. 1 is a block diagram showing the overall configuration of a model generation system according to a first embodiment.
- FIG. 2 is a block diagram showing the hardware configuration of a model generation device.
- 1 is a block diagram showing a functional configuration of a model generation device according to a first embodiment;
- FIG. A display example of evaluation information according to the first embodiment is shown.
- Another display example of evaluation information according to the first embodiment is shown.
- It is a flowchart of model analysis processing of a 1st embodiment.
- FIG. 1 is a block diagram showing a schematic configuration of a model generation system using a server and a terminal device.
- a display example of evaluation information according to the second embodiment is shown. It is a flowchart of processing by a model analysis device of a 2nd embodiment.
- It is a block diagram showing the functional composition of a model analysis device of a 3rd embodiment.
- It is a flow chart of processing by a model analysis device of a 3rd embodiment.
- FIG. 1 is a block diagram showing the overall configuration of a model generation system according to a first embodiment.
- the model generation system 1 includes a model generation device 100, a display device 2, and an input device 3.
- the model generation device 100 is an application of the model analysis device of the present disclosure, and is configured by, for example, a computer such as a personal computer (PC).
- the display device 2 is, for example, a liquid crystal display device, and displays the evaluation information generated by the model generation device 100.
- the input device 3 is, for example, a mouse, a keyboard, etc., and is used by the user to give instructions and input necessary when modifying a model or viewing evaluation information.
- the model generation device 100 generates a machine learning model (hereinafter also simply referred to as a "model") using training data prepared in advance.
- the model generation device 100 also analyzes and evaluates the generated model. Specifically, the model generation device 100 performs prediction using a model using evaluation data and the like, and evaluates the model based on the prediction result.
- the model generation device 100 evaluates multiple models using multiple evaluation indicators.
- the evaluation index includes, for example, various indexes such as model prediction accuracy, compatibility, and fairness. Note that the prediction accuracy indicates the probability that the prediction result by the model is correct. Compatibility refers to the degree to which the prediction results of one model and another model agree.
- fairness refers to the degree of difference or dispersion of prediction results of a model for data with different attributes.
- the model generation device 100 presents the results of evaluating the plurality of models in relation to the plurality of evaluation indicators to the user as evaluation information.
- the user can check the evaluation information, select an appropriate model from a plurality of models, or operate the input device 3 to input modification information for modifying the model.
- machine learning model is information that represents the relationship between explanatory variables and objective variables.
- a machine learning model is, for example, a component for estimating a result to be estimated by calculating a target variable based on an explanatory variable.
- a machine learning model is generated by executing a learning algorithm using learning data for which the value of the target variable has already been obtained and arbitrary parameters as input.
- a machine learning model may be represented, for example, by a function c that maps an input x to a correct answer y.
- the machine learning model may be one that estimates a numerical value to be estimated, or may be one that estimates a label to be estimated.
- the machine learning model may output variables that describe the probability distribution of the target variable.
- a machine learning model is sometimes described as a “learning model,” “analytical model,” “AI (Artificial Intelligence) model,” or “prediction formula.”
- explanatory variables are variables used as input in a machine learning model. Explanatory variables are sometimes described as “features” or “features.”
- the learning algorithm for generating the machine learning model is not particularly limited, and any existing learning algorithm may be used.
- the learning algorithm may be a random forest, a support vector machine, a piecewise linear model using Naive Bayes, FAB inference (Factorized Asymmetric Bayesian Inference), or a neural network.
- FAB inference Vectorized Asymmetric Bayesian Inference
- a piecewise linear model method using FAB inference is disclosed in, for example, US Patent Publication No. US2014/0222741A1.
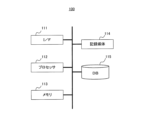
- FIG. 2 is a block diagram showing the hardware configuration of the model generation device 100.
- the model generation device 100 includes an interface (I/F) 111, a processor 112, a memory 113, a recording medium 114, and a database (DB) 115.
- I/F interface
- processor 112 processor 112
- memory 113 memory
- recording medium 114 recording medium
- DB database
- the I/F 111 inputs and outputs data to and from external devices. Specifically, training data, evaluation data, and instructions and inputs input by the user using the input device 3 are input to the model generation device 100 through the I/F 111. Furthermore, evaluation information of the model generated by the model generation device 100 is output to the display device 2 through the I/F 111.
- the processor 112 is a computer such as a CPU (Central Processing Unit), and controls the entire model generation device 100 by executing a program prepared in advance.
- the processor 112 may be a GPU (Graphics Processing Unit), a TPU (Tensor Processing Unit), a quantum processor, or an FPGA (Field-Programmable Gate Array).
- the processor 112 executes model analysis processing, which will be described later.
- the memory 113 is composed of ROM (Read Only Memory), RAM (Random Access Memory), and the like. Memory 113 is also used as a working memory while processor 112 executes various processes.
- the recording medium 114 is a non-volatile, non-temporary recording medium such as a disk-shaped recording medium or a semiconductor memory, and is configured to be detachable from the model generation device 100.
- the recording medium 114 records various programs executed by the processor 112. When the model generation device 100 executes various processes, a program recorded on the recording medium 114 is loaded into the memory 113 and executed by the processor 112.
- the DB 115 stores information regarding the model generated by the model generation device 100 (hereinafter referred to as "existing model”) and the model after modification by retraining (hereinafter referred to as "modified model”). Further, the DB 115 stores training data input through the I/F 111, evaluation data, correction information input by the user, and the like, as necessary.
- FIG. 3 is a block diagram showing the functional configuration of the model generation device 100 of the first embodiment.
- the model generation device 100 functionally includes a training data DB 121, a model training section 122, a model DB 123, an evaluation data DB 124, and an analysis section 125.
- the training data DB 121 stores training data used for model generation.
- Training data D1 is input to model training section 122.
- the training data D1 is composed of a plurality of combinations of input data and correct answers (correct values or correct labels) for the input data.
- the model training unit 122 trains a model using the training data D1 and generates a model.
- the model training unit 122 outputs model data M corresponding to the generated model to the model DB 123 and the analysis unit 125.
- the model data M includes a plurality of parameter information constituting the model.
- the parameter information includes, for example, information on explanatory variables used as model inputs, information on weights for each explanatory variable, information on weights for each sample forming input data, and the like.
- the model DB 123 stores multiple models for each task.
- a "task" refers to a problem or question and the type of prediction or inference that is made based on the available data.
- Tasks include various tasks such as classification tasks, regression tasks, clustering tasks, and object recognition tasks.
- a classification task refers to assigning data to categories.
- a regression task refers to predicting the value of a certain objective variable based on the value of another explanatory variable.
- a clustering task refers to grouping data according to similarities.
- the object recognition task refers to detecting an object in an image and outputting its position and class.
- the model DB 123 stores a plurality of models for each task. Note that multiple models corresponding to a certain task may use different algorithms, or may be different models obtained using the same algorithm on different data, and may have different settings (for example, hyper They may be different models obtained by the same algorithm with different parameters).
- the model training unit 122 retrains the existing model to generate a modified model.
- the model training unit 122 corrects the parameters constituting the model based on the correction information D3 input by the user using the input device 3, and uses training data for retraining as necessary to improve the model. Perform retraining.
- the model training unit 122 stores model data M of the corrected model obtained through retraining in the model DB 123 and outputs it to the analysis unit 125.
- the method by which the model training unit 122 retrains the model is not particularly limited.
- the model training unit 122 may use a method of ignoring the existing model and retraining a completely new modified model, or a method of updating the existing model using new training data.
- Other methods for the model training unit 122 to retrain an existing model include a method of updating only the coefficients through retraining without changing the types of explanatory variables used in the model, and a method of selecting explanatory variables. There are ways to retrain.
- the evaluation data DB 124 stores evaluation data used to evaluate the generated model.
- the evaluation data includes, for example, part of the collected data that was not used as training data, newly collected data, validation data prepared for verification, and the like. Note that training data may be used as evaluation data.
- the evaluation data is composed of a plurality of combinations of input data and correct answers (correct values or correct labels) for the input data.
- the analysis unit 125 analyzes the performance of multiple models using the evaluation data. Specifically, the analysis unit 125 acquires a plurality of models corresponding to the task selected by the user from the model DB 123, and calculates an evaluation index for each model using evaluation data. In the following description, it is assumed that the analysis unit 125 calculates an accuracy index and a compatibility index for each model as a plurality of evaluation indexes specified by the user. The analysis unit 125 then evaluates each model in relation to the accuracy index and the compatibility index, and outputs the results to the display device 2 as evaluation information D2.
- the analysis unit 125 is an example of an index acquisition means, an importance degree acquisition means, an index value acquisition means, and an analysis means.
- the display device 2 displays the evaluation information D2 output by the analysis section 125 on the display device 2. By viewing the displayed evaluation information, the user can evaluate multiple models in terms of accuracy index and compatibility index.
- the user inputs modification information D3 for modifying the current model into the input device 3, if necessary.
- the modification information D3 includes, for example, information on explanatory variables used as model inputs, information on weights for each explanatory variable, information on weights set for each attribute of the category of explanatory variables, and weights for each sample constituting input data. This is information related to corrections such as information.
- the model training unit 122 corrects the model by retraining the model using the input correction information D3.
- the analysis unit 125 ranks and displays a plurality of models corresponding to one task based on the degree of importance specified by the user for a plurality of evaluation indicators.
- FIG. 4 shows a display example of evaluation information according to the first embodiment.
- the display example 40 in FIG. 4 includes a model list 41 and a slide bar 42.
- the model list 41 is a list of multiple models, and includes candidate models, accuracy indicators, and compatibility indicators. "Candidate model” indicates multiple models corresponding to one task. In the example of FIG. 4, four candidate models h1 to h4 corresponding to one task are displayed.
- the "accuracy index” is an index indicating the accuracy of each candidate model.
- accuracy metrics indicate the probability that a model's output is correct.
- R2 coefficient of determination
- RMSE Root Means Square Error
- MAE Mean Absolute Error
- an index indicating that the smaller the value, the better the accuracy it may be used as an index indicating that the larger the value, the better the accuracy, by multiplying it by "-1” or the like.
- a value multiplied by "-1" may be used as an index.
- accuracy indicators such as accuracy, precision, recall, F1-score, and AUC (Area under the ROC curve) can be used.
- the "compatibility index" indicates the compatibility between a plurality of models, and specifically, it is indicated by the degree to which another model hx was able to correctly answer data that was answered correctly by a certain model h0.
- the analysis unit 125 uses a "compatibility index” and an “accuracy index” as evaluation indexes.
- the evaluation index used by the analysis unit 125 is not limited to these, and any evaluation index can be used.
- the analysis 125 may analyze the performance of the model using a "fairness index" as an evaluation index.
- the slide bar 42 is a bar for specifying the ratio of importance (weight) between the accuracy index and the compatibility index, and is operated by the user. Specifically, when the cursor 42a is at the left end of the slide bar 42, the importance of the accuracy index is 100% and the importance of the compatibility index is 0%. On the other hand, when the cursor 42a is at the right end of the slide bar 42, the importance of the accuracy index is 0% and the importance of the compatibility index is 100%. Furthermore, when the cursor 42a is located at the center of the slide bar 42, the importance of the accuracy index is 50% and the importance of the compatibility index is 50%. By specifying the position of the cursor 42a on the slide bar 42, the user can specify how much importance is placed on either the accuracy index or the compatibility index.
- the analysis unit 125 first calculates the accuracy index value and compatibility index value for each of the candidate models h1 to h4 using evaluation data and the like. Note that the larger the value of the accuracy index, the higher the accuracy, and the larger the value of the compatibility index, the higher the compatibility.
- the analysis unit 125 ranks the candidate models using a value obtained by aggregating evaluation indicators (hereinafter also referred to as an "aggregated evaluation value") using the importance ratio specified by the user.
- This aggregated evaluation value is a value indicating a comprehensive evaluation regarding a plurality of evaluation indicators based on the degree of importance specified by the user. Therefore, by ranking a plurality of candidate models using the aggregated evaluation value, the user can select an appropriate candidate model under the conditions of the degree of importance specified by the user.
- the analysis unit 125 aggregates the evaluation indicators using a linear function, and uses a weighted sum as the aggregated evaluation value.
- the analysis unit 125 calculates a weighted sum for all candidate models h1 to h4 using the above equation (1), ranks the candidate models in descending order of the weighted sum S, and displays a list. Accordingly, in the example of FIG. 4, the user understands that the model h3 is the most appropriate in terms of the ratio of importance between the accuracy index and the compatibility index (80%:20%) specified by the user.
- the analysis unit 125 displays a list of multiple candidate models according to the aggregated evaluation value obtained by aggregating the accuracy index and the compatibility index using the degree of importance specified by the user. Therefore, the user can easily know which candidate model should be used based on the level of importance specified by the user.
- FIG. 5 shows another display example of evaluation information according to the first embodiment. This example also shows accuracy indicators and compatibility indicators for multiple models corresponding to one task. However, in the example of FIG. 4, the user specifies the degree of importance using the slide bar 42, whereas in the example of FIG. 5, the user specifies the degree of importance using a bar graph.
- the display example 50 in FIG. 5 includes a model list 51 and a bar graph 52.
- the model list 41 is a list display of a plurality of models, similar to the first example. However, in the example of FIG. 5, two accuracy indicators and two compatibility indicators selected by the user are used.
- the compatibility index 1 can be the ratio of the data that the old model answered correctly to the data that the new model also answered correctly.
- the compatibility index 2 can be the ratio of data for which the new model was incorrect to that for which the old model was also incorrect.
- the bar graph 52 includes a bar 52a for each evaluation index.
- the user can change the importance of each evaluation index by changing the length of the bar 52a corresponding to each evaluation index using the cursor C or the like.
- the user uses cursor C to change the importance of accuracy index 1.
- the user can press the renormalization button 52b to extend the bar 52a without changing the importance ratio between the multiple evaluation indicators.
- the length of each bar 52a in display example 50 can be accommodated within the display area.
- FIG. 5 by displaying the ratio of the length of each bar 52a to the whole (total of four bars) under each bar 52a, the user can understand the ratio of importance to each evaluation index. You will be able to make fine adjustments.
- the method of ranking multiple candidate models by the analysis unit 125 is the same as in the first example. That is, the analysis unit 125 weights each evaluation index (in this example, accuracy index 1, accuracy index 2, compatibility index 1, and compatibility index 2) as an aggregate evaluation value using the ratio of importance specified by the user.
- the sum S is calculated, and a plurality of candidate models are displayed in the model list 51 in that order.
- the user can easily know which candidate model is optimal in terms of the importance ratio specified by the user.
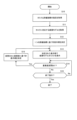
- FIG. 6 is a flowchart showing model analysis processing according to the first embodiment.
- the model analysis process is a process in which a plurality of models corresponding to a task specified by the user are ranked and displayed according to the importance of the evaluation index specified by the user. This processing is realized by the processor 112 shown in FIG. 2 executing a program prepared in advance and mainly operating as the model training section 122 and analysis section 125 shown in FIG. 3.
- the analysis unit 125 obtains the user's designation of the task and evaluation index (step S10).
- FIG. 4 is an example in which the user specifies a certain task and specifies a certain accuracy index and a certain compatibility index as evaluation indices.
- FIG. 5 is an example in which the user specifies a certain task and specifies accuracy index 1, accuracy index 2, compatibility index 1, and compatibility index 2 as evaluation indexes.
- the analysis unit 125 obtains a plurality of candidate models corresponding to the task specified by the user (step S11). In the examples of FIGS. 4 and 5, the analysis unit 125 has acquired candidate models h1 to h4.
- the analysis unit 125 determines the display order based on one evaluation index as a default display among the plurality of evaluation indexes (step S12), and displays a list of the plurality of candidate models in the determined display order. (Step S13).
- one evaluation index in this case may be, for example, an evaluation index specified by the user from among a plurality of evaluation indicators, or an evaluation index specified by the user first may be used.
- the default display a plurality of candidate models are displayed in a list in descending order of one evaluation index.
- the analysis unit 125 determines whether the user has changed the importance level (step S14). Specifically, in the example of FIG. 4, the analysis unit 125 determines whether the user has changed the position of the cursor 42a of the slide bar 42. Further, in the example of FIG. 5, the analysis unit 125 determines whether the user has changed the length of the bar 52a of any evaluation index. If the user changes the importance level (step S14: Yes), the analysis unit 125 calculates the above-mentioned weighted sum S based on the changed importance level, and displays the plurality of candidate models in the order of the weighted sum S. Determine (step S15). Then, the analysis unit 125 redisplays the model list in the determined display order (step S13). As a result, the model list 41 shown in FIG. 4 or the model list 51 shown in FIG. 5 is displayed.
- step S14 determines whether the user has changed the importance level. If the user has not changed the importance level (step S14: No), the analysis unit 125 determines whether the user has input an end instruction (step S16). If the termination instruction has not been input (step S16: No), the process returns to step S14. On the other hand, if an end instruction is input (step S16: Yes), the process ends.
- step S12 the display order of the plurality of candidate models is determined based on any one evaluation index as a default display. Instead, the user may be prompted to input the degree of importance from the beginning, and the display order of the plurality of candidate models may be determined and displayed based on the input degree of importance.
- an aggregate evaluation value for a plurality of evaluation indicators is calculated based on a plurality of evaluation indicators specified by the user and their importance, and an aggregate evaluation value is calculated based on the aggregate evaluation value.
- a plurality of candidate models corresponding to the task specified by the user are ranked and displayed. Therefore, the user can easily know the optimal candidate model for the level of importance specified by the user.
- Modified example (Modification 1)
- the analysis unit 125 aggregates multiple evaluation indicators using a linear function indicating a weighted sum, but instead uses another linear function or a nonlinear function to aggregate multiple evaluation indicators. may be aggregated to calculate an aggregated evaluation value.
- Modification 2 In the model analysis process described above, the ratio of importance specified by the user may be learned in association with the task. This makes it possible to generate a machine learning model that has learned the relationship between a task and the ratio of importance that the user considers appropriate for that task. Using this machine learning model, by inputting a task, the user can obtain an appropriate importance ratio for that task as an output.
- the analysis unit 125 ranks and displays a list of multiple models corresponding to the task specified by the user. Instead, the analysis unit 125 may rank and display any plurality of models specified by the user, regardless of the identity of the tasks.
- the analysis unit 125 acquires a plurality of models corresponding to the task selected by the user from the model DB 123, and calculates an evaluation index for each model using evaluation data.
- a function for calculating the evaluation index of each model may be provided externally.
- the analysis unit 125 may acquire the evaluation index of each model from a DB that stores the evaluation index of each model.
- FIG. 7 is a block diagram showing a schematic configuration of a model generation system 1x using a server and a terminal device.
- a server 100x includes the configuration of the model generation device 100 shown in FIG.
- the display device 2x and input device 3x of the terminal device 7 used by the user are used as the display device 2 and input device 3 shown in FIG.
- the analysis unit 125 displays relationships between multiple models corresponding to one task based on multiple evaluation indicators. Specifically, the analysis unit 125 embeds each model in the space based on the values of a plurality of evaluation indicators specified by the user, and can consider the models to be at the same level in relation to the plurality of evaluation indicators and the degree of importance specified by the user. Draw the region of the model in its space.
- FIG. 8 shows a display example of evaluation information according to the second embodiment.
- each model is embedded in a space (hereinafter also referred to as "evaluation index space") in which the X-axis and Y-axis are the compatibility index and accuracy index specified by the user, respectively.
- evaluation index space a space in which the X-axis and Y-axis are the compatibility index and accuracy index specified by the user, respectively.
- the analysis unit 125 obtains a plurality of models corresponding to one task specified by the user, and calculates the values of the compatibility index and accuracy index specified by the user for the models. Then, the analysis unit 125 embeds each model in the evaluation index space based on the values of the compatibility index and accuracy index of each model. As a result, display example 60 is obtained.
- the analysis unit 125 draws line segments L1 to L5 in which the two evaluation indicators are at the same level on the evaluation index space based on the above-mentioned aggregated evaluation value, and creates a display example 61.
- the analysis unit 125 sets the value of the weighted sum S to a predetermined value S1, and draws a line segment L1 on the evaluation index space. Similarly, the analysis unit 125 sets the value of the weighted sum S to S2, S3, . .. .. and draw line segments L2 to L5 on the evaluation index space. Furthermore, the analysis unit 125 distinguishes and displays the areas A1 to A5 defined by the line segments L1 to L5 using different colors or the like.
- the importance level (w 1 /w 2 ) specified by the user and the aggregate evaluation value S of multiple evaluation indicators are fixed, and the values of the accuracy index and compatibility index are changed. shows the position of the model on the evaluation index space when Therefore, for example, if there are two models M1 and M2 on line segment L1, they satisfy the ratio of importance of accuracy index and compatibility index specified by the user, and have a comprehensive evaluation regarding multiple evaluation indexes.
- the models have the same aggregated evaluation value S, and can be considered to be models at the same level in terms of the degree of importance specified by the user.
- This also applies to the other line segments L2 to L5. That is, the line segments L1 to L5 can be considered to be contour lines indicating the positions of models that satisfy the degree of importance specified by the user and have the same overall evaluation on the evaluation index space.
- the area A2 defined by the line segments L1 and L2 on the evaluation index space can be considered as an area indicating the position of a model that almost satisfies the degree of importance specified by the user and has almost the same level of performance.
- This also applies to the other areas A1, A3 to A5. Therefore, the user can know that the plurality of models belonging to the same area in the display example 61 are models at approximately the same level in terms of the degree of importance specified by the user. For example, the user can recognize that models h1 and h2 belonging to area A2 are at approximately the same level, and models h3 and h4 belonging to area A3 are at approximately the same level.
- the user can easily visually select models that are at the same level in terms of importance for the evaluation index that he or she has specified. It becomes possible to understand.
- the user can create a model that can successfully adjust the two conflicting evaluation metrics and show appropriate performance. can be found.
- FIG. 9 is a flowchart showing model analysis processing according to the second embodiment.
- the model analysis process is a process of displaying a plurality of models corresponding to the task selected by the user on the evaluation index space according to the importance of the evaluation index specified by the user. This processing is realized by the processor 112 shown in FIG. 2 executing a prepared program and mainly operating as the model training section 122 and analysis section 125 shown in FIG. 3.
- the analysis unit 125 obtains a task by the user, a plurality of evaluation indicators, and the importance of these evaluation indicators (step S10).
- FIG. 8 is an example in which the user specifies a certain task and specifies an accuracy index and a compatibility index as evaluation indexes.
- the analysis unit 125 obtains a plurality of candidate models corresponding to the task specified by the user (step S11). In the example of FIG. 8, the analysis unit 125 has acquired models h1 to h5. Next, the analysis unit 125 calculates the evaluation index value for each model and embeds it in the evaluation index space (step S22). In the example of FIG. 8, the analysis unit 125 calculates the accuracy index and compatibility index for the models h1 to h5, and embeds each model h1 to h5 in the evaluation index space as shown in the display example 60.
- the analysis unit 125 draws contour lines L1 to L5 using the degree of importance specified by the user and the value of each evaluation index.
- the analysis unit 125 fixes the importance ratio (w 1 /w 2 ) of each evaluation index specified by the user in the above equation (2), and changes the value of the weighted sum S by a predetermined width.
- the contour lines L1 to L5 are drawn by changing the accuracy index and the compatibility index while changing the .
- the analysis unit 125 colors the regions A1 to A5 defined by the contour lines L1 to L5 using different colors, and draws regions of the model that can be considered to be at the same level (step S23). Then, the process ends.
- a plurality of models corresponding to a task specified by the user are displayed in the evaluation index space based on a plurality of evaluation indicators specified by the user and their importance levels. be done. Further, based on the evaluation index specified by the user and its importance, regions of models that can be considered to be of the same level are displayed on the evaluation index space. Therefore, the user can easily know models that can be considered to be at the same level in the case of the level of importance specified by the user, for example, models that can be used instead.
- Modified example (Modification 1)
- the analysis unit 125 aggregates two evaluation indicators using a linear function indicating a weighted sum, and draws contour lines on the evaluation indicator space.
- the analysis unit 125 may aggregate the two evaluation indicators using another linear function or nonlinear function, and draw contour lines on the evaluation indicator space.
- the analysis unit 125 ranks and displays a list of multiple models corresponding to the task specified by the user. Instead, the analysis unit 125 may display any plurality of models specified by the user on the evaluation index space, regardless of the identity of the tasks.
- the analysis unit 125 may acquire the evaluation index of each model from the outside.
- the model generation device may be configured by a server and a terminal device as shown in FIG. 7, similarly to the fifth modification of the first embodiment.
- FIG. 10 is a block diagram showing the functional configuration of a model analysis device 70 according to the third embodiment.
- the model analysis device 70 includes an index acquisition means 71, an importance degree acquisition means 72, an index value acquisition means 73, and an analysis means 74.
- FIG. 11 is a flowchart of processing by the model analysis device 70 of the third embodiment.
- the index acquisition means 71 acquires designations of a plurality of evaluation indexes regarding the model (step S71).
- the importance obtaining unit 72 obtains the importance for a plurality of evaluation indicators (step S72).
- the index value acquisition means 73 acquires the values of a plurality of evaluation indexes for a plurality of models (step S73).
- the analysis means 74 analyzes the ranking of the plurality of models based on the obtained evaluation index value and importance level (step S74).
- model analysis device 70 of the third embodiment it is possible to evaluate models and select an appropriate model by considering a plurality of evaluation indicators.
- a model analysis device comprising:
- the analysis means aggregates the values of the plurality of evaluation indicators based on the degree of importance, calculates an aggregate evaluation value for each model, and outputs information in which the plurality of models are ranked according to the aggregate evaluation value.
- Appendix 8 obtain multiple evaluation metric specifications for the model; Obtaining the importance of the plurality of evaluation indicators, obtaining values of the plurality of evaluation indicators for the plurality of models; A recording medium that records a program that causes a computer to execute a process of analyzing rankings of the plurality of models based on the obtained evaluation index values and degrees of importance.
- Model generation device 112 Processor 121 Training data DB 122 Model training department 123 Model DB 124 Evaluation data DB 125 Analysis Department
Abstract
L'invention concerne un dispositif d'analyse de modèle, un moyen d'acquisition d'indice acquérant la désignation d'une pluralité d'indices d'évaluation se rapportant à un modèle. Un moyen d'acquisition d'importance acquiert des degrés d'importance pour la pluralité d'indices d'évaluation. Un moyen d'acquisition de valeur d'indice acquiert les valeurs de la pluralité d'indices d'évaluation pour une pluralité de modèles. Un moyen d'analyse analyse le classement de la pluralité de modèles sur la base des valeurs d'indice d'évaluation et des degrés d'importance acquis.
Priority Applications (1)
| Application Number | Priority Date | Filing Date | Title |
|---|---|---|---|
| PCT/JP2022/012675 WO2023175921A1 (fr) | 2022-03-18 | 2022-03-18 | Dispositif d'analyse de modèle, procédé d'analyse de modèle et support d'enregistrement |
Applications Claiming Priority (1)
| Application Number | Priority Date | Filing Date | Title |
|---|---|---|---|
| PCT/JP2022/012675 WO2023175921A1 (fr) | 2022-03-18 | 2022-03-18 | Dispositif d'analyse de modèle, procédé d'analyse de modèle et support d'enregistrement |
Publications (1)
| Publication Number | Publication Date |
|---|---|
| WO2023175921A1 true WO2023175921A1 (fr) | 2023-09-21 |
Family
ID=88022634
Family Applications (1)
| Application Number | Title | Priority Date | Filing Date |
|---|---|---|---|
| PCT/JP2022/012675 WO2023175921A1 (fr) | 2022-03-18 | 2022-03-18 | Dispositif d'analyse de modèle, procédé d'analyse de modèle et support d'enregistrement |
Country Status (1)
| Country | Link |
|---|---|
| WO (1) | WO2023175921A1 (fr) |
Citations (2)
| Publication number | Priority date | Publication date | Assignee | Title |
|---|---|---|---|---|
| WO2013179577A1 (fr) * | 2012-05-31 | 2013-12-05 | 日本電気株式会社 | Système d'optimisation polyvalente, système d'analyse d'informations, procédé d'optimisation polyvalente, et programme |
| WO2022038804A1 (fr) * | 2020-08-21 | 2022-02-24 | 株式会社日立製作所 | Dispositif de diagnostic et procédé de réglage de paramètre |
-
2022
- 2022-03-18 WO PCT/JP2022/012675 patent/WO2023175921A1/fr unknown
Patent Citations (2)
| Publication number | Priority date | Publication date | Assignee | Title |
|---|---|---|---|---|
| WO2013179577A1 (fr) * | 2012-05-31 | 2013-12-05 | 日本電気株式会社 | Système d'optimisation polyvalente, système d'analyse d'informations, procédé d'optimisation polyvalente, et programme |
| WO2022038804A1 (fr) * | 2020-08-21 | 2022-02-24 | 株式会社日立製作所 | Dispositif de diagnostic et procédé de réglage de paramètre |
Similar Documents
| Publication | Publication Date | Title |
|---|---|---|
| Gurumoorthy et al. | Efficient data representation by selecting prototypes with importance weights | |
| US11216741B2 (en) | Analysis apparatus, analysis method, and non-transitory computer readable medium | |
| van Rijn et al. | Fast algorithm selection using learning curves | |
| US6636862B2 (en) | Method and system for the dynamic analysis of data | |
| Zheng et al. | Learning criteria weights of an optimistic Electre Tri sorting rule | |
| JP7330712B2 (ja) | 材料特性予測装置および材料特性予測方法 | |
| JP7069029B2 (ja) | 自動予測システム、自動予測方法および自動予測プログラム | |
| GB2541649A (en) | User feedback for machine learning | |
| US20170046460A1 (en) | Scoring a population of examples using a model | |
| JP2022035686A (ja) | 診断装置及びパラメータ調整方法 | |
| US20200050982A1 (en) | Method and System for Predictive Modeling for Dynamically Scheduling Resource Allocation | |
| CN116484269A (zh) | 显示屏模组的参数处理方法、装置、设备及存储介质 | |
| WO2023175921A1 (fr) | Dispositif d'analyse de modèle, procédé d'analyse de modèle et support d'enregistrement | |
| JPH10240715A (ja) | 予測・推定装置及び予測・推定方法 | |
| Liu et al. | Active learning in the predict-then-optimize framework: A margin-based approach | |
| WO2023175922A1 (fr) | Dispositif d'analyse de modèle, procédé d'analyse de modèle et support d'enregistrement | |
| US20180121811A1 (en) | Profiling a population of examples in a precisely descriptive or tendency-based manner | |
| WO2019235608A1 (fr) | Dispositif d'analyse, procédé d'analyse et support d'enregistrement | |
| WO2019235611A1 (fr) | Dispositif d'analyse, procédé d'analyse et support d'enregistrement | |
| JP7438616B2 (ja) | 情報処理装置及びプログラム | |
| Araujo et al. | Hybrid intelligent design of morphological-rank-linear perceptrons for software development cost estimation | |
| US20230214668A1 (en) | Hyperparameter adjustment device, non-transitory recording medium in which hyperparameter adjustment program is recorded, and hyperparameter adjustment program | |
| WO2023181322A1 (fr) | Dispositif d'analyse de modèle, procédé d'analyse de modèle et support d'enregistrement | |
| CN113987261A (zh) | 一种基于动态信任感知的视频推荐方法及系统 | |
| KR20220061542A (ko) | 신뢰구간에 기반한 제조공정의 최적화 방법 및 시스템 |
Legal Events
| Date | Code | Title | Description |
|---|---|---|---|
| 121 | Ep: the epo has been informed by wipo that ep was designated in this application |
Ref document number: 22932193 Country of ref document: EP Kind code of ref document: A1 |