WO2023175921A1 - Model analysis device, model analysis method, and recording medium - Google Patents
Model analysis device, model analysis method, and recording medium Download PDFInfo
- Publication number
- WO2023175921A1 WO2023175921A1 PCT/JP2022/012675 JP2022012675W WO2023175921A1 WO 2023175921 A1 WO2023175921 A1 WO 2023175921A1 JP 2022012675 W JP2022012675 W JP 2022012675W WO 2023175921 A1 WO2023175921 A1 WO 2023175921A1
- Authority
- WO
- WIPO (PCT)
- Prior art keywords
- model
- evaluation
- importance
- index
- models
- Prior art date
Links
Images


Classifications
-
- G—PHYSICS
- G06—COMPUTING; CALCULATING OR COUNTING
- G06N—COMPUTING ARRANGEMENTS BASED ON SPECIFIC COMPUTATIONAL MODELS
- G06N20/00—Machine learning
Definitions
- This disclosure relates to analysis of machine learning models.
- Patent Document 1 relates to a system for learning and/or optimizing processes related to semiconductor manufacturing, and describes a method for ranking candidate process models based on quality values and diversity values.
- One purpose of the present disclosure is to evaluate models and select an appropriate model by considering multiple evaluation indicators.
- the model analysis device includes: an index acquisition means for acquiring designations of a plurality of evaluation indexes regarding the model; Importance degree acquisition means for acquiring importance degrees for the plurality of evaluation indicators; index value acquisition means for acquiring values of the plurality of evaluation indicators for the plurality of models; an analysis means for analyzing the ranking of the plurality of models based on the obtained evaluation index value and importance; Equipped with
- the model analysis method includes: obtain multiple evaluation metric specifications for the model; Obtaining the importance of the plurality of evaluation indicators, obtaining values of the plurality of evaluation indicators for the plurality of models; The ranking of the plurality of models is analyzed based on the obtained evaluation index value and importance level.
- the recording medium includes: obtain multiple evaluation metric specifications for the model; Obtaining the importance of the plurality of evaluation indicators, obtaining values of the plurality of evaluation indicators for the plurality of models; A program is recorded that causes a computer to execute a process of analyzing the rankings of the plurality of models based on the obtained evaluation index values and degrees of importance.
- FIG. 1 is a block diagram showing the overall configuration of a model generation system according to a first embodiment.
- FIG. 2 is a block diagram showing the hardware configuration of a model generation device.
- 1 is a block diagram showing a functional configuration of a model generation device according to a first embodiment;
- FIG. A display example of evaluation information according to the first embodiment is shown.
- Another display example of evaluation information according to the first embodiment is shown.
- It is a flowchart of model analysis processing of a 1st embodiment.
- FIG. 1 is a block diagram showing a schematic configuration of a model generation system using a server and a terminal device.
- a display example of evaluation information according to the second embodiment is shown. It is a flowchart of processing by a model analysis device of a 2nd embodiment.
- It is a block diagram showing the functional composition of a model analysis device of a 3rd embodiment.
- It is a flow chart of processing by a model analysis device of a 3rd embodiment.
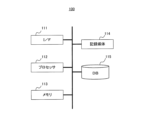
- FIG. 1 is a block diagram showing the overall configuration of a model generation system according to a first embodiment.
- the model generation system 1 includes a model generation device 100, a display device 2, and an input device 3.
- the model generation device 100 is an application of the model analysis device of the present disclosure, and is configured by, for example, a computer such as a personal computer (PC).
- the display device 2 is, for example, a liquid crystal display device, and displays the evaluation information generated by the model generation device 100.
- the input device 3 is, for example, a mouse, a keyboard, etc., and is used by the user to give instructions and input necessary when modifying a model or viewing evaluation information.
- the model generation device 100 generates a machine learning model (hereinafter also simply referred to as a "model") using training data prepared in advance.
- the model generation device 100 also analyzes and evaluates the generated model. Specifically, the model generation device 100 performs prediction using a model using evaluation data and the like, and evaluates the model based on the prediction result.
- the model generation device 100 evaluates multiple models using multiple evaluation indicators.
- the evaluation index includes, for example, various indexes such as model prediction accuracy, compatibility, and fairness. Note that the prediction accuracy indicates the probability that the prediction result by the model is correct. Compatibility refers to the degree to which the prediction results of one model and another model agree.
- fairness refers to the degree of difference or dispersion of prediction results of a model for data with different attributes.
- the model generation device 100 presents the results of evaluating the plurality of models in relation to the plurality of evaluation indicators to the user as evaluation information.
- the user can check the evaluation information, select an appropriate model from a plurality of models, or operate the input device 3 to input modification information for modifying the model.
- machine learning model is information that represents the relationship between explanatory variables and objective variables.
- a machine learning model is, for example, a component for estimating a result to be estimated by calculating a target variable based on an explanatory variable.
- a machine learning model is generated by executing a learning algorithm using learning data for which the value of the target variable has already been obtained and arbitrary parameters as input.
- a machine learning model may be represented, for example, by a function c that maps an input x to a correct answer y.
- the machine learning model may be one that estimates a numerical value to be estimated, or may be one that estimates a label to be estimated.
- the machine learning model may output variables that describe the probability distribution of the target variable.
- a machine learning model is sometimes described as a “learning model,” “analytical model,” “AI (Artificial Intelligence) model,” or “prediction formula.”
- explanatory variables are variables used as input in a machine learning model. Explanatory variables are sometimes described as “features” or “features.”
- the learning algorithm for generating the machine learning model is not particularly limited, and any existing learning algorithm may be used.
- the learning algorithm may be a random forest, a support vector machine, a piecewise linear model using Naive Bayes, FAB inference (Factorized Asymmetric Bayesian Inference), or a neural network.
- FAB inference Vectorized Asymmetric Bayesian Inference
- a piecewise linear model method using FAB inference is disclosed in, for example, US Patent Publication No. US2014/0222741A1.
- FIG. 2 is a block diagram showing the hardware configuration of the model generation device 100.
- the model generation device 100 includes an interface (I/F) 111, a processor 112, a memory 113, a recording medium 114, and a database (DB) 115.
- I/F interface
- processor 112 processor 112
- memory 113 memory
- recording medium 114 recording medium
- DB database
- the I/F 111 inputs and outputs data to and from external devices. Specifically, training data, evaluation data, and instructions and inputs input by the user using the input device 3 are input to the model generation device 100 through the I/F 111. Furthermore, evaluation information of the model generated by the model generation device 100 is output to the display device 2 through the I/F 111.
- the processor 112 is a computer such as a CPU (Central Processing Unit), and controls the entire model generation device 100 by executing a program prepared in advance.
- the processor 112 may be a GPU (Graphics Processing Unit), a TPU (Tensor Processing Unit), a quantum processor, or an FPGA (Field-Programmable Gate Array).
- the processor 112 executes model analysis processing, which will be described later.
- the memory 113 is composed of ROM (Read Only Memory), RAM (Random Access Memory), and the like. Memory 113 is also used as a working memory while processor 112 executes various processes.
- the recording medium 114 is a non-volatile, non-temporary recording medium such as a disk-shaped recording medium or a semiconductor memory, and is configured to be detachable from the model generation device 100.
- the recording medium 114 records various programs executed by the processor 112. When the model generation device 100 executes various processes, a program recorded on the recording medium 114 is loaded into the memory 113 and executed by the processor 112.
- the DB 115 stores information regarding the model generated by the model generation device 100 (hereinafter referred to as "existing model”) and the model after modification by retraining (hereinafter referred to as "modified model”). Further, the DB 115 stores training data input through the I/F 111, evaluation data, correction information input by the user, and the like, as necessary.
- FIG. 3 is a block diagram showing the functional configuration of the model generation device 100 of the first embodiment.
- the model generation device 100 functionally includes a training data DB 121, a model training section 122, a model DB 123, an evaluation data DB 124, and an analysis section 125.
- the training data DB 121 stores training data used for model generation.
- Training data D1 is input to model training section 122.
- the training data D1 is composed of a plurality of combinations of input data and correct answers (correct values or correct labels) for the input data.
- the model training unit 122 trains a model using the training data D1 and generates a model.
- the model training unit 122 outputs model data M corresponding to the generated model to the model DB 123 and the analysis unit 125.
- the model data M includes a plurality of parameter information constituting the model.
- the parameter information includes, for example, information on explanatory variables used as model inputs, information on weights for each explanatory variable, information on weights for each sample forming input data, and the like.
- the model DB 123 stores multiple models for each task.
- a "task" refers to a problem or question and the type of prediction or inference that is made based on the available data.
- Tasks include various tasks such as classification tasks, regression tasks, clustering tasks, and object recognition tasks.
- a classification task refers to assigning data to categories.
- a regression task refers to predicting the value of a certain objective variable based on the value of another explanatory variable.
- a clustering task refers to grouping data according to similarities.
- the object recognition task refers to detecting an object in an image and outputting its position and class.
- the model DB 123 stores a plurality of models for each task. Note that multiple models corresponding to a certain task may use different algorithms, or may be different models obtained using the same algorithm on different data, and may have different settings (for example, hyper They may be different models obtained by the same algorithm with different parameters).
- the model training unit 122 retrains the existing model to generate a modified model.
- the model training unit 122 corrects the parameters constituting the model based on the correction information D3 input by the user using the input device 3, and uses training data for retraining as necessary to improve the model. Perform retraining.
- the model training unit 122 stores model data M of the corrected model obtained through retraining in the model DB 123 and outputs it to the analysis unit 125.
- the method by which the model training unit 122 retrains the model is not particularly limited.
- the model training unit 122 may use a method of ignoring the existing model and retraining a completely new modified model, or a method of updating the existing model using new training data.
- Other methods for the model training unit 122 to retrain an existing model include a method of updating only the coefficients through retraining without changing the types of explanatory variables used in the model, and a method of selecting explanatory variables. There are ways to retrain.
- the evaluation data DB 124 stores evaluation data used to evaluate the generated model.
- the evaluation data includes, for example, part of the collected data that was not used as training data, newly collected data, validation data prepared for verification, and the like. Note that training data may be used as evaluation data.
- the evaluation data is composed of a plurality of combinations of input data and correct answers (correct values or correct labels) for the input data.
- the analysis unit 125 analyzes the performance of multiple models using the evaluation data. Specifically, the analysis unit 125 acquires a plurality of models corresponding to the task selected by the user from the model DB 123, and calculates an evaluation index for each model using evaluation data. In the following description, it is assumed that the analysis unit 125 calculates an accuracy index and a compatibility index for each model as a plurality of evaluation indexes specified by the user. The analysis unit 125 then evaluates each model in relation to the accuracy index and the compatibility index, and outputs the results to the display device 2 as evaluation information D2.
- the analysis unit 125 is an example of an index acquisition means, an importance degree acquisition means, an index value acquisition means, and an analysis means.
- the display device 2 displays the evaluation information D2 output by the analysis section 125 on the display device 2. By viewing the displayed evaluation information, the user can evaluate multiple models in terms of accuracy index and compatibility index.
- the user inputs modification information D3 for modifying the current model into the input device 3, if necessary.
- the modification information D3 includes, for example, information on explanatory variables used as model inputs, information on weights for each explanatory variable, information on weights set for each attribute of the category of explanatory variables, and weights for each sample constituting input data. This is information related to corrections such as information.
- the model training unit 122 corrects the model by retraining the model using the input correction information D3.
- the analysis unit 125 ranks and displays a plurality of models corresponding to one task based on the degree of importance specified by the user for a plurality of evaluation indicators.
- FIG. 4 shows a display example of evaluation information according to the first embodiment.
- the display example 40 in FIG. 4 includes a model list 41 and a slide bar 42.
- the model list 41 is a list of multiple models, and includes candidate models, accuracy indicators, and compatibility indicators. "Candidate model” indicates multiple models corresponding to one task. In the example of FIG. 4, four candidate models h1 to h4 corresponding to one task are displayed.
- the "accuracy index” is an index indicating the accuracy of each candidate model.
- accuracy metrics indicate the probability that a model's output is correct.
- R2 coefficient of determination
- RMSE Root Means Square Error
- MAE Mean Absolute Error
- an index indicating that the smaller the value, the better the accuracy it may be used as an index indicating that the larger the value, the better the accuracy, by multiplying it by "-1” or the like.
- a value multiplied by "-1" may be used as an index.
- accuracy indicators such as accuracy, precision, recall, F1-score, and AUC (Area under the ROC curve) can be used.
- the "compatibility index" indicates the compatibility between a plurality of models, and specifically, it is indicated by the degree to which another model hx was able to correctly answer data that was answered correctly by a certain model h0.
- the analysis unit 125 uses a "compatibility index” and an “accuracy index” as evaluation indexes.
- the evaluation index used by the analysis unit 125 is not limited to these, and any evaluation index can be used.
- the analysis 125 may analyze the performance of the model using a "fairness index" as an evaluation index.
- the slide bar 42 is a bar for specifying the ratio of importance (weight) between the accuracy index and the compatibility index, and is operated by the user. Specifically, when the cursor 42a is at the left end of the slide bar 42, the importance of the accuracy index is 100% and the importance of the compatibility index is 0%. On the other hand, when the cursor 42a is at the right end of the slide bar 42, the importance of the accuracy index is 0% and the importance of the compatibility index is 100%. Furthermore, when the cursor 42a is located at the center of the slide bar 42, the importance of the accuracy index is 50% and the importance of the compatibility index is 50%. By specifying the position of the cursor 42a on the slide bar 42, the user can specify how much importance is placed on either the accuracy index or the compatibility index.
- the analysis unit 125 first calculates the accuracy index value and compatibility index value for each of the candidate models h1 to h4 using evaluation data and the like. Note that the larger the value of the accuracy index, the higher the accuracy, and the larger the value of the compatibility index, the higher the compatibility.
- the analysis unit 125 ranks the candidate models using a value obtained by aggregating evaluation indicators (hereinafter also referred to as an "aggregated evaluation value") using the importance ratio specified by the user.
- This aggregated evaluation value is a value indicating a comprehensive evaluation regarding a plurality of evaluation indicators based on the degree of importance specified by the user. Therefore, by ranking a plurality of candidate models using the aggregated evaluation value, the user can select an appropriate candidate model under the conditions of the degree of importance specified by the user.
- the analysis unit 125 aggregates the evaluation indicators using a linear function, and uses a weighted sum as the aggregated evaluation value.
- the analysis unit 125 calculates a weighted sum for all candidate models h1 to h4 using the above equation (1), ranks the candidate models in descending order of the weighted sum S, and displays a list. Accordingly, in the example of FIG. 4, the user understands that the model h3 is the most appropriate in terms of the ratio of importance between the accuracy index and the compatibility index (80%:20%) specified by the user.
- the analysis unit 125 displays a list of multiple candidate models according to the aggregated evaluation value obtained by aggregating the accuracy index and the compatibility index using the degree of importance specified by the user. Therefore, the user can easily know which candidate model should be used based on the level of importance specified by the user.
- FIG. 5 shows another display example of evaluation information according to the first embodiment. This example also shows accuracy indicators and compatibility indicators for multiple models corresponding to one task. However, in the example of FIG. 4, the user specifies the degree of importance using the slide bar 42, whereas in the example of FIG. 5, the user specifies the degree of importance using a bar graph.
- the display example 50 in FIG. 5 includes a model list 51 and a bar graph 52.
- the model list 41 is a list display of a plurality of models, similar to the first example. However, in the example of FIG. 5, two accuracy indicators and two compatibility indicators selected by the user are used.
- the compatibility index 1 can be the ratio of the data that the old model answered correctly to the data that the new model also answered correctly.
- the compatibility index 2 can be the ratio of data for which the new model was incorrect to that for which the old model was also incorrect.
- the bar graph 52 includes a bar 52a for each evaluation index.
- the user can change the importance of each evaluation index by changing the length of the bar 52a corresponding to each evaluation index using the cursor C or the like.
- the user uses cursor C to change the importance of accuracy index 1.
- the user can press the renormalization button 52b to extend the bar 52a without changing the importance ratio between the multiple evaluation indicators.
- the length of each bar 52a in display example 50 can be accommodated within the display area.
- FIG. 5 by displaying the ratio of the length of each bar 52a to the whole (total of four bars) under each bar 52a, the user can understand the ratio of importance to each evaluation index. You will be able to make fine adjustments.
- the method of ranking multiple candidate models by the analysis unit 125 is the same as in the first example. That is, the analysis unit 125 weights each evaluation index (in this example, accuracy index 1, accuracy index 2, compatibility index 1, and compatibility index 2) as an aggregate evaluation value using the ratio of importance specified by the user.
- the sum S is calculated, and a plurality of candidate models are displayed in the model list 51 in that order.
- the user can easily know which candidate model is optimal in terms of the importance ratio specified by the user.
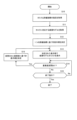
- FIG. 6 is a flowchart showing model analysis processing according to the first embodiment.
- the model analysis process is a process in which a plurality of models corresponding to a task specified by the user are ranked and displayed according to the importance of the evaluation index specified by the user. This processing is realized by the processor 112 shown in FIG. 2 executing a program prepared in advance and mainly operating as the model training section 122 and analysis section 125 shown in FIG. 3.
- the analysis unit 125 obtains the user's designation of the task and evaluation index (step S10).
- FIG. 4 is an example in which the user specifies a certain task and specifies a certain accuracy index and a certain compatibility index as evaluation indices.
- FIG. 5 is an example in which the user specifies a certain task and specifies accuracy index 1, accuracy index 2, compatibility index 1, and compatibility index 2 as evaluation indexes.
- the analysis unit 125 obtains a plurality of candidate models corresponding to the task specified by the user (step S11). In the examples of FIGS. 4 and 5, the analysis unit 125 has acquired candidate models h1 to h4.
- the analysis unit 125 determines the display order based on one evaluation index as a default display among the plurality of evaluation indexes (step S12), and displays a list of the plurality of candidate models in the determined display order. (Step S13).
- one evaluation index in this case may be, for example, an evaluation index specified by the user from among a plurality of evaluation indicators, or an evaluation index specified by the user first may be used.
- the default display a plurality of candidate models are displayed in a list in descending order of one evaluation index.
- the analysis unit 125 determines whether the user has changed the importance level (step S14). Specifically, in the example of FIG. 4, the analysis unit 125 determines whether the user has changed the position of the cursor 42a of the slide bar 42. Further, in the example of FIG. 5, the analysis unit 125 determines whether the user has changed the length of the bar 52a of any evaluation index. If the user changes the importance level (step S14: Yes), the analysis unit 125 calculates the above-mentioned weighted sum S based on the changed importance level, and displays the plurality of candidate models in the order of the weighted sum S. Determine (step S15). Then, the analysis unit 125 redisplays the model list in the determined display order (step S13). As a result, the model list 41 shown in FIG. 4 or the model list 51 shown in FIG. 5 is displayed.
- step S14 determines whether the user has changed the importance level. If the user has not changed the importance level (step S14: No), the analysis unit 125 determines whether the user has input an end instruction (step S16). If the termination instruction has not been input (step S16: No), the process returns to step S14. On the other hand, if an end instruction is input (step S16: Yes), the process ends.
- step S12 the display order of the plurality of candidate models is determined based on any one evaluation index as a default display. Instead, the user may be prompted to input the degree of importance from the beginning, and the display order of the plurality of candidate models may be determined and displayed based on the input degree of importance.
- an aggregate evaluation value for a plurality of evaluation indicators is calculated based on a plurality of evaluation indicators specified by the user and their importance, and an aggregate evaluation value is calculated based on the aggregate evaluation value.
- a plurality of candidate models corresponding to the task specified by the user are ranked and displayed. Therefore, the user can easily know the optimal candidate model for the level of importance specified by the user.
- Modified example (Modification 1)
- the analysis unit 125 aggregates multiple evaluation indicators using a linear function indicating a weighted sum, but instead uses another linear function or a nonlinear function to aggregate multiple evaluation indicators. may be aggregated to calculate an aggregated evaluation value.
- Modification 2 In the model analysis process described above, the ratio of importance specified by the user may be learned in association with the task. This makes it possible to generate a machine learning model that has learned the relationship between a task and the ratio of importance that the user considers appropriate for that task. Using this machine learning model, by inputting a task, the user can obtain an appropriate importance ratio for that task as an output.
- the analysis unit 125 ranks and displays a list of multiple models corresponding to the task specified by the user. Instead, the analysis unit 125 may rank and display any plurality of models specified by the user, regardless of the identity of the tasks.
- the analysis unit 125 acquires a plurality of models corresponding to the task selected by the user from the model DB 123, and calculates an evaluation index for each model using evaluation data.
- a function for calculating the evaluation index of each model may be provided externally.
- the analysis unit 125 may acquire the evaluation index of each model from a DB that stores the evaluation index of each model.
- FIG. 7 is a block diagram showing a schematic configuration of a model generation system 1x using a server and a terminal device.
- a server 100x includes the configuration of the model generation device 100 shown in FIG.
- the display device 2x and input device 3x of the terminal device 7 used by the user are used as the display device 2 and input device 3 shown in FIG.
- the analysis unit 125 displays relationships between multiple models corresponding to one task based on multiple evaluation indicators. Specifically, the analysis unit 125 embeds each model in the space based on the values of a plurality of evaluation indicators specified by the user, and can consider the models to be at the same level in relation to the plurality of evaluation indicators and the degree of importance specified by the user. Draw the region of the model in its space.
- FIG. 8 shows a display example of evaluation information according to the second embodiment.
- each model is embedded in a space (hereinafter also referred to as "evaluation index space") in which the X-axis and Y-axis are the compatibility index and accuracy index specified by the user, respectively.
- evaluation index space a space in which the X-axis and Y-axis are the compatibility index and accuracy index specified by the user, respectively.
- the analysis unit 125 obtains a plurality of models corresponding to one task specified by the user, and calculates the values of the compatibility index and accuracy index specified by the user for the models. Then, the analysis unit 125 embeds each model in the evaluation index space based on the values of the compatibility index and accuracy index of each model. As a result, display example 60 is obtained.
- the analysis unit 125 draws line segments L1 to L5 in which the two evaluation indicators are at the same level on the evaluation index space based on the above-mentioned aggregated evaluation value, and creates a display example 61.
- the analysis unit 125 sets the value of the weighted sum S to a predetermined value S1, and draws a line segment L1 on the evaluation index space. Similarly, the analysis unit 125 sets the value of the weighted sum S to S2, S3, . .. .. and draw line segments L2 to L5 on the evaluation index space. Furthermore, the analysis unit 125 distinguishes and displays the areas A1 to A5 defined by the line segments L1 to L5 using different colors or the like.
- the importance level (w 1 /w 2 ) specified by the user and the aggregate evaluation value S of multiple evaluation indicators are fixed, and the values of the accuracy index and compatibility index are changed. shows the position of the model on the evaluation index space when Therefore, for example, if there are two models M1 and M2 on line segment L1, they satisfy the ratio of importance of accuracy index and compatibility index specified by the user, and have a comprehensive evaluation regarding multiple evaluation indexes.
- the models have the same aggregated evaluation value S, and can be considered to be models at the same level in terms of the degree of importance specified by the user.
- This also applies to the other line segments L2 to L5. That is, the line segments L1 to L5 can be considered to be contour lines indicating the positions of models that satisfy the degree of importance specified by the user and have the same overall evaluation on the evaluation index space.
- the area A2 defined by the line segments L1 and L2 on the evaluation index space can be considered as an area indicating the position of a model that almost satisfies the degree of importance specified by the user and has almost the same level of performance.
- This also applies to the other areas A1, A3 to A5. Therefore, the user can know that the plurality of models belonging to the same area in the display example 61 are models at approximately the same level in terms of the degree of importance specified by the user. For example, the user can recognize that models h1 and h2 belonging to area A2 are at approximately the same level, and models h3 and h4 belonging to area A3 are at approximately the same level.
- the user can easily visually select models that are at the same level in terms of importance for the evaluation index that he or she has specified. It becomes possible to understand.
- the user can create a model that can successfully adjust the two conflicting evaluation metrics and show appropriate performance. can be found.
- FIG. 9 is a flowchart showing model analysis processing according to the second embodiment.
- the model analysis process is a process of displaying a plurality of models corresponding to the task selected by the user on the evaluation index space according to the importance of the evaluation index specified by the user. This processing is realized by the processor 112 shown in FIG. 2 executing a prepared program and mainly operating as the model training section 122 and analysis section 125 shown in FIG. 3.
- the analysis unit 125 obtains a task by the user, a plurality of evaluation indicators, and the importance of these evaluation indicators (step S10).
- FIG. 8 is an example in which the user specifies a certain task and specifies an accuracy index and a compatibility index as evaluation indexes.
- the analysis unit 125 obtains a plurality of candidate models corresponding to the task specified by the user (step S11). In the example of FIG. 8, the analysis unit 125 has acquired models h1 to h5. Next, the analysis unit 125 calculates the evaluation index value for each model and embeds it in the evaluation index space (step S22). In the example of FIG. 8, the analysis unit 125 calculates the accuracy index and compatibility index for the models h1 to h5, and embeds each model h1 to h5 in the evaluation index space as shown in the display example 60.
- the analysis unit 125 draws contour lines L1 to L5 using the degree of importance specified by the user and the value of each evaluation index.
- the analysis unit 125 fixes the importance ratio (w 1 /w 2 ) of each evaluation index specified by the user in the above equation (2), and changes the value of the weighted sum S by a predetermined width.
- the contour lines L1 to L5 are drawn by changing the accuracy index and the compatibility index while changing the .
- the analysis unit 125 colors the regions A1 to A5 defined by the contour lines L1 to L5 using different colors, and draws regions of the model that can be considered to be at the same level (step S23). Then, the process ends.
- a plurality of models corresponding to a task specified by the user are displayed in the evaluation index space based on a plurality of evaluation indicators specified by the user and their importance levels. be done. Further, based on the evaluation index specified by the user and its importance, regions of models that can be considered to be of the same level are displayed on the evaluation index space. Therefore, the user can easily know models that can be considered to be at the same level in the case of the level of importance specified by the user, for example, models that can be used instead.
- Modified example (Modification 1)
- the analysis unit 125 aggregates two evaluation indicators using a linear function indicating a weighted sum, and draws contour lines on the evaluation indicator space.
- the analysis unit 125 may aggregate the two evaluation indicators using another linear function or nonlinear function, and draw contour lines on the evaluation indicator space.
- the analysis unit 125 ranks and displays a list of multiple models corresponding to the task specified by the user. Instead, the analysis unit 125 may display any plurality of models specified by the user on the evaluation index space, regardless of the identity of the tasks.
- the analysis unit 125 may acquire the evaluation index of each model from the outside.
- the model generation device may be configured by a server and a terminal device as shown in FIG. 7, similarly to the fifth modification of the first embodiment.
- FIG. 10 is a block diagram showing the functional configuration of a model analysis device 70 according to the third embodiment.
- the model analysis device 70 includes an index acquisition means 71, an importance degree acquisition means 72, an index value acquisition means 73, and an analysis means 74.
- FIG. 11 is a flowchart of processing by the model analysis device 70 of the third embodiment.
- the index acquisition means 71 acquires designations of a plurality of evaluation indexes regarding the model (step S71).
- the importance obtaining unit 72 obtains the importance for a plurality of evaluation indicators (step S72).
- the index value acquisition means 73 acquires the values of a plurality of evaluation indexes for a plurality of models (step S73).
- the analysis means 74 analyzes the ranking of the plurality of models based on the obtained evaluation index value and importance level (step S74).
- model analysis device 70 of the third embodiment it is possible to evaluate models and select an appropriate model by considering a plurality of evaluation indicators.
- a model analysis device comprising:
- the analysis means aggregates the values of the plurality of evaluation indicators based on the degree of importance, calculates an aggregate evaluation value for each model, and outputs information in which the plurality of models are ranked according to the aggregate evaluation value.
- Appendix 8 obtain multiple evaluation metric specifications for the model; Obtaining the importance of the plurality of evaluation indicators, obtaining values of the plurality of evaluation indicators for the plurality of models; A recording medium that records a program that causes a computer to execute a process of analyzing rankings of the plurality of models based on the obtained evaluation index values and degrees of importance.
- Model generation device 112 Processor 121 Training data DB 122 Model training department 123 Model DB 124 Evaluation data DB 125 Analysis Department
Abstract
Provided is a model analysis device wherein an index acquisition means acquires designation of a plurality of evaluation indexes relating to a model. An importance acquisition means acquires degrees of importance for the plurality of evaluation indexes. An index value acquisition means acquires the values of the plurality of evaluation indexes for a plurality of models. An analysis means analyzes the ranking of the plurality of models on the basis of the acquired evaluation index values and degrees of importance.
Description
本開示は、機械学習モデルの分析に関する。
This disclosure relates to analysis of machine learning models.
近年、様々な分野において、機械学習により得られた予測モデルが利用されている。特許文献1は、半導体製造に関連するプロセスを学習及び/最適化するシステムに関し、候補プロセスモデルを品質値や多様性値に基づいて順位付けする手法を記載している。
In recent years, predictive models obtained through machine learning have been used in various fields. Patent Document 1 relates to a system for learning and/or optimizing processes related to semiconductor manufacturing, and describes a method for ranking candidate process models based on quality values and diversity values.
機械学習に用いる予測モデルを選択する際には、予測モデルを適用するタスクに応じて複数の評価指標を比較考量して予測モデルを評価し、適切な予測モデルを選択することが望まれる。
When selecting a predictive model to be used for machine learning, it is desirable to evaluate the predictive model by comparing and considering multiple evaluation indicators depending on the task to which the predictive model is applied, and select an appropriate predictive model.
本開示の1つの目的は、複数の評価指標を考慮してモデルの評価や適切なモデルの選択を行うことにある。
One purpose of the present disclosure is to evaluate models and select an appropriate model by considering multiple evaluation indicators.
本開示の一つの観点では、モデル分析装置は、
モデルに関する複数の評価指標の指定を取得する指標取得手段と、
前記複数の評価指標に対する重要度を取得する重要度取得手段と、
前記複数のモデルについて、前記複数の評価指標の値を取得する指標値取得手段と、
取得した評価指標の値と、重要度とに基づいて、前記複数のモデルの順位を分析する分析手段と、
を備える。 In one aspect of the present disclosure, the model analysis device includes:
an index acquisition means for acquiring designations of a plurality of evaluation indexes regarding the model;
Importance degree acquisition means for acquiring importance degrees for the plurality of evaluation indicators;
index value acquisition means for acquiring values of the plurality of evaluation indicators for the plurality of models;
an analysis means for analyzing the ranking of the plurality of models based on the obtained evaluation index value and importance;
Equipped with
本開示の他の観点では、モデル分析方法は、
モデルに関する複数の評価指標の指定を取得し、
前記複数の評価指標に対する重要度を取得し、
前記複数のモデルについて、前記複数の評価指標の値を取得し、
取得した評価指標の値と、重要度とに基づいて、前記複数のモデルの順位を分析する。 In other aspects of the disclosure, the model analysis method includes:
obtain multiple evaluation metric specifications for the model;
Obtaining the importance of the plurality of evaluation indicators,
obtaining values of the plurality of evaluation indicators for the plurality of models;
The ranking of the plurality of models is analyzed based on the obtained evaluation index value and importance level.
本開示のさらに他の観点では、記録媒体は、
モデルに関する複数の評価指標の指定を取得し、
前記複数の評価指標に対する重要度を取得し、
前記複数のモデルについて、前記複数の評価指標の値を取得し、
取得した評価指標の値と、重要度とに基づいて、前記複数のモデルの順位を分析する処理をコンピュータに実行させるプログラムを記録する。 In yet another aspect of the present disclosure, the recording medium includes:
obtain multiple evaluation metric specifications for the model;
Obtaining the importance of the plurality of evaluation indicators,
obtaining values of the plurality of evaluation indicators for the plurality of models;
A program is recorded that causes a computer to execute a process of analyzing the rankings of the plurality of models based on the obtained evaluation index values and degrees of importance.
本開示によれば、複数の評価指標を考慮してモデルの評価や適切なモデルの選択を行うことが可能となる。
According to the present disclosure, it is possible to evaluate models and select an appropriate model by considering multiple evaluation indicators.
以下、図面を参照して、本開示の好適な実施形態について説明する。
<第1実施形態>
[全体構成]
図1は、第1実施形態に係るモデル生成システムの全体構成を示すブロック図である。モデル生成システム1は、モデル生成装置100と、表示装置2と、入力装置3とを備える。モデル生成装置100は、本開示のモデル分析装置を適用したものであり、例えばパーソナルコンピュータ(PC)などのコンピュータにより構成される。表示装置2は、例えば液晶表示装置などであり、モデル生成装置100が生成した評価情報を表示する。入力装置3は、例えばマウス、キーボードなどであり、ユーザがモデルの修正時や評価情報の閲覧時に必要な指示、入力を行うために使用される。 Hereinafter, preferred embodiments of the present disclosure will be described with reference to the drawings.
<First embodiment>
[overall structure]
FIG. 1 is a block diagram showing the overall configuration of a model generation system according to a first embodiment. Themodel generation system 1 includes a model generation device 100, a display device 2, and an input device 3. The model generation device 100 is an application of the model analysis device of the present disclosure, and is configured by, for example, a computer such as a personal computer (PC). The display device 2 is, for example, a liquid crystal display device, and displays the evaluation information generated by the model generation device 100. The input device 3 is, for example, a mouse, a keyboard, etc., and is used by the user to give instructions and input necessary when modifying a model or viewing evaluation information.
<第1実施形態>
[全体構成]
図1は、第1実施形態に係るモデル生成システムの全体構成を示すブロック図である。モデル生成システム1は、モデル生成装置100と、表示装置2と、入力装置3とを備える。モデル生成装置100は、本開示のモデル分析装置を適用したものであり、例えばパーソナルコンピュータ(PC)などのコンピュータにより構成される。表示装置2は、例えば液晶表示装置などであり、モデル生成装置100が生成した評価情報を表示する。入力装置3は、例えばマウス、キーボードなどであり、ユーザがモデルの修正時や評価情報の閲覧時に必要な指示、入力を行うために使用される。 Hereinafter, preferred embodiments of the present disclosure will be described with reference to the drawings.
<First embodiment>
[overall structure]
FIG. 1 is a block diagram showing the overall configuration of a model generation system according to a first embodiment. The
まず、モデル生成システム1の動作を概略的に説明する。モデル生成装置100は、予め用意された訓練データを用いて、機械学習モデル(以下、単に「モデル」とも呼ぶ。)を生成する。また、モデル生成装置100は、生成したモデルの分析、評価を行う。具体的に、モデル生成装置100は、評価用データなどを用いてモデルによる予測を行い、予測結果に基づいてモデルを評価する。モデル生成装置100は、複数の評価指標を用いて複数のモデルを評価する。評価指標は、例えば、モデルの予測精度、互換性、公平性などの各種の指標を含む。なお、予測精度とは、モデルによる予測結果が正しい確率を示す。互換性とは、あるモデルと別のモデルの予測結果が一致する度合いを示す。また、公平性とは、異なる属性のデータに対するモデルの予測結果の差異の程度やばらつきの度合いを示す。そして、モデル生成装置100は、複数の評価指標との関係において複数のモデルを評価した結果を評価情報としてユーザに提示する。ユーザは、評価情報を確認し、複数のモデルから適切なモデルを選択したり、入力装置3を操作してモデルの修正のための修正情報を入力したりすることができる。
First, the operation of the model generation system 1 will be schematically explained. The model generation device 100 generates a machine learning model (hereinafter also simply referred to as a "model") using training data prepared in advance. The model generation device 100 also analyzes and evaluates the generated model. Specifically, the model generation device 100 performs prediction using a model using evaluation data and the like, and evaluates the model based on the prediction result. The model generation device 100 evaluates multiple models using multiple evaluation indicators. The evaluation index includes, for example, various indexes such as model prediction accuracy, compatibility, and fairness. Note that the prediction accuracy indicates the probability that the prediction result by the model is correct. Compatibility refers to the degree to which the prediction results of one model and another model agree. Furthermore, fairness refers to the degree of difference or dispersion of prediction results of a model for data with different attributes. Then, the model generation device 100 presents the results of evaluating the plurality of models in relation to the plurality of evaluation indicators to the user as evaluation information. The user can check the evaluation information, select an appropriate model from a plurality of models, or operate the input device 3 to input modification information for modifying the model.
なお、「機械学習モデル」とは、説明変数と目的変数の関係を表す情報である。機械学習モデルは、例えば、説明変数に基づいて目的とする変数を算出することにより推定対象の結果を推定するためのコンポーネントである。機械学習モデルは、既に目的変数の値が得られている学習用データと任意のパラメータとを入力として、学習アルゴリズムを実行することにより生成される。機械学習モデルは、例えば、入力xを正解yに写像する関数cにより表されてもよい。機械学習モデルは、推定対象の数値を推定するものであってもよいし、推定対象のラベルを推定するものであってもよい。機械学習モデルは、目的変数の確率分布を記述する変数を出力してもよい。機械学習モデルは、「学習モデル」、「分析モデル」、「AI(Artificial Intelligence)モデル」または「予測式」などと記載されることもある。また、説明変数とは機械学習モデルにおいて入力として用いられる変数である。説明変数は、「特徴量」または「特徴」などと記載されることがある。
Note that the "machine learning model" is information that represents the relationship between explanatory variables and objective variables. A machine learning model is, for example, a component for estimating a result to be estimated by calculating a target variable based on an explanatory variable. A machine learning model is generated by executing a learning algorithm using learning data for which the value of the target variable has already been obtained and arbitrary parameters as input. A machine learning model may be represented, for example, by a function c that maps an input x to a correct answer y. The machine learning model may be one that estimates a numerical value to be estimated, or may be one that estimates a label to be estimated. The machine learning model may output variables that describe the probability distribution of the target variable. A machine learning model is sometimes described as a "learning model," "analytical model," "AI (Artificial Intelligence) model," or "prediction formula." Furthermore, explanatory variables are variables used as input in a machine learning model. Explanatory variables are sometimes described as "features" or "features."
また、機械学習モデルを生成するための学習アルゴリズムは特に限定されず、既存の学習アルゴリズムでよい。例えば、学習アルゴリズムは、ランダムフォレスト、サポートベクターマシン、ナイーブベイズ、FAB推論(Factorized Asymptotic Bayesian Inference)を利用した区分線形モデル、またはニューラルネットワークであってよい。なお、FAB推論を利用した区分線形モデルの手法は、例えば米国公開特許US2014/0222741A1号公報等に開示されている。
Furthermore, the learning algorithm for generating the machine learning model is not particularly limited, and any existing learning algorithm may be used. For example, the learning algorithm may be a random forest, a support vector machine, a piecewise linear model using Naive Bayes, FAB inference (Factorized Asymmetric Bayesian Inference), or a neural network. Note that a piecewise linear model method using FAB inference is disclosed in, for example, US Patent Publication No. US2014/0222741A1.
[ハードウェア構成]
図2は、モデル生成装置100のハードウェア構成を示すブロック図である。図示のように、モデル生成装置100は、インタフェース(I/F)111と、プロセッサ112と、メモリ113と、記録媒体114と、データベース(DB)115と、を備える。 [Hardware configuration]
FIG. 2 is a block diagram showing the hardware configuration of themodel generation device 100. As illustrated, the model generation device 100 includes an interface (I/F) 111, a processor 112, a memory 113, a recording medium 114, and a database (DB) 115.
図2は、モデル生成装置100のハードウェア構成を示すブロック図である。図示のように、モデル生成装置100は、インタフェース(I/F)111と、プロセッサ112と、メモリ113と、記録媒体114と、データベース(DB)115と、を備える。 [Hardware configuration]
FIG. 2 is a block diagram showing the hardware configuration of the
I/F111は、外部装置との間でデータの入出力を行う。具体的に、モデルの生成に使用する訓練データ、評価用データ、及び、ユーザが入力装置3を用いて入力した指示や入力は、I/F111を通じてモデル生成装置100に入力される。また、モデル生成装置100が生成したモデルの評価情報は、I/F111を通じて表示装置2へ出力される。
The I/F 111 inputs and outputs data to and from external devices. Specifically, training data, evaluation data, and instructions and inputs input by the user using the input device 3 are input to the model generation device 100 through the I/F 111. Furthermore, evaluation information of the model generated by the model generation device 100 is output to the display device 2 through the I/F 111.
プロセッサ112は、CPU(Central Processing Unit)などのコンピュータであり、予め用意されたプログラムを実行することによりモデル生成装置100の全体を制御する。なお、プロセッサ112は、GPU(Graphics Processing Unit)、TPU(Tensor Processing Unit)、量子プロセッサまたはFPGA(Field-Programmable Gate Array)であってもよい。プロセッサ112は、後述するモデル分析処理を実行する。
The processor 112 is a computer such as a CPU (Central Processing Unit), and controls the entire model generation device 100 by executing a program prepared in advance. Note that the processor 112 may be a GPU (Graphics Processing Unit), a TPU (Tensor Processing Unit), a quantum processor, or an FPGA (Field-Programmable Gate Array). The processor 112 executes model analysis processing, which will be described later.
メモリ113は、ROM(Read Only Memory)、RAM(Random Access Memory)などにより構成される。メモリ113は、プロセッサ112による各種の処理の実行中に作業メモリとしても使用される。
The memory 113 is composed of ROM (Read Only Memory), RAM (Random Access Memory), and the like. Memory 113 is also used as a working memory while processor 112 executes various processes.
記録媒体114は、ディスク状記録媒体、半導体メモリなどの不揮発性で非一時的な記録媒体であり、モデル生成装置100に対して着脱可能に構成される。記録媒体114は、プロセッサ112が実行する各種のプログラムを記録している。モデル生成装置100が各種の処理を実行する際には、記録媒体114に記録されているプログラムがメモリ113にロードされ、プロセッサ112により実行される。
The recording medium 114 is a non-volatile, non-temporary recording medium such as a disk-shaped recording medium or a semiconductor memory, and is configured to be detachable from the model generation device 100. The recording medium 114 records various programs executed by the processor 112. When the model generation device 100 executes various processes, a program recorded on the recording medium 114 is loaded into the memory 113 and executed by the processor 112.
DB115は、モデル生成装置100が生成したモデル(以下、「既存モデル」と呼ぶ。)、及び、再訓練による修正後のモデル(以下、「修正後モデル」と呼ぶ。)に関する情報を記憶する。また、DB115は、必要に応じて、I/F111を通じて入力された訓練データ、評価用データ、ユーザが入力した修正情報などを記憶する。
The DB 115 stores information regarding the model generated by the model generation device 100 (hereinafter referred to as "existing model") and the model after modification by retraining (hereinafter referred to as "modified model"). Further, the DB 115 stores training data input through the I/F 111, evaluation data, correction information input by the user, and the like, as necessary.
[機能構成]
図3は、第1実施形態のモデル生成装置100の機能構成を示すブロック図である。モデル生成装置100は、機能的には、訓練データDB121と、モデル訓練部122と、モデルDB123と、評価用データDB124と、分析部125と、を備える。 [Functional configuration]
FIG. 3 is a block diagram showing the functional configuration of themodel generation device 100 of the first embodiment. The model generation device 100 functionally includes a training data DB 121, a model training section 122, a model DB 123, an evaluation data DB 124, and an analysis section 125.
図3は、第1実施形態のモデル生成装置100の機能構成を示すブロック図である。モデル生成装置100は、機能的には、訓練データDB121と、モデル訓練部122と、モデルDB123と、評価用データDB124と、分析部125と、を備える。 [Functional configuration]
FIG. 3 is a block diagram showing the functional configuration of the
訓練データDB121は、モデルの生成に用いられる訓練データを記憶する。訓練データD1は、モデル訓練部122に入力される。なお、訓練データD1は、入力データと、その入力データに対する正解(正解値又は正解ラベル)との複数の組み合わせにより構成される。
The training data DB 121 stores training data used for model generation. Training data D1 is input to model training section 122. Note that the training data D1 is composed of a plurality of combinations of input data and correct answers (correct values or correct labels) for the input data.
モデル訓練部122は、訓練データD1を用いてモデルの訓練を行い、モデルを生成する。モデル訓練部122は、生成したモデルに対応するモデルデータMをモデルDB123及び分析部125へ出力する。なお、モデルデータMは、モデルを構成する複数のパラメータ情報を含む。パラメータ情報は、例えば、モデルの入力として用いられる説明変数の情報、各説明変数に対する重みの情報、入力データを構成する各サンプルに対する重みの情報などを含む。
The model training unit 122 trains a model using the training data D1 and generates a model. The model training unit 122 outputs model data M corresponding to the generated model to the model DB 123 and the analysis unit 125. Note that the model data M includes a plurality of parameter information constituting the model. The parameter information includes, for example, information on explanatory variables used as model inputs, information on weights for each explanatory variable, information on weights for each sample forming input data, and the like.
モデルDB123は、タスク毎に複数のモデルを記憶する。「タスク」とは、機械学習モデルにおいて、問題や質問、および利用可能なデータに基づいて行われる予測または推論の種類を指す。タスクには、分類タスク、回帰タスク、クラスター化タスク、物体認識タスクなど、各種のものが含まれる。例えば、分類タスクとは、データをカテゴリに割り当てることをいう。回帰タスクとは、ある目的変数の値を、別の説明変数の値に基づいて予測することをいう。クラスター化タスクとは、類似性に従ってデータをグループ化することをいう。物体認識タスクとは、画像中の物体を検出し、その位置及びクラスを出力することをいう。モデルDB123には、各タスクについて複数のモデルが記憶されている。なお、あるタスクに対応する複数のモデルは、異なるアルゴリズムを用いるものであってもよく、異なるデータに対して同一のアルゴリズムを用いて得られた異なるモデルであってもよく、設定値(例えばハイパーパラメータ)の違う同一のアルゴリズムで得られた異なるモデルであってもよい。
The model DB 123 stores multiple models for each task. In a machine learning model, a "task" refers to a problem or question and the type of prediction or inference that is made based on the available data. Tasks include various tasks such as classification tasks, regression tasks, clustering tasks, and object recognition tasks. For example, a classification task refers to assigning data to categories. A regression task refers to predicting the value of a certain objective variable based on the value of another explanatory variable. A clustering task refers to grouping data according to similarities. The object recognition task refers to detecting an object in an image and outputting its position and class. The model DB 123 stores a plurality of models for each task. Note that multiple models corresponding to a certain task may use different algorithms, or may be different models obtained using the same algorithm on different data, and may have different settings (for example, hyper They may be different models obtained by the same algorithm with different parameters).
モデル訓練部122は、既存モデルを再訓練して修正後モデルを生成する。この場合、モデル訓練部122は、ユーザが入力装置3を用いて入力した修正情報D3に基づいて、モデルを構成するパラメータを修正し、必要に応じて再訓練用の訓練データを用いてモデルの再訓練を行う。モデル訓練部122は、再訓練により得られた修正後モデルのモデルデータMをモデルDB123へ記憶するとともに、分析部125へ出力する。
The model training unit 122 retrains the existing model to generate a modified model. In this case, the model training unit 122 corrects the parameters constituting the model based on the correction information D3 input by the user using the input device 3, and uses training data for retraining as necessary to improve the model. Perform retraining. The model training unit 122 stores model data M of the corrected model obtained through retraining in the model DB 123 and outputs it to the analysis unit 125.
また、モデル訓練部122がモデルを再訓練する方法は特に限定されない。例えば、モデル訓練部122は、既存モデルを無視して完全に新しい修正後モデルを訓練しなおす方法、および、新たな訓練データを利用して、既存モデルを更新する方法を用いてもよい。他にも、モデル訓練部122が、既存モデルを再訓練する方法としては、モデルに用いる説明変数の種類を変えずに、再訓練によって係数のみ更新する方法、および、説明変数の選択も含めて再訓練する方法等がある。
Furthermore, the method by which the model training unit 122 retrains the model is not particularly limited. For example, the model training unit 122 may use a method of ignoring the existing model and retraining a completely new modified model, or a method of updating the existing model using new training data. Other methods for the model training unit 122 to retrain an existing model include a method of updating only the coefficients through retraining without changing the types of explanatory variables used in the model, and a method of selecting explanatory variables. There are ways to retrain.
評価用データDB124は、生成されたモデルの評価に使用する評価用データを記憶する。評価用データは、例えば収集されたデータのうち、訓練データとして使用しなかった一部のデータや、新たに収集されたデータ、検証のために用意されたバリデーションデータなどである。なお、訓練データを評価用データとして使用してもよい。評価用データは、入力データと、その入力データに対する正解(正解値又は正解ラベル)との複数の組み合わせにより構成される。
The evaluation data DB 124 stores evaluation data used to evaluate the generated model. The evaluation data includes, for example, part of the collected data that was not used as training data, newly collected data, validation data prepared for verification, and the like. Note that training data may be used as evaluation data. The evaluation data is composed of a plurality of combinations of input data and correct answers (correct values or correct labels) for the input data.
分析部125は、評価用データを用いて、複数のモデルの性能を分析する。具体的に、分析部125は、ユーザが選択したタスクに対応する複数のモデルをモデルDB123から取得し、評価用データを用いて各モデルの評価指標を算出する。以下の説明では、分析部125は、ユーザが指定した複数の評価指標として、各モデルについて精度指標及び互換性指標を算出するものとする。そして、分析部125は、各モデルを、精度指標及び互換性指標との関係において評価し、その結果を評価情報D2として表示装置2へ出力する。分析部125は、指標取得手段、重要度取得手段、指標値取得手段、及び、分析手段の一例である。
The analysis unit 125 analyzes the performance of multiple models using the evaluation data. Specifically, the analysis unit 125 acquires a plurality of models corresponding to the task selected by the user from the model DB 123, and calculates an evaluation index for each model using evaluation data. In the following description, it is assumed that the analysis unit 125 calculates an accuracy index and a compatibility index for each model as a plurality of evaluation indexes specified by the user. The analysis unit 125 then evaluates each model in relation to the accuracy index and the compatibility index, and outputs the results to the display device 2 as evaluation information D2. The analysis unit 125 is an example of an index acquisition means, an importance degree acquisition means, an index value acquisition means, and an analysis means.
表示装置2は、分析部125が出力した評価情報D2を表示装置2に表示する。ユーザは、表示された評価情報を見ることにより、複数のモデルを精度指標及び互換性指標の観点で評価することができる。
The display device 2 displays the evaluation information D2 output by the analysis section 125 on the display device 2. By viewing the displayed evaluation information, the user can evaluate multiple models in terms of accuracy index and compatibility index.
また、ユーザは、必要に応じて、現行モデルを修正するための修正情報D3を入力装置3に入力する。修正情報D3は、例えば、モデルの入力として用いられる説明変数の情報、各説明変数に対する重みの情報、説明変数のカテゴリの属性毎に設定される重みの情報、入力データを構成する各サンプルに対する重みの情報などの修正に関する情報である。モデル訓練部122は、入力された修正情報D3を用いてモデルの再訓練を行うことにより、モデルの修正を行う。
Additionally, the user inputs modification information D3 for modifying the current model into the input device 3, if necessary. The modification information D3 includes, for example, information on explanatory variables used as model inputs, information on weights for each explanatory variable, information on weights set for each attribute of the category of explanatory variables, and weights for each sample constituting input data. This is information related to corrections such as information. The model training unit 122 corrects the model by retraining the model using the input correction information D3.
[評価情報の表示例]
第1実施形態では、分析部125は、複数の評価指標に対してユーザが指定した重要度に基づいて、ある1つのタスクに対応する複数のモデルを順位付けして表示する。 [Display example of evaluation information]
In the first embodiment, theanalysis unit 125 ranks and displays a plurality of models corresponding to one task based on the degree of importance specified by the user for a plurality of evaluation indicators.
第1実施形態では、分析部125は、複数の評価指標に対してユーザが指定した重要度に基づいて、ある1つのタスクに対応する複数のモデルを順位付けして表示する。 [Display example of evaluation information]
In the first embodiment, the
図4は、第1実施形態による評価情報の表示例を示す。図4の表示例40は、モデルリスト41と、スライドバー42とを備える。モデルリスト41は、複数のモデルをリスト表示したものであり、候補モデル、精度指標及び互換性指標を含む。「候補モデル」は、1つのタスクに対応する複数のモデルを示す。図4の例では、ある1つのタスクに対応する4つの候補モデルh1~h4が表示されている。
FIG. 4 shows a display example of evaluation information according to the first embodiment. The display example 40 in FIG. 4 includes a model list 41 and a slide bar 42. The model list 41 is a list of multiple models, and includes candidate models, accuracy indicators, and compatibility indicators. "Candidate model" indicates multiple models corresponding to one task. In the example of FIG. 4, four candidate models h1 to h4 corresponding to one task are displayed.
「精度指標」は、各候補モデルの精度を示す指標である。基本的に、精度指標はモデルの出力が正しい確率を示す。例えば、回帰タスクの場合、精度指標としては、R2(決定係数)、RMSE(Root Means Square Error)、MAE(Mean Absolute Error)などを用いることができる。但し、値が小さいほど精度が良いことを示す指標については、「-1」を掛けるなどして、値が大きいほど精度が良いことを示す指標として使用すればよい。具体的に、RMSEやMSEについては、「-1」を掛けた値を指標として使用すればよい。分類タスクの場合、精度指標としては、正解率(Accuracy)、適合率(Precision)、再現率(Recall)、F値(F1-score)、AUC(Area under the ROC curve)などを用いることができる。「互換性指標」は、複数のモデル間の互換性を示すものであり、具体的には、あるモデルh0が正解したデータを別のモデルhxがどの程度正解できたかにより示される。
The "accuracy index" is an index indicating the accuracy of each candidate model. Essentially, accuracy metrics indicate the probability that a model's output is correct. For example, in the case of a regression task, R2 (coefficient of determination), RMSE (Root Means Square Error), MAE (Mean Absolute Error), etc. can be used as accuracy indicators. However, for an index indicating that the smaller the value, the better the accuracy, it may be used as an index indicating that the larger the value, the better the accuracy, by multiplying it by "-1" or the like. Specifically, for RMSE and MSE, a value multiplied by "-1" may be used as an index. In the case of classification tasks, accuracy indicators such as accuracy, precision, recall, F1-score, and AUC (Area under the ROC curve) can be used. . The "compatibility index" indicates the compatibility between a plurality of models, and specifically, it is indicated by the degree to which another model hx was able to correctly answer data that was answered correctly by a certain model h0.
また、図4において、分析部125は、評価指標として「互換性指標」と「精度指標」とを用いている。しかし、分析部125が用いる評価指標はこれらに限定されず、任意の評価指標を利用することができる。例えば、分析125は「公平性指標」を評価指標としてモデルの性能を分析してもよい。
Furthermore, in FIG. 4, the analysis unit 125 uses a "compatibility index" and an "accuracy index" as evaluation indexes. However, the evaluation index used by the analysis unit 125 is not limited to these, and any evaluation index can be used. For example, the analysis 125 may analyze the performance of the model using a "fairness index" as an evaluation index.
スライドバー42は、精度指標と互換性指標の重要度(重み)の割合を指定するためのバーであり、ユーザにより操作される。具体的に、カーソル42aがスライドバー42の左端にある場合、精度指標の重要度は100%、互換性指標の重要度は0%となる。一方、カーソル42aがスライドバー42の右端にある場合、精度指標の重要度は0%、互換性指標の重要度は100%となる。また、カーソル42aがスライドバー42の中央にある場合、精度指標の重要度は50%、互換性指標の重要度は50%となる。ユーザは、スライドバー42におけるカーソル42aの位置を指定することにより、精度指標と互換性指標のどちらをどれぐらい重要視するかを指定することができる。
The slide bar 42 is a bar for specifying the ratio of importance (weight) between the accuracy index and the compatibility index, and is operated by the user. Specifically, when the cursor 42a is at the left end of the slide bar 42, the importance of the accuracy index is 100% and the importance of the compatibility index is 0%. On the other hand, when the cursor 42a is at the right end of the slide bar 42, the importance of the accuracy index is 0% and the importance of the compatibility index is 100%. Furthermore, when the cursor 42a is located at the center of the slide bar 42, the importance of the accuracy index is 50% and the importance of the compatibility index is 50%. By specifying the position of the cursor 42a on the slide bar 42, the user can specify how much importance is placed on either the accuracy index or the compatibility index.
いま、図4において、カーソル42aの位置が、精度指標の重要度=80%、互換性指標の重要度=20%に対応すると仮定する。分析部125は、まず、候補モデルh1~h4のそれぞれについて、評価用データなどを用いて精度指標の値と互換性指標の値を算出する。なお、精度指標は値が大きいほど精度が高く、互換性指標は値が大きいほど互換性が高いものとする。
Now, in FIG. 4, it is assumed that the position of the cursor 42a corresponds to the importance of the accuracy index = 80% and the importance of the compatibility index = 20%. The analysis unit 125 first calculates the accuracy index value and compatibility index value for each of the candidate models h1 to h4 using evaluation data and the like. Note that the larger the value of the accuracy index, the higher the accuracy, and the larger the value of the compatibility index, the higher the compatibility.
次に、分析部125は、ユーザが指定した重要度の比を用いて、評価指標を集約した値(以下、「集約評価値」とも呼ぶ。)を用いて、候補モデルを順位付けする。この集約評価値は、ユーザが指定した重要度に基づき、複数の評価指標に関する総合的な評価を示す値となる。よって、集約評価値を用いて複数の候補モデルを順位付けすることにより、ユーザは、自身が指定した重要度の条件下で適切な候補モデルを選択することが可能となる。
Next, the analysis unit 125 ranks the candidate models using a value obtained by aggregating evaluation indicators (hereinafter also referred to as an "aggregated evaluation value") using the importance ratio specified by the user. This aggregated evaluation value is a value indicating a comprehensive evaluation regarding a plurality of evaluation indicators based on the degree of importance specified by the user. Therefore, by ranking a plurality of candidate models using the aggregated evaluation value, the user can select an appropriate candidate model under the conditions of the degree of importance specified by the user.
好適な例では、分析部125は、線形関数を用いて評価指標を集約し、集約評価値として重み付け和を用いる。この場合、分析部125は、ユーザが指定した精度指標と互換性指標の重要度の比(80%:20%=4:1)を重みとして用いて、各候補モデルの精度指標の値と互換性指標の値の重み付け和を算出する。例えば、分析部125は、各候補モデルについて重み付け和Sを以下のように算出する。
S=4×(精度指標)+1×(互換性指標) (1) In a preferred example, theanalysis unit 125 aggregates the evaluation indicators using a linear function, and uses a weighted sum as the aggregated evaluation value. In this case, the analysis unit 125 uses the ratio of the importance of the accuracy index and compatibility index specified by the user (80%:20%=4:1) as a weight to determine whether the accuracy index value of each candidate model is compatible with the Calculate the weighted sum of the gender index values. For example, the analysis unit 125 calculates the weighted sum S for each candidate model as follows.
S=4×(accuracy index)+1×(compatibility index) (1)
S=4×(精度指標)+1×(互換性指標) (1) In a preferred example, the
S=4×(accuracy index)+1×(compatibility index) (1)
分析部125は、上記の式(1)により全ての候補モデルh1~h4について重み付け和を算出し、候補モデルを重み付け和Sの大きい順に順位付けし、リスト表示する。これにより、図4の例では、ユーザは、自身が指定した精度指標と互換性指標の重要度の比(80%:20%)においては、モデルh3が最も適切であることがわかる。
The analysis unit 125 calculates a weighted sum for all candidate models h1 to h4 using the above equation (1), ranks the candidate models in descending order of the weighted sum S, and displays a list. Accordingly, in the example of FIG. 4, the user understands that the model h3 is the most appropriate in terms of the ratio of importance between the accuracy index and the compatibility index (80%:20%) specified by the user.
このように、分析部125は、ユーザが指定した重要度を用いて精度指標と互換性指標を集約した集約評価値に従って、複数の候補モデルをリスト表示する。よって、ユーザは、自分が指定した重要度において、どの候補モデルを使用すべきかを容易に知ることができる。
In this way, the analysis unit 125 displays a list of multiple candidate models according to the aggregated evaluation value obtained by aggregating the accuracy index and the compatibility index using the degree of importance specified by the user. Therefore, the user can easily know which candidate model should be used based on the level of importance specified by the user.
図5は、第1実施形態による評価情報の他の表示例を示す。この例も、ある1つのタスクに対応する複数のモデルについて、精度指標と互換性指標を示す。但し、図4の例ではスライドバー42を用いてユーザが重要度を指定するのに対し、図5の例では棒グラフによりユーザが重要度を指定する。図5の表示例50は、モデルリスト51と、棒グラフ52とを備える。モデルリスト41は、第1例と同様に複数のモデルをリスト表示したものである。但し、図5の例では、ユーザが選択した2つの精度指標及び2つの互換性指標が用いられている。なお、互換性指標については、例えば、互換性指標1は、新旧2つのモデルがある場合に、互換性指標1は旧モデルが正解したデータを新モデルも正解した割合とすることができる。また、互換性指標2は、新旧2つのモデルがある場合に、新モデルが不正解であったデータを旧モデルも不正解であった割合とすることができる。
FIG. 5 shows another display example of evaluation information according to the first embodiment. This example also shows accuracy indicators and compatibility indicators for multiple models corresponding to one task. However, in the example of FIG. 4, the user specifies the degree of importance using the slide bar 42, whereas in the example of FIG. 5, the user specifies the degree of importance using a bar graph. The display example 50 in FIG. 5 includes a model list 51 and a bar graph 52. The model list 41 is a list display of a plurality of models, similar to the first example. However, in the example of FIG. 5, two accuracy indicators and two compatibility indicators selected by the user are used. As for the compatibility index, for example, when there are two models, a new model and an old model, the compatibility index 1 can be the ratio of the data that the old model answered correctly to the data that the new model also answered correctly. Furthermore, when there are two models, a new model and an old model, the compatibility index 2 can be the ratio of data for which the new model was incorrect to that for which the old model was also incorrect.
棒グラフ52は、評価指標毎にバー52aを備える。ユーザは、カーソルCなどを用いて、各評価指標に対応するバー52aの長さを変えることにより、その評価指標に対する重要度を変えることができる。図5の例では、ユーザはカーソルCにより、精度指標1の重要度を変更している。なお、表示例50上の表示領域との関係でバー52aを延ばす余地が無くなった場合、ユーザは、再規格化ボタン52bを押すことにより、複数の評価指標間の重要度の比を変えずに、表示例50における各バー52aの長さを表示領域内に収めることができる。また、図5に示すように、各バー52aの下に、全体(4つのバーの合計)に対する各バー52aの長さの割合を表示することで、ユーザは各評価指標に対する重要度の比を細かく調整できるようになる。
The bar graph 52 includes a bar 52a for each evaluation index. The user can change the importance of each evaluation index by changing the length of the bar 52a corresponding to each evaluation index using the cursor C or the like. In the example of FIG. 5, the user uses cursor C to change the importance of accuracy index 1. Note that if there is no room to extend the bar 52a due to the relationship with the display area on the display example 50, the user can press the renormalization button 52b to extend the bar 52a without changing the importance ratio between the multiple evaluation indicators. , the length of each bar 52a in display example 50 can be accommodated within the display area. Furthermore, as shown in FIG. 5, by displaying the ratio of the length of each bar 52a to the whole (total of four bars) under each bar 52a, the user can understand the ratio of importance to each evaluation index. You will be able to make fine adjustments.
分析部125による複数の候補モデルの順位付けの方法は、第1例と同様である。即ち、分析部125は、ユーザの指定した重要度の比を用い、集約評価値として各評価指標(本例では、精度指標1、精度指標2、互換性指標1、互換性指標2)の重み付け和Sを算出し、その順に複数の候補モデルをモデルリスト51に表示する。この例においても、ユーザは、自分が指定した重要度の比において、どの候補モデルが最適であるかを容易に知ることができる。
The method of ranking multiple candidate models by the analysis unit 125 is the same as in the first example. That is, the analysis unit 125 weights each evaluation index (in this example, accuracy index 1, accuracy index 2, compatibility index 1, and compatibility index 2) as an aggregate evaluation value using the ratio of importance specified by the user. The sum S is calculated, and a plurality of candidate models are displayed in the model list 51 in that order. In this example as well, the user can easily know which candidate model is optimal in terms of the importance ratio specified by the user.
[モデル分析処理]
図6は、第1実施形態によるモデル分析処理を示すフローチャートである。モデル分析処理は、ユーザが指定したタスクに対応する複数のモデルを、ユーザが指定した評価指標の重要度に応じて順位付けして表示する処理である。この処理は、図2に示すプロセッサ112が予め用意されたプログラムを実行し、主として図3に示すモデル訓練部122及び分析部125として動作することにより実現される。 [Model analysis processing]
FIG. 6 is a flowchart showing model analysis processing according to the first embodiment. The model analysis process is a process in which a plurality of models corresponding to a task specified by the user are ranked and displayed according to the importance of the evaluation index specified by the user. This processing is realized by theprocessor 112 shown in FIG. 2 executing a program prepared in advance and mainly operating as the model training section 122 and analysis section 125 shown in FIG. 3.
図6は、第1実施形態によるモデル分析処理を示すフローチャートである。モデル分析処理は、ユーザが指定したタスクに対応する複数のモデルを、ユーザが指定した評価指標の重要度に応じて順位付けして表示する処理である。この処理は、図2に示すプロセッサ112が予め用意されたプログラムを実行し、主として図3に示すモデル訓練部122及び分析部125として動作することにより実現される。 [Model analysis processing]
FIG. 6 is a flowchart showing model analysis processing according to the first embodiment. The model analysis process is a process in which a plurality of models corresponding to a task specified by the user are ranked and displayed according to the importance of the evaluation index specified by the user. This processing is realized by the
まず、分析部125は、ユーザによるタスク及び評価指標の指定を取得する(ステップS10)。図4は、ユーザがあるタスクを指定し、評価指標として、ある精度指標とある互換性指標を指定した例である。図5は、ユーザがあるタスクを指定し、評価指標として、精度指標1、精度指標2、互換性指標1及び互換性指標2を指定した例である。
First, the analysis unit 125 obtains the user's designation of the task and evaluation index (step S10). FIG. 4 is an example in which the user specifies a certain task and specifies a certain accuracy index and a certain compatibility index as evaluation indices. FIG. 5 is an example in which the user specifies a certain task and specifies accuracy index 1, accuracy index 2, compatibility index 1, and compatibility index 2 as evaluation indexes.
次に、分析部125は、ユーザが指定したタスクに対応する複数の候補モデルを取得する(ステップS11)。図4及び図5の例では、分析部125は、候補モデルh1~h4を取得している。
Next, the analysis unit 125 obtains a plurality of candidate models corresponding to the task specified by the user (step S11). In the examples of FIGS. 4 and 5, the analysis unit 125 has acquired candidate models h1 to h4.
次に、分析部125は、複数の評価指標のうち、デフォルト表示として、1つの評価指標に基づいて表示順を決定し(ステップS12)、決定された表示順で複数の候補モデルのリストを表示する(ステップS13)。なお、この場合の1つの評価指標は、例えば複数の評価指標からユーザが指定した評価指標であってもよく、ユーザが最初に指定した評価指標を使用してもよい。これにより、デフォルト表示において、複数の候補モデルは、その1つの評価指標が高い順にリスト表示される。
Next, the analysis unit 125 determines the display order based on one evaluation index as a default display among the plurality of evaluation indexes (step S12), and displays a list of the plurality of candidate models in the determined display order. (Step S13). Note that one evaluation index in this case may be, for example, an evaluation index specified by the user from among a plurality of evaluation indicators, or an evaluation index specified by the user first may be used. As a result, in the default display, a plurality of candidate models are displayed in a list in descending order of one evaluation index.
次に、分析部125は、ユーザが重要度を変更したか否かを判定する(ステップS14)。具体的に、図4の例では、分析部125は、ユーザがスライドバー42のカーソル42aの位置を変更したか否かを判定する。また、図5の例では、分析部125は、ユーザがいずれかの評価指標のバー52aの長さを変更したかを判定する。ユーザが重要度を変更した場合(ステップS14:Yes)、分析部125は、変更後の重要度に基づいて前述の重み付け和Sを算出し、重み付け和Sの順に複数の候補モデルの表示順を決定する(ステップS15)。そして、分析部125は、決定された表示順でモデルリストを再表示する(ステップS13)。これにより、図4に示すモデルリスト41、又は、図5に示すモデルリスト51が表示される。
Next, the analysis unit 125 determines whether the user has changed the importance level (step S14). Specifically, in the example of FIG. 4, the analysis unit 125 determines whether the user has changed the position of the cursor 42a of the slide bar 42. Further, in the example of FIG. 5, the analysis unit 125 determines whether the user has changed the length of the bar 52a of any evaluation index. If the user changes the importance level (step S14: Yes), the analysis unit 125 calculates the above-mentioned weighted sum S based on the changed importance level, and displays the plurality of candidate models in the order of the weighted sum S. Determine (step S15). Then, the analysis unit 125 redisplays the model list in the determined display order (step S13). As a result, the model list 41 shown in FIG. 4 or the model list 51 shown in FIG. 5 is displayed.
一方、ユーザが重要度を変更しなかった場合(ステップS14:No)、分析部125は、ユーザにより終了指示が入力されたか否かを判定する(ステップS16)。終了指示が入力されていない場合(ステップS16:No)、処理はステップS14へ戻る。一方、終了指示が入力された場合(ステップS16:Yes)、処理は終了する。
On the other hand, if the user has not changed the importance level (step S14: No), the analysis unit 125 determines whether the user has input an end instruction (step S16). If the termination instruction has not been input (step S16: No), the process returns to step S14. On the other hand, if an end instruction is input (step S16: Yes), the process ends.
なお、上記のフローチャートでは、ステップS12において、デフォルト表示として、任意の1つの評価指標に基づいて複数の候補モデルの表示順を決定している。その代わりに、最初からユーザに重要度の入力を促し、入力された重要度に基づいて複数の候補モデルの表示順を決定して表示してもよい。
Note that in the above flowchart, in step S12, the display order of the plurality of candidate models is determined based on any one evaluation index as a default display. Instead, the user may be prompted to input the degree of importance from the beginning, and the display order of the plurality of candidate models may be determined and displayed based on the input degree of importance.
以上のように、第1実施形態のモデル分析処理では、ユーザが指定した複数の評価指標及びそれらの重要度に基づいて複数の評価指標についての集約評価値が算出され、集約評価値に基づいてユーザが指定したタスクに対応する複数の候補モデルが順位付けされて表示される。よって、ユーザは、自分が指定した重要度の場合に、最適な候補モデルを容易に知ることができる。
As described above, in the model analysis process of the first embodiment, an aggregate evaluation value for a plurality of evaluation indicators is calculated based on a plurality of evaluation indicators specified by the user and their importance, and an aggregate evaluation value is calculated based on the aggregate evaluation value. A plurality of candidate models corresponding to the task specified by the user are ranked and displayed. Therefore, the user can easily know the optimal candidate model for the level of importance specified by the user.
[変形例]
(変形例1)
上記のモデル分析処理では、分析部125は、重み付け和を示す線形関数を用いて複数の評価指標を集約しているが、その代わりに、他の線形関数又は非線形関数を用いて複数の評価指標を集約し、集約評価値を算出することとしてもよい。 [Modified example]
(Modification 1)
In the model analysis process described above, theanalysis unit 125 aggregates multiple evaluation indicators using a linear function indicating a weighted sum, but instead uses another linear function or a nonlinear function to aggregate multiple evaluation indicators. may be aggregated to calculate an aggregated evaluation value.
(変形例1)
上記のモデル分析処理では、分析部125は、重み付け和を示す線形関数を用いて複数の評価指標を集約しているが、その代わりに、他の線形関数又は非線形関数を用いて複数の評価指標を集約し、集約評価値を算出することとしてもよい。 [Modified example]
(Modification 1)
In the model analysis process described above, the
(変形例2)
上記のモデル分析処理においてユーザが指定した重要度の比をタスクと関連付けて学習してもよい。これにより、タスクと、そのタスクについてユーザが適切と考える重要度の比との関係を学習した機械学習モデルを生成することができる。この機械学習モデルを用いれば、ユーザはタスクを入力することにより、そのタスクに対して適切な重要度の比を出力として得ることができる。 (Modification 2)
In the model analysis process described above, the ratio of importance specified by the user may be learned in association with the task. This makes it possible to generate a machine learning model that has learned the relationship between a task and the ratio of importance that the user considers appropriate for that task. Using this machine learning model, by inputting a task, the user can obtain an appropriate importance ratio for that task as an output.
(変形例3)
第1実施形態では、分析部125は、ユーザが指定したタスクに対応する複数のモデルを順位付けしてリスト表示している。その代わりに、分析部125は、タスクの同一性を問わず、ユーザが指定した任意の複数のモデルを順位付けして表示することとしてもよい。 (Modification 3)
In the first embodiment, theanalysis unit 125 ranks and displays a list of multiple models corresponding to the task specified by the user. Instead, the analysis unit 125 may rank and display any plurality of models specified by the user, regardless of the identity of the tasks.
第1実施形態では、分析部125は、ユーザが指定したタスクに対応する複数のモデルを順位付けしてリスト表示している。その代わりに、分析部125は、タスクの同一性を問わず、ユーザが指定した任意の複数のモデルを順位付けして表示することとしてもよい。 (Modification 3)
In the first embodiment, the
(変形例4)
第1実施形態では、分析部125は、ユーザが選択したタスクに対応する複数のモデルをモデルDB123から取得し、評価用データを用いて各モデルの評価指標を算出している。その代わりに、各モデルの評価指標を算出する機能を外部に設けてもよい。例えば、分析部125は、各モデルの評価指標を記憶したDBなどから各モデルの評価指標を取得してもよい。 (Modification 4)
In the first embodiment, theanalysis unit 125 acquires a plurality of models corresponding to the task selected by the user from the model DB 123, and calculates an evaluation index for each model using evaluation data. Instead, a function for calculating the evaluation index of each model may be provided externally. For example, the analysis unit 125 may acquire the evaluation index of each model from a DB that stores the evaluation index of each model.
第1実施形態では、分析部125は、ユーザが選択したタスクに対応する複数のモデルをモデルDB123から取得し、評価用データを用いて各モデルの評価指標を算出している。その代わりに、各モデルの評価指標を算出する機能を外部に設けてもよい。例えば、分析部125は、各モデルの評価指標を記憶したDBなどから各モデルの評価指標を取得してもよい。 (Modification 4)
In the first embodiment, the
(変形例5)
上記の実施形態では、モデル生成装置100をPCなどの独立した装置として構成しているが、その代わりに、モデル生成装置をサーバと端末装置により構成してもよい。図7は、サーバと端末装置を用いたモデル生成システム1xの概略構成を示すブロック図である。図7において、サーバ100xは、図3に示すモデル生成装置100の構成を備える。また、ユーザが使用する端末装置7の表示装置2x及び入力装置3xを、図3に示す表示装置2及び入力装置3として使用する。 (Modification 5)
In the above embodiment, themodel generation device 100 is configured as an independent device such as a PC, but instead, the model generation device may be configured with a server and a terminal device. FIG. 7 is a block diagram showing a schematic configuration of a model generation system 1x using a server and a terminal device. In FIG. 7, a server 100x includes the configuration of the model generation device 100 shown in FIG. Further, the display device 2x and input device 3x of the terminal device 7 used by the user are used as the display device 2 and input device 3 shown in FIG.
上記の実施形態では、モデル生成装置100をPCなどの独立した装置として構成しているが、その代わりに、モデル生成装置をサーバと端末装置により構成してもよい。図7は、サーバと端末装置を用いたモデル生成システム1xの概略構成を示すブロック図である。図7において、サーバ100xは、図3に示すモデル生成装置100の構成を備える。また、ユーザが使用する端末装置7の表示装置2x及び入力装置3xを、図3に示す表示装置2及び入力装置3として使用する。 (Modification 5)
In the above embodiment, the
<第2実施形態>
次に、第2実施形態について説明する。第2実施形態に係るモデル生成システム1の全体構成、並びに、モデル生成装置100のハードウェア構成及び機能構成は、基本的に第1実施形態と同様であるので説明を省略する。 <Second embodiment>
Next, a second embodiment will be described. The overall configuration of themodel generation system 1 according to the second embodiment, and the hardware configuration and functional configuration of the model generation device 100 are basically the same as those of the first embodiment, so the description thereof will be omitted.
次に、第2実施形態について説明する。第2実施形態に係るモデル生成システム1の全体構成、並びに、モデル生成装置100のハードウェア構成及び機能構成は、基本的に第1実施形態と同様であるので説明を省略する。 <Second embodiment>
Next, a second embodiment will be described. The overall configuration of the
[評価情報の表示例]
第2実施形態では、分析部125は、複数の評価指標に基づいて、1つのタスクに対応する複数のモデルの関係を表示する。具体的には、分析部125は、ユーザが指定した複数の評価指標の値に基づいて各モデルを空間に埋め込むとともに、複数の評価指標及びユーザが指定した重要度との関係で同一レベルとみなせるモデルの領域をその空間上に描画する。 [Display example of evaluation information]
In the second embodiment, theanalysis unit 125 displays relationships between multiple models corresponding to one task based on multiple evaluation indicators. Specifically, the analysis unit 125 embeds each model in the space based on the values of a plurality of evaluation indicators specified by the user, and can consider the models to be at the same level in relation to the plurality of evaluation indicators and the degree of importance specified by the user. Draw the region of the model in its space.
第2実施形態では、分析部125は、複数の評価指標に基づいて、1つのタスクに対応する複数のモデルの関係を表示する。具体的には、分析部125は、ユーザが指定した複数の評価指標の値に基づいて各モデルを空間に埋め込むとともに、複数の評価指標及びユーザが指定した重要度との関係で同一レベルとみなせるモデルの領域をその空間上に描画する。 [Display example of evaluation information]
In the second embodiment, the
図8は、第2実施形態による評価情報の表示例を示す。図8の表示例60は、ユーザが指定した互換性指標及び精度指標をそれぞれX軸、Y軸とした空間(以下、「評価指標空間」とも呼ぶ。)上に各モデルを埋め込んだものである。分析部125は、第1実施形態と同様に、ユーザが指定した1つのタスクに対応する複数のモデルを取得し、それらについてユーザが指定した互換性指標及び精度指標の値を算出する。そして、分析部125は、各モデルの互換性指標及び精度指標の値に基づいて、各モデルを評価指標空間に埋め込む。これにより、表示例60が得られる。
FIG. 8 shows a display example of evaluation information according to the second embodiment. In the display example 60 of FIG. 8, each model is embedded in a space (hereinafter also referred to as "evaluation index space") in which the X-axis and Y-axis are the compatibility index and accuracy index specified by the user, respectively. . Similar to the first embodiment, the analysis unit 125 obtains a plurality of models corresponding to one task specified by the user, and calculates the values of the compatibility index and accuracy index specified by the user for the models. Then, the analysis unit 125 embeds each model in the evaluation index space based on the values of the compatibility index and accuracy index of each model. As a result, display example 60 is obtained.
次に、分析部125は、前述の集約評価値に基づいて、評価指標空間上に2つの評価指標が同一レベルとなる線分L1~L5を描画し、表示例61を作成する。いま、集約評価値として重み付け和Sを用いることとする。ユーザが精度指標について指定した重要度(重み)をw1とし、互換性指標について指定した重要度(重み)をw2とすると、重み付け和Sは以下の式で表される。
S=w1×(精度)+w2×(互換性) (2) Next, theanalysis unit 125 draws line segments L1 to L5 in which the two evaluation indicators are at the same level on the evaluation index space based on the above-mentioned aggregated evaluation value, and creates a display example 61. Now, assume that the weighted sum S is used as the aggregated evaluation value. If the degree of importance (weight) specified by the user for the accuracy index is w1 , and the degree of importance (weight) specified by the user for the compatibility index is w2 , then the weighted sum S is expressed by the following formula.
S=w 1 × (accuracy) + w 2 × (compatibility) (2)
S=w1×(精度)+w2×(互換性) (2) Next, the
S=w 1 × (accuracy) + w 2 × (compatibility) (2)
分析部125は、重み付け和Sの値を所定値S1とし、評価指標空間上に線分L1を描画する。同様に、分析部125は、重み付け和Sの値を任意の幅でS2、S3、...と変化させ、評価指標空間上に線分L2~L5を描画する。また、分析部125は、線分L1~L5により規定される領域A1~A5を異なる色などにより区別して表示する。
The analysis unit 125 sets the value of the weighted sum S to a predetermined value S1, and draws a line segment L1 on the evaluation index space. Similarly, the analysis unit 125 sets the value of the weighted sum S to S2, S3, . .. .. and draw line segments L2 to L5 on the evaluation index space. Furthermore, the analysis unit 125 distinguishes and displays the areas A1 to A5 defined by the line segments L1 to L5 using different colors or the like.
ここで、線分L1~L5は、ユーザが指定した重要度(w1/w2)、及び、複数の評価指標の集約評価値Sを固定し、精度指標及び互換性指標の値を変化させた場合の評価指標空間上におけるモデルの位置を示す。よって、例えば線分L1上に2つのモデルM1とM2がある場合、それらはユーザが指定した精度指標と互換性指標の重要度の比を満足し、かつ、複数の評価指標に関する総合的な評価を示す集約評価値Sが同一のモデルであり、ユーザが指定した重要度の観点で同一レベルのモデルと考えることができる。これは、他の線分L2~L5についても同様である。即ち、線分L1~L5は、評価指標空間上で、ユーザが指定した重要度を満足し、総合的な評価が同等であるモデルの位置を示す等高線と考えることができる。
Here, for line segments L1 to L5, the importance level (w 1 /w 2 ) specified by the user and the aggregate evaluation value S of multiple evaluation indicators are fixed, and the values of the accuracy index and compatibility index are changed. shows the position of the model on the evaluation index space when Therefore, for example, if there are two models M1 and M2 on line segment L1, they satisfy the ratio of importance of accuracy index and compatibility index specified by the user, and have a comprehensive evaluation regarding multiple evaluation indexes. The models have the same aggregated evaluation value S, and can be considered to be models at the same level in terms of the degree of importance specified by the user. This also applies to the other line segments L2 to L5. That is, the line segments L1 to L5 can be considered to be contour lines indicating the positions of models that satisfy the degree of importance specified by the user and have the same overall evaluation on the evaluation index space.
従って、評価指標空間上で線分L1とL2により規定される領域A2は、ユーザが指定した重要度をほぼ満足し、性能がほぼ同レベルであるモデルの位置を示す領域と考えることができる。これは、他の領域A1、A3~A5についても同様である。従って、ユーザは、表示例61において同一の領域に属する複数のモデルは、ユーザが指定した重要度の観点でほぼ同一レベルのモデルと知ることができる。例えば、ユーザは、領域A2に属するモデルh1とh2はほぼ同一レベルであり、領域A3に属するモデルh3とh4はほぼ同一レベルと認識することができる。
Therefore, the area A2 defined by the line segments L1 and L2 on the evaluation index space can be considered as an area indicating the position of a model that almost satisfies the degree of importance specified by the user and has almost the same level of performance. This also applies to the other areas A1, A3 to A5. Therefore, the user can know that the plurality of models belonging to the same area in the display example 61 are models at approximately the same level in terms of the degree of importance specified by the user. For example, the user can recognize that models h1 and h2 belonging to area A2 are at approximately the same level, and models h3 and h4 belonging to area A3 are at approximately the same level.
このように、第2実施形態では、評価指標空間上に複数のモデルを表示することにより、ユーザは、自身が指定した評価指標についての重要度の観点で同一レベルのモデルを視覚的に容易に把握することが可能となる。特に、ユーザは、トレードオフが大きいと考えられる2つの評価指標を指定して上記の表示を行うことにより、相反する2つの評価指標をうまく調整して適切な性能を示すことが可能なモデルを見つけることができる。
In this way, in the second embodiment, by displaying a plurality of models on the evaluation index space, the user can easily visually select models that are at the same level in terms of importance for the evaluation index that he or she has specified. It becomes possible to understand. In particular, by specifying two evaluation metrics that are considered to have a large trade-off and performing the above display, the user can create a model that can successfully adjust the two conflicting evaluation metrics and show appropriate performance. can be found.
[モデル分析処理]
図9は、第2実施形態によるモデル分析処理を示すフローチャートである。モデル分析処理は、ユーザが選択したタスクに対応する複数のモデルを、ユーザが指定した評価指標の重要度に応じて評価指標空間上に表示する処理である。この処理は、図2に示すプロセッサ112が予め用意されたプログラムを実行し、主として図3に示すモデル訓練部122及び分析部125として動作することにより実現される。 [Model analysis processing]
FIG. 9 is a flowchart showing model analysis processing according to the second embodiment. The model analysis process is a process of displaying a plurality of models corresponding to the task selected by the user on the evaluation index space according to the importance of the evaluation index specified by the user. This processing is realized by theprocessor 112 shown in FIG. 2 executing a prepared program and mainly operating as the model training section 122 and analysis section 125 shown in FIG. 3.
図9は、第2実施形態によるモデル分析処理を示すフローチャートである。モデル分析処理は、ユーザが選択したタスクに対応する複数のモデルを、ユーザが指定した評価指標の重要度に応じて評価指標空間上に表示する処理である。この処理は、図2に示すプロセッサ112が予め用意されたプログラムを実行し、主として図3に示すモデル訓練部122及び分析部125として動作することにより実現される。 [Model analysis processing]
FIG. 9 is a flowchart showing model analysis processing according to the second embodiment. The model analysis process is a process of displaying a plurality of models corresponding to the task selected by the user on the evaluation index space according to the importance of the evaluation index specified by the user. This processing is realized by the
まず、分析部125は、ユーザによるタスク、複数の評価指標、及び、それら評価指標の重要度を取得する(ステップS10)。図8は、ユーザがあるタスクを指定し、評価指標として精度指標と互換性指標を指定した例である。
First, the analysis unit 125 obtains a task by the user, a plurality of evaluation indicators, and the importance of these evaluation indicators (step S10). FIG. 8 is an example in which the user specifies a certain task and specifies an accuracy index and a compatibility index as evaluation indexes.
次に、分析部125は、ユーザが指定したタスクに対応する複数の候補モデルを取得する(ステップS11)。図8の例では、分析部125は、モデルh1~h5を取得している。次に、分析部125は、各モデルについて評価指標の値を算出し、評価指標空間に埋め込む(ステップS22)。図8の例では、分析部125は、モデルh1~h5について、精度指標及び互換性指標を算出し、表示例60のように各モデルh1~h5を評価指標空間に埋め込んでいる。
Next, the analysis unit 125 obtains a plurality of candidate models corresponding to the task specified by the user (step S11). In the example of FIG. 8, the analysis unit 125 has acquired models h1 to h5. Next, the analysis unit 125 calculates the evaluation index value for each model and embeds it in the evaluation index space (step S22). In the example of FIG. 8, the analysis unit 125 calculates the accuracy index and compatibility index for the models h1 to h5, and embeds each model h1 to h5 in the evaluation index space as shown in the display example 60.
次に、分析部125は、ユーザが指定した重要度と、各評価指標の値とを用いて、等高線L1~L5を描画する。図8の例では、分析部125は、上記の式(2)において、ユーザが指定した各評価指標の重要度の比(w1/w2)を固定し、重み付け和Sの値を所定幅で変更しつつ、精度指標及び互換性指標を変化させることにより、等高線L1~L5を描画する。そして、分析部125は、等高線L1~L5により規定される領域A1~A5を異なる色で色分けし、同一レベルとみなせるモデルの領域を描画する(ステップS23)。そして、処理は終了する。
Next, the analysis unit 125 draws contour lines L1 to L5 using the degree of importance specified by the user and the value of each evaluation index. In the example of FIG. 8, the analysis unit 125 fixes the importance ratio (w 1 /w 2 ) of each evaluation index specified by the user in the above equation (2), and changes the value of the weighted sum S by a predetermined width. The contour lines L1 to L5 are drawn by changing the accuracy index and the compatibility index while changing the . Then, the analysis unit 125 colors the regions A1 to A5 defined by the contour lines L1 to L5 using different colors, and draws regions of the model that can be considered to be at the same level (step S23). Then, the process ends.
以上のように、第2実施形態のモデル分析処理では、ユーザが指定した複数の評価指標及びそれらの重要度に基づいて、ユーザが指定したタスクに対応する複数のモデルが評価指標空間上に表示される。また、ユーザが指定した評価指標及びその重要度に基づいて、同一レベルとみなせるモデルの領域が評価指標空間上に表示される。よって、ユーザは、自分が指定した重要度の場合に同一レベルとみなせるモデル、例えば代替的に使用可能なモデルを容易に知ることができる。
As described above, in the model analysis process of the second embodiment, a plurality of models corresponding to a task specified by the user are displayed in the evaluation index space based on a plurality of evaluation indicators specified by the user and their importance levels. be done. Further, based on the evaluation index specified by the user and its importance, regions of models that can be considered to be of the same level are displayed on the evaluation index space. Therefore, the user can easily know models that can be considered to be at the same level in the case of the level of importance specified by the user, for example, models that can be used instead.
[変形例]
(変形例1)
上記の例では、分析部125は、重み付け和を示す線形関数を用いて2つの評価指標を集約し、評価指標空間上に等高線を描画している。その代わりに、分析部125は、他の線形関数や非線形関数を用いて2つの評価指標を集約し、評価指標空間上に等高線を描画してもよい。 [Modified example]
(Modification 1)
In the above example, theanalysis unit 125 aggregates two evaluation indicators using a linear function indicating a weighted sum, and draws contour lines on the evaluation indicator space. Instead, the analysis unit 125 may aggregate the two evaluation indicators using another linear function or nonlinear function, and draw contour lines on the evaluation indicator space.
(変形例1)
上記の例では、分析部125は、重み付け和を示す線形関数を用いて2つの評価指標を集約し、評価指標空間上に等高線を描画している。その代わりに、分析部125は、他の線形関数や非線形関数を用いて2つの評価指標を集約し、評価指標空間上に等高線を描画してもよい。 [Modified example]
(Modification 1)
In the above example, the
(変形例2)
第2実施形態においても、分析部125は、ユーザが指定したタスクに対応する複数のモデルを順位付けしてリスト表示している。その代わりに、分析部125は、タスクの同一性を問わず、ユーザが指定した任意の複数のモデルを評価指標空間上に表示することとしてもよい。 (Modification 2)
In the second embodiment as well, theanalysis unit 125 ranks and displays a list of multiple models corresponding to the task specified by the user. Instead, the analysis unit 125 may display any plurality of models specified by the user on the evaluation index space, regardless of the identity of the tasks.
第2実施形態においても、分析部125は、ユーザが指定したタスクに対応する複数のモデルを順位付けしてリスト表示している。その代わりに、分析部125は、タスクの同一性を問わず、ユーザが指定した任意の複数のモデルを評価指標空間上に表示することとしてもよい。 (Modification 2)
In the second embodiment as well, the
(変形例3)
第2実施形態においても、第1実施形態の変形例4と同様に、分析部125は、各モデルの評価指標を外部から取得してもよい。 (Modification 3)
Also in the second embodiment, similarly to the fourth modification of the first embodiment, theanalysis unit 125 may acquire the evaluation index of each model from the outside.
第2実施形態においても、第1実施形態の変形例4と同様に、分析部125は、各モデルの評価指標を外部から取得してもよい。 (Modification 3)
Also in the second embodiment, similarly to the fourth modification of the first embodiment, the
(変形例4)
第2実施形態においても、第1実施形態の変形例5と同様に、図7に示すようにモデル生成装置をサーバと端末装置により構成してもよい。 (Modification 4)
In the second embodiment as well, the model generation device may be configured by a server and a terminal device as shown in FIG. 7, similarly to the fifth modification of the first embodiment.
第2実施形態においても、第1実施形態の変形例5と同様に、図7に示すようにモデル生成装置をサーバと端末装置により構成してもよい。 (Modification 4)
In the second embodiment as well, the model generation device may be configured by a server and a terminal device as shown in FIG. 7, similarly to the fifth modification of the first embodiment.
<第3実施形態>
図10は、第3実施形態のモデル分析装置70の機能構成を示すブロック図である。モデル分析装置70は、指標取得手段71と、重要度取得手段72と、指標値取得手段73と、分析手段74とを備える。 <Third embodiment>
FIG. 10 is a block diagram showing the functional configuration of amodel analysis device 70 according to the third embodiment. The model analysis device 70 includes an index acquisition means 71, an importance degree acquisition means 72, an index value acquisition means 73, and an analysis means 74.
図10は、第3実施形態のモデル分析装置70の機能構成を示すブロック図である。モデル分析装置70は、指標取得手段71と、重要度取得手段72と、指標値取得手段73と、分析手段74とを備える。 <Third embodiment>
FIG. 10 is a block diagram showing the functional configuration of a
図11は、第3実施形態のモデル分析装置70による処理のフローチャートである。指標取得手段71は、モデルに関する複数の評価指標の指定を取得する(ステップS71)。重要度取得手段72は、複数の評価指標に対する重要度を取得する(ステップS72)。指標値取得手段73は、複数のモデルについて、複数の評価指標の値を取得する(ステップS73)。分析手段74は、取得した評価指標の値と、重要度とに基づいて複数のモデルの順位を分析する(ステップS74)。
FIG. 11 is a flowchart of processing by the model analysis device 70 of the third embodiment. The index acquisition means 71 acquires designations of a plurality of evaluation indexes regarding the model (step S71). The importance obtaining unit 72 obtains the importance for a plurality of evaluation indicators (step S72). The index value acquisition means 73 acquires the values of a plurality of evaluation indexes for a plurality of models (step S73). The analysis means 74 analyzes the ranking of the plurality of models based on the obtained evaluation index value and importance level (step S74).
第3実施形態のモデル分析装置70によれば、複数の評価指標を考慮してモデルの評価や適切なモデルの選択を行うことが可能となる。
According to the model analysis device 70 of the third embodiment, it is possible to evaluate models and select an appropriate model by considering a plurality of evaluation indicators.
上記の実施形態の一部又は全部は、以下の付記のようにも記載されうるが、以下には限られない。
Part or all of the above embodiments may be described as in the following additional notes, but are not limited to the following.
(付記1)
モデルに関する複数の評価指標の指定を取得する指標取得手段と、
前記複数の評価指標に対する重要度を取得する重要度取得手段と、
前記複数のモデルについて、前記複数の評価指標の値を取得する指標値取得手段と、
取得した評価指標の値と、重要度とに基づいて、前記複数のモデルの順位を分析する分析手段と、
を備えるモデル分析装置。 (Additional note 1)
an index acquisition means for acquiring designations of a plurality of evaluation indexes regarding the model;
Importance degree acquisition means for acquiring importance degrees for the plurality of evaluation indicators;
index value acquisition means for acquiring values of the plurality of evaluation indicators for the plurality of models;
an analysis means for analyzing the ranking of the plurality of models based on the obtained evaluation index value and importance level;
A model analysis device comprising:
(付記2)
前記分析手段は、前記重要度に基づいて前記複数の評価指標の値を集約して前記モデル毎に集約評価値を算出し、前記複数のモデルを前記集約評価値に従って順位付けした情報を出力する付記1に記載のモデル分析装置。 (Additional note 2)
The analysis means aggregates the values of the plurality of evaluation indicators based on the degree of importance, calculates an aggregate evaluation value for each model, and outputs information in which the plurality of models are ranked according to the aggregate evaluation value. The model analysis device described inAppendix 1.
前記分析手段は、前記重要度に基づいて前記複数の評価指標の値を集約して前記モデル毎に集約評価値を算出し、前記複数のモデルを前記集約評価値に従って順位付けした情報を出力する付記1に記載のモデル分析装置。 (Additional note 2)
The analysis means aggregates the values of the plurality of evaluation indicators based on the degree of importance, calculates an aggregate evaluation value for each model, and outputs information in which the plurality of models are ranked according to the aggregate evaluation value. The model analysis device described in
(付記3)
タスクの指定を受け取るタスク取得手段を備え、
前記算出手段は、指定されたタスクに対応する複数のモデルについて前記評価指標の値を算出する付記1又は2に記載のモデル分析装置。 (Additional note 3)
comprising a task acquisition means for receiving a task specification;
The model analysis device according to supplementary note 1 or 2, wherein the calculation means calculates the value of the evaluation index for a plurality of models corresponding to a specified task.
タスクの指定を受け取るタスク取得手段を備え、
前記算出手段は、指定されたタスクに対応する複数のモデルについて前記評価指標の値を算出する付記1又は2に記載のモデル分析装置。 (Additional note 3)
comprising a task acquisition means for receiving a task specification;
The model analysis device according to
(付記4)
前記重要度取得手段は、前記複数の評価指標に対する重要度の比を取得する付記1又は2に記載のモデル分析装置。 (Additional note 4)
The model analysis device according to supplementary note 1 or 2, wherein the importance degree acquisition means acquires a ratio of importance degrees to the plurality of evaluation indicators.
前記重要度取得手段は、前記複数の評価指標に対する重要度の比を取得する付記1又は2に記載のモデル分析装置。 (Additional note 4)
The model analysis device according to
(付記5)
前記重要度取得手段は、前記複数の評価指標の各々に対する重要度の値を取得する付記1又は2に記載のモデル分析装置。 (Appendix 5)
The model analysis device according to appendix 1 or 2, wherein the importance degree acquisition means acquires a value of importance for each of the plurality of evaluation indicators.
前記重要度取得手段は、前記複数の評価指標の各々に対する重要度の値を取得する付記1又は2に記載のモデル分析装置。 (Appendix 5)
The model analysis device according to
(付記6)
前記出力手段は、前記重要度と前記複数の評価指標の値との重み付け和を前記集約評価値として算出する付記1乃至5のいずれか一項に記載のモデル分析装置。 (Appendix 6)
The model analysis device according to any one ofSupplementary Notes 1 to 5, wherein the output means calculates a weighted sum of the importance level and the values of the plurality of evaluation indicators as the aggregated evaluation value.
前記出力手段は、前記重要度と前記複数の評価指標の値との重み付け和を前記集約評価値として算出する付記1乃至5のいずれか一項に記載のモデル分析装置。 (Appendix 6)
The model analysis device according to any one of
(付記7)
モデルに関する複数の評価指標の指定を取得し、
前記複数の評価指標に対する重要度を取得し、
前記複数のモデルについて、前記複数の評価指標の値を取得し、
取得した評価指標の値と、重要度とに基づいて、前記複数のモデルの順位を分析するモデル分析方法。 (Appendix 7)
obtain multiple evaluation metric specifications for the model;
Obtaining the importance of the plurality of evaluation indicators,
obtaining values of the plurality of evaluation indicators for the plurality of models;
A model analysis method for analyzing rankings of the plurality of models based on acquired evaluation index values and degrees of importance.
(付記8)
モデルに関する複数の評価指標の指定を取得し、
前記複数の評価指標に対する重要度を取得し、
前記複数のモデルについて、前記複数の評価指標の値を取得し、
取得した評価指標の値と、重要度とに基づいて、前記複数のモデルの順位を分析する処理をコンピュータに実行させるプログラムを記録した記録媒体。 (Appendix 8)
obtain multiple evaluation metric specifications for the model;
Obtaining the importance of the plurality of evaluation indicators,
obtaining values of the plurality of evaluation indicators for the plurality of models;
A recording medium that records a program that causes a computer to execute a process of analyzing rankings of the plurality of models based on the obtained evaluation index values and degrees of importance.
以上、実施形態及び実施例を参照して本開示を説明したが、本開示は上記実施形態及び実施例に限定されるものではない。本開示の構成や詳細には、本開示のスコープ内で当業者が理解し得る様々な変更をすることができる。
Although the present disclosure has been described above with reference to the embodiments and examples, the present disclosure is not limited to the above embodiments and examples. Various changes can be made to the structure and details of the present disclosure that can be understood by those skilled in the art within the scope of the present disclosure.
1、1x モデル生成システム
2、2x 表示装置
3、3x 入力装置
7 端末装置
100 モデル生成装置
112 プロセッサ
121 訓練データDB
122 モデル訓練部
123 モデルDB
124 評価用データDB
125 分析部 1, 1x Model generation system 2, 2x Display device 3, 3x Input device 7 Terminal device 100 Model generation device 112 Processor 121 Training data DB
122Model training department 123 Model DB
124 Evaluation data DB
125 Analysis Department
2、2x 表示装置
3、3x 入力装置
7 端末装置
100 モデル生成装置
112 プロセッサ
121 訓練データDB
122 モデル訓練部
123 モデルDB
124 評価用データDB
125 分析部 1, 1x
122
124 Evaluation data DB
125 Analysis Department
Claims (8)
- モデルに関する複数の評価指標の指定を取得する指標取得手段と、
前記複数の評価指標に対する重要度を取得する重要度取得手段と、
前記複数のモデルについて、前記複数の評価指標の値を取得する指標値取得手段と、
取得した評価指標の値と、重要度とに基づいて、前記複数のモデルの順位を分析する分析手段と、
を備えるモデル分析装置。 an index acquisition means for acquiring designations of a plurality of evaluation indexes regarding the model;
Importance degree acquisition means for acquiring importance degrees for the plurality of evaluation indicators;
index value acquisition means for acquiring values of the plurality of evaluation indicators for the plurality of models;
an analysis means for analyzing the ranking of the plurality of models based on the obtained evaluation index value and importance;
A model analysis device comprising: - 前記分析手段は、前記重要度に基づいて前記複数の評価指標の値を集約して前記モデル毎に集約評価値を算出し、前記複数のモデルを前記集約評価値に従って順位付けした情報を出力する請求項1に記載のモデル分析装置。 The analysis means aggregates the values of the plurality of evaluation indicators based on the degree of importance, calculates an aggregate evaluation value for each model, and outputs information in which the plurality of models are ranked according to the aggregate evaluation value. The model analysis device according to claim 1.
- タスクの指定を受け取るタスク取得手段を備え、
前記算出手段は、指定されたタスクに対応する複数のモデルについて前記評価指標の値を算出する請求項1又は2に記載のモデル分析装置。 comprising a task acquisition means for receiving a task specification;
3. The model analysis device according to claim 1, wherein the calculation means calculates the value of the evaluation index for a plurality of models corresponding to a specified task. - 前記重要度取得手段は、前記複数の評価指標に対する重要度の比を取得する請求項1又は2に記載のモデル分析装置。 The model analysis device according to claim 1 or 2, wherein the importance degree acquisition means acquires a ratio of importance degrees to the plurality of evaluation indicators.
- 前記重要度取得手段は、前記複数の評価指標の各々に対する重要度の値を取得する請求項1又は2に記載のモデル分析装置。 The model analysis device according to claim 1 or 2, wherein the importance degree acquisition means acquires a value of importance for each of the plurality of evaluation indicators.
- 前記出力手段は、前記重要度と前記複数の評価指標の値との重み付け和を前記集約評価値として算出する請求項1乃至5のいずれか一項に記載のモデル分析装置。 The model analysis device according to any one of claims 1 to 5, wherein the output means calculates a weighted sum of the importance level and the values of the plurality of evaluation indicators as the aggregated evaluation value.
- モデルに関する複数の評価指標の指定を取得し、
前記複数の評価指標に対する重要度を取得し、
前記複数のモデルについて、前記複数の評価指標の値を取得し、
取得した評価指標の値と、重要度とに基づいて、前記複数のモデルの順位を分析するモデル分析方法。 obtain multiple evaluation metric specifications for the model;
Obtaining the importance of the plurality of evaluation indicators,
obtaining values of the plurality of evaluation indicators for the plurality of models;
A model analysis method for analyzing rankings of the plurality of models based on acquired evaluation index values and degrees of importance. - モデルに関する複数の評価指標の指定を取得し、
前記複数の評価指標に対する重要度を取得し、
前記複数のモデルについて、前記複数の評価指標の値を取得し、
取得した評価指標の値と、重要度とに基づいて、前記複数のモデルの順位を分析する処理をコンピュータに実行させるプログラムを記録した記録媒体。 obtain multiple evaluation metric specifications for the model;
Obtaining the importance of the plurality of evaluation indicators,
obtaining values of the plurality of evaluation indicators for the plurality of models;
A recording medium that records a program that causes a computer to execute a process of analyzing rankings of the plurality of models based on the obtained evaluation index values and degrees of importance.
Priority Applications (1)
| Application Number | Priority Date | Filing Date | Title |
|---|---|---|---|
| PCT/JP2022/012675 WO2023175921A1 (en) | 2022-03-18 | 2022-03-18 | Model analysis device, model analysis method, and recording medium |
Applications Claiming Priority (1)
| Application Number | Priority Date | Filing Date | Title |
|---|---|---|---|
| PCT/JP2022/012675 WO2023175921A1 (en) | 2022-03-18 | 2022-03-18 | Model analysis device, model analysis method, and recording medium |
Publications (1)
| Publication Number | Publication Date |
|---|---|
| WO2023175921A1 true WO2023175921A1 (en) | 2023-09-21 |
Family
ID=88022634
Family Applications (1)
| Application Number | Title | Priority Date | Filing Date |
|---|---|---|---|
| PCT/JP2022/012675 WO2023175921A1 (en) | 2022-03-18 | 2022-03-18 | Model analysis device, model analysis method, and recording medium |
Country Status (1)
| Country | Link |
|---|---|
| WO (1) | WO2023175921A1 (en) |
Citations (2)
| Publication number | Priority date | Publication date | Assignee | Title |
|---|---|---|---|---|
| WO2013179577A1 (en) * | 2012-05-31 | 2013-12-05 | 日本電気株式会社 | Multipurpose optimization system, information analysis system, multipurpose optimization method, and program |
| WO2022038804A1 (en) * | 2020-08-21 | 2022-02-24 | 株式会社日立製作所 | Diagnostic device and parameter adjustment method |
-
2022
- 2022-03-18 WO PCT/JP2022/012675 patent/WO2023175921A1/en unknown
Patent Citations (2)
| Publication number | Priority date | Publication date | Assignee | Title |
|---|---|---|---|---|
| WO2013179577A1 (en) * | 2012-05-31 | 2013-12-05 | 日本電気株式会社 | Multipurpose optimization system, information analysis system, multipurpose optimization method, and program |
| WO2022038804A1 (en) * | 2020-08-21 | 2022-02-24 | 株式会社日立製作所 | Diagnostic device and parameter adjustment method |
Similar Documents
| Publication | Publication Date | Title |
|---|---|---|
| Gurumoorthy et al. | Efficient data representation by selecting prototypes with importance weights | |
| US11216741B2 (en) | Analysis apparatus, analysis method, and non-transitory computer readable medium | |
| van Rijn et al. | Fast algorithm selection using learning curves | |
| US6636862B2 (en) | Method and system for the dynamic analysis of data | |
| Zheng et al. | Learning criteria weights of an optimistic Electre Tri sorting rule | |
| JP7330712B2 (en) | Material property prediction device and material property prediction method | |
| JP7069029B2 (en) | Automatic prediction system, automatic prediction method and automatic prediction program | |
| GB2541649A (en) | User feedback for machine learning | |
| US20170046460A1 (en) | Scoring a population of examples using a model | |
| CN116484269B (en) | Parameter processing method, device and equipment of display screen module and storage medium | |
| JP2022035686A (en) | Diagnostic device and parameter adjustment method | |
| US20200050982A1 (en) | Method and System for Predictive Modeling for Dynamically Scheduling Resource Allocation | |
| WO2023175921A1 (en) | Model analysis device, model analysis method, and recording medium | |
| JPH10240715A (en) | Prediction and estimation device and method therefor | |
| Liu et al. | Active learning in the predict-then-optimize framework: A margin-based approach | |
| WO2023175922A1 (en) | Model analysis device, model analysis method, and recording medium | |
| US20180121811A1 (en) | Profiling a population of examples in a precisely descriptive or tendency-based manner | |
| WO2019235608A1 (en) | Analysis device, analysis method, and recording medium | |
| WO2019235611A1 (en) | Analysis device, analysis method, and recording medium | |
| JP7438616B2 (en) | Information processing equipment and programs | |
| Araujo et al. | Hybrid intelligent design of morphological-rank-linear perceptrons for software development cost estimation | |
| US20230214668A1 (en) | Hyperparameter adjustment device, non-transitory recording medium in which hyperparameter adjustment program is recorded, and hyperparameter adjustment program | |
| WO2023181322A1 (en) | Model analysis device, model analysis method, and recording medium | |
| CN113987261A (en) | Video recommendation method and system based on dynamic trust perception | |
| KR20220061542A (en) | Method and system for optimizing manufacturing process based on confidence interval |
Legal Events
| Date | Code | Title | Description |
|---|---|---|---|
| 121 | Ep: the epo has been informed by wipo that ep was designated in this application |
Ref document number: 22932193 Country of ref document: EP Kind code of ref document: A1 |