WO2023067702A1 - プラント運転支援装置 - Google Patents
プラント運転支援装置 Download PDFInfo
- Publication number
- WO2023067702A1 WO2023067702A1 PCT/JP2021/038640 JP2021038640W WO2023067702A1 WO 2023067702 A1 WO2023067702 A1 WO 2023067702A1 JP 2021038640 W JP2021038640 W JP 2021038640W WO 2023067702 A1 WO2023067702 A1 WO 2023067702A1
- Authority
- WO
- WIPO (PCT)
- Prior art keywords
- data
- analysis
- database
- graph
- operator
- Prior art date
Links
- 238000005259 measurement Methods 0.000 claims abstract description 25
- 238000007405 data analysis Methods 0.000 claims abstract description 22
- 238000013480 data collection Methods 0.000 claims abstract description 11
- 238000004458 analytical method Methods 0.000 claims description 94
- 238000000034 method Methods 0.000 claims description 57
- 238000010586 diagram Methods 0.000 description 38
- 238000011156 evaluation Methods 0.000 description 19
- 238000000556 factor analysis Methods 0.000 description 9
- 230000006870 function Effects 0.000 description 9
- 230000002159 abnormal effect Effects 0.000 description 7
- 230000005484 gravity Effects 0.000 description 7
- 239000003550 marker Substances 0.000 description 6
- 230000000694 effects Effects 0.000 description 4
- 238000012544 monitoring process Methods 0.000 description 4
- 230000005856 abnormality Effects 0.000 description 3
- 238000001514 detection method Methods 0.000 description 3
- 238000009826 distribution Methods 0.000 description 3
- 238000011158 quantitative evaluation Methods 0.000 description 3
- 238000010187 selection method Methods 0.000 description 3
- 238000004364 calculation method Methods 0.000 description 2
- 238000007619 statistical method Methods 0.000 description 2
- 230000006399 behavior Effects 0.000 description 1
- 230000006866 deterioration Effects 0.000 description 1
- 238000011143 downstream manufacturing Methods 0.000 description 1
- 239000000284 extract Substances 0.000 description 1
- 230000014509 gene expression Effects 0.000 description 1
- 238000004519 manufacturing process Methods 0.000 description 1
- 238000011017 operating method Methods 0.000 description 1
- 238000005457 optimization Methods 0.000 description 1
- 238000012545 processing Methods 0.000 description 1
- 238000011144 upstream manufacturing Methods 0.000 description 1
- XLYOFNOQVPJJNP-UHFFFAOYSA-N water Substances O XLYOFNOQVPJJNP-UHFFFAOYSA-N 0.000 description 1
Images


Classifications
-
- G—PHYSICS
- G05—CONTROLLING; REGULATING
- G05B—CONTROL OR REGULATING SYSTEMS IN GENERAL; FUNCTIONAL ELEMENTS OF SUCH SYSTEMS; MONITORING OR TESTING ARRANGEMENTS FOR SUCH SYSTEMS OR ELEMENTS
- G05B23/00—Testing or monitoring of control systems or parts thereof
- G05B23/02—Electric testing or monitoring
Definitions
- This disclosure relates to a plant operation support device that detects an abnormal state in a plant and performs factor analysis when an abnormality occurs.
- the monitoring and control system collects measured values obtained through sensors attached to each facility of the plant, and collectively monitors them on a display device called a central monitoring monitor.
- these large-scale plants are configured by combining multiple manufacturing processes, and are known to exhibit complex behavior, such as a change in the output of a certain facility that sequentially affects upstream and downstream processes. Therefore, the operator not only checks whether there is an alarm issued by the supervisory control system, but also looks at changes in the measured values and compares them with a plurality of measured values to detect the occurrence of an abnormality.
- factor analysis when an abnormality occurs is one of the tasks that operators and facility administrators are responsible for. Attribution analysis investigates the underlying factors that cause a plant to behave abnormally. Specifically, by analyzing the measured value data collected by the monitoring control system using techniques such as statistical analysis, the presence or absence of an abnormal state and the relationship between abnormal propagation and the like are quantitatively evaluated. For example, as a method for supporting factor analysis, a method for automatically calculating a threshold for determining whether the current plant is normal or abnormal according to a pre-registered calculation method has been disclosed. (For example, see Patent Document 1)
- the method of automatically calculating the threshold according to the pre-registered calculation method described above may not be able to accurately detect an abnormal state when an event occurs that has few occurrences that cannot be directly measured by a sensor. have a nature.
- the present disclosure has been made to solve the problems described above, and aims to provide a display interface that can reduce the operator's burden in analysis work.
- the plant operation support device includes data selection means for the operator to select an arbitrary data range of the first graph in the first graph and the second graph displayed on the display operated by the operator;
- a data selection database that records the operator's operation information including the selection of the data range performed in , a measurement data database that accumulates measurement data measured by the measurement device, and an operation information recorded in the data selection database and the operator can arbitrarily a display data collection unit that collects the measurement data accumulated in the measurement data database selected by the operator; and a graph creation unit.
- the plant operation support device of the present disclosure there is an effect that it is possible to reduce the operator's load in analysis work when factor analysis is performed for an event that has occurred in a plant for which a detection method has not been established.
- FIG. 1 is a block diagram of a plant operation support device according to Embodiment 1 of the present disclosure
- FIG. 1 is a hardware configuration diagram of a plant operation support device according to a first embodiment of the present disclosure
- FIG. FIG. 4 is a diagram showing an example of a schematic representation of a recording method of a data selection history database according to the first embodiment of the present disclosure
- FIG. FIG. 5 is a diagram showing a display example of a data analysis graph created by a data analysis graph creating unit according to the first embodiment of the present disclosure
- FIG. FIG. 5 is a diagram showing an example of a schematic representation of guidance display in the analysis procedure creating unit according to the first embodiment of the present disclosure
- FIG. 7 is a block diagram of a plant operation support device according to a second embodiment of the present disclosure
- FIG. 10 is a diagram showing an example of a schematic representation of a screen change when display data is switched according to the second embodiment of the present disclosure
- FIG. 11 is a block diagram of a plant operation support device according to Embodiment 3 of the present disclosure
- FIG. 11 is a diagram showing an example of a schematic representation of a recording method of an analysis result database according to a third embodiment of the present disclosure
- FIG. It is an example of a guidance display of the plant operation assistance device concerning Embodiment 3 of this indication.
- FIG. 11 is a block diagram of a plant operation support device according to a fourth embodiment of the present disclosure
- FIG. 1 is a block diagram of a plant operation support device according to Embodiment 1 of the present disclosure.
- FIG. 2 is a hardware configuration diagram of the plant operation support device according to the first embodiment of the present disclosure.
- FIG. 3 is a diagram schematically showing an example of a recording method of a data selection history database according to the first embodiment of the present disclosure;
- FIG. 4 is a diagram showing a display example of the data analysis graph created by the data analysis graph creating unit according to the first embodiment of the present disclosure.
- FIG. 5 is a diagram schematically showing an example of guidance display in the analysis procedure creation unit according to the first embodiment of the present disclosure;
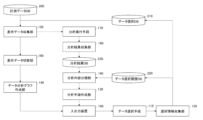
- the plant operation support device shown in FIG. A data selection database (DB) 210 and a data selection history database (DB) 220 for recording information, a measurement data database (DB) 200 for accumulating measurement data measured by a measuring device, and operations recorded in the data selection database 210.
- a display data collection unit 150 that collects the measurement data accumulated in the information and measurement data database 200, and a data analysis graph generation unit 140 that generates a data analysis graph in which data of another graph related to the selected data is displayed.
- an analysis procedure creation unit 130 that creates guidance based on the history of operation information recorded in the data selection history database 220 .
- FIG. 2 is a hardware configuration diagram of the plant operation support device.
- the plant operation support device includes a processor 101 such as a CPU (Control Processing Unit), a memory 102 such as a RAM (Random Access Memory), a display 103 and an input interface (I/F) 104 .
- Selection information collection unit 120 , analysis procedure creation unit 130 , data analysis graph creation unit 140 and display data collection unit 150 are implemented by processor 111 executing a program stored in memory 102 . However, these may be realized by cooperation of, for example, a plurality of processors 101 .
- the data selection means 110 is a function for the operator to arbitrarily select data of interest in the graph displayed on the input/output device 100 by operating the mouse or the like.
- the graphs referred to here are of any type, such as trend graphs, scatter graphs, etc., as long as the operator can arbitrarily select data and perform factor analysis, and the number of graphs to be displayed does not matter.
- the input/output device 100 that displays the graph may be a display device, a display interface, or the like that can display the graph.
- the operator directly specifies an arbitrary period, upper and lower limits, etc. on the trend graph of interest by operating the mouse.
- the operator can directly specify the data range on the scatter diagram by operating the mouse.
- mouse operation was given as an example, but the data range can also be specified by entering mathematical expressions such as thresholds and inequalities.
- the data range can also be specified by entering mathematical expressions such as thresholds and inequalities.
- it includes a series of setting operations related to graph display, such as the display period in trend graphs and the maximum and minimum display ranges in scatter diagrams.
- the operation information including the selection of the data range on the graph performed by the operator with the data selection means 110 is collected in the selection information collection unit 120, and the operation information collected in the selection information collection unit 120 is stored in the data selection database 210. is recorded.
- the operator's operation information collected by the selection information collection unit 120 is recorded in the data selection database 210 and the data selection history database 220, but only the latest operation information performed by the operator is recorded in the data selection database 210. be.
- the selected data collection unit 120 extracts the ID and period of the selected data, converts the selected data range into a formula and collects it. Then, the collected operation information is recorded in the data selection database 210 . For example, if a range of measured A values greater than 50 is selected, the inequality A>50 is recorded in the data selection database 210 .
- the data selection history database 220 is a function that records the history of data selection operation information performed by the operator.
- FIG. 3 is a diagram schematically showing data selection information recorded in the data selection history database 220. As shown in FIG.
- the data selection information consists of display data information 310, data selection ID 320, data selection content information 330, and data selection range information 340, and is recorded in the data selection history database 220 together with the data selection history ID 300.
- the display data information 310 registers measurement values used for displaying graphs such as trend graphs and scatter diagrams.
- the data selection ID 320 manages the data selected by the operator on the graph as a group. To explain with an example, when a plurality of different data on the graph are selected, they are grouped into G1 and G2, and the registration contents are recorded respectively.
- the data selection content information 330 and the data selection range information 340 record which range of which data on the graph is designated by each group recorded by the data selection ID 320, that is, the selected data information. Description will be made with reference to FIG. In FIG. 4, it is assumed that a trend graph displaying measured values A and B and a scatter diagram having measured values A on the vertical axis and measured values B on the horizontal axis are displayed on the input/output device 100 . When the operator designates a shaded range on the trend graph, the measured value A and the measured value B are recorded in the display data information 310, and the measured value A and the measured value B are recorded in the data selection content information 330. be.
- the data selection range information 340 records an inequality corresponding to the range selected by the operator on the scatter diagram.
- the measurement data database 200 is a function for accumulating measurement data measured by the measuring device.
- the measuring device may be any device or means capable of measuring the state of the plant.
- the display data collection unit 150 is a function that collects the operator's latest operation information recorded in the data selection database 210 and the measurement data accumulated in the measurement data database 200 .
- the data analysis graph creation unit 140 uses the data collected by the display data collection unit 150 to, when the operator selects arbitrary data on the graph displayed on the input/output device 100, create a graph related to the selected data. The ability to create data analysis graphs that display data from other graphs.
- FIG. 4 is a diagram showing a display example of the data analysis graph created by the data analysis graph creating unit 140. As shown in FIG.
- FIG. 4 A trend graph and a scatter diagram are displayed on the input/output device 100 .
- the trend graph displays two measurement data, measured value A and measured value B
- the scatter diagram displays a graph having the measured value A on the vertical axis and the measured value B on the horizontal axis.
- operation information such as the selected data type and time period is recorded in the data selection database 210 .
- the scatter diagram refers to the operation information recorded in the data selection database 210, and changes the display color of data (markers) related to the data selected by the operator to highlight them. In the scatter plot of FIG. 4, the hollow markers are highlighted.
- the data selection database 210 records the selection range of the measured values A and B.
- the trend graph changes the display color of the corresponding time zone according to the selection range recorded in the data selection database 210 to highlight it.
- FIG. 4 shows an example in which the data of another graph related to the selected data is displayed by changing the color, it is not limited to the display by changing the color. As long as the data of another graph related to the selected data is displayed in an emphasized manner, for example, the method of displaying the data so as to blink is not limited.
- the analysis procedure creation unit 130 creates guidance based on the history of operation information recorded in the data selection history database 220 and displays the guidance on the input/output device 100 .
- FIG. 5 schematically shows a procedure created by the analysis procedure creating unit 130 based on the history of data selection information recorded in the data selection history database 220 and analyzed.
- Guidance display in the present invention means displaying on the input/output device 100 guidance information indicating the selection procedure and selection operation details of the data recorded in the data selection history database 220 .
- the measured value B and the measured value C are displayed in the procedure 1
- the measured value A, the measured value B and the measured value C are displayed in the procedure 2
- the measured value A and the measured value C are displayed in the procedure 3.
- procedure 4 it is shown that the data range of the display of the measured value A and the measured value C and the area of the measured value A>50 and the measured value C>50 is selected.
- Procedure 5 indicates that the measured value A and the measured value C are displayed and that the data range of the measured value A>50 and the measured value C>90 is selected.
- the operation for additional display of data is arranged on the left side, and the operation for limited display of data is arranged on the right side, and the operation information is displayed in a branch format.
- the procedure starts from procedure 1 (500C), and since the measurement value A is newly added in procedure 2 (500A), it is placed on the left side of procedure 1 (display 500C). do.
- procedure 3 (500B) an operation was performed to delete the measurement value B from procedure 2 (500A), so it is arranged on the right side of procedure 2 (500A).
- procedure 4 (510A) and procedure 5 (510B) the data range is selected from the data in procedure 3 (500B). An inequality indicating is also displayed.
- FIG. 5 shows an example of display in a branch format
- other display formats such as a list format and a flow chart format are also conceivable.
- the operator when the operator performs factor analysis, when the operator selects data on one graph displayed on the input/output device 100, the relation of another graph displayed on the display data is displayed. It also records operation information, and displays operation details and operation procedures as guidance. Therefore, it becomes easy to visualize the correlation of the data of the plurality of graphs displayed on the input/output device 100, and by suppressing the mixing of erroneous data, it is possible to reduce the number of occurrences of reworking and the like. Thereby, the operator's workload in data analysis can be reduced.
- Embodiment 1 has shown the plant operation support device capable of reducing the operator's workload in data analysis.
- Embodiment 2 shows a plant operation support device for solving the problem that it is necessary to repeatedly switch display data in the process in which an operator searches for data necessary for factor analysis from a huge amount of measured value data.
- a display data switching unit 160 is added to the plant operation support device of the first embodiment.
- the same numbers are assigned to the same configurations as in the first embodiment, and the description thereof is omitted.
- FIG. 6 is a block diagram of a plant operation support device according to Embodiment 2 of the present disclosure.
- FIG. 7 is a diagram schematically showing an example of screen changes when display data is switched according to the second embodiment of the present disclosure.
- the display data switching unit 160 is a function that continuously switches the display of time-series changes in data displayed in graphs such as trend graphs and scatter diagrams using an animation method or the like.
- FIG. 7 two axes of measured value A and measured value B are selected, and data at each time (data 600A at time 6:00, data 600C at time 7:00, data 600B at time 8:00) are It is indicated by a black circle marker.
- data at each time data 610A at time 6:00, data 610C at time 7:00, data 610B at time 8:00
- data before switching is represented by a white marker
- movement data after switching is represented by a black marker.
- the chronological change of the data from the white marker to the black marker at each time is continuously displayed by an animation method.
- Such animation display is also realized by moving the display camera position in the three-dimensional scatter diagram.
- a three-dimensional scatter diagram having measured value A and measured value B in the plane direction and measured value C in the normal direction
- measured value A and measured value C in the plane direction and measured value B in the normal direction It means that the measured value B and the measured value C are switched so that
- Embodiment 3 In data analysis, the mean value, variance value, and correlation coefficient value in statistical analysis and the evaluation value of the objective function in optimization problems are used as a means of quantitatively expressing the distribution or characteristics of data. etc. When an operator performs work such as factor analysis, he or she may use quantitative evaluation values to add meaning to the distribution characteristics of the graph.
- Embodiment 3 shows a plant operation support measure that reduces the operator's data analysis workload in data analysis using quantitative evaluation values.
- the present embodiment is configured by adding an analysis executing means 170, an analysis result collection unit 180, and an analysis result database (DB) 230 to the plant operation support device shown in the second embodiment.
- DB analysis result database
- FIG. 8 is a block diagram of a plant operation support device according to Embodiment 3 of the present disclosure.
- FIG. 9 is a diagram schematically showing an example of a recording method of the analysis result database 230 according to the third embodiment of the present disclosure.
- FIG. 10 is an example of guidance display of the plant operation support device according to the present embodiment.
- the analysis execution means 170 is a function that calculates the distribution of the data collected by the display data collection unit 150, the correlation between the data, such as the relationship between the data.
- the correlation of the collected data is calculated by quantitative evaluation using the average value of the data and evaluation values such as regression equations.
- the analysis result collection unit 180 is a function that classifies the data correlation results calculated by the analysis execution means 170 and records them in the analysis result database 230 .
- the analysis result database 230 records analysis results relating to the correlation of data calculated by the analysis executing means 170, that is, data average values, evaluation values such as regression equations, and the like.
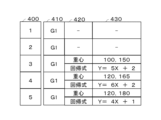
- Data selection history ID 400 , data selection ID 410 , analysis method name information 420 and analysis result information 430 are recorded in analysis result database 230 .
- the analysis method name information 420 is the analysis method used when calculating the analysis result in the analysis execution means 170, such as average value, center of gravity, regression equation, and the like.
- the analysis result information 430 is an evaluation value representing the analysis result calculated by the analysis execution means 170 using the analysis method.
- the data selection history ID 400 and the data selection ID 410 recorded in the analysis result database 230 have the same content as the data recorded in the data selection history database 220 .
- Grouping is performed by the data selection ID 410, and analysis method name information 420 and analysis result information 430 are recorded in each group.
- the center of gravity and regression equation of group 1 (G1) are calculated.
- the center of gravity and the regression equation are recalculated as the data selection range is limited in Procedures 4 and 5.
- FIG. 5 shows an example in which the data selection range is displayed by an inequality as an example of the guidance information created in the analysis procedure creation unit 130.
- the correlation of the data recorded in the analysis result database 230 Guidance display is performed on the input/output device 100 by adding an evaluation value indicating .
- FIG. 10 is an example of guidance display of the plant operation support device according to the present embodiment. By adding the evaluation values recorded in the analysis result database 230 and displaying the guidance as shown in FIG. 10, the selected data and the evaluation values for each operating procedure of the operator can be linked and displayed. Further, although FIG. 10 shows an example of display using a graph, display using character information may be performed as shown in FIG.
- the evaluation value which is the analysis result of the data correlation
- the data range selected by the operator and displaying the guidance
- the data selection range and the evaluation value are linked, and the executed data selection is performed. You will be able to quickly determine if it worked. As a result, the effect of reducing the workload of the operator in factor analysis can be obtained.
- Embodiment 4 has described the plant operation support device in which the analysis procedure creation unit 130 performs guidance display using data addition and limiting operations as delimiters.
- a plant operation support device that displays guidance by combining an evaluation value with a data selection range has been described. Evaluation values may be classified.
- This embodiment shows a plant operation support device configured by adding an analysis content classification unit 190 for classifying evaluation values to the plant operation support device of the third embodiment. The same numbers are given to the same configurations as in the third embodiment, and the description thereof is omitted.
- FIG. 11 is a block diagram of a plant operation support device according to Embodiment 4 of the present disclosure. As shown in FIG. 11, the present embodiment is configured by adding an analysis content classification unit 190 to the plant operation support device shown in the third embodiment. Analysis content classification unit 190 is configured between analysis result database 230 and data selection history database 220 and analysis procedure creation unit 130 .
- the analysis content classification unit 190 is a function that classifies the evaluation values in each operation procedure calculated by the analysis method recorded in the analysis result database 230 for each analysis method.
- the evaluation value is calculated using the center of gravity and the regression equation as the analysis method
- the evaluation value is calculated using only the center of gravity as the analysis method, and the analysis result database. 230 is recorded.
- the analysis content classification unit 190 classifies evaluation values for each analysis technique, that is, for each analysis technique name information 420 .
- the center of gravity is used as the analysis method for the evaluation values of procedures 1-3
- the center of gravity as the analysis method is the evaluation values for procedures 1 and 2 for classification.
- the evaluation value information classified for each analysis method by the analysis content classification unit 190 is divided by the data selection operation shown in FIG. It makes it easier to grasp the whole work and can be expected to improve work efficiency.
- 100 input/output device 101 processor, 102 memory, 103 display, 104 input interface, 110 data selection means, 120 selected information collection unit, 130 analysis procedure creation unit, 140 data analysis graph creation unit, 150 display data collection unit, 160 display Data switching unit, 170 Analysis execution means, 180 Analysis result collection unit, 190 Analysis content classification unit, 200 Measurement data database, 210 Data selection database, 220 Data selection history database, 230 Analysis result database, 300, 400 Data selection history ID, 310 Display data information, 320, 410 Data selection ID, 330 Data selection content information, 340 Data selection range information, 420 Analysis method name information, 430 Analysis result information, 500A to 500C Data selection procedure display, 510A to 520B Data selection range Data selection procedure display, 600A to 600C Scatter diagram display data consisting of measurement values A and B, 610A to 610C Scatter diagram display data consisting of measurement values A and C, 710 Trend graph display example, 720 Scatter diagram
Abstract
分析作業におけるオペレータの負荷を軽減することができる表示インターフェースを提供するプラント運転支援装置を得る。 プラント運転支援装置は、データ選択手段(110)、データ選択データベース(210)、計測データデータベース(200)、表示データ収集部(150)、データ分析グラフ作成部(130)を備える。データ選択データベース(210)にはデータ選択手段(110)にてオペレータが行った操作情報を記録する。データ分析グラフ作成部(130)はオペレータが選択した第一グラフのデータに関連した第二グラフのデータを表示するデータ分析グラフを作成する。
Description
本開示は、プラントにおける異常状態の検出、異常発生時の要因分析等を行うプラント運転支援装置に関する。
電力、上下水道等の大規模プラントでは、プラント全体の状況把握および異常状態の早期検出を目的とし、監視制御システムを構築する場合が多い。監視制御システムは、プラントの各設備に付帯するセンサを通じて計測された計測値を収集し、中央監視モニターと呼ばれる表示装置上にて、一括して監視が行われている。
一般に、これらの大規模プラントは複数の製造工程が組み合わさって構成されており、ある設備の出力変化が上工程および下工程に順次波及する等複雑な挙動を示すことが知られている。そのため、オペレータは監視制御システムが発報するアラームの有無に留まらず、計測値の変化等を俯瞰し、また複数の計測値と比較することにより異常発生を検知している。
また、オペレータおよび設備管理者が担う業務の一つとして、異常が発生した場合の要因分析がある。要因分析とはプラントが異常な振る舞いを起こす根源的な要因を調査するものである。具体的には監視制御システムが収集した計測値データを統計解析等の手法を用いて分析することにより、異常状態の有無および異常伝搬の関係性等を定量的に評価するものである。
例えば要因分析を支援するための手法として、事前に登録された演算手法に従い、現在のプラントが正常か異常かの判断となる閾値を自動算出する手法が開示されている。(例えば、特許文献1参照)
例えば要因分析を支援するための手法として、事前に登録された演算手法に従い、現在のプラントが正常か異常かの判断となる閾値を自動算出する手法が開示されている。(例えば、特許文献1参照)
プラント壁面の劣化、フィルタの目詰まり等、センサによる直接的な計測ができない事象は、装置全体の計測値変化、異常状態の伝搬状況等から原因を推定する必要がある。そのため、上記した事前に登録された演算手法に従い自動で閾値を算出する手法では、センサによる直接的な計測ができない発生事例の少ない事象が発生した際に正確に異常状態を検出することができない可能性がある。
このような検出方法が確立されていない事象はオペレータの手作業による分析が必要となり、膨大なデータから要因の判別を行うためには高い分析技術および多くの労力を要する。
本開示は上述のような課題を解決するためになされたものであり、分析作業におけるオペレータの負荷を軽減することができる表示インターフェースを提供することを目的としている。
本開示にかかるプラント運転支援装置は、オペレータが操作するディスプレイ上に表示された第一グラフと第二グラフにおいて、オペレータが第一グラフの任意のデータ範囲を選択するデータ選択手段と、データ選択手段にて行ったデータ範囲の選択を含むオペレータの操作情報を記録するデータ選択データベースと、計測装置により計測した計測データを蓄積する計測データデータベースと、データ選択データベースに記録された操作情報とオペレータが任意に選択した計測データデータベースに蓄積された計測データとを収集する表示データ収集部と、オペレータが選択した第一グラフのデータに関連した第二グラフのデータを表示するデータ分析グラフを作成するデータ分析グラフ作成部とを備えたものである。
本開示のプラント運転支援装置によれば、検出方法が確立していないプラントで発生した事象に対して要因分析を行う際の、分析作業におけるオペレータの負荷を軽減することができるという効果を有する。
以下に、実施の形態を図面に基づいて詳細に説明する。なお、以下に説明する実施の形態は例示である。また、各実施の形態は、適宜組み合わせて実行することができる。
実施の形態1.
図1は本開示の実施の形態1にかかるプラント運転支援装置のブロック図である。図2は本開示の実施の形態1にかかるプラント運転支援装置のハードウェア構成図である。図3は本開示の実施の形態1にかかるデータ選択履歴データベースの記録方式を模式的に表した一例を示す図である。図4は本開示の実施の形態1にかかるデータ分析グラフ作成部にて作成したデータ分析グラフの表示例を示した図である。図5は本開示の実施の形態1にかかる分析手順作成部におけるガイダンス表示を模式的に表した一例を示す図である。
図1は本開示の実施の形態1にかかるプラント運転支援装置のブロック図である。図2は本開示の実施の形態1にかかるプラント運転支援装置のハードウェア構成図である。図3は本開示の実施の形態1にかかるデータ選択履歴データベースの記録方式を模式的に表した一例を示す図である。図4は本開示の実施の形態1にかかるデータ分析グラフ作成部にて作成したデータ分析グラフの表示例を示した図である。図5は本開示の実施の形態1にかかる分析手順作成部におけるガイダンス表示を模式的に表した一例を示す図である。
図1に示すプラント運転支援装置は、グラフを表示する入出力装置100と、グラフの任意のデータ範囲を選択するデータ選択手段110と、操作情報を収集する選択情報収集部120と、収集した操作情報を記録するデータ選択データベース(DB)210およびデータ選択履歴データベース(DB)220と、計測装置により計測した計測データを蓄積する計測データデータベース(DB)200と、データ選択データベース210に記録された操作情報および計測データデータベース200に蓄積された計測データを収集する表示データ収集部150と、選択したデータに関連した別のグラフのデータが表示されるデータ分析グラフを作成するデータ分析グラフ作成部140と、データ選択履歴データベース220に記録された操作情報の履歴を基に、ガイダンスを作成する分析手順作成部130とを備えている。
図2は、プラント運転支援装置のハードウェア構成図である。プラント運転支援装置は、CPU(Control Processing Unit)などのプロセッサ101、RAM(Random Access Memory)などのメモリ102、ディスプレイ103および入力インターフェース(I/F)104を備えて構成される。選択情報収集部120、分析手順作成部130、データ分析グラフ作成部140および表示データ収集部150は、プロセッサ111がメモリ102に格納されたプログラムを実行することによって実現する。ただし、これらは、例えば複数のプロセッサ101が連携して実現されても良い。
データ選択手段110は入出力装置100上に表示されたグラフにおいて、マウス操作等によりオペレータが着目するデータを任意に選択する機能である。ここでいうグラフはトレンドグラフ、散布図等オペレータがデータを任意に選択して要因分析を行えるグラフであれば種類は問わず、表示するグラフの数も問わない。また、グラフを表示する入出力装置100は、グラフを表示可能な表示装置、表示インターフェース等であればよい。
オペレータは、着目するトレンドグラフ上の任意の期間、上下限値等を、マウス操作を行うことにより直接指定する。また、散布図上のオペレータが着目するデータ範囲をマウス操作することにより、直接指定することができる。
オペレータのグラフ上の任意のデータを選択する操作手段として、マウス操作を例に挙げたが、閾値、不等式等の数式を入力することでもデータ範囲を指定できる。また他にも、トレンドグラフにおける表示期間および散布図における最大および最小の表示範囲等、グラフ表示に関する一連の設定操作を含む。
データ選択データベース210には、オペレータがデータ選択手段110にて行った、グラフ上のデータ範囲の選択を含む操作情報を選択情報収集部120に収集し、選択情報収集部120に収集された操作情報が記録される。選択情報収集部120にて収集されたオペレータの操作情報は、データ選択データベース210およびデータ選択履歴データベース220に記録されるが、データ選択データベース210にはオペレータが行った最新の操作情報のみが記録される。
例を挙げて説明をする。オペレータがマウスカーソル操作によりグラフ上のデータ範囲を選択した場合、選択情報収集部120においては選択したデータのIDおよび期間を抽出し、選択したデータ範囲を式に変換し収集する。そして、収集した操作情報をデータ選択データベース210に記録する。例えば、計測値Aの値が50を超える範囲を選択した場合、不等式A>50がデータ選択データベース210に記録される。
データ選択履歴データベース220は、オペレータが行ったデータ選択操作情報の履歴を記録しておく機能である。図3は、データ選択履歴データベース220に記録されるデータ選択情報について模式的に表した図である。
データ選択情報とは、表示データ情報310、データ選択ID320、データ選択内容情報330、データ選択範囲情報340から構成され、データ選択履歴データベース220にデータ選択履歴ID300とともに記録されるものである。表示データ情報310はトレンドグラフ、散布図等のグラフの表示に用いられる計測値を登録するものである。
データ選択ID320は、オペレータがグラフ上において選択したデータをグループとして管理するものである。例を挙げて説明をすると、グラフ上の異なるデータを複数選択した場合はG1、G2というようにグループ分けをし、登録内容がそれぞれ記録される。
データ選択内容情報330およびデータ選択範囲情報340は、データ選択ID320が記録したグループそれぞれが、グラフ上のどのデータのどの範囲を指定したか、すなわち選択したデータ情報を記録するものである。図4を用いて説明をする。図4では計測値Aおよび計測値Bが表示されたトレンドグラフと、計測値Aを縦軸、計測値Bを横軸に持つ散布図が入出力装置100上に表示されているとする。オペレータがトレンドグラフ上の網掛けされた範囲を指定した場合、表示データ情報310には計測値Aおよび計測値Bが記録され、データ選択内容情報330には計測値Aおよび計測値Bが記録される。データ選択範囲情報340には、散布図上のオペレータが選択した範囲に該当する不等式が記録される。
計測データデータベース200は、計測装置により計測した計測データを蓄積しておく機能である。計測装置はプラントの状態を計測できる機器もしくは手段であればなんでもよい。
表示データ収集部150は、データ選択データベース210に記録されたオペレータの最新の操作情報と計測データデータベース200に蓄積された計測データとを収集する機能である。
データ分析グラフ作成部140は表示データ収集部150により収集したデータを用いて、入出力装置100上に表示されたグラフ上の任意のデータをオペレータが選択した際に、その選択したデータに関連した他のグラフのデータが表示されるデータ分析グラフを作成する機能である。図4はデータ分析グラフ作成部140にて作成したデータ分析グラフの表示例を示した図である。
図4を用いて説明をする。入出力装置100上には、トレンドグラフと散布図が表示されている。トレンドグラフには計測値A、計測値Bの二つの計測データが表示されていて、散布図には計測値Aを縦軸、計測値Bを横軸に持つグラフが表示されている。オペレータがトレンドグラフの網掛け部分を選択すると、選択したデータ種別、時間帯等の操作情報がデータ選択データベース210に記録される。一方散布図は、データ選択データベース210に記録された操作情報を参照して、オペレータが選択したデータに関連するデータ(マーカ)の表示色を変更し、強調表示する。図4の散布図では、白抜きマーカが強調表示されている。
逆にオペレータが散布図における任意のデータ(マーカ)を選択した場合、データ選択データベース210には計測値A、計測値Bにおける選択範囲が記録される。トレンドグラフは、データ選択データベース210に記録された選択範囲に従い、該当する時間帯の表示色を変更し、強調表示する。
図4では、選択したデータに関連する別のグラフのデータを色の変更により表示する例を示したが、色の変更による表示に限らない。選択したデータに関連した別のグラフのデータが強調して表示されるのであればよく、例えばデータを点滅させるように表示する等方法は問わない。
以上のように、データ選択データベース210に記録された操作情報を基に、オペレータが入出力装置100上に表示されたグラフのグラフ上のデータを選択した場合、選択したデータに関連した別のグラフのデータも表示することができる。これにより、選択したデータに対応した別グラフのデータを瞬時に確認することができるため、分析におけるオペレータの作業負荷を軽減することができる。
分析手順作成部130は、データ選択履歴データベース220に記録された操作情報の履歴を基にガイダンスを作成し入出力装置100にガイダンス表示するものである。図5は分析手順作成部130において、データ選択履歴データベース220に記録されたデータ選択情報の履歴を基に分析した手順を作成し模式的に示したものである。本発明におけるガイダンス表示とは、データ選択履歴データベース220に記録されたデータの選択手順および選択操作内容を示すガイダンス情報を入出力装置100上に表示することである。
図3では、手順1において計測値B、計測値Cの表示、手順2において計測値A、計測値B、計測値Cの表示、手順3において計測値A、計測値Cの表示が行われたことが示されている。手順4においては、計測値Aおよび計測値Cの表示かつ計測値A>50および計測値C>50のエリアのデータ範囲を選択したことが示されている。手順5においては、計測値Aおよび計測値Cの表示かつ計測値A>50および計測値C>90をデータ範囲選択したことが示されている。
一方、図5では、データの追加表示を行ったという操作は左側、データの限定表示を行ったという操作は右側に配置し、操作情報を分岐形式により表示を行っている。具体的に図5を用いて説明すると、手順1(500C)からスタートし、手順2(500A)においては計測値Aを新たに追加しているため、手順1(表示500C)の左側に配置をする。手順3(500B)においては、手順2(500A)から計測値Bを削除する操作を行ったため、手順2(500A)の右側に配置している。手順4(510A)および手順5(510B)においては、手順3(500B)のデータの中からデータ範囲を選択するという操作であるため、手順3(500B)の右側にそれぞれ配置し、データ選択範囲を示す不等式を併せて表示している。
図5では分枝形式による表示例を示したが、この他にもリスト形式、フローチャート形式等の表示も考えられる。以上のように、オペレータが実施した分析操作の操作手順について、データの追加および限定操作を区切りとして作業を分類し、操作内容および操作手順を可視化することができる。これによりオペレータは、分析操作をどのような視点で進めようとしていたかの状況把握が理解しやすくなるとともに、分析の網羅性を向上し、分析作業における作業重複を回避することができるという効果を得る。
以上より本実施の形態においては、オペレータが要因分析を行う際に、オペレータは入出力装置100上に表示された1つのグラフ上のデータを選択すると、ディスプレイ上に表示された別のグラフの関連するデータが表示される。また操作情報を記録し、操作内容および操作手順をガイダンス表示する。したがって、入出力装置100上に表示された複数のグラフのデータの相関関係が可視化しやすくなり、誤ったデータの混入を抑制することにより、手戻り等の発生回数を削減することができる。それにより、データ分析におけるオペレータの作業負荷を軽減することができる。
実施の形態2.
実施の形態1では、データ分析におけるオペレータの作業負荷を軽減することのできるプラント運転支援装置を示した。実施の形態2では、膨大な計測値データの中からオペレータが要因分析に必要なデータを探し出す過程において表示データを繰り返し切り替える必要があるという課題を解決するためのプラント運転支援装置を示す。具体的には実施の形態1のプラント運転支援装置に表示データ切替部160を追加して構成されている。実施の形態1と同じ構成には同じ番号を付し、説明は省略する。
実施の形態1では、データ分析におけるオペレータの作業負荷を軽減することのできるプラント運転支援装置を示した。実施の形態2では、膨大な計測値データの中からオペレータが要因分析に必要なデータを探し出す過程において表示データを繰り返し切り替える必要があるという課題を解決するためのプラント運転支援装置を示す。具体的には実施の形態1のプラント運転支援装置に表示データ切替部160を追加して構成されている。実施の形態1と同じ構成には同じ番号を付し、説明は省略する。
本実施の形態を、図6および図7を用いて説明をする。図6は、本開示の実施の形態2にかかるプラント運転支援装置のブロック図である。図7は、本開示の実施の形態2にかかる表示データ切り替え時の画面変化を模式的に表した一例を示す図である。
表示データ切替部160は、トレンドグラフ、散布図等のグラフに表示されたデータの時系列変化を、アニメーション手法等を用いて連続的に表示を切り替える機能である。
図7を用いて詳細を説明する。図7には、計測値Aと計測値Bの2つの軸が選択され、各時刻におけるデータ(時刻6:00はデータ600A、時刻7:00はデータ600C、時刻8:00はデータ600B)が黒丸のマーカにより表示されている。オペレータが、横軸に関するデータを計測値Bから計測値Cに切り替える操作を行うと、各時刻におけるデータ(時刻6:00はデータ610A、時刻7:00はデータ610C、時刻8:00はデータ610B)の位置が変化する。このときに、切り替え前のデータを白色のマーカで表し、切り替え後の移動データを黒色のマーカで表す。この各時刻における、白色のマーカから黒色のマーカへのデータの時系列変化をアニメーション手法により連続的に表示を行う。
図7では、時刻6:00および時刻7:00のマーカは右方向に移動したのに対し、時刻8:00のマーカは左方向に移動していることがアニメーション手法により連続的に表示されていることが示されている。これにより、時刻8:00がその他のデータと異なる動きをしていることより外れ値であると理解することができる。
また、このようなアニメーション表示は、3次元散布図において、表示カメラ位置を移動させることによっても実現される。例を挙げると、計測値Aおよび計測値Bを平面方向、計測値Cを法線方向に持つ3次元散布図において、計測値Aおよび計測値Cを平面方向、計測値Bを法線方向となるように、計測値Bおよび計測値Cを切り替えるということである。
以上よりアニメーション手法を用いることにより、表示データを切り替える作業を不要としデータの切り替え操作によってどのような時系列変化が生じたかの理解を容易にする効果を得ることができる。
実施の形態3.
データ分析においては、データがどのような分布または特徴を持つかについて、定量的に表現する手段として、統計解析における平均値、分散値、相関係数の値および最適化問題における目的関数の評価値等がある。オペレータが要因分析等の作業を行う場合、グラフの分布上の特徴と併せ、定量評価値を用いた意味付けを用いる場合がある。
データ分析においては、データがどのような分布または特徴を持つかについて、定量的に表現する手段として、統計解析における平均値、分散値、相関係数の値および最適化問題における目的関数の評価値等がある。オペレータが要因分析等の作業を行う場合、グラフの分布上の特徴と併せ、定量評価値を用いた意味付けを用いる場合がある。
実施の形態3では、定量評価値を用いたデータ分析におけるオペレータのデータ分析作業の作業負荷を軽減させるプラント運転支援措置を示す。本実施の形態は、実施の形態2に示したプラント運転支援装置に分析実行手段170、分析結果収集部180、分析結果データベース(DB)230を追加して構成されている。実施の形態2と同じ構成には同じ番号を付し、説明は省略する。
本実施の形態は、図8から図10を用いて説明をする。図8は、本開示の実施の形態3にかかるプラント運転支援装置のブロック図である。図9は、本開示の実施の形態3にかかる分析結果データベース230の記録方式を模式的に表した一例を示す図である。図10は、本実施の形態にかかるプラント運転支援装置のガイダンス表示例である。
分析実行手段170は、表示データ収集部150にて収集したデータの分布、データの関係性等のデータ間の相関関係について算出をする機能である。収集したデータの相関関係は、データの平均値、回帰式等の評価値を用いて定量的評価により算出する。
分析結果収集部180は、分析実行手段170にて算出したデータの相関関係結果を分類して分析結果データベース230に記録する機能である。分析結果データベース230は、分析実行手段170において算出したデータの相関関係に関する分析結果すなわちデータの平均値、回帰式等の評価値を記録する。分析結果データベース230には、データ選択履歴ID400、データ選択ID410、分析手法名称情報420および分析結果情報430が記録される。
図9を用いて説明をする。分析手法名称情報420は、分析実行手段170において分析結果を算出する際に用いた分析手法のことであり、例えば平均値、重心、回帰式等である。分析結果情報430は、分析実行手段170において分析手法を用いて算出された分析結果を表す評価値のことである。
分析結果データベース230に記録されるデータ選択履歴ID400およびデータ選択ID410は、データ選択履歴データベース220に記録されているデータと同一の内容が記録されている。データ選択ID410によりグループ分けが行われ、各グループに分析手法名称情報420および分析結果情報430が記録される。図9に示す例では、手順3―5(データ選択履歴ID400 3―5)において、グループ1(G1)の重心および回帰式が算出されている。手順4、手順5とデータの選択範囲が限定されるにつれて、重心および回帰式が再計算されている。
図5では、分析手順作成部130において作成したガイダンス情報の例として、データ選択範囲を不等式により表示する例を示したが、本実施の形態では、分析結果データベース230に記録されたデータの相関関係を示す評価値を追加して入出力装置100にガイダンス表示を行う。図10は本実施の形態にかかるプラント運転支援装置のガイダンス表示例である。図10に示すように分析結果データベース230に記録された評価値を追加してガイダンス表示を行うことにより、オペレータの操作手順毎の選択したデータと評価値を紐づけて表示することができる。また、図10ではグラフによる表示例を示したが図5のように文字情報による表示を行ってもよい。
以上のように、データの相関関係に関する分析結果である評価値を、オペレータの選択したデータ範囲と組み合わせてガイダンス表示することにより、データの選択範囲と評価値を紐づけし、実施したデータ選択が有効であったかを素早く判断できるようになる。これにより、オペレータの要因分析における作業負荷を軽減させるという効果が得られる。
実施の形態4.
実施の形態1では、分析手順作成部130によって、データの追加および限定操作を区切りとしてガイダンス表示をするプラント運転支援装置について述べた。実施の形態3では、評価値をデータ選択範囲と組み合わせてガイダンス表示するプラント運転支援装置について述べたが、詳細分析を進める過程において、データ選択範囲との組み合わせだけでなく、用いた分析手法ごとに評価値を分類する場合がある。
本実施の形態は、実施の形態3のプラント運転支援装置に、評価値を分類する分析内容分類部190を追加した構成から成るプラント運転支援装置を示す。実施の形態3と同じ構成には同じ番号を付し、説明は省略する。
実施の形態1では、分析手順作成部130によって、データの追加および限定操作を区切りとしてガイダンス表示をするプラント運転支援装置について述べた。実施の形態3では、評価値をデータ選択範囲と組み合わせてガイダンス表示するプラント運転支援装置について述べたが、詳細分析を進める過程において、データ選択範囲との組み合わせだけでなく、用いた分析手法ごとに評価値を分類する場合がある。
本実施の形態は、実施の形態3のプラント運転支援装置に、評価値を分類する分析内容分類部190を追加した構成から成るプラント運転支援装置を示す。実施の形態3と同じ構成には同じ番号を付し、説明は省略する。
図11は本開示の実施の形態4にかかるプラント運転支援装置のブロック図である。図11に示すように本実施の形態は、実施の形態3に示したプラント運転支援装置に分析内容分類部190を追加した形式により構成される。分析内容分類部190は分析結果データベース230およびデータ選択履歴データベース220と分析手順作成部130との間に構成される。
分析内容分類部190は、分析結果データベース230に記録された分析手法により算出された各操作手順における評価値を、分析手法毎に分類する機能である。例を挙げて説明をすると、手順1および手順2では、分析手法として重心および回帰式を用いて評価値が算出され、手順3では分析手法として重心のみを用いて評価値が算出され分析結果データベース230に記録されていたとする。分析内容分類部190では、分析手法毎すなわち分析手法名称情報420毎に評価値を分類する。つまり、分析手法に重心を用いたのは手順1-3の評価値、分析手法に重心を用いたのは手順1および手順2の評価値と分類をするということである。
このように、分析結果データベース230に記録された分析手法名称情報420を相互に比較することにより、どの手順において分析手法が切り替わったのかを判断しやすくなる。分析内容分類部190により分析手法毎に分類された評価値の情報は、図5に示したデータ選択操作による区切りに加え、分析手法の選択操作による区切りを用いてガイダンス表示を行うことにより、分析作業の全体を把握しやすくなり作業効率の向上が期待できる。
以上のように分析手順を表示する際、データ選択操作に加え、分析内容の変更操作と組み合わせて分類を行うことにより、オペレータがどのデータを選択し、どのような分析手法を用いて定量的評価を行ったのか、一連の分析作業を網羅的に把握することが可能となる。これにより、オペレータは任意のタイミングにおいて過去の分析操作を振り返ることができ、過去の作業内容および傾向を総合的に理解することができる。
100 入出力装置、101 プロセッサ、102 メモリ、103 ディスプレイ、104 入力インターフェース、110 データ選択手段、120 選択情報収集部、130 分析手順作成部、140 データ分析グラフ作成部、150 表示データ収集部、160 表示データ切替部、170 分析実行手段、180 分析結果収集部、190 分析内容分類部、200 計測データデータベース、210 データ選択データベース、220 データ選択履歴データベース、230 分析結果データベース、300、400 データ選択履歴ID、310 表示データ情報、320、410 データ選択ID、330 データ選択内容情報、340 データ選択範囲情報、420 分析手法名称情報、430 分析結果情報、500A~500C データ選択手順表示、510A~520B データ選択範囲を伴うデータ選択手順表示、600A~600C 計測値Aおよび計測値Bからなる散布図表示データ、610A~610C 計測値Aおよび計測値Cからなる散布図表示データ、710 トレンドグラフ表示例、720 散布図
Claims (6)
- オペレータが操作するディスプレイ上に表示された第一グラフと第二グラフにおいて、前記オペレータが前記第一グラフの任意のデータ範囲を選択するデータ選択手段と、
前記データ選択手段にて行った前記データ範囲の選択を含む前記オペレータの操作情報を記録するデータ選択データベースと、
計測装置により計測した計測データを蓄積する計測データデータベースと、
前記データ選択データベースに記録された前記操作情報と前記計測データデータベースに蓄積された前記計測データとを収集する表示データ収集部と、
前記オペレータが選択した前記第一グラフのデータに関連した前記第二グラフのデータを表示するデータ分析グラフを作成するデータ分析グラフ作成部と、
を備えるプラント運転支援装置。 - 前記データ選択手段にて行った前記操作情報の履歴を記録するデータ選択履歴データベースと、
前記データ選択履歴データベースに記録された前記履歴のガイダンスを作成する分析手順作成部と、
を備える請求項1に記載のプラント運転支援装置。 - 前記表示データ収集部にて収集したデータの相関関係を算出する分析実行手段と、
前記分析実行手段にて算出した分析結果を分析結果データベースに記録する分析結果収集部と、
を備える請求項2に記載のプラント運転支援装置。 - 前記分析手順作成部は前記データ選択履歴データベースに記録された前記操作情報と前記分析結果データベースに記録された前記分析結果とを収集し紐づけしてガイダンス表示することを特徴とする請求項3に記載のプラント運転支援装置。
- 前記分析結果データベースに記録された前記分析結果を分析手法毎に分類する分析内容分類部と、
を備える請求項3または4に記載のプラント運転支援装置。 - データの時系列変化をアニメーション手法により連続的に表示する表示データ切替部と、
を備える請求項1から5のいずれか一項に記載のプラント運転支援装置。
Priority Applications (2)
| Application Number | Priority Date | Filing Date | Title |
|---|---|---|---|
| JP2022536552A JP7173414B1 (ja) | 2021-10-19 | 2021-10-19 | プラント運転支援装置 |
| PCT/JP2021/038640 WO2023067702A1 (ja) | 2021-10-19 | 2021-10-19 | プラント運転支援装置 |
Applications Claiming Priority (1)
| Application Number | Priority Date | Filing Date | Title |
|---|---|---|---|
| PCT/JP2021/038640 WO2023067702A1 (ja) | 2021-10-19 | 2021-10-19 | プラント運転支援装置 |
Publications (1)
| Publication Number | Publication Date |
|---|---|
| WO2023067702A1 true WO2023067702A1 (ja) | 2023-04-27 |
Family
ID=84082874
Family Applications (1)
| Application Number | Title | Priority Date | Filing Date |
|---|---|---|---|
| PCT/JP2021/038640 WO2023067702A1 (ja) | 2021-10-19 | 2021-10-19 | プラント運転支援装置 |
Country Status (2)
| Country | Link |
|---|---|
| JP (1) | JP7173414B1 (ja) |
| WO (1) | WO2023067702A1 (ja) |
Citations (4)
| Publication number | Priority date | Publication date | Assignee | Title |
|---|---|---|---|---|
| JP2000172319A (ja) * | 1998-12-02 | 2000-06-23 | Toshiba Corp | 故障時対応ガイダンス装置 |
| JP2007193512A (ja) * | 2006-01-18 | 2007-08-02 | Mitsubishi Electric Corp | プラント運転支援装置 |
| JP2012138044A (ja) * | 2010-12-28 | 2012-07-19 | Toshiba Corp | プロセス状態監視装置 |
| JP2013008234A (ja) * | 2011-06-24 | 2013-01-10 | Omron Corp | データ比較装置、データ比較方法、制御プログラムおよび記録媒体 |
-
2021
- 2021-10-19 WO PCT/JP2021/038640 patent/WO2023067702A1/ja active Application Filing
- 2021-10-19 JP JP2022536552A patent/JP7173414B1/ja active Active
Patent Citations (4)
| Publication number | Priority date | Publication date | Assignee | Title |
|---|---|---|---|---|
| JP2000172319A (ja) * | 1998-12-02 | 2000-06-23 | Toshiba Corp | 故障時対応ガイダンス装置 |
| JP2007193512A (ja) * | 2006-01-18 | 2007-08-02 | Mitsubishi Electric Corp | プラント運転支援装置 |
| JP2012138044A (ja) * | 2010-12-28 | 2012-07-19 | Toshiba Corp | プロセス状態監視装置 |
| JP2013008234A (ja) * | 2011-06-24 | 2013-01-10 | Omron Corp | データ比較装置、データ比較方法、制御プログラムおよび記録媒体 |
Also Published As
| Publication number | Publication date |
|---|---|
| JPWO2023067702A1 (ja) | 2023-04-27 |
| JP7173414B1 (ja) | 2022-11-16 |
Similar Documents
| Publication | Publication Date | Title |
|---|---|---|
| US11275357B2 (en) | Event analyzing device, event analyzing system, event analyzing method, and non-transitory computer readable storage medium | |
| JP5868784B2 (ja) | プロセス監視システム及び方法 | |
| JP5875726B1 (ja) | 異常予兆診断装置のプリプロセッサ及びその処理方法 | |
| JP5778087B2 (ja) | プロセス監視システム及び方法 | |
| WO2010032701A1 (ja) | 運用管理装置、運用管理方法、および運用管理プログラム | |
| KR101233264B1 (ko) | 섹터 그래프 기반 플랜트 및 건축물 설비 운영상태 감시 장치 및 방법 | |
| JP4046309B2 (ja) | プラント監視装置 | |
| US20110209083A1 (en) | Process analysis system | |
| JP6708203B2 (ja) | 情報処理装置、情報処理方法、及び、プログラム | |
| CN114551271A (zh) | 监测机台运行状况的方法及装置、存储介质及电子设备 | |
| WO2022038804A1 (ja) | 診断装置及びパラメータ調整方法 | |
| CN116224137A (zh) | 一种ups设备故障预警方法及系统 | |
| CN115372816A (zh) | 基于数据分析的配电开关设备运行故障预测系统及方法 | |
| JP2014078209A (ja) | マルチ・コンディション・モニターを用いた状態監視方法および状態監視装置システム | |
| KR101281460B1 (ko) | 통계적 공정 관리도를 이용하여 이상증후를 탐지하는 방법 | |
| KR102266182B1 (ko) | 복수의 시계열 데이터의 모니터링 방법 및 장치 | |
| WO2023067702A1 (ja) | プラント運転支援装置 | |
| JP6052177B2 (ja) | 監視装置、監視方法およびプログラム | |
| JP2017215881A (ja) | プラント監視制御システム | |
| CN115640860B (zh) | 一种工业云服务的机电设备远程维护方法及系统 | |
| JP2002015000A (ja) | 多変数時系列データ類似度判定装置 | |
| CN112114578B (zh) | 一种多工序多变量过程在线监控和异常源诊断的稳健方法 | |
| JPH0784636A (ja) | プロセスデータ収集・監視方法及び装置 | |
| CN109828146A (zh) | 一种通过设备电参数ad采样判断设备工况的方法 | |
| JP6422667B2 (ja) | 施設管理装置および方法 |
Legal Events
| Date | Code | Title | Description |
|---|---|---|---|
| WWE | Wipo information: entry into national phase |
Ref document number: 2022536552 Country of ref document: JP |
|
| 121 | Ep: the epo has been informed by wipo that ep was designated in this application |
Ref document number: 21961355 Country of ref document: EP Kind code of ref document: A1 |