WO2023032436A1 - 医用画像処理装置、医用画像処理方法及びプログラム - Google Patents
医用画像処理装置、医用画像処理方法及びプログラム Download PDFInfo
- Publication number
- WO2023032436A1 WO2023032436A1 PCT/JP2022/025286 JP2022025286W WO2023032436A1 WO 2023032436 A1 WO2023032436 A1 WO 2023032436A1 JP 2022025286 W JP2022025286 W JP 2022025286W WO 2023032436 A1 WO2023032436 A1 WO 2023032436A1
- Authority
- WO
- WIPO (PCT)
- Prior art keywords
- image
- seconds
- processing apparatus
- contrast
- image processing
- Prior art date
- Legal status (The legal status is an assumption and is not a legal conclusion. Google has not performed a legal analysis and makes no representation as to the accuracy of the status listed.)
- Ceased
Links
Images







Classifications
-
- A—HUMAN NECESSITIES
- A61—MEDICAL OR VETERINARY SCIENCE; HYGIENE
- A61B—DIAGNOSIS; SURGERY; IDENTIFICATION
- A61B6/00—Apparatus or devices for radiation diagnosis; Apparatus or devices for radiation diagnosis combined with radiation therapy equipment
- A61B6/48—Diagnostic techniques
- A61B6/481—Diagnostic techniques involving the use of contrast agents
-
- A—HUMAN NECESSITIES
- A61—MEDICAL OR VETERINARY SCIENCE; HYGIENE
- A61B—DIAGNOSIS; SURGERY; IDENTIFICATION
- A61B6/00—Apparatus or devices for radiation diagnosis; Apparatus or devices for radiation diagnosis combined with radiation therapy equipment
- A61B6/02—Arrangements for diagnosis sequentially in different planes; Stereoscopic radiation diagnosis
- A61B6/03—Computed tomography [CT]
-
- A—HUMAN NECESSITIES
- A61—MEDICAL OR VETERINARY SCIENCE; HYGIENE
- A61B—DIAGNOSIS; SURGERY; IDENTIFICATION
- A61B6/00—Apparatus or devices for radiation diagnosis; Apparatus or devices for radiation diagnosis combined with radiation therapy equipment
- A61B6/02—Arrangements for diagnosis sequentially in different planes; Stereoscopic radiation diagnosis
- A61B6/03—Computed tomography [CT]
- A61B6/032—Transmission computed tomography [CT]
-
- G—PHYSICS
- G06—COMPUTING OR CALCULATING; COUNTING
- G06T—IMAGE DATA PROCESSING OR GENERATION, IN GENERAL
- G06T7/00—Image analysis
- G06T7/0002—Inspection of images, e.g. flaw detection
- G06T7/0012—Biomedical image inspection
-
- G—PHYSICS
- G06—COMPUTING OR CALCULATING; COUNTING
- G06T—IMAGE DATA PROCESSING OR GENERATION, IN GENERAL
- G06T7/00—Image analysis
- G06T7/0002—Inspection of images, e.g. flaw detection
- G06T7/0012—Biomedical image inspection
- G06T7/0014—Biomedical image inspection using an image reference approach
- G06T7/0016—Biomedical image inspection using an image reference approach involving temporal comparison
-
- G—PHYSICS
- G16—INFORMATION AND COMMUNICATION TECHNOLOGY [ICT] SPECIALLY ADAPTED FOR SPECIFIC APPLICATION FIELDS
- G16H—HEALTHCARE INFORMATICS, i.e. INFORMATION AND COMMUNICATION TECHNOLOGY [ICT] SPECIALLY ADAPTED FOR THE HANDLING OR PROCESSING OF MEDICAL OR HEALTHCARE DATA
- G16H30/00—ICT specially adapted for the handling or processing of medical images
- G16H30/20—ICT specially adapted for the handling or processing of medical images for handling medical images, e.g. DICOM, HL7 or PACS
-
- G—PHYSICS
- G16—INFORMATION AND COMMUNICATION TECHNOLOGY [ICT] SPECIALLY ADAPTED FOR SPECIFIC APPLICATION FIELDS
- G16H—HEALTHCARE INFORMATICS, i.e. INFORMATION AND COMMUNICATION TECHNOLOGY [ICT] SPECIALLY ADAPTED FOR THE HANDLING OR PROCESSING OF MEDICAL OR HEALTHCARE DATA
- G16H30/00—ICT specially adapted for the handling or processing of medical images
- G16H30/40—ICT specially adapted for the handling or processing of medical images for processing medical images, e.g. editing
-
- G—PHYSICS
- G16—INFORMATION AND COMMUNICATION TECHNOLOGY [ICT] SPECIALLY ADAPTED FOR SPECIFIC APPLICATION FIELDS
- G16H—HEALTHCARE INFORMATICS, i.e. INFORMATION AND COMMUNICATION TECHNOLOGY [ICT] SPECIALLY ADAPTED FOR THE HANDLING OR PROCESSING OF MEDICAL OR HEALTHCARE DATA
- G16H50/00—ICT specially adapted for medical diagnosis, medical simulation or medical data mining; ICT specially adapted for detecting, monitoring or modelling epidemics or pandemics
- G16H50/20—ICT specially adapted for medical diagnosis, medical simulation or medical data mining; ICT specially adapted for detecting, monitoring or modelling epidemics or pandemics for computer-aided diagnosis, e.g. based on medical expert systems
-
- G—PHYSICS
- G06—COMPUTING OR CALCULATING; COUNTING
- G06T—IMAGE DATA PROCESSING OR GENERATION, IN GENERAL
- G06T2207/00—Indexing scheme for image analysis or image enhancement
- G06T2207/20—Special algorithmic details
- G06T2207/20081—Training; Learning
-
- G—PHYSICS
- G06—COMPUTING OR CALCULATING; COUNTING
- G06T—IMAGE DATA PROCESSING OR GENERATION, IN GENERAL
- G06T2207/00—Indexing scheme for image analysis or image enhancement
- G06T2207/20—Special algorithmic details
- G06T2207/20084—Artificial neural networks [ANN]
Definitions
- the present invention relates to a medical image processing apparatus, a medical image processing method, and a program.
- dynamic contrast-enhanced CT An imaging technique called dynamic contrast-enhanced CT, which combines angiography using a contrast agent and X-ray CT, is known. After injecting the contrast agent into the subject, the subject is imaged at different times over time to obtain a plurality of three-dimensional contrast-enhanced images.
- dynamic contrast-enhanced CT may be referred to as dynamic CT, contrast-enhanced dynamic CT, or the like.
- CT is an abbreviation for Computed Tomography.
- Contrast-enhanced images obtained from imaging using dynamic contrast-enhanced CT vary greatly in appearance depending on the contrast-enhancement state, such as the contrast-enhanced time phase. is.
- Patent Document 1 describes an image discrimination device that automatically discriminates whether an image is a contrast-enhanced image or a non-contrast-enhanced image.
- the apparatus described in the document detects a region of a first site that is not affected by the contrast agent from the acquired image data, and has a prescribed relative positional relationship with respect to the first site, and the first site that is affected by the contrast agent is detected. Two regions are specified, and whether or not the image data is contrast-enhanced is determined according to whether or not the CT value of the second region is higher than a specified value.
- Patent Document 2 describes an image processing device that extracts a specific region from a three-dimensional medical image.
- the device described in the document acquires time information related to the imaging time of the medical image from the input volume data of the medical image, and estimates the contrast-enhanced time phase of the medical image based on the acquired time information.
- the device obtains the time information including the injection time of the contrast agent and the imaging time from the tag called the DICOM header attached to the medical image.
- DICOM is an abbreviation for Digital Imaging and COmmunication in Medicine.
- Non-Patent Document 1 describes an automatic algorithm for phase labeling that depends on the intensity change of an anatomical region according to the propagation of a contrast agent.
- the method described in the document detects a specific region and determines the contrast enhancement time phase of the detected region based on the histogram in the detected region. Specifically, the method described in the document automatically determines whether the contrast-enhanced image of the liver is in pre-contrast, arterial phase, portal vein phase, or parallel phase.
- the DICOM tag does not contain the information on the shooting time, etc., or the information on the shooting time, etc. included in the DICOM tag is incorrect. In such a case, it is difficult to obtain accurate information related to the shooting time, etc., and a method other than the method based on the information contained in the DICOM tag is required.
- Patent Document 1 determines whether the acquired image data is a contrast-enhanced image or a non-contrast-enhanced image, and it is difficult to estimate temporal information in the contrast-enhanced image.
- Patent Literature 2 acquires information about the imaging time and the like of medical images from the DICOM header. If the DICOM header does not contain the information about the imaging time, etc., it is difficult to obtain the information about the imaging time of the medical image. Also, if the information about the shooting time included in the DICOM header is wrong, the acquired information about the shooting time cannot be used.
- Non-Patent Document 1 when generating a classifier that uses a learning-based identification algorithm, it is necessary to manually generate teacher data for the classifier.
- the contrast enhancement state may change for each examination protocol, it is difficult to add image data using different examination protocols to the learning data. Furthermore, since the definition of the imaging state differs for each organ, the imaging state is fixed for each organ, making it difficult to change the imaging state.
- An object is to provide an apparatus, a medical image processing method, and a program.
- a medical image processing apparatus includes one or more processors and one or more memories in which programs to be executed by the one or more processors are stored. , receives an input of an image generated by performing contrast imaging, and estimates the elapsed time from the start of contrast agent injection in the image based on image analysis of the image.
- the elapsed time from the start of contrast medium injection in the image is estimated based on the image analysis of the input image. As a result, even if it is difficult to use information incidental to the image such as the imaging start time, it is possible to estimate the elapsed time from the start of injection of the contrast medium in the image.
- An image can include the meaning of image data, which is a signal representing an image.
- one or more processors determine the contrast enhancement state of the image based on the estimated elapsed time.
- the contrast enhancement state can be determined based on the estimated elapsed time from the start of contrast medium injection.
- Determination of the contrast enhancement state may include determination of the contrast enhancement phase.
- the one or more processors generate, as images, a slice image, a partial image included in the 3D image, a generated image generated based on the partial image included in the 3D image, and Accepts input of at least one of three-dimensional images.
- the contrast agent Elapsed time from the start of infusion can be estimated.
- one or more processors estimate the elapsed period using a learned regression model.
- a learned regression model can be used to estimate the elapsed period with a certain level of estimation accuracy.
- the one or more processors receive an input of a first image, the second image belonging to the same image series as the first image, and having a different shooting position from the first image. Receiving the input of the second image, estimating the first elapsed time that is the elapsed time from the start of contrast medium injection in the first image, and estimating the second elapsed time that is the elapsed time from the start of contrast medium injection in the second image and estimate the elapsed time period belonging to the image series based on the first elapsed time period and the second elapsed time period.
- the elapsed period can be estimated with certain reliability.
- one or more processors may be configured to estimate the elapsed period by integrating the first elapsed period and the second elapsed period.
- one or more processors estimate the first elapsed period and the second elapsed period using a learned regression model.
- a learned regression model is used to estimate the first elapsed period and the second elapsed period with a certain level of estimation accuracy.
- one or more processors estimate the estimated value output from the regression model and the likelihood of the output estimated value for each of the first image and the second image, The estimation results for each of the first and second images are combined based on the estimated values and likelihoods estimated using the regression model for each of the first and second images.
- a plurality of sets of estimated values and the likelihood of the estimated values are obtained based on the first image and the second image, and the estimation results are integrated based on the plurality of sets of estimated values and the likelihood of the estimated values.
- the integrated result is the estimated value.
- Estimation can include the concepts of inference and prediction.
- Certainty can include the concepts of certainty and reliability.
- the one or more processors for each of the first image and the second image, set the probability that the estimated value is a random variable based on the estimated value and the likelihood of the estimated value.
- a distribution is estimated, the respective probability distributions of the first image and the second image are combined to generate a combined distribution, and a final estimate is determined based on the combined distribution.
- the one or more processors for each of the first image and the second image, set the probability that the estimated value is a random variable based on the estimated value and the likelihood of the estimated value.
- a distribution is estimated, and based on the respective probability distributions of the first image and the second image, the value that maximizes the product of probabilities for the same random variable is identified.
- the value that maximizes the joint probability is specified based on a plurality of probability distributions. As a result, it is possible to derive a highly accurate estimated value of the elapsed period in consideration of the probability estimated according to the input image.
- the one or more processors convert the estimated value output from the regression model into the first parameter of the probability distribution model, and generate a value indicating the likelihood output from the regression model. to the second parameter of the probability distribution model.
- the probability distribution model can be Laplace distribution.
- the probability distribution model can be Gaussian distribution.
- the one or more processors perform logarithmic transformation that takes the logarithm of the probability distribution, and during integration, the logarithm corresponding to the probability distribution of each of the first image and the second image
- the sum of the probability densities may be calculated to determine the value that maximizes the joint logarithmic probability density.
- the regression model may include a trained model generated by performing machine learning using training data in which input images and teacher signals are associated.
- the regression model can be constructed using a convolutional neural network.
- the first image and the second image may be slice images included in the same image series.
- the first image and the second image may include different partial images included in the three-dimensional image.
- the first image and the second image may include generated images generated based on different partial images included in the three-dimensional image.
- the first image and the second image may include three-dimensional images.
- a three-dimensional image or the like is used as the input image. As a result, it is possible to suppress the deterioration of the estimation accuracy of the elapsed period and speed up the estimation process of the elapsed period.
- a computer accepts input of an image generated by performing contrast imaging, and based on image analysis of the image, estimates the elapsed time from the start of contrast agent injection in the image. processing method.
- the program according to the present disclosure implements a function of receiving an input of an image generated by performing contrast imaging on a computer, and a function of estimating the elapsed time from the start of contrast agent injection in the image based on the image analysis of the image. It is a program that allows
- the elapsed time from the start of contrast agent injection in the image is estimated based on the image analysis of the input image. This makes it possible to estimate the elapsed time from the start of injection of the contrast medium in the image even when it is difficult to use incidental information of the image such as the imaging start time.
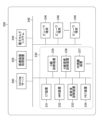
- FIG. 1 is a conceptual diagram showing an outline of processing used in the imaging state determination apparatus according to the first embodiment.
- FIG. 2 is a block diagram schematically showing an example of the hardware configuration of the imaging state determination device according to the first embodiment.
- FIG. 3 is a functional block diagram showing an overview of the processing functions of the imaging state determination apparatus according to the first embodiment.
- FIG. 4 is a flow chart showing the procedure of the contrast enhancement state determination method according to the first embodiment.
- FIG. 5 is a conceptual diagram showing an outline of processing used in the contrast state determination apparatus according to the second embodiment.
- FIG. 6 is a functional block diagram showing an overview of the processing functions of the number-of-seconds estimating device used in the imaging state determining device according to the second embodiment.
- FIG. 7 is a flow chart showing the procedure of the contrast enhancement state determination method according to the second embodiment.
- FIG. 8 is a conceptual diagram showing an overview of processing used in the contrast enhancement state determination apparatus according to the third embodiment.
- FIG. 9 is an explanatory diagram showing an example 1 of processing in the number-of-seconds distribution estimating unit.
- FIG. 10 is a graph showing an example of functions used for variable conversion.
- FIG. 11 shows an example of a graph of the number-of-seconds distribution estimated based on the parameter ⁇ and the parameter b estimated using the number-of-seconds distribution estimator.
- FIG. 12 is an explanatory diagram showing an example of processing in the integrating section and the maximum point specifying section.
- FIG. 13 is an explanatory diagram schematically showing an example of a machine learning method for generating a regression model used in the number-of-seconds distribution estimator.
- FIG. 14 is an explanatory diagram of a loss function used during training.
- FIG. 15 is a block diagram schematically showing an example of the hardware configuration of an imaging state determination apparatus according to the third embodiment.
- FIG. 16 is a functional block diagram showing an overview of processing functions of a regression estimation device used in the contrast enhancement state determination device according to the third embodiment.
- FIG. 17 is an explanatory diagram showing Example 2 of processing in the number-of-seconds distribution estimating unit of the regression estimation device provided in the imaging state determination device according to the fourth embodiment.
- FIG. 18 is a graph of the number-of-seconds distribution estimated based on the parameter ⁇ and the parameter ⁇ 2 estimated using the number-of-seconds distribution estimator.
- FIG. 19 is an explanatory diagram showing an example of processing in the integration unit and the maximum point specifying unit of the regression estimation device provided in the imaging state determination device according to the fourth embodiment.
- FIG. 20 is a schematic explanatory diagram of an example of a machine learning method for generating a regression model used in the number-of-seconds distribution estimator provided in the imaging state determination apparatus according to the fourth embodiment.
- FIG. 21 is an explanatory diagram showing Modified Example 1 of an image used for input to the number-of-seconds estimating device.
- FIG. 22 is an explanatory diagram showing Modified Example 2 of an image used for input to the number-of-seconds estimating device.
- FIG. 23 is a block diagram showing a configuration example of a medical information system using the contrast enhancement state determination device.
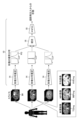
- FIG. 1 is a conceptual diagram showing an outline of processing used in the imaging state determination apparatus according to the first embodiment.
- a contrast enhancement state determination apparatus 1000 shown in the figure acquires an arbitrary slice image IM included in a plurality of slice images sampled at equal intervals from three-dimensional CT data of a patient photographed using a CT apparatus. , the contrast enhancement state such as the contrast enhancement time phase of the slice image IM.
- the contrast enhancement state determination apparatus 1000 estimates the number of seconds ta from the injection of the contrast agent in the acquired slice image IM, and determines the contrast enhancement state of the acquired slice image IM based on the estimated number of seconds ta.
- the slice image described in the embodiment is an example of an image generated by performing contrast imaging.
- the number of seconds ta after contrast medium injection described in the embodiment is an example of the elapsed time from the start of contrast medium injection.
- the number of seconds includes the number of seconds that indicate the elapsed time from the injection of the contrast medium. Elapsed time is synonymous with elapsed period.
- the slice image may also be called a tomographic image. That is, a slice image may be understood as a cross-sectional image that is substantially a two-dimensional image.
- hepatic imaging phases include arterial phase, portal vein phase, and equilibrium phase.
- renal imaging phases include corticomedullary, parenchymal and excretory phases.
- An imaging state can include non-imaging.
- the imaging state determination device 1000 can be realized using computer hardware and software.
- the contrast state determination apparatus 1000 includes an image reception unit 1002 , a number-of-seconds estimation unit 1004 , a contrast state determination unit 1006 and an output unit 1008 .
- the image reception unit 1002 receives slice images IM.
- FIG. 1 shows an example of an image reception unit 1002 that receives an arbitrary slice image IM included in a plurality of slice images. Acceptance of the slice image IM is synonymous with acquisition of the slice image IM.
- the image reception unit 1002 may receive a plurality of slice images IM. The details of the mode of receiving a plurality of slice images IM will be described later.
- the number-of-seconds estimation unit 1004 estimates the number of seconds ta based on the image analysis of the slice image IM, and outputs the estimated number of seconds ta as an estimated value of the number of seconds. For example, the number of seconds ta can be estimated based on the pixel values that make up the slice image IM.
- slice image may include the meaning of image data, which is a signal representing a slice image.
- the number-of-seconds estimation unit 1004 can use a learned model that has been trained using machine learning.
- learning models include convolutional neural networks.
- a convolutional neural network is called a CNN, using the abbreviation for Convolutional neural network.
- the number-of-seconds estimation unit 1004 can use a trained model that has been trained using a set of a slice image whose number of seconds is known in advance and the number of seconds corresponding to the slice image as learning data.
- the contrast enhancement state determination unit 1006 acquires the number of seconds ta output from the number of seconds estimation unit 1004, divides the acquired number of seconds ta, and determines the final contrast enhancement state. That is, the contrast enhancement state determination unit 1006 determines the contrast enhancement state of the slice image IM to be processed based on the obtained estimated number of seconds.
- FIG. 1 illustrates an imaging state determination unit 1006 that determines the imaging state using a conversion table 1010 .
- the conversion table 1010 shown in FIG. 1 is a table that defines the correspondence relationship between the number of seconds ta output from the number-of-seconds estimation unit 1004 and the classification of the contrast enhancement state.
- the conversion table 1010 may allow t0 to be 0 seconds, t1 to be 50 seconds, and t2 to be 120 seconds. That is, the imaging state determination unit 1006 determines the arterial phase when the number of seconds ta is less than 50 seconds, determines the portal vein phase when the number of seconds ta is 50 seconds or more and less than 120 seconds, and determines that the number of seconds ta is 120 seconds. Seconds or more can be determined as an equilibrium phase.
- the imaging state determination device 1000 can include a storage device in which the conversion table 1010 is stored.
- the imaging state determination apparatus 1000 may acquire the conversion table 1010 from an external database storage device.
- the output unit 1008 outputs information on the contrast state determined using the contrast state determination unit 1006 . For example, when the number of seconds ta output from the number-of-seconds estimation unit 1004 is 72 seconds and it is determined that the imaging state of the acquired slice image IM is in the portal vein phase, the output unit 1008 outputs the portal phase as the determination result. Pulse phase can be output.
- CT imaging of a range including the liver is performed multiple times at different imaging timings.
- the first shot is before the injection of the contrast agent
- the second shot is taken 35 seconds after the injection of the contrast agent
- the third shot is taken 70 seconds after the injection of the contrast agent
- the fourth shot is taken. It can be 180 seconds after injection of the contrast medium.
- the CT data referred to here is three-dimensional data composed of a plurality of continuous slice images, and is a collection of a plurality of slice images that constitute the three-dimensional data. is called an image series.
- a study 1 is given as a study ID for an examination called liver contrast imaging of a specific patient
- series 1 is given as a series ID of CT data obtained by imaging before injection of a contrast medium.
- Series 2 for CT data obtained by imaging at 10:00 series 3 for CT data obtained by imaging 70 seconds after injection of contrast medium
- CT data obtained by imaging 180 seconds after injection of contrast medium A unique ID is assigned to each series, such as series 4, to the data.
- CT data can be identified by combining the study ID and series ID.
- the imaging timing here may be read as the elapsed time after injection of the contrast medium.
- the contrast enhancement state determination apparatus 1000 uses one or more slice images in the same image series as input, and estimates the number of seconds based on image analysis.
- FIG. 2 is a block diagram schematically showing an example of the hardware configuration of the imaging state determination device according to the first embodiment.
- the imaging state determination apparatus 1000 can be implemented by a computer system configured using one or more computers. Here, an example is shown in which one computer executes a program to realize various functions of the imaging state determination apparatus 1000.
- FIG. 1 is a block diagram schematically showing an example of the hardware configuration of the imaging state determination device according to the first embodiment.
- the imaging state determination apparatus 1000 can be implemented by a computer system configured using one or more computers.
- an example is shown in which one computer executes a program to realize various functions of the imaging state determination apparatus 1000.
- the form of the computer that functions as the imaging state determination apparatus 1000 is not particularly limited, and may be a server computer, a workstation, a personal computer, a tablet terminal, or the like.
- the imaging state determination apparatus 1000 includes a processor 1102 , a computer-readable medium 1104 that is a non-transitory tangible object, a communication interface 1106 , an input/output interface 1108 and a bus 1110 .
- the processor 1102 includes a CPU (Central Processing Unit). Processor 1102 may include a GPU (Graphics Processing Unit). Processor 1102 is coupled to computer readable media 1104 , communication interface 1106 , and input/output interface 1108 via bus 1110 . The processor 1102 reads various programs and data stored in the computer-readable medium 1104 and executes various processes.
- CPU Central Processing Unit
- GPU Graphics Processing Unit
- the computer-readable medium 1104 includes a memory 1104A that is a main storage device and a storage 1104B that is an auxiliary storage device.
- the storage 1104B can be configured using a hard disk device, solid state drive device, optical disk, magneto-optical disk, and semiconductor memory.
- the storage 1104B can be configured using an appropriate combination of hard disk drives and the like.
- Various programs and data are stored in the storage 1104B.
- the hard disk device can be called HDD using the English abbreviation for Hard Disk Drive.
- a solid state drive device may also be referred to as an SSD using the abbreviation for Solid State Drive, which is an English notation.
- the memory 1104A is used as a work area for the processor 1102, and is used as a storage unit that temporarily stores programs and various data read from the storage 1104B.
- a program stored in storage 1104B is loaded into memory 1104A, instructions of the program are executed using processor 1102, and processor 1102 functions as a processing unit that performs various processes defined by the program.
- the memory 1104A stores a number-of-seconds estimation program 1130, a contrast enhancement state determination program 1132, various data, and the like, which are executed using the processor 1102.
- the number-of-seconds estimation program 1130 includes a trained model trained using machine learning, and causes the processor 1102 to execute the number-of-seconds estimation process described with reference to FIG.
- the contrast state determination program 1132 includes a trained model trained using machine learning, and causes the processor 1102 to execute the contrast state determination process described with reference to FIG. Note that the number-of-seconds estimation program 1130 and the contrast enhancement state determination program 1132 may be configured as one program.
- the communication interface 1106 performs communication processing with an external device using a wired or wireless method, and exchanges information with the external device.
- the imaging state determination apparatus 1000 is connected to a communication line via a communication interface 1106.
- the communication line may be a local area network or a wide area network.
- the communication interface 1106 can serve as a data acquisition unit that receives input of data such as images. Illustration of communication lines is omitted.
- the imaging state determination device 1000 may include an input device 1114 and a display device 1116.
- Input device 1114 and display device 1116 are connected to bus 1110 via input/output interface 1108 .
- Examples of input devices 1114 include keyboards, mice, multi-touch panels, other pointing devices, voice input devices, and the like.
- the input device 1114 may be any suitable combination of keyboards and the like.
- the display device 1116 is an output interface that displays various information. Examples of the display device 1116 include a liquid crystal display, an organic EL display, and a projector. The display device 1116 may be any suitable combination such as a liquid crystal display.
- Organic EL is called OEL using an abbreviation for organic electro-luminescence, which is an English notation.
- FIG. 3 is a functional block diagram showing an overview of the processing functions of the imaging state determination apparatus according to the first embodiment.
- the processor 1102 shown in FIG. 2 executes the number-of-seconds estimation program 1130 stored in the memory 1104A, functions as the image reception unit 1002 and the number-of-seconds estimation unit 1004, and executes the contrast state determination program 1132 to It functions as a state determination unit 1006 and an output unit 1008 .
- the image reception unit 1002 acquires slice images sampled from CT data as slice images IM to be processed.
- the image reception unit 1002 may perform processing for cutting out slice images IM from CT data at equal intervals, or may acquire slice images IM sampled in advance using a processing unit (not shown) or the like.
- the slice image IM acquired via the image reception unit 1002 is input to the number-of-seconds estimation unit 1004 .
- the number-of-seconds estimation unit 1004 outputs an estimated number of seconds based on the image analysis of the input slice image IM.
- the estimated number of seconds output from the number-of-seconds estimation unit 1004 is input to the imaging state determination unit 1006 .
- the contrast enhancement state determination unit 1006 acquires the estimated number of seconds output from the number of seconds estimation unit 1004, determines the contrast enhancement state of the slice image IM to be processed based on the acquired estimated number of seconds, and determines the contrast enhancement state of the slice image IM to be processed. Output the judgment result through .
- the output unit 1008 is an output interface that displays the contrast enhancement state of the slice image IM to be processed.
- the output unit 1008 may function as an output interface that provides the contrast enhancement state of the slice image IM to be processed to another processing unit.
- the output unit 1008 may include at least one processing unit such as processing for generating data for display and data conversion processing for transmitting data to the outside.
- the contrast state determined using the contrast state determining apparatus 1000 may be displayed using a display device or the like.
- the contrast enhancement state determination apparatus 1000 may be incorporated in a medical image processing apparatus for processing medical images acquired in medical institutions such as hospitals. Further, the processing functions of the imaging state determination apparatus 1000 may be provided as a cloud service.
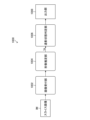
- FIG. 4 is a flow chart showing the procedure of the contrast enhancement state determination method according to the first embodiment.
- the image reception unit 1002 shown in FIG. 3 acquires the slice image IM.
- the process proceeds to the number-of-seconds estimation step S14.
- the number-of-seconds estimation unit 1004 estimates the number of seconds ta of the acquired slice image IM based on the image analysis of the slice image IM, and outputs it as an estimated number of seconds. After the number-of-seconds estimation step S14, the process proceeds to the contrast enhancement state determination step S16.
- the contrast state determination unit 1006 uses the conversion table 1010 shown in FIG. 1 to determine the contrast state corresponding to the estimated number of seconds of the slice image IM. After the contrast state determination step S16, the process proceeds to the output step S18.
- the output unit 1008 outputs the contrast enhancement state of the slice image IM determined in the contrast enhancement state determination step S16. After the output step S18, the procedure of the contrast enhancement state determination method ends.
- waiting for input of the next slice image IM may be performed, and when the next slice image IM is input, each step from the image acquisition step S12 to the output step S18 may be performed. Waiting for input of the next slice image IM may be performed after the output step S18, and the procedure of the contrast enhancement state determination method may be terminated when the next slice image IM is not input within a prescribed period.
- the contrast enhancement state determination apparatus can function as a number-of-seconds estimating apparatus that obtains slice images IM and estimates the number of seconds ta of the slice images IM based on image analysis of the slice images IM.
- the seconds estimating device includes an image accepting unit 1002 and a seconds estimating unit 1004 shown in FIG. 3, and the processor 1102 shown in FIG. can.
- the number-of-seconds estimation device can cause a computer to execute a number-of-seconds estimation method including an image acquisition step S12, an estimation step S14, and an output step S18 shown in FIG.
- the imaging state determination apparatus 1000 according to the first embodiment can obtain the following effects.
- An imaging state of the acquired slice image IM is determined based on the number-of-seconds estimate. Thereby, it is possible to determine the contrast enhancement state based on the estimated number of seconds, which is the estimated number of seconds ta from the injection of the contrast agent.
- the contrast-enhanced state is determined using a conversion table 1010 that defines the correspondence relationship between the number of seconds ta output from the number-of-seconds estimation unit 1004 and the classification of the contrast-enhanced state. This allows conversion of the estimated number of seconds based on the conversion table 1010 to the contrast state.
- the contrast state determination apparatus 1000 according to the first embodiment is an example of a medical image processing apparatus. The same applies to the imaging state determination apparatuses shown in second to fourth embodiments which will be described later. Also, the contrast enhancement state determination method according to the first embodiment is an example of a medical image processing method. The same applies to contrast enhancement state determination methods used in second to fourth embodiments, which will be described later.
- FIG. 5 is a conceptual diagram showing an outline of processing used in the contrast state determination apparatus according to the second embodiment.
- components different from the first embodiment will be mainly described, and descriptions of components common to the first embodiment will be omitted as appropriate.
- a contrast enhancement state determination apparatus 1200 acquires a plurality of slice images IM sampled at equal intervals from a CT image, and estimates the number of seconds for each of the plurality of slice images IM.
- the contrast state determination device 1200 performs integration processing such as averaging the multiple estimated number of seconds, and determines the integrated number of seconds ta.
- the contrast enhancement state determination device 1200 divides the determined number of seconds ta into final contrast enhancement states of the plurality of slice images IM.
- the contrast state determination device 1200 includes an image reception unit 1202 , a number-of-seconds estimation unit 1204 , an integration unit 1205 , a contrast state determination unit 1206 and an output unit 1208 .
- An image reception unit 1202 acquires a plurality of slice images IM.
- FIG. 5 illustrates a mode of acquiring three slice images IM as a plurality of slice images IM.
- the number-of-seconds estimation unit 1204 shown in FIG. 5 estimates the number of seconds tb, the number of seconds tc, and the number of seconds td for each of the three slice images IM.
- the integration unit 1205 performs processing to integrate the number of seconds tb, the number of seconds tc, and the number of seconds td, and determines the number of seconds ta.
- the integration unit 1205 may perform weighted average processing as integration processing. For example, if the number of seconds tb is 70 seconds, the number of seconds tc is 75 seconds, and the number of seconds td is 80 seconds, the integration unit 1205 may determine the number of seconds ta to be 72 seconds. The integration unit 1205 may perform arithmetic mean processing or the like as integration processing.
- the contrast enhancement state determination unit 1206 determines the contrast enhancement state of the plurality of slice images IM based on the number of seconds ta determined by the integrated processing.
- the contrast enhancement state determination unit 1206 shown in FIG. 5 refers to the conversion table 1210 to determine the contrast enhancement state of the plurality of slice images IM.
- the output unit 1208 outputs the contrast enhancement states of the slice images IM determined using the contrast enhancement state determination unit 1206 .
- the output unit 1208 shown in FIG. 5 outputs that the time phases of the multiple slice images IM are portal vein phases as the imaging state of the multiple slice images IM.
- Any one slice image of the plurality of slice images MI described in the embodiment is an example of the first image, and any one slice image different from the first image has a different imaging position from the first image. It is an example of a second image.
- the imaging state determination apparatus 1200 can employ the hardware configuration shown in FIG. A description of the hardware configuration of the imaging state determination apparatus 1200 is omitted here.
- FIG. 6 is a functional block diagram showing an overview of the processing functions of the number-of-seconds estimating device used in the imaging state determining device according to the second embodiment.
- the image reception unit 1202 shown in FIG. 6 acquires a plurality of slice images IMi sampled from CT data.
- a subscript i represents an index number that identifies a plurality of slice images.
- n may be an integer of 2 or greater. That is, the image receiving unit 1202 can acquire two or more slice images IMi included in the same image series.
- the number-of-seconds estimation unit 1204 estimates the number of seconds based on image analysis for each of the n slice images IMi included in the same image series.
- the integration unit 1205 integrates the n estimated number of seconds corresponding to each of the n slice images IMi, and outputs the number of seconds ta, which is the estimated number of seconds for the image series.
- the contrast enhancement state determination unit 1206 determines the contrast enhancement state of the image series based on the estimated number of seconds determined as a result of the integration processing.
- the output unit 1208 outputs the contrast enhancement state as an image series.
- FIG. 7 is a flow chart showing the procedure of the contrast enhancement state determination method according to the second embodiment.
- the image reception unit 1202 shown in FIG. 6 acquires n slice images IMi.
- the process proceeds to the number-of-seconds estimation step S102.
- the number-of-seconds estimation unit 1204 estimates the number of seconds for each of the n slice images IMi based on image analysis. After the number-of-seconds estimation step S102, the process proceeds to the integration step S104.
- the integration unit 1205 integrates the n estimated number of seconds corresponding to each of the n slice images IMi to determine the estimated number of seconds for the image series. After the integration step S104, the process proceeds to the contrast enhancement state determination step S106.
- the contrast state determination unit 1206 determines the contrast state as the image series based on the estimated number of seconds determined as a result of the integration processing. After the contrast state determination step S106, the process proceeds to the output step S108.
- the output unit 1208 outputs the contrast enhancement state as an image series.
- the procedures of the contrast enhancement state determination method are terminated.
- the plurality of slice images IMi described in the embodiment are examples of the first image and the second image.
- the number of seconds estimated based on the image analysis for each of the n slice images IMi described in the embodiment is an example of the first elapsed period and the second elapsed period.
- the imaging state determination apparatus 1200 according to the second embodiment can obtain the following effects.
- the estimation results corresponding to each of the multiple acquired slice images IMi can be weighted and integrated, reducing the influence of images in which the number of seconds is difficult to estimate, such as images containing artifacts that make scene analysis difficult. can be used to obtain highly accurate estimates.
- the contrast status for the image series is determined based on the integrated seconds estimate. This makes it possible to determine the contrast enhancement state as an image series based on the multiple slice images IMi that have been acquired.
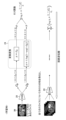
- FIG. 8 is a conceptual diagram showing an overview of processing used in the contrast enhancement state determination apparatus according to the third embodiment.
- a contrast state determination apparatus 1400 according to the third embodiment includes a regression estimation apparatus 10 instead of the image reception unit 1202, the number-of-seconds estimation unit 1204, and the integration unit 1205 of the contrast state determination apparatus 1200 shown in FIG.
- the regression estimation device 10 includes a data acquisition unit 12 that receives input of a plurality of slice images IM, a seconds distribution estimation unit 14 that estimates the distribution of seconds, which is a probability distribution of seconds, from the acquired plurality of slice images IM, and a plurality of an integration unit 16 that integrates a plurality of number-of-seconds distributions PD estimated from the slice images IM.
- the regression estimation device 10 also includes a maximum point specifying unit 18 that specifies the number of seconds at which the probability is maximized from the integrated distribution, which is a new distribution obtained by the integration process.
- the number of seconds with the maximum probability of being the number of seconds specified using the maximum point specifying unit 18 is output as the final result.
- the data acquisition unit 12 is not shown in FIG.
- the data acquisition unit 12 is illustrated in FIG.
- three seconds distribution estimating units 14 are illustrated in order to show the flow of processing when three different slice images IM are input, but each slice image IM is input
- the number-of-seconds distribution estimator 14 is identical and is a single processing unit.
- the regression estimator 10 may include a plurality of seconds distribution estimators 14 .
- FIG. 8 illustrates a mode in which the regression estimation device 10 acquires a plurality of slice images IM.
- the regression estimation device 10 acquires a single slice image IM and estimates the number of seconds from the single slice image IM. You may
- FIG. 9 is an explanatory diagram showing Example 1 of processing in the number-of-seconds distribution estimation unit.
- the number-of-seconds distribution estimator 14 includes a regression estimator 22 and a variable converter 24 .
- the regression estimation unit 22 receives an input of the slice image IM, and outputs an estimated number of seconds Oa and a score value Ob indicating the likelihood of the estimated number of seconds Oa.
- Including model A trained model as a regression model used in the regression estimation unit 22 is configured using, for example, a convolutional neural network.
- the numerical range of the estimated number of seconds Oa output from the regression estimation unit 22 may be ⁇ Oa ⁇ , and the numerical range of the likelihood score value Ob may be ⁇ Ob ⁇ .
- the probability score Ob may be read as the certainty score Ob.
- the regression model is not limited to CNN, and various machine learning models can be applied.
- variable transformation unit 24 transforms the estimated number of seconds Oa and the probability score Ob according to the following equations 1 and 2, respectively, to generate the parameter ⁇ and the parameter b of the probability distribution model.
- ⁇ Oa ...
- Formula 1 b 1/log(1+exp(-Ob)) ...Equation 2
- Equation 2 is an example of a mapping that converts the likelihood score value Ob to a value b in the positive region.
- FIG. 10 is a graph showing an example of functions used for variable conversion.
- the Laplace distribution is applied as the probability distribution model of the number-of-seconds distribution.
- a Laplace distribution is expressed as a function shown in Equation 3.
- the reason for converting the likelihood score value Ob to a positive value b is related to applying the Laplace distribution as a probability distribution model for the number of seconds distribution. If the parameter b is a negative value where b ⁇ 0, the Laplace distribution does not hold as a probability distribution, and it is necessary to ensure that the parameter b is a positive value where b>0.
- FIG. 11 shows an example of a graph of the number-of-seconds distribution estimated based on the parameter ⁇ and the parameter b estimated using the number-of-seconds distribution estimator.
- the position indicated by the dashed line GT in the figure corresponds to the correct number of seconds, which is the correct number of seconds.
- Estimating a set of the estimated number of seconds Oa and the likelihood score Ob of the estimated number of seconds Oa from the input slice image IM substantially corresponds to estimating the number of seconds distribution.
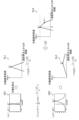
- FIG. 12 is an explanatory diagram showing an example of processing in the integrating section and the maximum point specifying section.
- FIG. 12 is an explanatory diagram showing an example of processing in the integrating section and the maximum point specifying section.
- an example of integrating two distributions of seconds estimated using the distribution of seconds distribution 14 is shown here, but the same applies to integrating three or more distributions of seconds. .
- Graph GD1 shown in the upper left of FIG. 12 is the number-of-seconds distribution expressed using the parameter ⁇ 1 and the parameter b1 estimated using the number-of-seconds distribution estimator 14 shown in FIG. 8 for the slice image IM1 input. It is an example of a certain probability distribution P1. Note that illustration of the slice image IM1 is omitted in FIG. A slice image IM1 is illustrated in FIG. The same applies to a slice image IM2, which will be described later.
- the integration unit 16 takes the logarithm of the estimated number-of-seconds distribution, converts the number-of-seconds distribution into a logarithmic probability density, and sums and integrates a plurality of logarithmic probability densities. This corresponds to taking the product of probabilities over the same number of seconds.
- the graph GL1 shown in the upper center of FIG. 12 is an example of the logarithmic probability density logP1 obtained by taking the logarithm of the probability distribution P1.
- a graph GD2 shown in the lower left of FIG. 12 is a probability distribution P2, which is a distribution of the number of seconds expressed using the parameter ⁇ 2 and the parameter b2 estimated using the second distribution estimating unit 14 with respect to the input of the slice image IM2. For example.
- the graph GL2 shown in the upper center of FIG. 12 is an example of the logarithmic probability density logP2 obtained by taking the logarithm of the probability distribution P2.
- the rightmost graph GLS in FIG. 12 is an example of the joint logarithmic probability density that integrates the logarithmic probability density logP1 and the logarithmic probability density logP2.
- the maximum point identifying unit 18 identifies the value x of the parameter ⁇ that maximizes the logarithmic probability from the integrated logarithmic probability density.
- the processing in the maximum point specifying unit 18 can be expressed using the following Equation 4.
- the part after ⁇ which is the target function of arg min shown on the right side of the equal sign in the second row of Equation 4, corresponds to the loss function during training in machine learning, which will be described later. Also, the right side of the equal sign described in the third row corresponds to the weighted median formula.
- the parameter bi corresponding to the weight for integration dynamically changes according to the output of the regression estimator 22 .
- the maximum point that is the input value at which the joint logarithmic probability is maximized is the parameter ⁇ 1, and the parameter ⁇ 1 is selected as the final estimation result.
- the parameter ⁇ 1 is the estimation result for the slice image IM1 among the plurality of input slice images IMi.
- the integration unit 16 whose processing is shown in FIG. 12 converts the distribution of seconds into a logarithmic probability density and performs calculations. Considering the probability, the process of deriving the value that maximizes the joint probability as the final result is performed.
- the Laplace distribution is adopted as the probability distribution model, and the joint probability distribution, which is the integrated distribution, takes the form of a weighted median. It is possible to obtain a highly accurate estimated value by suppressing the influence of
- the parameter ⁇ 1 described in the embodiment is an example of the first parameter, and the parameter b1 is an example of the second parameter.
- FIG. 13 is an explanatory diagram schematically showing an example of a machine learning method for generating a regression model used in the number-of-seconds distribution estimator.
- Training data used for machine learning includes a slice image IM as input data and a teacher signal t as correct data corresponding to the input.
- the slice image IM may be a slice image that constitutes an image series of three-dimensional CT data
- the teacher signal t represents the ground truth, which is the number of seconds from the injection of the contrast medium when the image series to which the slice image IM belongs is captured. It can be the value shown.
- a plurality of training data are generated by linking the corresponding teacher signal t. Tying may also be referred to as matching or associating. Training is synonymous with learning.
- the same teacher signal t may be associated with slice images IM of the same image series. That is, the teacher signal t may be associated with each image series.
- each slice image IM is associated with a corresponding teacher signal t to generate a plurality of training data.
- a set of training data thus generated is used as a training data set.
- the learning model 20 is configured using CNN.
- the learning model 20 is used in combination with the variable conversion section 24 .
- the variable conversion unit 24 may be integrally incorporated into the learning model 20 .
- a slice image IM read out from the training data set is input to the learning model 20, and the learning model 20 outputs an estimated number of seconds Oa and a likelihood score Ob.
- the estimated number of seconds Oa and the score value Ob are variable-transformed into the parameter ⁇ and the parameter b of the probability distribution model using the variable transformation unit 24 .
- the loss function L used during training is defined using Equation 5.
- a loss may be called a loss.
- the subscript i is an index that identifies each slice.
- Error backpropagation is applied using the sum of losses expressed using Eq. 6 to train the learning model 20 using stochastic gradient descent, similar to normal CNN learning. Note that the training of the learning model 20 is synonymous with updating the parameters of the learning model 20 .
- the learning model 20 is trained using multiple training data containing multiple image series, the parameters of the learning model 20 are optimized, and a trained model is obtained.
- the learned model thus obtained is used as a regression model for the number-of-seconds distribution estimation unit 14 .
- FIG. 14 is an explanatory diagram of the loss function used during training.
- the loss function is a negative log-likelihood and uses learning to directly optimize the formula used for regression estimation.
- the loss function uses learning to maximize the log-likelihood of the teacher signal t in seconds.
- a graph of the loss function parameter ⁇ shown in Equation 5 is the graph GR ⁇ in FIG. 14 .
- the graph GR ⁇ has a stable slope with respect to the parameter ⁇ .
- the graph for parameter b of the loss function shown in Equation 5 is graph GRb in FIG.
- Graph GRb has an unstable slope with respect to parameter b. In regions where the value of b is small, 1/b is dominant, and in regions where the value of b is large, logb is dominant.
- the function used for variable transformation of the parameter b is a function that asymptotically approaches -1/x when x ⁇ - ⁇ and exp(x) when x ⁇ . can be canceled.
- FIG. 15 is a block diagram schematically showing an example of the hardware configuration of an imaging state determination apparatus according to the third embodiment.
- components different from the contrast state determination apparatus 1000 shown in FIG. 2 will be mainly described, and descriptions of components common to the contrast state determination apparatus 1000 will be omitted as appropriate.
- the imaging condition determination device 1400 includes a processor 1402 , a computer readable medium 1404 , a communication interface 1406 , an input/output interface 1408 and a bus 1410 .
- the imaging state determination device 1400 may include an input device 1414 and a display device 1416 .
- Computer readable media 1404 includes memory 1404A and storage 1404B.
- a computer-readable medium 1404 shown in FIG. 15 stores a regression estimation program 1430 instead of the number-of-seconds estimation program 1130 shown in FIG.
- Processor 1402 executes one or more instructions contained in regression estimator program 1430 to implement the functionality of regression estimator 10 shown in FIG.
- Regression estimation program 1430 may include a trained model.
- a computer-readable medium 1404 stores an imaging state program 1432 .
- the processor 1402 executes the contrast state program 1432 to implement the contrast state determination function in the contrast state determination device 1400 .
- FIG. 16 is a functional block diagram showing an overview of processing functions of a regression estimation device used in the contrast enhancement state determination device according to the third embodiment.
- the processor 1402 of the imaging state determination device 1400 executes the regression estimation program 1430 stored in the memory 1404A and functions as the data acquisition unit 12, the seconds distribution estimation unit 14, the integration unit 16, and the maximum point identification unit 18.
- the data acquisition unit 12 acquires a plurality of slice images IMi.
- FIG. 16 shows an example of acquiring n slice images IMi, like the example shown in FIG.
- the slice image IMi captured via the data acquisition unit 12 is input to the regression estimation unit 22 of the number-of-seconds distribution estimation unit 14 .
- the regression estimation unit 22 outputs a set of an estimated number of seconds Oa and a score value Ob indicating the likelihood of the estimated number of seconds Oa from each of the input slice images IMi.
- the estimated number of seconds Oa output from the regression estimator 22 is converted to the parameter ⁇ i of the probability distribution model by the variable converter 24 .
- the likelihood score Ob output from the regression estimation unit 22 is converted into parameters bi of the probability distribution model in the variable conversion unit 24 .
- a probability distribution Pi of seconds is estimated.
- a plurality of slice images IMi included in the same image series are input to the regression estimation device 10, and a set of an estimated number of seconds Oa and a score value Ob is estimated for each slice image IMi, and converted into a set of parameters ⁇ i and bi. to estimate the probability distribution Pi of seconds.
- the integrating unit 16 performs processing to integrate multiple probability distributions Pi obtained based on the input of multiple slice images IMi.
- the logarithmic conversion unit 26 takes the logarithm of the probability distribution Pi and converts it to a logarithmic probability density logPi, and the integrated distribution generation unit 28 calculates the sum of the logarithmic probability densities logPi to obtain the integrated distribution. obtain.
- the maximum point specifying unit 18 specifies the maximum point, which is the value of the number of seconds with the maximum probability from the integrated distribution, and outputs the value of the specified number of seconds as the final estimated value. Note that the maximum point identification unit 18 may be configured to be incorporated in the integration unit 16 .
- the contrast state determination apparatus 1400 according to the third embodiment can obtain the following effects.
- a probability distribution Pi with the estimated number of seconds Oa as a random variable is estimated based on the estimated number of seconds Oa and a score value Ob representing the likelihood of the estimated number of seconds Oa, and each of the plurality of sets of probability distributions Pi is calculated. Based on this, it is possible to specify a value that maximizes the product of probabilities for the same random variable.
- the score value Ob representing the probability estimated according to the input is considered by obtaining the value that maximizes the joint probability.
- a highly accurate second estimate Oa can be derived.
- the learning becomes stable and somewhat robust against label noise.
- the joint probability distribution takes the form of a weighted median, and when one of the estimation results for some inputs deviates greatly due to artifacts, etc., it is less susceptible to the outliers and is even more robust.
- an image used for estimating the final estimated value which is the final result, can be extracted from the plurality of images used for input.
- the hardware configuration of the contrast state determination device according to the fourth embodiment may be the same as the contrast state determination device 1400 according to the third embodiment.
- components different from the contrast state determination apparatus 1400 according to the third embodiment will be mainly described, and descriptions of components common to the contrast state determination apparatus 1400 will be omitted as appropriate.
- the processing contents of each of the second distribution estimation unit 14, the integration unit 16, and the maximum point identification unit 18 are different from those of the third embodiment.
- FIG. 17 is an explanatory diagram showing example 2 of processing in the number-of-seconds distribution estimating unit of the regression estimating device provided in the imaging state determining device according to the fourth embodiment.
- the processing shown in FIG. 17 is applied instead of the processing shown in FIG.
- variable conversion unit 24 in the fourth embodiment converts the likelihood score value Ob into the parameter ⁇ 2 using Equation 7 instead of Equation 2.
- ⁇ 2 1/log(1+exp( ⁇ Ob)) Equation 7
- ⁇ 2 plays the role of certainty. ⁇ 2 corresponds to variance and ⁇ to standard deviation.
- a Gaussian distribution is expressed using the function shown in Equation 8.
- the reason for converting the score value Ob into a positive value ⁇ 2 is the same as in the third embodiment. If the parameter ⁇ 2 is a negative value, the Gaussian distribution does not hold as a probability distribution, and it is necessary to ensure that the parameter ⁇ 2 is a positive value ⁇ 2 >0.
- FIG. 18 is a graph of the number-of-seconds distribution estimated based on the parameter ⁇ and the parameter ⁇ 2 estimated using the number-of-seconds distribution estimator.
- FIG. 18 shows an example of a graph of the number-of-seconds distribution.
- FIG. 19 is an explanatory diagram showing an example of processing in the integration unit and the maximum point specifying unit of the regression estimation device provided in the contrast enhancement state determination device according to the fourth embodiment. Here, an example of integrating two number-of-seconds distributions estimated using the number-of-seconds distribution estimating unit 14 is shown.
- a graph GD1g shown in the upper left of FIG. 19 is an example of a probability distribution P1, which is a number-of-seconds distribution expressed using the parameter ⁇ 1 and the parameter ⁇ 2 1 estimated using the number-of-seconds distribution estimation unit 14 shown in FIG. be.
- the integration unit 16 takes the logarithm of the estimated number-of-seconds distribution, converts it into a logarithmic probability density, takes the sum of a plurality of logarithmic probability densities, and integrates them. This corresponds to taking the product of probabilities over the same number of seconds.
- a graph GL1g shown in the upper center of FIG. 19 is an example of the logarithmic probability density logP1 obtained by taking the logarithm of the probability distribution P1.
- a graph GD2g shown in the lower left of FIG. 19 is an example of the probability distribution P2, which is the number-of-seconds distribution expressed using the parameter ⁇ 2 and the parameter ⁇ 2 2 estimated using the number-of-seconds distribution estimation unit 14 .
- a graph GL2g shown in the lower center of FIG. 19 is an example of the logarithmic probability density obtained by taking the logarithm of the probability distribution P2.
- the rightmost graph GLSg in FIG. 19 is an example of the joint logarithmic probability density that integrates the logarithmic probability density logP1 and the logarithmic probability density logP2.
- the maximum point identifying unit 18 identifies the value x that maximizes the logarithmic probability from the integrated joint logarithmic probability density.
- the processing in the maximum point specifying unit 18 is expressed using Equation 9.
- the part after ⁇ which is the target function of argmin shown on the right side of the equal sign in the second row of Equation 9, corresponds to the loss function during training in machine learning, which will be described later. Also, the right side of the equal sign in the third line corresponds to the weighted average formula.
- the value x representing the maximum point which is the input value with the maximum logarithmic probability, is selected as the final estimation result.
- FIG. 20 is a schematic explanatory diagram of an example of a machine learning method for generating a regression model used in the number-of-seconds distribution estimator provided in the imaging state determination apparatus according to the fourth embodiment. Training data used for learning may be the same as in the third embodiment. With regard to FIG. 20, mainly different points from example 1 shown in FIG. 13 will be described.
- the learning model 20 When the slice image TIM read from the training data set is input to the learning model 20, the learning model 20 outputs an estimated number of seconds Oa and a likelihood score Ob of the estimated number of seconds Oa.
- the number-of-seconds estimated value Oa and the likelihood score value Ob are variable-transformed into the parameter ⁇ and the parameter ⁇ 2 of the probability distribution model using the variable transformation unit 24 .
- the loss function L during training is defined using Equation 10.
- Equation 11 is obtained by taking the sum of losses for all slices of the same image series.
- the error backpropagation method is applied using the loss sum expressed using Equation 11, and the learning model 20 is trained using the stochastic gradient descent method, similar to normal CNN learning.
- a plurality of training data comprising a plurality of image series are used to train the learning model 20 to optimize the parameters of the learning model 20 to obtain a trained model.
- the learned model thus obtained is applied to the number-of-seconds distribution estimation unit 14 .
- the contrast state determination apparatus according to the fourth embodiment is similar to the contrast state determination apparatus 1000 according to the first embodiment, the contrast state determination apparatus 1200 according to the second embodiment, and the contrast state determination apparatus 1400 according to the third embodiment. It is possible to obtain working effects.
- FIG. 21 is an explanatory diagram showing Modified Example 1 of an image used for input to the number-of-seconds estimating device.
- slice images IM obtained by cutting out slices from three-dimensional CT data at equal intervals are used as input, but the image to be processed is not limited to this.
- an MIP image MIPimg configured at regular intervals and an average image AVEimg generated from a plurality of slice images may be used.
- MIP is an abbreviation for Maximum Intensity Projection.
- the image used for input is not limited to a two-dimensional image, and may be a three-dimensional image.
- a 3D sub-image of may be used as input.
- 3D partial images at different positions included in the same image series may be used as inputs.
- the MIP image MIPimg and the average image AVEimg described in the embodiment are examples of generated images generated based on partial images included in the three-dimensional image.
- FIG. 22 is an explanatory diagram showing Modified Example 2 of an image used for input to the number-of-seconds estimating device.
- the input to the number-of-seconds distribution estimation unit 14 shown in FIG. 8 and the like may be a combination of multiple types of data elements.
- at least one of three-dimensional images, slice images, MIP images, and average images, which are partial images of CT data of the same image series, can be used as an input.
- the combination of species may be input to the seconds distribution estimator 14 to obtain an output of the seconds estimate and its likelihood.
- a three-dimensional image here means a set of a plurality of slice images.
- the combination of the average image and the MIP image may be input to the seconds distribution estimation unit 14 to estimate the seconds distribution.
- 3D shown in FIG. 22 represents a three-dimensional image.
- FIG. 23 is a block diagram showing a configuration example of a medical information system using the contrast enhancement state determination device.
- the contrast enhancement state determination apparatus 1000 and the like described as the first to fourth embodiments can be incorporated into the medical image processing apparatus 220 shown in FIG.
- the medical information system 200 is a computer network built in medical institutions such as hospitals.
- the medical information system 200 includes a modality 230 for capturing medical images, a DICOM server 240 , a medical image processing device 220 , an electronic chart system 244 and a viewer terminal 246 .
- the elements of medical information system 200 are connected via communication lines 248 .
- Communication line 248 may be a local communication line within a medical institution. Also, part of the communication line 248 may be a wide area communication line.
- the modality 230 include a CT device 231, an MRI device 232, an ultrasonic diagnostic device 233, a PET device 234, an X-ray diagnostic device 235, an X-ray fluoroscopic diagnostic device 236, an endoscope device 237, and the like.
- the types of modalities 230 connected to the communication line 248 can be combined in various ways for each medical institution.
- MRI is an abbreviation for Magnetic Resonance Imaging.
- PET is an abbreviation for Positron Emission Tomography.
- the DICOM server 240 is a server that operates according to the DICOM specifications.
- the DICOM server 240 is a computer that stores various data including images captured using the modality 230 and manages various data.
- the DICOM server 240 includes a large-capacity external storage device and a database management program.
- the DICOM server 240 communicates with other devices via the communication line 248 to send and receive various data including image data.
- the DICOM server 240 receives image data generated using the modality 230 and other various data via the communication line 248, and stores and manages them in a recording medium such as a large-capacity external storage device.
- the storage format of image data and communication between devices via the communication line 248 are based on the DICOM protocol.
- the medical image processing apparatus 220 can acquire data from the DICOM server 240 or the like via the communication line 248.
- the medical image processing apparatus 220 performs image analysis and various other processes on medical images captured using the modality 230 .
- the medical image processing device 220 performs various functions such as processing for recognizing a lesion area from an image, processing for identifying a classification such as a disease name, and segmentation processing for recognizing a region such as an organ. It may be configured to perform analytical processing such as computer-aided diagnosis.
- computer aided diagnosis may be referred to as CAD using the abbreviations Computer Aided Diagnosis or Computer Aided Detection.
- the medical image processing apparatus 220 can send the processing results to the DICOM server 240 and the viewer terminal 246. Note that the processing functions of the medical image processing apparatus 220 may be installed in the DICOM server 240 or the viewer terminal 246 .
- Various information including various data saved in the database of the DICOM server 240 and processing results generated by the medical image processing apparatus 220 can be displayed on the viewer terminal 246.
- the viewer terminal 246 is a terminal for viewing images called a PACS viewer or DICOM viewer.
- a plurality of viewer terminals 246 can be connected to the communication line 248 .
- PACS is an abbreviation for Picture Archiving and Communication System.
- the form of the viewer terminal 246 is not particularly limited, and may be a personal computer, a workstation, a tablet terminal, or the like.
- a computer-readable program that implements the processing functions of the imaging state determination apparatus 1000 and the like is recorded on a computer-readable medium that is a tangible, non-temporary information storage medium such as an optical disk, a magnetic disk, and a semiconductor memory, and the program is transmitted through this information storage medium. It is possible to provide a computer-readable medium that is a tangible, non-temporary information storage medium such as an optical disk, a magnetic disk, and a semiconductor memory, and the program is transmitted through this information storage medium. It is possible to provide
- part or all of the processing functions in the contrast enhancement state determination apparatus 1000 and the like may be realized by cloud computing, and may be provided as a SasS service.
- SasS is an abbreviation for Software as a Service.
- processors include CPUs, which are general-purpose processors that run programs and function as various processing units, GPUs, which are processors specialized for image processing, and FPGAs (Field Programmable Gate Arrays).
- a programmable logic device which is a processor capable of changing the processing, and a dedicated electric circuit, which is a processor having a circuit configuration specially designed to execute a specific process, such as an ASIC.
- a programmable logic device can be called a PLD using the English abbreviation for Programmable Logic Device.
- ASIC is an abbreviation for Application Specific Integrated Circuit.
- One processing unit may be composed of one of these various processors, or may be composed of two or more processors of the same type or different types.
- one processing unit may be configured using a plurality of FPGAs, or may be configured using a combination of a CPU and an FPGA, or a combination of a CPU and a GPU.
- a plurality of processing units may be configured with a single processor.
- a single processor is configured using a combination of one or more CPUs and software, as typified by computers such as clients and servers. , in which the processor functions as a plurality of processing units.
- the processor functions as a plurality of processing units.
- a system-on-chip there is a mode of using a processor that implements the function of the entire system including a plurality of processing units with a single IC chip.
- SoC System On a Chip
- IC is an abbreviation for Integrated Circuit.
- various processing units are configured using one or more of the above various processors as a hardware structure.
- the hardware structure of these various processors is, more specifically, an electrical circuit that combines circuit elements such as semiconductor elements.
Landscapes
- Engineering & Computer Science (AREA)
- Health & Medical Sciences (AREA)
- Medical Informatics (AREA)
- Life Sciences & Earth Sciences (AREA)
- General Health & Medical Sciences (AREA)
- Nuclear Medicine, Radiotherapy & Molecular Imaging (AREA)
- Radiology & Medical Imaging (AREA)
- Public Health (AREA)
- Physics & Mathematics (AREA)
- Biomedical Technology (AREA)
- Pathology (AREA)
- Primary Health Care (AREA)
- Molecular Biology (AREA)
- Theoretical Computer Science (AREA)
- Veterinary Medicine (AREA)
- Animal Behavior & Ethology (AREA)
- Surgery (AREA)
- Heart & Thoracic Surgery (AREA)
- Optics & Photonics (AREA)
- Epidemiology (AREA)
- Biophysics (AREA)
- High Energy & Nuclear Physics (AREA)
- Quality & Reliability (AREA)
- General Physics & Mathematics (AREA)
- Computer Vision & Pattern Recognition (AREA)
- Pulmonology (AREA)
- Databases & Information Systems (AREA)
- Data Mining & Analysis (AREA)
- Apparatus For Radiation Diagnosis (AREA)
- Image Processing (AREA)
Priority Applications (2)
| Application Number | Priority Date | Filing Date | Title |
|---|---|---|---|
| JP2023545112A JPWO2023032436A1 (https=) | 2021-08-31 | 2022-06-24 | |
| US18/587,962 US20240193777A1 (en) | 2021-08-31 | 2024-02-27 | Medical image processing device, medical image processing method, and program |
Applications Claiming Priority (2)
| Application Number | Priority Date | Filing Date | Title |
|---|---|---|---|
| JP2021-141456 | 2021-08-31 | ||
| JP2021141456 | 2021-08-31 |
Related Child Applications (1)
| Application Number | Title | Priority Date | Filing Date |
|---|---|---|---|
| US18/587,962 Continuation US20240193777A1 (en) | 2021-08-31 | 2024-02-27 | Medical image processing device, medical image processing method, and program |
Publications (1)
| Publication Number | Publication Date |
|---|---|
| WO2023032436A1 true WO2023032436A1 (ja) | 2023-03-09 |
Family
ID=85412504
Family Applications (1)
| Application Number | Title | Priority Date | Filing Date |
|---|---|---|---|
| PCT/JP2022/025286 Ceased WO2023032436A1 (ja) | 2021-08-31 | 2022-06-24 | 医用画像処理装置、医用画像処理方法及びプログラム |
Country Status (3)
| Country | Link |
|---|---|
| US (1) | US20240193777A1 (https=) |
| JP (1) | JPWO2023032436A1 (https=) |
| WO (1) | WO2023032436A1 (https=) |
Families Citing this family (2)
| Publication number | Priority date | Publication date | Assignee | Title |
|---|---|---|---|---|
| US12268543B2 (en) * | 2022-07-18 | 2025-04-08 | Wisconsin Alumni Research Foundation | System and method for low-dose multi-phasic computed tomography imaging of the kidneys |
| US20240119647A1 (en) * | 2022-09-30 | 2024-04-11 | Canon Medical Systems Corporation | Nuclear medicine diagnosis apparatus, data processing method, and non-transitory computer-readable storage medium |
Citations (4)
| Publication number | Priority date | Publication date | Assignee | Title |
|---|---|---|---|---|
| JP2005237825A (ja) * | 2004-02-27 | 2005-09-08 | Hitachi Medical Corp | 画像診断支援装置 |
| JP2019005555A (ja) * | 2017-04-28 | 2019-01-17 | ゼネラル・エレクトリック・カンパニイ | 対象物内の造影剤の量を監視するためのシステムおよび方法 |
| JP2020146455A (ja) * | 2019-03-06 | 2020-09-17 | キヤノンメディカルシステムズ株式会社 | 医用画像処理装置 |
| US20210128818A1 (en) * | 2019-11-01 | 2021-05-06 | GE Precision Healthcare LLC | Methods and systems for timing a second contrast bolus |
Family Cites Families (1)
| Publication number | Priority date | Publication date | Assignee | Title |
|---|---|---|---|---|
| US11350896B2 (en) * | 2019-11-01 | 2022-06-07 | GE Precision Healthcare LLC | Methods and systems for an adaptive four-zone perfusion scan |
-
2022
- 2022-06-24 JP JP2023545112A patent/JPWO2023032436A1/ja active Pending
- 2022-06-24 WO PCT/JP2022/025286 patent/WO2023032436A1/ja not_active Ceased
-
2024
- 2024-02-27 US US18/587,962 patent/US20240193777A1/en active Pending
Patent Citations (4)
| Publication number | Priority date | Publication date | Assignee | Title |
|---|---|---|---|---|
| JP2005237825A (ja) * | 2004-02-27 | 2005-09-08 | Hitachi Medical Corp | 画像診断支援装置 |
| JP2019005555A (ja) * | 2017-04-28 | 2019-01-17 | ゼネラル・エレクトリック・カンパニイ | 対象物内の造影剤の量を監視するためのシステムおよび方法 |
| JP2020146455A (ja) * | 2019-03-06 | 2020-09-17 | キヤノンメディカルシステムズ株式会社 | 医用画像処理装置 |
| US20210128818A1 (en) * | 2019-11-01 | 2021-05-06 | GE Precision Healthcare LLC | Methods and systems for timing a second contrast bolus |
Also Published As
| Publication number | Publication date |
|---|---|
| US20240193777A1 (en) | 2024-06-13 |
| JPWO2023032436A1 (https=) | 2023-03-09 |
Similar Documents
| Publication | Publication Date | Title |
|---|---|---|
| KR101898575B1 (ko) | 진행성 병변에 대한 미래 상태를 예측하는 방법 및 이를 이용한 장치 | |
| EP3611699A1 (en) | Image segmentation using deep learning techniques | |
| US10803354B2 (en) | Cross-modality image synthesis | |
| CN110400617B (zh) | 医学成像中的成像和报告的结合 | |
| US10878564B2 (en) | Systems and methods for processing 3D anatomical volumes based on localization of 2D slices thereof | |
| US20120170823A1 (en) | System and method for image based multiple-modality cardiac image alignment | |
| KR101957811B1 (ko) | 의료 영상에 기반하여 피검체의 치매에 대한 중증도를 산출하는 방법 및 이를 이용한 장치 | |
| KR102202398B1 (ko) | 영상처리장치 및 그의 영상처리방법 | |
| KR102330069B1 (ko) | 치과 영상으로부터 피검체의 성별 및 연령을 판정하는 방법 및 이를 이용한 장치 | |
| US20240193777A1 (en) | Medical image processing device, medical image processing method, and program | |
| US20240193781A1 (en) | Contrast state determination device, contrast state determination method, and program | |
| KR101885562B1 (ko) | 제1 의료 영상의 관심 영역을 제2 의료 영상 위에 맵핑하는 방법 및 이를 이용한 장치 | |
| JP7413011B2 (ja) | 医用情報処理装置 | |
| US11244754B2 (en) | Artificial neural network combining sensory signal classification and image generation | |
| US20190197687A1 (en) | Image processing apparatus, image processing method, image processing system, and storage medium | |
| US20260057516A1 (en) | Medical image processing device, method for operating medical image processing device, and program for performing analysis of region of interest having contrast state | |
| US10176569B2 (en) | Multiple algorithm lesion segmentation | |
| KR20190088371A (ko) | 진행성 병변의 미래 영상을 생성하는 방법 및 이를 이용한 장치 | |
| US20250005405A1 (en) | Regression estimation device, regression estimation method, program, and method for generating trained model | |
| EP3971790B1 (en) | Method for improving reproduction performance of trained deep neural network model and device using same | |
| US20230046302A1 (en) | Blood flow field estimation apparatus, learning apparatus, blood flow field estimation method, and program | |
| JP2024144633A (ja) | 画像処理装置、画像処理方法、画像処理システム及びプログラム | |
| JP7841930B2 (ja) | 医用画像処理装置、医用画像処理装置の動作方法及びプログラム | |
| CN115546174B (zh) | 图像处理方法、装置、计算设备及存储介质 | |
| CN107799166A (zh) | 医学成像系统 |
Legal Events
| Date | Code | Title | Description |
|---|---|---|---|
| 121 | Ep: the epo has been informed by wipo that ep was designated in this application |
Ref document number: 22864024 Country of ref document: EP Kind code of ref document: A1 |
|
| WWE | Wipo information: entry into national phase |
Ref document number: 2023545112 Country of ref document: JP |
|
| NENP | Non-entry into the national phase |
Ref country code: DE |
|
| 122 | Ep: pct application non-entry in european phase |
Ref document number: 22864024 Country of ref document: EP Kind code of ref document: A1 |