WO2022250023A1 - プラント監視装置及びプラント監視方法並びにプログラム - Google Patents
プラント監視装置及びプラント監視方法並びにプログラム Download PDFInfo
- Publication number
- WO2022250023A1 WO2022250023A1 PCT/JP2022/021151 JP2022021151W WO2022250023A1 WO 2022250023 A1 WO2022250023 A1 WO 2022250023A1 JP 2022021151 W JP2022021151 W JP 2022021151W WO 2022250023 A1 WO2022250023 A1 WO 2022250023A1
- Authority
- WO
- WIPO (PCT)
- Prior art keywords
- alarm
- screen
- trend graph
- displayed
- plant
- Prior art date
- Legal status (The legal status is an assumption and is not a legal conclusion. Google has not performed a legal analysis and makes no representation as to the accuracy of the status listed.)
- Ceased
Links
Images




Classifications
-
- G—PHYSICS
- G05—CONTROLLING; REGULATING
- G05B—CONTROL OR REGULATING SYSTEMS IN GENERAL; FUNCTIONAL ELEMENTS OF SUCH SYSTEMS; MONITORING OR TESTING ARRANGEMENTS FOR SUCH SYSTEMS OR ELEMENTS
- G05B23/00—Testing or monitoring of control systems or parts thereof
- G05B23/02—Electric testing or monitoring
- G05B23/0205—Electric testing or monitoring by means of a monitoring system capable of detecting and responding to faults
- G05B23/0259—Electric testing or monitoring by means of a monitoring system capable of detecting and responding to faults characterized by the response to fault detection
- G05B23/0267—Fault communication, e.g. human machine interface [HMI]
- G05B23/027—Alarm generation, e.g. communication protocol; Forms of alarm
-
- G—PHYSICS
- G05—CONTROLLING; REGULATING
- G05B—CONTROL OR REGULATING SYSTEMS IN GENERAL; FUNCTIONAL ELEMENTS OF SUCH SYSTEMS; MONITORING OR TESTING ARRANGEMENTS FOR SUCH SYSTEMS OR ELEMENTS
- G05B23/00—Testing or monitoring of control systems or parts thereof
- G05B23/02—Electric testing or monitoring
- G05B23/0205—Electric testing or monitoring by means of a monitoring system capable of detecting and responding to faults
- G05B23/0259—Electric testing or monitoring by means of a monitoring system capable of detecting and responding to faults characterized by the response to fault detection
- G05B23/0267—Fault communication, e.g. human machine interface [HMI]
- G05B23/0272—Presentation of monitored results, e.g. selection of status reports to be displayed; Filtering information to the user
-
- G—PHYSICS
- G06—COMPUTING OR CALCULATING; COUNTING
- G06F—ELECTRIC DIGITAL DATA PROCESSING
- G06F3/00—Input arrangements for transferring data to be processed into a form capable of being handled by the computer; Output arrangements for transferring data from processing unit to output unit, e.g. interface arrangements
- G06F3/01—Input arrangements or combined input and output arrangements for interaction between user and computer
- G06F3/048—Interaction techniques based on graphical user interfaces [GUI]
- G06F3/0484—Interaction techniques based on graphical user interfaces [GUI] for the control of specific functions or operations, e.g. selecting or manipulating an object, an image or a displayed text element, setting a parameter value or selecting a range
- G06F3/0486—Drag-and-drop
Definitions
- the present disclosure relates to a plant monitoring device, a plant monitoring method, and a program.
- an alarm screen which is a list of alarms, is displayed on a display device.
- a plant monitoring device is disclosed that causes a display device to display a trend graph screen at the time of occurrence.
- the present disclosure has been made in view of such circumstances, and aims to provide a plant monitoring device, a plant monitoring method, and a program that can improve the convenience of plant monitoring.
- the plant monitoring device of the present disclosure includes an alarm output unit that creates alarm information including the date and time when the abnormality occurred when an abnormality in the plant is detected, and an alarm element based on the alarm information. and a graph screen processing unit for displaying, on the display unit, a trend graph screen in which the temporal transition of input data relating to the monitoring items of the plant is drawn as a graph.
- the graph screen processing unit performs a drag-and-drop operation on the alarm element displayed on the alarm screen to the trend graph screen in a state in which the alarm screen and the trend graph screen are displayed on the display unit. is displayed on the trend graph screen, a graph of input data for a predetermined period including the date and time specified from the dragged and dropped alarm element, and an emphasis element for emphasizing the date and time is displayed on the trend graph screen. Display on the trend graph screen.
- a process of creating alarm information including the date and time when the abnormality occurred a process of displaying an alarm screen including alarm elements based on the alarm information on the display unit.
- the program of the present disclosure causes the computer to function as the plant monitoring device.
- the convenience of plant monitoring can be improved.
- FIG. 1 is a diagram showing an example hardware configuration of a plant monitoring device according to an embodiment of the present disclosure
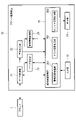
- FIG. 1 is a functional block diagram showing an example of functions possessed by a plant monitoring device according to an embodiment of the present disclosure
- FIG. FIG. 4 is a diagram showing an example of an alarm screen according to an embodiment of the present disclosure
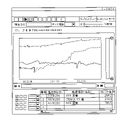
- FIG. FIG. 4 is a diagram showing an example of a trend graph screen according to an embodiment of the present disclosure
- FIG. FIG. 4 is a diagram for explaining an input operation of the plant monitoring device according to the embodiment of the present disclosure and a screen display associated with the input operation
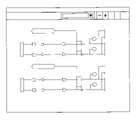
- FIG. 4 is a diagram showing an example of a logic screen according to an embodiment of the present disclosure
- FIG. FIG. 4 is a diagram for explaining an input operation of the plant monitoring device according to the embodiment of the present disclosure and a screen display associated with the input operation;
- FIG. 1 is a diagram showing an example of a hardware configuration of a plant monitoring device 10 according to one embodiment of the present disclosure.
- the plant monitoring device 10 includes, for example, a CPU (Central Processing Unit) 11, a main memory 12, a storage section 13, an external interface 16, a communication interface 17, an input section 18, a display section 19, etc. there is These units are connected to each other directly or indirectly via a bus, and cooperate with each other to perform various processes.
- a CPU Central Processing Unit
- the CPU 11 controls the overall plant monitoring device 10 by, for example, an OS (Operating System) stored in a storage unit 13 connected via a bus, and executes various programs stored in the storage unit 13. Executes various processing.
- OS Operating System
- the main memory 12 is composed of writable memories such as cache memory and RAM (random access memory), and is used as a work area for reading the execution program of the CPU 11 and writing processing data by the execution program.
- writable memories such as cache memory and RAM (random access memory)
- the storage unit 13 is, for example, a ROM (Read Only Memory), a HDD (Hard Disk Drive), an SSD (Solid State Drive), or the like.
- OS various device drivers for hardware operation of peripheral devices, various programs (including various application software) for realizing various processes, and various data required for realizing various processes are stored. It is
- the external interface 16 is an interface for connecting with an external device.
- external devices include an external monitor, a USB memory, an external HDD, and the like. Although only one external interface is shown in the example shown in FIG. 1, a plurality of external interfaces may be provided.
- FIG. 2 is a functional block diagram showing an example of the functions of the plant monitoring device 10 according to this embodiment.
- a series of processes for realizing various functions to be described later are stored in the storage unit 13 in the form of a program (for example, a plant monitoring program), for example, and the CPU 11 reads this program into the main memory 12 and stores the information.
- Various functions are realized by executing the processing and arithmetic processing of .
- the program may be pre-installed in the storage unit 13, may be provided in a state stored in another computer-readable storage medium, or may be distributed via wired or wireless communication means. may apply.
- Computer-readable storage media include magnetic disks, magneto-optical disks, CD-ROMs, DVD-ROMs, semiconductor memories, and the like.
- the plant monitoring device 10 includes a data acquisition unit 21, a data storage unit 22, an alarm output unit 23, an alarm information storage unit 24, a monitoring screen processing unit 25, and the like.
- the data acquisition unit 21 acquires input data that is data used for monitoring the plant 1 .
- “Input data” includes measurement data measured by various sensors provided in the plant 1 such as temperature, pressure, flow rate, etc., various control variables output from various control devices of the plant 1, and other monitoring of the plant 1. Includes various data etc. required for The data acquisition unit 21 associates the acquired input data with information for identifying the input data (hereinafter referred to as “monitoring item”) and time information when the input data was acquired, and stores the information in the data storage unit 22 . do.
- the data storage unit 22 stores various input data acquired by the data acquisition unit 21 in association with monitoring items and time information.
- the "monitoring item” includes ID information (tag) that is identification information of the monitoring item and the name of the monitoring item.
- the alarm output unit 23 for example, has a normal range of input data for all or some of the monitoring items.
- the alarm output unit 23 detects an abnormality when the input data of the monitoring item is out of the normal range.
- the alarm output unit 23 creates alarm information regarding the detected abnormality.
- the alarm output unit 23 stores the created alarm information in the alarm information storage unit 24 and outputs it to the monitor screen processing unit 25 .
- the alarm output unit 23 detects recovery from the abnormality when the input data of the monitoring item that was out of the normal range changes to within the normal range.
- the alarm output unit 23 detects the recovery from the abnormality
- the alarm output unit 23 creates alarm information regarding the recovery, stores the created alarm information in the alarm information storage unit 24 , and outputs it to the monitoring screen processing unit 25 .
- the method of detecting abnormality and recovery by the alarm output unit 23 is not limited to the above example, and it is possible to adopt a known method as appropriate.
- the alarm information includes an alarm ID, information on monitoring items, plant status, and time information.
- the information about the monitoring item includes, for example, the ID of the monitoring item, the name of the monitoring item, and the like.
- Plant states include, for example, abnormal and recovery.
- the time information includes the date and time of occurrence of an abnormality and the date and time of recovery.
- the monitoring screen processing unit 25 includes an alarm screen processing unit 251, a graph screen processing unit 252, and a logic screen processing unit 253.
- the alarm screen processing unit 251 When receiving alarm information from the alarm output unit 23, the alarm screen processing unit 251 causes the display unit 19 to display an alarm screen including alarm elements based on the alarm information. For example, the alarm screen processing unit 251 extracts all or part of the alarm information, creates an alarm element, and displays this alarm element on the alarm screen.
- the alarm screen is, for example, an alarm summary, and is a screen on which alarm elements are displayed as a list. In the alarm screen, alarm elements may be displayed in chronological order based on the date and time of anomaly or recovery.
- Fig. 3 shows an example of the warning screen.
- the alarm screen (alarm window) displays alarm elements K1 to K3 based on the alarm information currently occurring.
- each alarm element K1 to K3 includes, for example, an alarm ID, alarm level, plant status, date and time (abnormality occurrence date and time or restoration date and time), monitoring items, and detailed information.
- the warning screen processing unit 251 When receiving a warning screen display command from the input unit 18, the warning screen processing unit 251 creates a warning screen based on the display command and causes the display unit 19 to display it. For example, when an alarm screen display command and period information are input from the input unit 18, the alarm information generated in the period information input from the alarm information storage unit 24 is read, and the alarm screen is displayed based on the read alarm information. is created and displayed on the display unit 19 .
- the graph screen processing unit 252 causes the display unit 19 to display a trend graph screen on which the temporal transition of the input data related to the monitoring items of the plant 1 is drawn as a graph.
- the graph screen processing unit 252 acquires input data corresponding to preset monitoring items from the data acquisition unit 21 or the data storage unit 22, creates a graph based on the acquired input data, and displays the trend graph screen. to display.
- Graphs of a plurality of monitoring items may be displayed on the trend graph screen. The user can appropriately set, add, and change the monitoring items displayed in the graph on the trend graph screen.
- FIG. 4 is a diagram showing an example of the trend graph screen (trend graph window).
- the trend graph screen displays a graph based on input data of monitoring items set by the user.
- the trend graph screen has a recent mode and a historical mode.
- the graph screen processing unit 252 acquires the input values of the monitoring items to be displayed from the data acquisition unit 21 at any time, and displays a graph based on the acquired input values on the trend graph screen. Let As a result, the latest input data for each monitoring item is updated and displayed on the trend graph screen at any time.
- the graph screen processing unit 252 acquires input data from the data storage unit 22 in the past predetermined period specified by the user, and displays a graph based on the acquired input data on the trend graph screen. to display.
- the range of the time axis may be adjusted according to the length of the designated period.
- the graph screen processing unit 252 displays an alarm screen when the user operates the input unit 18 (for example, a mouse) while the alarm screen and the trend graph screen are displayed on the display unit 19. is dragged and dropped onto the trend graph screen, the dragged and dropped alarm element is specified, and the trend graph screen is updated based on the specified alarm element.
- the input unit 18 for example, a mouse
- the graph screen processing unit 252 acquires from the data storage unit 22 input data for a predetermined period (for example, a predetermined period before and after the acquired date and time) including the date and time specified from the dragged and dropped alarm element.
- the monitoring items for which the input data is acquired may be the monitoring items currently set to be displayed on the trend graph screen, or may be limited to monitoring items related to alarm elements.
- the graph screen processing unit 252 displays an emphasis element for emphasizing the date and time of occurrence of the abnormality or the date and time of recovery on the trend graph screen. Emphasis elements will be described later.
- the input data to be acquired may be limited to the monitoring item "AAN0253" of "J13", or may be preset monitoring items "AAN0256", “AAN0255”, and "AAN0253". These may also be set by the user.
- the trend graph screen displays graphs related to the input data before and after the date and time when the abnormality occurred.
- the graph screen processing unit 252 displays an emphasis element for emphasizing the date and time when an abnormality occurred on the trend graph screen.
- the emphasized element for example, as shown in FIG. 5, there is a mode in which a cursor CS is displayed at that time, a message MS indicating that time is displayed, and the like. As a result, it is possible to easily notify the user of the abnormal occurrence time and the temporal transition of the input data of the monitoring item in which the abnormality occurred.
- the graph screen processing unit 252 displays the abnormal occurrence dates and times included in the designated plurality of alarm elements on the trend graph screen. to adjust the range of the time axis. Specifically, the graph screen processing unit 252 acquires dates and times from a plurality of dragged and dropped alarm elements, and acquires input data for a predetermined period including all the acquired dates and times from the data storage unit 22 . The input data acquired at this time is the input data of the monitoring item related to the dragged and dropped alarm element. The graph screen processing unit 252 adjusts the range of the time axis so that the dates and times specified by all the dragged and dropped alarm elements are displayed on the trend graph screen. This makes it possible to present the user with temporal changes in the input data relating to each alarm element and each monitoring item.
- the graph screen processing unit 252 preferably displays the trend of each monitoring item on the trend graph screen in association with a plurality of alarm elements on the alarm screen. For example, when any one of a plurality of dragged and dropped alarm elements is selected (for example, clicked) on the alarm screen, the graph on the trend graph screen corresponding to the selected alarm element is displayed on another screen. may be displayed in a manner different from the graph of (for example, blinking, changing color or thickness, etc.). This makes it possible to present the user with an easy-to-understand temporal change in the input data of the selected alarm element.
- each alarm element on the alarm screen and each corresponding graph on the trend graph screen may be displayed in the same color.
- FIG. 5 when three alarm elements with alarm element IDs "J13", “J14”, and “J15" are dragged and dropped from the alarm screen to the trend graph screen, first, "J13” and “J15” is an alarm element regarding the occurrence and recovery of an abnormality for the common monitoring item "AAN0253".
- the alarm screen processing unit 251 and the graph screen processing unit 252 display the graph of the monitoring item "AAN0253" on the trend graph screen and the alarm elements "J13" and "J15” on the alarm screen in the same color.
- the graph of the monitoring item "AAN0256" on the trend graph screen and the alarm element “J14” on the alarm screen are displayed in the same color. This makes it possible for the user to easily grasp the relationship between each warning element on the alarm screen and each graph on the trend graph screen.
- the logic screen processing unit 253 extracts the control logic from the control logic storage unit (not shown) in which the control logic information of the plant 1 is stored.
- the logic screen processing unit 253 creates a logic screen based on the extracted control logic and causes the display unit 19 to display it.
- FIG. 6 is a diagram showing an example of the logic screen. As shown in FIG. 6, on the logic screen, for example, the control logic of the plant is displayed, and the current control state is displayed so as to be visually recognizable.
- the logic screen processing unit 253 executes the control logic related to the designated alarm element when a predetermined input operation is performed after any alarm element is selected on the alarm screen. Acquired from a control logic storage unit (not shown). The logic screen processing unit 253 creates a logic screen based on the acquired control logic and causes the display unit 19 to display it.
- An example of the predetermined input operation is, for example, an operation of pressing the menu button B1 for displaying a logic screen provided on the alarm screen.
- This menu button B1 may be always displayed at a predetermined position on the alarm screen, or may be configured to be temporarily displayed when an alarm element is specified and right-clicked.
- the input means for displaying the logic screen is not limited to the menu button B1, and may be an operation interface that allows input operations such as clicking.
- the logic screen processing unit 253 causes the display unit 19 to display the logic screen regarding the monitoring item corresponding to the selected graph. You can do it. As a result, various graphs displayed on the trend graph screen can be linked with the logic screen.
- the data acquisition unit 21 acquires input data from the plant 1 .
- Input data of the plant 1 may be input via a control device (not shown) that controls the plant 1 or may be input directly from various sensors provided in the plant 1 . That is, the method of acquiring input data in the plant 1 is not particularly limited.
- the data acquisition unit 21 associates the acquired input data with the monitoring item and the time information, stores them in the data storage unit 22 , and outputs them to the alarm output unit 23 .
- the alarm output unit 23 compares the input data with the normal range, detects an abnormality when the input data is out of the normal range, and creates alarm information regarding the detected abnormality.
- the alarm output unit 23 detects abnormal recovery when the input data outside the normal range transitions into the normal range, and creates alarm information regarding the detected abnormal recovery.
- the created alarm information is stored in the alarm information storage unit 24 and output to the monitoring screen processing unit 25 .
- the alarm screen processing unit 251 creates an alarm screen based on the alarm information and causes the display unit 19 to display it.
- the graph screen processing unit 252 creates a trend graph screen based on the input information and causes the display unit 19 to display it.
- the graph screen processing unit 252 may automatically display the trend graph screen on the display unit 19 .
- the user operates the input unit 18 to display one or more alarm elements displayed on the alarm screen.
- a graph based on the input data of the date specified by the drag-and-drop operation of the alarm element is displayed on the trend graph screen.
- a graph of the error occurrence date and/or the error recovery date and time for the alarm element selected by the user is displayed on the trend graph screen, and the error occurrence date and/or the error recovery date and time are highlighted.
- the logic screen processing unit 253 performs the operation when any alarm element is selected on the alarm screen and a predetermined input operation is performed, or when any graph is selected on the trend graph screen and a predetermined input operation is performed. When performed, a logic screen is created based on the control logic relating to the selected monitoring item and displayed on the display unit 19 .
- the plant monitoring device in the screen on which the alarm screen and the trend graph screen are displayed, one or more alarms displayed on the alarm screen
- a graph including the date and time specified by the dragged and dropped alarm element is displayed on the trend graph screen.
- the user can display a graph related to a desired alarm element on the trend graph screen with a single drag-and-drop operation, thereby enhancing convenience.
- the user can quickly take actions and judgments for plant recovery, shorten the time from plant stoppage to recovery, and reduce lost profits.
- the time axis is set so that the date and time of occurrence of an abnormality identified by the specified multiple alarm elements are displayed on the trend graph screen. range is adjusted.
- the user can confirm transitions of the input data of each monitoring item for a plurality of alarm elements while comparing them, and can comprehensively determine the cause of the occurrence of an abnormality.
- the trends of the multiple monitoring items displayed on the trend graph screen are associated with the multiple alarm elements on the alarm screen. Since it is displayed, it is possible to easily grasp which alarm element each graph on the trend graph screen corresponds to.
- the plant monitoring device 10 includes the data storage unit 22 and the alarm information storage unit 24, but the present invention is not limited to this example. may be configured to be stored on a server (for example, a cloud server or the like).
- a server for example, a cloud server or the like.
- the plant monitoring device, the plant monitoring method, and the program described in the embodiment described above are grasped, for example, as follows.
- a plant monitoring device (10) includes an alarm output unit (23) that creates alarm information including the date and time when an abnormality occurred when an abnormality in a plant (1) is detected, and an alarm based on the alarm information.
- an element is dragged and dropped onto the trend graph screen, displaying on the trend graph screen a graph of input data for a predetermined period including the date and time specified from the dragged and dropped alarm element, An emphasis element for emphasizing the date and time is displayed on the trend graph screen.
- the plant monitoring device it is possible to display a graph related to a desired alarm element on the trend graph screen with a single drag-and-drop operation, and it is possible to enhance the convenience of plant monitoring. . Since the date and time when the abnormality occurred is emphasized on the trend graph screen, the user can easily check how the input data changed before and after the date and time when the abnormality occurred. .
- the alarm output unit may create alarm information including the date and time of recovery when recovery from the plant abnormality is detected.
- alarm information is created not only when an abnormality occurs but also when the system recovers from an abnormality. This allows the user to easily check how the input data changed before and after the date and time when the system recovered from the abnormality.
- the graph screen processing unit specifies from each of the plurality of alarm elements when a drag-and-drop operation is performed on the alarm screen to the trend graph screen.
- the range of the time axis may be adjusted so that each date and time is displayed on the trend graph screen.
- the user can confirm while comparing the transition of the input data of each monitoring item for a plurality of alarm elements, and comprehensively judge the factors of the occurrence of abnormalities. becomes possible.
- the graph screen processing unit when a plurality of the alarm elements are dragged and dropped onto the trend graph screen on the alarm screen, each of the alarm elements on the alarm screen and the Each of the graphs displayed on the trend graph screen may be displayed in association with each other.
- the user can easily grasp which alarm element each graph on the trend graph screen corresponds to.
- a program according to the present disclosure causes a computer to function as the plant monitoring device described above.
- Plant 10 Plant monitoring device 13: Storage unit 18: Input unit 19: Display unit 21: Data acquisition unit 22: Data storage unit 23: Alarm output unit 24: Alarm information storage unit 25: Monitoring screen processing unit 251: Alarm Screen processing unit 252: Graph screen processing unit 253: Logic screen processing unit
Landscapes
- Engineering & Computer Science (AREA)
- Human Computer Interaction (AREA)
- Physics & Mathematics (AREA)
- General Physics & Mathematics (AREA)
- Automation & Control Theory (AREA)
- General Engineering & Computer Science (AREA)
- Theoretical Computer Science (AREA)
- Testing And Monitoring For Control Systems (AREA)
- User Interface Of Digital Computer (AREA)
Abstract
Description
入力部18は、例えば、キーボード、マウス、タッチパネル等、ユーザがプラント監視装置10に対して指示を与えるためのユーザインタフェースである。
表示部19は、例えば、LCD(Liquid Crystal Display)、有機EL(Electro Luminescence)等で構成される表示画面を有し、プラント監視装置10によって実行されたアプリケーション等の結果等を表示するものである。
データ取得部21は、取得した入力データに、その入力データを識別するための情報(以下「監視項目」という。)及びその入力データが取得された時間情報を関連づけて、データ記憶部22に格納する。
警報出力部23による異常及び復帰の検知手法については上述の例に限定されず、公知の手法を適宜採用することが可能である。
トレンドグラフ画面には、複数の監視項目についてのグラフが表示されてもよい。トレンドグラフ画面にグラフ表示される監視項目は、ユーザが適宜設定、追加、変更することが可能である。
また、グラフ画面処理部252は、トレンドグラフ画面において、異常発生日時又は復帰日時を強調させるための強調要素を表示させる。強調要素については後述する。
グラフ画面処理部252は、トレンドグラフ画面において、異常発生日時を強調させるための強調要素を表示させる。強調要素の一例として、例えば、図5に示すように、その時刻にカーソルCSを表示させる、その時刻を示すメッセージMSを表示させる等の態様が挙げられる。これにより、異常発生時刻や異常が発生した監視項目の入力データの時間的推移をユーザに容易に通知することができる。
具体的には、グラフ画面処理部252は、ドラッグアンドドロップ操作された複数の警報要素から日時を取得し、取得した全ての日時を含む所定期間の入力データをデータ記憶部22から取得する。このとき取得する入力データは、ドラッグアンドドロップ操作された警報要素に関する監視項目の入力データである。グラフ画面処理部252は、ドラッグアンドドロップ操作された全ての警報要素によって特定される日時がトレンドグラフ画面に表示されるように、時間軸のレンジを調整する。これにより、各警報要素と各監視項目に係る入力データの時間的変化をユーザに提示することができる。
データ取得部21は、プラント1から入力データを取得する。プラント1の入力データは、プラント1の制御を行う制御装置(図示略)を介して入力されてもよいし、プラント1に設けられている各種センサから直接的に入力されてもよい。すなわち、プラント1における入力データの取得手法については特に限定されない。データ取得部21は、取得した入力データに、その監視項目と時間情報を関連づけてデータ記憶部22に格納するとともに、警報出力部23に出力する。
グラフ画面処理部252は、入力部18からトレンドグラフ画面の表示指示が入力された場合に、その入力情報に基づいてトレンドグラフ画面を作成し、表示部19に表示させる。警報情報が出力された場合には、グラフ画面処理部252は、自動的にトレンドグラフ画面を表示部19に表示させることとしてもよい。
10 :プラント監視装置
13 :記憶部
18 :入力部
19 :表示部
21 :データ取得部
22 :データ記憶部
23 :警報出力部
24 :警報情報記憶部
25 :監視画面処理部
251 :警報画面処理部
252 :グラフ画面処理部
253 :ロジック画面処理部
Claims (6)
- プラントの異常が検知された場合に、異常が発生した日時を含む警報情報を作成する警報出力部と、
警報情報に基づく警報要素を含む警報画面を表示部に表示させる警報画面処理部と、
前記プラントの監視項目に係る入力データの時間的推移がグラフとして描かれたトレンドグラフ画面を前記表示部に表示させるグラフ画面処理部と
を備え、
前記グラフ画面処理部は、前記警報画面及び前記トレンドグラフ画面が前記表示部に表示されている状態で、前記警報画面に表示されている前記警報要素が前記トレンドグラフ画面にドラッグアンドドロップ操作された場合に、ドラッグアンドドロップ操作された前記警報要素から特定される前記日時を含む所定期間の入力データのグラフを前記トレンドグラフ画面に表示させるとともに、前記日時を強調させるための強調要素を前記トレンドグラフ画面に表示させるプラント監視装置。 - 前記警報出力部は、前記プラントの異常からの復帰が検知された場合に、復帰した日時を含む警報情報を作成する請求項1に記載のプラント監視装置。
- 前記グラフ画面処理部は、前記警報画面において複数の前記警報要素が前記トレンドグラフ画面にドラッグアンドドロップ操作された場合に、複数の前記警報要素の各々から特定される各日時が前記トレンドグラフ画面に表示されるように、時間軸のレンジを調整する請求項1又は2に記載のプラント監視装置。
- 前記グラフ画面処理部は、前記警報画面において複数の前記警報要素が前記トレンドグラフ画面にドラッグアンドドロップ操作された場合に、前記警報画面における各前記警報要素と前記トレンドグラフ画面に表示された各前記グラフとを対応付けて表示する請求項3に記載のプラント監視装置。
- プラントの異常が検知された場合に、異常が発生した日時を含む警報情報を作成する工程と、
警報情報に基づく警報要素を含む警報画面を表示部に表示させる工程と、
前記プラントの監視項目に係る入力データの時間的推移がグラフとして描かれたトレンドグラフ画面を前記表示部に表示させる工程と、
前記警報画面及び前記トレンドグラフ画面が前記表示部に表示されている状態で、前記警報画面に表示されている前記警報要素が前記トレンドグラフ画面にドラッグアンドドロップ操作された場合に、ドラッグアンドドロップ操作された前記警報要素から特定される前記日時を含む所定期間の入力データのグラフを前記トレンドグラフ画面に表示させるとともに、前記日時を強調させるための強調要素を前記トレンドグラフ画面に表示させる工程と
をコンピュータが実行するプラント監視方法。 - コンピュータを請求項1から4のいずれかに記載のプラント監視装置として機能させるためのプログラム。
Priority Applications (3)
| Application Number | Priority Date | Filing Date | Title |
|---|---|---|---|
| DE112022002826.2T DE112022002826T5 (de) | 2021-05-28 | 2022-05-23 | Anlagenüberwachungsvorrichtung, verfahren zur anlagenüberwachung und programm |
| US18/563,537 US20240241509A1 (en) | 2021-05-28 | 2022-05-23 | Plant monitoring device, plant monitoring method, and program |
| CN202280037218.7A CN117396821A (zh) | 2021-05-28 | 2022-05-23 | 设备监视装置、设备监视方法及程序 |
Applications Claiming Priority (2)
| Application Number | Priority Date | Filing Date | Title |
|---|---|---|---|
| JP2021-090185 | 2021-05-28 | ||
| JP2021090185A JP7631101B2 (ja) | 2021-05-28 | 2021-05-28 | プラント監視装置及びプラント監視方法並びにプログラム |
Publications (1)
| Publication Number | Publication Date |
|---|---|
| WO2022250023A1 true WO2022250023A1 (ja) | 2022-12-01 |
Family
ID=84228845
Family Applications (1)
| Application Number | Title | Priority Date | Filing Date |
|---|---|---|---|
| PCT/JP2022/021151 Ceased WO2022250023A1 (ja) | 2021-05-28 | 2022-05-23 | プラント監視装置及びプラント監視方法並びにプログラム |
Country Status (5)
| Country | Link |
|---|---|
| US (1) | US20240241509A1 (ja) |
| JP (1) | JP7631101B2 (ja) |
| CN (1) | CN117396821A (ja) |
| DE (1) | DE112022002826T5 (ja) |
| WO (1) | WO2022250023A1 (ja) |
Families Citing this family (1)
| Publication number | Priority date | Publication date | Assignee | Title |
|---|---|---|---|---|
| JP2025094662A (ja) | 2023-12-13 | 2025-06-25 | 横河電機株式会社 | プラント運転支援装置 |
Citations (5)
| Publication number | Priority date | Publication date | Assignee | Title |
|---|---|---|---|---|
| JP2009180860A (ja) * | 2008-01-30 | 2009-08-13 | Yokogawa Electric Corp | プロセス関連データ表示装置およびプロセス関連データ表示方法 |
| JP2012022595A (ja) * | 2010-07-16 | 2012-02-02 | Sky Co Ltd | 操作状況管理システム及び操作状況管理プログラム |
| JP2016115195A (ja) * | 2014-12-16 | 2016-06-23 | 株式会社東芝 | プラント監視装置 |
| JP2019102037A (ja) * | 2017-11-30 | 2019-06-24 | 東芝Itコントロールシステム株式会社 | プラント監視装置およびプラント監視方法 |
| JP2020087099A (ja) * | 2018-11-28 | 2020-06-04 | 日産自動車株式会社 | 異常表示装置及び異常表示方法 |
Family Cites Families (2)
| Publication number | Priority date | Publication date | Assignee | Title |
|---|---|---|---|---|
| JP6701038B2 (ja) * | 2016-09-08 | 2020-05-27 | アズビル株式会社 | 監視装置 |
| JP2018106577A (ja) * | 2016-12-28 | 2018-07-05 | 株式会社クボタ | グラフ生成装置、及び、グラフ生成方法 |
-
2021
- 2021-05-28 JP JP2021090185A patent/JP7631101B2/ja active Active
-
2022
- 2022-05-23 DE DE112022002826.2T patent/DE112022002826T5/de active Pending
- 2022-05-23 CN CN202280037218.7A patent/CN117396821A/zh active Pending
- 2022-05-23 WO PCT/JP2022/021151 patent/WO2022250023A1/ja not_active Ceased
- 2022-05-23 US US18/563,537 patent/US20240241509A1/en active Pending
Patent Citations (5)
| Publication number | Priority date | Publication date | Assignee | Title |
|---|---|---|---|---|
| JP2009180860A (ja) * | 2008-01-30 | 2009-08-13 | Yokogawa Electric Corp | プロセス関連データ表示装置およびプロセス関連データ表示方法 |
| JP2012022595A (ja) * | 2010-07-16 | 2012-02-02 | Sky Co Ltd | 操作状況管理システム及び操作状況管理プログラム |
| JP2016115195A (ja) * | 2014-12-16 | 2016-06-23 | 株式会社東芝 | プラント監視装置 |
| JP2019102037A (ja) * | 2017-11-30 | 2019-06-24 | 東芝Itコントロールシステム株式会社 | プラント監視装置およびプラント監視方法 |
| JP2020087099A (ja) * | 2018-11-28 | 2020-06-04 | 日産自動車株式会社 | 異常表示装置及び異常表示方法 |
Also Published As
| Publication number | Publication date |
|---|---|
| DE112022002826T5 (de) | 2024-03-14 |
| JP7631101B2 (ja) | 2025-02-18 |
| CN117396821A (zh) | 2024-01-12 |
| JP2022182564A (ja) | 2022-12-08 |
| US20240241509A1 (en) | 2024-07-18 |
Similar Documents
| Publication | Publication Date | Title |
|---|---|---|
| US12149375B2 (en) | Devices, methods, and systems for hands free facility status alerts | |
| JP5846736B2 (ja) | プロセス制御状態ロールアップの管理方法および装置、並びに、機械アクセス可能な媒体 | |
| US10901406B2 (en) | Method of monitoring and controlling an industrial process, and a process control system | |
| US10949062B2 (en) | Device maintenance apparatus, device maintenance method, device maintenance program, and recording medium | |
| EP2947529B1 (en) | Information display method, information display apparatus, information display system, and non-transitory computer readable storage medium | |
| US8468462B2 (en) | Display management in a multi-window display | |
| EP3012701B1 (en) | Apparatus and method for managing operator alertness and enhancing operator effectiveness for industrial control systems | |
| CN102568147A (zh) | 半导体设备软件故障报警方法 | |
| JP7631101B2 (ja) | プラント監視装置及びプラント監視方法並びにプログラム | |
| JP2006330774A (ja) | プロセス異常状態回復操作支援システム | |
| JP7113880B2 (ja) | 稼働監視装置、及び稼働監視方法 | |
| JP2009151398A (ja) | 監視制御システム | |
| CN107614804A (zh) | 挖掘机支援装置 | |
| JP7726131B2 (ja) | 設備を保守するための装置、方法、およびプログラム | |
| CN111066038A (zh) | 警报使能的被动应用整合 | |
| TW202400381A (zh) | 監視裝置及機器人監視系統 | |
| US20220147039A1 (en) | Event analytics in modular industrial plants | |
| US11281183B2 (en) | Unified control system and method for machining of parts | |
| KR102879690B1 (ko) | Ai 기반의 제조 공정 표준 통합 관리 및 모니터링을 위한 방법 | |
| JP2022166883A (ja) | プラント監視制御装置 | |
| WO2026096742A1 (en) | System and method for monitoring and controlling magnetic separators | |
| JP2021189766A (ja) | 生産システム | |
| JP6247542B2 (ja) | 監視ポイント定義変更方法およびエンジニアリング装置 | |
| JP2714443B2 (ja) | 更新データの有効性表示方法およびプロセス運転監視装置 | |
| WO2024105853A1 (ja) | 射出成形機及び射出成形システム |
Legal Events
| Date | Code | Title | Description |
|---|---|---|---|
| 121 | Ep: the epo has been informed by wipo that ep was designated in this application |
Ref document number: 22811293 Country of ref document: EP Kind code of ref document: A1 |
|
| WWE | Wipo information: entry into national phase |
Ref document number: 18563537 Country of ref document: US |
|
| WWE | Wipo information: entry into national phase |
Ref document number: 202280037218.7 Country of ref document: CN |
|
| WWE | Wipo information: entry into national phase |
Ref document number: 112022002826 Country of ref document: DE |
|
| 122 | Ep: pct application non-entry in european phase |
Ref document number: 22811293 Country of ref document: EP Kind code of ref document: A1 |