WO2022196666A1 - 情報処理装置及び情報処理方法 - Google Patents
情報処理装置及び情報処理方法 Download PDFInfo
- Publication number
- WO2022196666A1 WO2022196666A1 PCT/JP2022/011470 JP2022011470W WO2022196666A1 WO 2022196666 A1 WO2022196666 A1 WO 2022196666A1 JP 2022011470 W JP2022011470 W JP 2022011470W WO 2022196666 A1 WO2022196666 A1 WO 2022196666A1
- Authority
- WO
- WIPO (PCT)
- Prior art keywords
- data
- unit
- evaluation
- learning
- information processing
- Prior art date
- Legal status (The legal status is an assumption and is not a legal conclusion. Google has not performed a legal analysis and makes no representation as to the accuracy of the status listed.)
- Ceased
Links
Images












Classifications
-
- G—PHYSICS
- G05—CONTROLLING; REGULATING
- G05B—CONTROL OR REGULATING SYSTEMS IN GENERAL; FUNCTIONAL ELEMENTS OF SUCH SYSTEMS; MONITORING OR TESTING ARRANGEMENTS FOR SUCH SYSTEMS OR ELEMENTS
- G05B23/00—Testing or monitoring of control systems or parts thereof
- G05B23/02—Electric testing or monitoring
- G05B23/0205—Electric testing or monitoring by means of a monitoring system capable of detecting and responding to faults
- G05B23/0259—Electric testing or monitoring by means of a monitoring system capable of detecting and responding to faults characterized by the response to fault detection
- G05B23/0283—Predictive maintenance, e.g. involving the monitoring of a system and, based on the monitoring results, taking decisions on the maintenance schedule of the monitored system; Estimating remaining useful life [RUL]
-
- G—PHYSICS
- G06—COMPUTING OR CALCULATING; COUNTING
- G06N—COMPUTING ARRANGEMENTS BASED ON SPECIFIC COMPUTATIONAL MODELS
- G06N20/00—Machine learning
-
- G—PHYSICS
- G06—COMPUTING OR CALCULATING; COUNTING
- G06F—ELECTRIC DIGITAL DATA PROCESSING
- G06F11/00—Error detection; Error correction; Monitoring
- G06F11/30—Monitoring
- G06F11/34—Recording or statistical evaluation of computer activity, e.g. of down time, of input/output operation ; Recording or statistical evaluation of user activity, e.g. usability assessment
Definitions
- the present disclosure relates to an information processing device and an information processing method.
- Equipment is equipped with sensors that detect the operating state of the equipment. Abnormalities in equipment are detected by learning sensor data output from sensors and generating a learning model.
- Patent Literature 1 discloses an anomaly detection device that detects concept drift by evaluating accuracy when re-learning a learning model compared to the time of previous learning.
- the present disclosure provides an information processing device and an information processing method capable of detecting concept drift with high immediacy and with a small amount of computation.
- An information processing device generates a first evaluation result by evaluating the quality of a plurality of first data, and generates a second evaluation result by evaluating the quality of a plurality of second data.
- a learning unit that generates a learning model for detecting an abnormality by performing machine learning using the plurality of first data; and the first evaluation result and the second evaluation result. and a detection unit that detects concept drift based on the comparison result; and an estimation unit that estimates anomalies in the plurality of second data by applying the learning model to the plurality of second data.
- An information processing method includes a step of generating a first evaluation result by evaluating the quality of a plurality of first data, and performing machine learning using the plurality of first data. , the step of generating a learning model for detecting anomalies, the step of generating a second evaluation result by evaluating the quality of a plurality of second data, the first evaluation result and the second evaluation result; and detecting concept drift based on the comparison result; and applying the learning model to the plurality of second data to estimate the presence or absence of an abnormality in the plurality of second data.
- one aspect of the present disclosure can be implemented as a program that causes a computer to execute the information processing method.
- one aspect of the present disclosure can be implemented as a computer-readable non-temporary recording medium storing the program.
- concept drift can be detected with high immediacy and with a small amount of computation.
- FIG. 1 is a diagram showing the configuration of an information processing apparatus according to an embodiment.
- FIG. 2 is a diagram showing data types of lot data, which is an example of an input data set.
- FIG. 3 is a diagram illustrating an outline of processing of the information processing apparatus according to the embodiment;
- FIG. 4 is a diagram showing data after preprocessing.
- FIG. 5A is a diagram showing a basic profile used for data quality evaluation.
- FIG. 5B is a diagram showing a statistic profile used for data quality evaluation.
- FIG. 5C is a diagram showing a machine learning profile used for data quality evaluation.
- FIG. 6 is a diagram showing a learning model generated by machine learning.
- FIG. 7 is a flowchart showing the operation of the learning phase among the operations of the information processing apparatus according to the embodiment.
- FIG. 7 is a flowchart showing the operation of the learning phase among the operations of the information processing apparatus according to the embodiment.
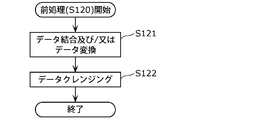
- FIG. 8 is a flowchart showing preprocessing among operations of the information processing apparatus according to the embodiment.
- FIG. 9 is a flowchart showing data quality evaluation in the learning phase among the operations of the information processing apparatus according to the embodiment.
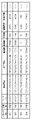
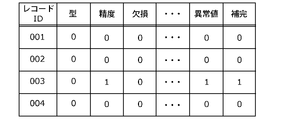
- FIG. 10A is a diagram showing check results for each record and each evaluation item based on the basic profile.
- FIG. 10B is a diagram showing quality evaluation results based on the basic profile.
- FIG. 11 is a flowchart showing operations in an operation phase among operations of the information processing apparatus according to the embodiment.
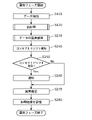
- FIG. 12 is a flowchart illustrating a modification of the operation in the operation phase among the operations of the information processing apparatus according to the embodiment.
- FIG. 13 is a flowchart showing data quality evaluation in the operation phase of the operation of the information processing apparatus according to the embodiment.
- FIG. 14 is a diagram showing a concept drift detection recipe.
- FIG. 15A is a diagram showing a recipe of data items in a concept drift detection recipe.
- FIG. 15B is a diagram showing a concept drift determination recipe in the concept drift detection recipe.
- FIG. 15C is a diagram showing a concept drift notification recipe.
- FIG. 16 is a diagram showing rules for each event that can occur in a factory.
- FIG. 17 is a diagram showing sensor data and its statistics.
- FIG. 18 is a block diagram showing configurations of a notification unit and a UI unit of the information processing apparatus according to the embodiment.
- FIG. 19 is a diagram showing a data analysis UI.
- FIG. 20 is a diagram showing a notification UI for list confirmation.
- FIG. 21 is a diagram showing a detailed confirmation notification UI.
- An information processing device generates a first evaluation result by evaluating the quality of a plurality of first data, and generates a second evaluation result by evaluating the quality of a plurality of second data.
- a learning unit that generates a learning model for detecting an abnormality by performing machine learning using the plurality of first data; and the first evaluation result and the second evaluation result. and a detection unit that detects concept drift based on the comparison result; and an estimation unit that estimates anomalies in the plurality of second data by applying the learning model to the plurality of second data.
- concept drift is detected based on the evaluation result of the quality of the second data, which is the target of anomaly estimation.
- concept drift can be detected by comparing quality evaluation results, and there is no need to process a huge amount of data as in the case of re-learning. Therefore, it is possible to reduce the amount of calculation required for concept drift detection.
- concept drift can be detected with high immediacy and with a small amount of calculation.
- the evaluation unit evaluates each of the plurality of first data and the plurality of second data based on a first profile in which at least one of a data type, a character code, and an abnormal value is an evaluation item.
- the first evaluation results include evaluation results of the plurality of first data based on the first profile
- the second evaluation results include the plurality of second data based on the first profile It may also include data evaluation results.
- the evaluation unit evaluates the statistics of the plurality of first data and the statistics of the plurality of second data based on a second profile having one or more statistics as evaluation items.
- an evaluation unit wherein the first evaluation results include evaluation results of the plurality of first data based on the second profile, and the second evaluation results are evaluation results of the plurality of second data based on the second profile May include evaluation results.
- the evaluation unit includes a learning evaluation unit that evaluates the plurality of second data based on a third profile having one or more features of the machine learning as evaluation items, and the second evaluation result is , evaluation results of the plurality of second data based on the third profile.
- the information processing apparatus further includes an acquisition unit that acquires a plurality of data, and performs preprocessing of the plurality of data, thereby obtaining the plurality of first data and the plurality of and a preprocessing unit that generates the second data.
- the preprocessing may include at least one of data combination and data conversion, and data cleansing.
- the results of the second stage of data cleansing can also be used for data quality evaluation by structuring the preprocessing. Therefore, since the reliability of the comparison result of the evaluation result is also improved, the detection accuracy of the concept drift based on the comparison result can also be improved.
- the information processing apparatus may further include a notification unit that notifies that concept drift has been detected when concept drift is detected by the detection unit.
- the learning unit when concept drift is detected by the detection unit, the learning unit performs machine learning using a plurality of data different from the plurality of first data to generate a new learning model. may be generated.
- an information processing method includes a step of generating a first evaluation result by evaluating the quality of a plurality of first data, and performing machine learning using the plurality of first data. a step of generating a learning model for detecting an anomaly; a step of generating a second evaluation result by evaluating the quality of a plurality of second data; the first evaluation result and the second evaluation; a step of comparing the results and detecting concept drift based on the comparison results; and a step of estimating the presence or absence of anomalies in the plurality of second data by applying the learning model to the plurality of second data. ,including.
- a program according to one aspect of the present disclosure is a program that causes a computer to execute the information processing method according to the above aspect.
- each figure is a schematic diagram and is not necessarily strictly illustrated. Therefore, for example, scales and the like do not necessarily match in each drawing. Moreover, in each figure, the same code
- FIG. 1 is a diagram showing the configuration of an information processing apparatus 100 according to this embodiment.
- the information processing device 100 shown in FIG. 1 is a device that estimates an abnormality in an input data set by performing machine learning.
- the input data set consists of multiple pieces of data and is stored in the data storage unit 101.
- the input data set is, for example, lot data related to lot manufacturing, which is a manufacturing unit of a product.
- FIG. 2 is a diagram showing data types of lot data, which is an example of an input data set.
- the lot data shown in FIG. 2 includes data items related to lot manufacturing, which is a manufacturing unit of a product, and values for each of the data items.
- the data items are roughly divided into four: basic lot information, environmental data, manufacturing conditions, and process data.
- the basic lot information includes the lot name, lot start time, lot end time, product name, and the like of the target lot.
- the environmental data includes temperature, humidity, atmospheric pressure, utility power, etc. at the time of production of the target lot.
- the manufacturing conditions include the process name, facility name, product type name, line name and product specifications of the target lot.
- the process data includes ideal tact time, effective takt time, stoppage time, defective manufacturing time, number of production, number of non-defective items, number of defective items, manufacturing quality data, equipment correction data, and the like of the target lot.
- the value for each data item is, for example, sensor data acquired by a sensor installed in a manufacturing facility, a manufacturing line or a factory, or input data input by a manufacturing manager, etc., or based on these data
- This data is generated by That is, the plurality of data included in the input data set includes, for example, the plurality of sensor data output from the plurality of sensors that detect the operational state of the manufacturing equipment.
- the sensor data is time-series data representing changes in sensor output over time.
- the data shown in the production conditions are used as feature values for machine learning.
- the process data includes data used as an explanatory variable for machine learning and data used as an objective variable for machine learning.
- the number of production, the number of non-defective products, and the number of defective products are used as explanatory variables, and the ideal takt time is used as an objective variable.
- each data of environmental data and process data is used to calculate statistics for each data item. It should be noted that which data item is used and how is determined in advance, or can be appropriately set by the administrator of the information processing apparatus 100 or the like.
- the information processing apparatus 100 estimates an abnormality in manufacturing equipment by estimating an abnormality in lot data.
- Abnormality is a failure or defect of manufacturing equipment, and means a state in which the production efficiency of products (non-defective products) is reduced.
- FIG. 3 is a diagram showing an outline of processing of the information processing apparatus 100 according to the present embodiment.
- the processing performed by the information processing apparatus 100 can be divided into a learning phase and an operation phase.
- the learning phase the information processing apparatus 100 performs machine learning using a learning data set to generate and store learning results.
- the learning result includes, for example, a learning model for detecting anomalies.
- the operation phase the information processing apparatus 100 performs anomaly estimation by applying the learning model generated in the learning phase to the data set to be anomaly estimation target.
- the information processing device 100 evaluates the quality of the dataset in both the learning phase and the operation phase.
- the information processing apparatus 100 compares the quality evaluation result in the learning phase with the quality evaluation result in the operation phase, and detects concept drift based on the comparison result.
- Concept drift means that the statistical characteristics of the target variable that the learning model is trying to predict change over time in unexpected ways.
- cept drift also means a state in which the learning model should not be applied to the target data set in the operation phase due to the above change.
- cept drift detected means that the learning model is no longer optimal.
- concept drift is detected using the quality evaluation comparison result in the operation phase. is high.
- the comparison result of quality evaluation is used, there is no need to process a large amount of data as in re-learning, and the amount of calculation required to detect concept drift is reduced.
- the information processing apparatus 100 is computer equipment that executes the information processing method according to the present embodiment.
- Information processing apparatus 100 may be a single computer device, or may be a plurality of computer devices connected via a network.
- the information processing apparatus 100 includes, for example, a nonvolatile memory storing a program, a volatile memory serving as a temporary storage area for executing the program, an input/output port, and a processor executing the program.
- the processor cooperates with a memory or the like to execute processing of each functional processing unit included in the information processing apparatus 100 .
- the information processing device 100 reads necessary data sets from the data storage unit 101 and uses the read data sets to execute each process.
- the data storage unit 101 is a storage device separate from the information processing apparatus 100, and is connected to the information processing apparatus 100 by wire or wirelessly so as to be communicable.
- the data storage unit 101 is a HDD (Hard Disk Drive), an SDD (Solid State Drive), or the like. Note that the information processing apparatus 100 may incorporate the data storage unit 101 .
- the information processing apparatus 100 includes an extraction unit 110, a preprocessing unit 120, a quality evaluation unit 130, a learning unit 140, a detection unit 150, an abnormality estimation unit 160, and a data management unit. 170 and a UI (user interface) section 180 .
- the extraction unit 110 is an example of an acquisition unit that acquires multiple pieces of data. Extraction unit 110 extracts a plurality of data from data storage unit 101 . Specifically, the extraction unit 110 extracts a data set for learning in the learning phase, and extracts a data set for abnormality estimation in the operation phase.
- the preprocessing unit 120 preprocesses a plurality of data.
- the preprocessing unit 120 performs preprocessing in both the learning phase and the operation phase.
- Pre-processing is the process of arranging the data format in order to perform machine learning or apply it to a learning model. Specific contents of the preprocessing will be described later.
- the preprocessing unit 120 preprocesses the learning data set extracted by the extraction unit 110 to generate a plurality of learning data.
- the learning data is an example of first data, such as sensor data.
- the preprocessing unit 120 generates a plurality of operational data by performing preprocessing on the data set to be anomaly estimation target extracted by the extraction unit 110 .
- Operational data is an example of second data, such as sensor data.
- Operational data is data that is not used for machine learning.
- the operational data can be future learning data, that is, learning data used for re-learning.
- FIG. 4 is a diagram showing data after preprocessing.
- the preprocessed data is learning data or operational data, and includes multiple records. Each record contains a value for each data item. Both learning data and operational data can be represented in tabular form as shown in FIG. Although FIG. 4 shows an example in which one record is generated for each lot, the present invention is not limited to this.
- the quality evaluation unit 130 generates evaluation results in the learning phase by evaluating the quality of multiple pieces of learning data.
- the evaluation result in the learning phase is an example of the first evaluation result.
- the quality evaluation unit 130 generates an evaluation result in the operation phase by evaluating the quality of a plurality of operation data.
- the evaluation result in the operation phase is an example of the second evaluation result.
- the quality evaluation unit 130 evaluates learning data and operational data based on three profiles.
- a profile is information indicating an evaluation item in data quality evaluation and an appropriate value or appropriate range for each evaluation item.
- the profile is stored, for example, in the memory of the quality evaluation section 130 or the data management section 170 .
- the three profiles are specifically the basic profile, statistics profile and machine learning profile.
- FIG. 5A is a diagram showing a basic profile used for data quality evaluation.
- a basic profile is an example of a first profile having at least one of data type, character code, and abnormal value (noise) as an evaluation item.
- the basic profile shown in FIG. 5A consists of evaluation items for the data set as a whole and evaluation items for individual data.
- Evaluation items for the dataset as a whole include, for example, the file type (data format) of the dataset, character code, line feed code, and/or the number of data for each record.
- Evaluation items for individual data include, for example, the type of each data item, whether NULL is allowed, and/or whether it is within the valid range (that is, whether it is an abnormal value).
- a valid range is defined by upper and lower values.
- FIG. 5B is a diagram showing a statistic profile used for data quality evaluation.
- a statistic profile is an example of a second profile having one or more statistics as evaluation items.
- the statistic profile shown in FIG. 5B includes an average value, maximum value, minimum value, and 3 ⁇ ( ⁇ is standard deviation) for a certain data item as examples of statistics.
- the statistics profile defines data items for which statistics are to be calculated and grouping items.
- FIG. 5C is a diagram showing a machine learning profile used for data quality evaluation.
- the machine learning profile is an example of a third profile having one or more features of machine learning as evaluation items.
- an explanatory variable (feature) data item for checking whether the feature is learned and whether it is within the learning statistic is defined for each model.
- the machine learning profile also defines a reference to the learning result to check if it is within the learning statistic.
- the machine learning profile indicates items for quality evaluation based on the results of machine learning and appropriate values or appropriate ranges of the items.
- the quality evaluation unit 130 includes a basic evaluation unit 131, a statistic evaluation unit 132, and a learning evaluation unit 133.
- the basic evaluation unit 131 evaluates multiple learning data and multiple operational data based on the basic profile shown in FIG. 5A.
- the statistic evaluation unit 132 evaluates multiple learning data and multiple operational data based on the statistic profile shown in FIG. 5B.
- the learning evaluation unit 133 evaluates multiple pieces of operational data based on the machine learning profile shown in FIG. 5C. Note that the machine learning profile is generated as a result of the learning phase. Therefore, the learning evaluation unit 133 does not use the machine learning profile to evaluate the learning data.
- the learning unit 140 generates a learning model for detecting anomalies by performing machine learning using a plurality of pieces of learning data. As shown in FIG. 1 , learning unit 140 includes model generation unit 141 , model evaluation unit 142 , and model update unit 143 .
- the model generation unit 141 generates a learning model by performing machine learning using a plurality of learning data.
- Machine learning is performed by Bayesian estimation, for example.
- a learning model is defined, for example, by the type of distribution of an objective variable (eg, effective takt time) and one or more parameters of the distribution. For example, if the distribution is normal, the parameters include mean and variance.
- the distribution may be log-exponential, zero-over exponential, normal exponential or gamma, and the like.
- the machine learning method is not particularly limited.
- a method using a classifier a method using an incremental support vector machine, an incremental decision tree method, an incremental deep convolutional neural network method, and the like can be used.
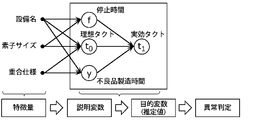
- FIG. 6 is a diagram showing a learning model generated by machine learning.
- stop time f ideal tact time t0 , and defective product manufacturing time y are used as explanatory variables
- effective tact time t1 is used as objective variables.
- the three explanatory variables are determined based on multiple features.
- the name of the facility used for manufacturing, the size of the device, which is the size of the product, and the polymerization specification, which is one of the specifications of the product are exemplified as the feature quantity, but the feature quantity is not limited to these.
- a feature amount is selected from, for example, a plurality of data items shown in FIG.
- the model evaluation unit 142 evaluates the generated learning model. Specifically, the model evaluation unit 142 evaluates the learning model to determine whether the learning model needs to be updated. For example, the model evaluation unit 142 evaluates the reliability of the abnormality estimation result based on the difference between the abnormality estimation result estimated based on the learning model and the abnormality that actually occurred. The model evaluation unit 142 determines that the accuracy of the learning model is higher as the abnormality estimation result is correct. The model evaluation unit 142 determines that the learning model needs to be updated when the accuracy of the learning model becomes low.
- the model update unit 143 updates the learning model. Specifically, when concept drift is detected by the detection unit 150, the model update unit 143 sets a plurality of data different from the learning data used to generate the learning model before updating (that is, the previous learning data). A new learning model is generated by performing machine learning using (that is, new learning data). New learning data includes, for example, operational data when concept drift is detected. New learning data may include at least a portion of previous learning data.
- the detection unit 150 compares the quality evaluation results in the learning phase and the quality evaluation results in the operation phase, and detects concept drift based on the comparison results. As shown in FIG. 1 , detection unit 150 includes data quality extraction unit 151 , change detection unit 152 , and notification unit 153 .
- the data quality extraction unit 151 extracts the quality evaluation result 173 managed by the data management unit 170.
- the change detection unit 152 detects changes in data quality. Specifically, the change detection unit 152 compares the quality evaluation result in the learning phase with the quality evaluation result in the operation phase. For example, the change detection unit 152 determines whether or not the quality evaluation result in the operation phase is within an appropriate range determined based on the quality evaluation result in the learning phase. When the quality evaluation result in the operation phase is out of the proper range, that is, when the difference in quality evaluation result between the operation phase and the learning phase is large, the change detection unit 152 determines that concept drift has been detected.
- the appropriate range may be the quality evaluation result itself in the learning phase, or may be a predetermined range that can be regarded as being substantially the same as the quality evaluation result in the learning phase.
- evaluation items to compare among the multiple evaluation items and the number of such evaluation items are determined based on predetermined rules.
- a rule is defined for each event that can occur at a manufacturing site such as a factory, for example. Specific examples of events and their relationship to profiles will be described later with reference to FIG.
- the notification unit 153 notifies that the concept drift is detected when the concept drift is detected.
- the notification unit 153 uses e-mail and/or a short message function to notify a pre-registered terminal or the like that concept drift has been detected. A specific configuration and processing contents of the notification unit 153 will be described later.
- the anomaly estimating unit 160 estimates the presence or absence of anomalies in a plurality of operational data by applying a learning model to a plurality of operational data. As shown in FIG. 1 , abnormality estimating section 160 includes predicting section 161 and classifying section 162 .
- the prediction unit 161 predicts objective variables based on a plurality of operational data and learning models. Specifically, the prediction unit 161 calculates an estimated value of the objective variable by applying a learning model to multiple operational data.
- the estimated value of the objective variable is the estimated value of the effective takt time in the example shown in FIG.
- the classification unit 162 classifies the measured value into either abnormal or normal based on the prediction result (that is, estimated value) obtained by the prediction unit 161 . Specifically, the classification unit 162 calculates, as the degree of abnormality, the degree of divergence that indicates the extent to which the actual measurement value of the effective tact time included in the operational data deviates from the estimated value of the effective tact time. It means that the larger the deviation, the more abnormal the measured value. For example, the classification unit 162 compares the calculated degree of divergence with a threshold, and determines that the operational data is abnormal when the degree of divergence is greater than the threshold. The classification unit 162 determines that the operation data is normal when the degree of deviation is smaller than the threshold. Note that the method of classifying operational data as abnormal and normal is not limited to this.
- the data management unit 170 holds data required for processing by the information processing device 100 according to the present embodiment, data obtained by processing by the information processing device 100, and the like. For example, as shown in FIG. 1, the data management unit 170 stores and manages an abnormality estimation result 171, a concept drift detection result 172, a quality evaluation result 173, a learning result 174, and a data set 175. .
- the abnormality estimation result 171 is data indicating the result estimated by the abnormality estimation unit 160 .
- the concept drift detection result 172 is data indicating the concept drift detection result by the detection unit 150 .
- the quality evaluation result 173 is the evaluation result of the data quality of each of the learning data and the operational data by the quality evaluation unit 130 .
- the learning result 174 is data indicating the learning result by the learning unit 140 .
- the learning result 174 specifically includes learning model parameters and the like.
- the data set 175 is a data set extracted by the extraction unit 110 and preprocessed by the preprocessing unit 120 . That is, data set 175 includes learning data and operational data.
- the data management unit 170 associates and manages the quality evaluation results and the learning results 174 in the learning phase. That is, the quality evaluation result and the learning result 174 generated using the same learning data are associated with each other.
- the data management unit 170 also manages the quality evaluation results, the abnormality estimation results 171, and the concept drift detection results 172 in the operation phase in association with each other. That is, the quality evaluation result, the abnormality estimation result 171, and the concept drift detection result 172 generated using the same operational data are associated with each other.
- the UI unit 180 generates and manages user interfaces. Specifically, the UI unit 180 generates a GUI (Graphical Use Interface).
- the GUI includes a display screen (window) including text and images, and buttons or icons that can be operated or selected by the user.
- the UI unit 180 displays a display screen on the display, receives operation input from the user, and performs processing according to the received operation input.
- the user is, for example, an administrator of the information processing apparatus 100 or an administrator of manufacturing. A specific GUI example will be described later.
- the display is a display device different from the information processing device 100 , but may be a display unit included in the information processing device 100 .
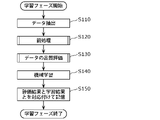
- FIG. 7 is a flowchart showing the operation of the learning phase among the operations of information processing apparatus 100 according to the present embodiment.
- the learning phase is started periodically or when instructed to start by an administrator or the like. Alternatively, the learning phase may be initiated when concept drift is detected.
- the extraction unit 110 first extracts a data set for learning (S110).
- the extraction unit 110 extracts, for example, a plurality of sensor data for a predetermined period such as one week or one month from the data storage unit 101 as a data set for learning.
- the preprocessing unit 120 preprocesses the extracted learning data set (S120).
- Learning data which is preprocessed data, is stored in memory as a data set 175 and managed by the data management unit 170 .
- a specific example of preprocessing will be described later with reference to FIG.
- the quality evaluation unit 130 evaluates the quality of the learning data (S130).
- the quality evaluation result is stored in memory as part of the quality evaluation result 173 by the data management unit 170 and managed. A specific example of quality evaluation of learning data will be described later with reference to FIG.
- the learning unit 140 generates a learning model by performing machine learning using the learning data (S140).
- the data management unit 170 stores the generated learning model as a learning result 174 in association with the quality evaluation result 173 and manages it (S150).
- the learning phase not only the learning result 174 generated using the learning data but also the quality evaluation result of the learning data are stored. Quality evaluation results are used to detect concept drift.
- FIG. 8 is a flowchart showing preprocessing among the operations of the information processing apparatus 100 according to the present embodiment.
- the preprocessing unit 120 performs preprocessing in a structured manner. Specifically, the preprocessing unit 120 performs preprocessing in two steps.
- the preprocessing unit 120 performs at least one of data combination and data conversion on a plurality of sensor data extracted by the extraction unit 110 as the first stage of processing. Processing is performed (S121). Data merging is performed, for example, to equalize the time lengths of time-series data. Data conversion is, for example, smoothing of time-series data.
- the first-stage processing may include processing for extracting feature amounts such as statistical values. Thereby, as shown in FIG. 4, the data after completion of the first-stage processing can be expressed in tabular form.
- Data cleansing includes processes such as removing abnormal values (or abnormal records), removing missing records, and supplementing missing data.
- learning data is generated by preprocessing in two stages. Note that the processing performed as preprocessing is not limited to the example described above. Also, pretreatment may not be performed.
- FIG. 9 is a flowchart showing data quality evaluation in the learning phase in the operation of information processing apparatus 100 according to the present embodiment.
- the quality evaluation unit 130 first reads the basic profile and the statistics profile (S131).
- the basic evaluation unit 131 evaluates the learning data based on the basic profile (S132). Specifically, the basic evaluation unit 131 evaluates the learning data for each record with respect to the items defined in the basic profile.
- the basic evaluation unit 131 determines whether the target data is within the appropriate value or within the appropriate range. If the target data is within the appropriate value or within the appropriate range, it is determined as “conforming (normal)", and otherwise, it is determined as “nonconforming (abnormal)".
- the results of data cleansing (S122) in the preprocessing are also subject to quality evaluation as noise items defined in the basic profile shown in FIG. 5A.
- FIG. 10A is a diagram showing check results for each record and each evaluation item based on the basic profile. As shown in FIG. 10A, a check result is associated with each combination of record ID and evaluation item. The check result is represented by, for example, a binary value of "0" representing conformity and "1" representing nonconformity.
- the basic evaluation unit 131 generates evaluation results for each evaluation item by statistically processing the check results for each record. For example, the basic evaluation unit 131 generates evaluation results shown in FIG. 10B.
- FIG. 10B is a diagram showing quality evaluation results based on the basic profile.
- the quality evaluation result shown in FIG. 10B represents the nonconforming rate (abnormality rate) for each evaluation item.
- the anomaly rate is the ratio of the number of records indicating nonconformity (abnormality) to the total number of records included in the learning data.
- the data management unit 170 stores the check results shown in FIG. 10A and the evaluation results shown in FIG. 10B in memory as part of the quality evaluation results in the learning phase (S133). Note that the quality evaluation results to be saved may include the evaluation results shown in FIG. 10B, and may not include the check results for each record and each evaluation item shown in FIG. 10A.
- the statistic evaluation unit 132 evaluates the learning data based on the statistic profile (S134). Specifically, the statistic evaluation unit 132 calculates the statistic defined in the statistic profile for each data item. In the case of the learning data shown in FIG. 4, the statistic evaluation unit 132 calculates the statistic for each number of products and number of defects, for example.
- the data management unit 170 stores the calculated statistics in memory as part of the quality evaluation results in the learning phase (S135).
- FIG. 11 is a flow chart showing the operation of the operation phase among the operations of the information processing apparatus 100 according to the present embodiment.
- the operation phase is started when a start instruction is received from a manager or the like, or while the manufacturing equipment is in operation.
- the extraction unit 110 first extracts a data set to be anomaly estimation target (S110).
- the extraction unit 110 extracts, from the data storage unit 101, a plurality of pieces of sensor data for a predetermined period such as 1 second, 1 minute, 10 minutes, or 1 hour.
- the period of the data set for anomaly estimation is shorter than the period of the learning data set, but is not limited to this.
- the extraction unit 110 may acquire sensor data output from each sensor provided in the manufacturing equipment. That is, the process illustrated in FIG. 11 may be repeated substantially in real time as the product is manufactured.
- the preprocessing unit 120 preprocesses the extracted dataset (S120).
- the preprocessing is the same as the learning phase and is done in two stages as shown in FIG.
- Operational data which is preprocessed data, is stored in the memory as a data set 175 and managed by the data management unit 170 .
- the quality evaluation unit 130 evaluates the quality of the operational data (S230).
- the quality evaluation result is stored in memory as part of the quality evaluation result 173 by the data management unit 170 and managed. A specific example of quality evaluation of operational data will be described later with reference to FIG.
- the detection unit 150 detects concept drift based on the quality evaluation result 173 (S240).
- concept drift detection A specific example of concept drift detection will be described later with reference to FIGS. 14 to 17.
- the notification unit 153 When concept drift is detected (Yes in S250), the notification unit 153 notifies that concept drift has been detected (S260).
- the anomaly estimation unit 160 estimates an anomaly in the operational data by applying the learning model to the operational data (S270).
- the abnormality estimation unit 160 stores the abnormality estimation result in the memory (S280).
- the learning phase may proceed without performing abnormality estimation (S265).
- a new learning model is generated by using new data as learning data.
- FIG. 13 is a flowchart showing data quality evaluation in the operation phase of the operation of the information processing apparatus 100 according to the present embodiment.
- the quality evaluation unit 130 first reads the basic profile, statistics profile and machine learning profile (S231).
- the basic evaluation unit 131 evaluates operational data based on the basic profile (S232). Specifically, the basic evaluation unit 131 evaluates the operational data for each record with respect to the items defined in the basic profile. Evaluation based on the basic profile is the same as the evaluation in the learning phase (S132). Next, the data management unit 170 stores the evaluation result based on the basic profile in the memory as part of the quality evaluation result in the operation phase (S233).
- the statistic evaluation unit 132 evaluates the operational data based on the statistic profile (S234). Specifically, the statistic evaluation unit 132 calculates the statistic defined in the statistic profile for each data item. Evaluation based on the statistic profile is the same as the evaluation in the learning phase (S134). Next, the data management unit 170 stores the evaluation result based on the statistic profile in the memory as the quality evaluation result in the operation phase (S235).
- the learning evaluation unit 133 evaluates the operational data based on the machine learning profile (S236). Specifically, the learning evaluation unit 133 checks items defined in the machine learning profile.
- the learning evaluation unit 133 checks whether the feature amount included in the operational data is the feature amount used for machine learning. In the example shown in FIG. 6, "equipment name”, “element size” and “polymerization specification” are used for machine learning as feature quantities. For this reason, the learning evaluation unit 133 checks whether or not each of the “equipment name”, “element size” and “polymerization specification” is included in the operational data, and whether or not feature amounts other than these are included. do. Further, for example, the learning evaluation unit 133 calculates the difference between the statistic (learning statistic) obtained from the learning model and the statistic obtained based on the operation data, and the calculated difference is included in a predetermined range. check whether it is a predetermined range.
- the data management unit 170 stores the check results based on the machine learning profile in memory as part of the quality evaluation results in the operation phase (S237).
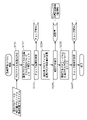
- the detection unit 150 detects concept drift based on a predetermined detection recipe.
- a detection recipe is a check rule for determining whether concept drift has occurred.
- FIG. 14 is a diagram showing a concept drift detection recipe.
- the detection recipes shown in FIG. 14 include a recipe index, a concept drift detection recipe, and a concept drift notification recipe.
- the recipe index includes an outline of the manufacturing system targeted by the information processing apparatus 100 and predetermined index information. Specifically, the recipe index defines project names, factory names, production line names, and the like.
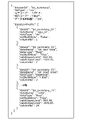
- the concept drift detection recipe defines information related to concept drift detection. Specifically, the concept drift detection recipe defines a program name, data set name, determination method name, preprocessing ID, and the like. For example, as shown in FIGS. 15A and 15B, specific names and values are associated with each defined item.
- FIG. 15A is a diagram showing specific examples of data items in the concept drift detection recipe. In the example shown in FIG. 15A, it is defined which data items are checked in concept drift detection.
- FIG. 15B is a diagram showing a specific example of determination rules in the concept drift detection recipe.
- a rule for detecting concept drift that is, a rule for determining whether or not concept drift has occurred is defined.
- program names and determination thresholds are defined.
- the rule for determining whether concept drift has occurred includes at least one of the evaluation results of the basic profile, statistics profile, and machine learning profile. For example, it may be determined that concept drift has occurred when the evaluation results satisfy a predetermined condition in all evaluation items of the basic profile, statistics profile, and machine learning profile. Alternatively, it may be determined that concept drift has occurred when the evaluation result of at least one of all the evaluation items of the basic profile, statistics profile, and machine learning profile satisfies a predetermined condition.
- the determination rule can be determined as appropriate according to the configuration of the manufacturing system to which the information processing apparatus 100 is applied.
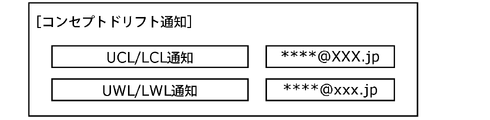
- FIG. 14 also shows a recipe for concept drift notification.
- FIG. 15C is a diagram showing a concept drift notification recipe. Notification recipes are described later.
- the detection unit 150 selects, for example, a rule defined in the detection recipe, and detects concept drift according to the selected rule.
- a rule is defined, for example, for each event that can occur in a factory. By defining a rule for each event, it is possible to accurately determine events that may occur in the manufacturing system.
- FIG. 16 is a diagram showing rules for each event that can occur in a factory. As shown in FIG. 16, the quality evaluation result of the profile to be used and the behavior of the information processing apparatus 100 are associated with each event.
- the operational data in this case will not include the feature values used for machine learning. Therefore, the occurrence of the event can be detected by comparing the feature amount used for machine learning and the feature amount included in the operational data based on the machine learning profile.
- the information processing apparatus 100 can be considered that there is no learning data suitable for the operational data, so it notifies of re-learning. As a result, it is possible to suppress the abnormality estimation using an inappropriate learning model, so that the reliability of the abnormality estimation can be improved.
- FIG. 17 is a diagram showing sensor data and its statistics.
- the horizontal axis represents time
- the vertical axis represents numerical values of predetermined data items.
- FIG. 17 shows, as statistics, the average value calculated based on the learning data and the average value ⁇ 3 ⁇ .
- the range of average value ⁇ 3 ⁇ is a range that should be allowed as possible values. For example, in the example shown in FIG. 17, when the value on the horizontal axis exceeds 450, more data falls outside the allowable range of ⁇ 3 ⁇ . Therefore, when this section is used as operation data, it is possible to determine that there is a high possibility of occurrence of anomaly or detection of concept drift.
- the concept drift notification recipe defines information related to concept drift notification. Also, in the concept drift notification recipe, information related to notification of anomaly estimation results may be defined.
- the concept drift notification recipe shown in FIG. 15C defines a rule for notifying the concept drift determination result (that is, the detection result).
- the concept drift notification recipe defines, for example, the destination of the notification and the content of the notification. For example, a worker at a factory site may be notified of the occurrence of concept drift and the estimated result of the abnormality, and the administrator of the information processing apparatus 100 may be notified of only the occurrence of concept drift.
- FIG. 18 is a block diagram showing configurations of the notification unit 153 and the UI unit 180 of the information processing apparatus 100 according to this embodiment.
- the notification unit 153 includes a push notification unit 153a, a mail notification unit 153b, and a UI notification unit 153c.
- the push notification unit 153a performs push notification to pre-registered destinations.
- the push notification may include a simple message indicating that a concept drift has occurred and/or address information for accessing a notification UI, which will be described later.
- the mail notification unit 153b sends an e-mail to a pre-registered destination.
- the email may include a message indicating that concept drift has occurred and/or address information for accessing the notification UI.
- the UI notification unit 153c notifies via the UI unit 180.
- Which of the push notification unit 153a, mail notification unit 153b, and UI notification unit 153c is to be executed is determined based on the concept drift notification recipe. At least one of the push notification unit 153a, the mail notification unit 153b, and the UI notification unit 153c may notify the abnormality estimation result.
- the UI unit 180 includes a system management UI 181, a data analysis UI 182, and a notification UI 183, as shown in FIG.
- the system management UI 181 is a UI related to the overall processing of the information processing device 100 .
- it is a UI for accepting various operations such as starting a learning phase or an operation phase and switching screen display of the UI from an administrator or the like.
- the data analysis UI 182 is a UI that shows the results of data processing by the information processing device 100 .
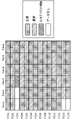
- FIG. 19 is a diagram showing the data analysis UI 182.
- the data analysis UI 182 includes anomaly estimation results and concept drift detection results.
- results for each operation data for a certain period (one day in this case) are shown for each facility ID such as "F003".
- the results are shown in four types: normal, abnormal, concept drift detected, and no data.
- the four types are represented, for example, by different colors or different shading so as to be easily visually distinguishable.
- the data analysis UI 182 may display a cursor (not shown) for selecting the relevant area. By operating the cursor and selecting an area, the list confirmation UI 183a shown in FIG. 20 or the details confirmation UI 183b shown in FIG. 21 may be displayed.
- FIG. 20 is a diagram showing the list confirmation UI 183a. As shown in FIG. 20, a list of concept drift detection results is displayed.
- the list confirmation UI 183a includes detection date/time, project name, program name, determination method name, and determination result.
- a cursor 210 is also displayed together with the list confirmation UI 183a.
- An administrator such as a user can select a detection result by operating the cursor 210 .
- a detailed confirmation UI 183b as shown in FIG. 21 is displayed on the display.
- FIG. 21 is a diagram showing the details confirmation UI 183b.
- the detailed confirmation UI 183b includes the concept drift detection result 220, the determination condition 230 of the program used for the detection, the reference information 240 generated in the learning phase as a comparison target, and the target information 250 obtained from the operation data. , contains
- the reference information 240 and the target information 250 each indicate temporal changes in values for the same data item.
- the reference information 240 and the target information 250 may also include thresholds used for determination.
- the detailed confirmation UI 183b includes selectable GUI buttons 260 and 270.
- the GUI button 260 is a button indicating a process to be performed next, and when selected, the process can be executed. For example, when concept drift is detected, a GUI button 260 for re-learning is displayed.
- GUI button 270 is a link button for accessing other related information. By selecting the GUI button 270, it is possible to access related sites and the like.
- each UI shown in FIGS. 19 to 21 is merely an example and is not limited to the illustrated example.
- the anomaly estimation unit 160 does not need to apply the learning model to the operational data.
- the anomaly estimation unit 160 may apply the learning model to the operational data only when the detection unit 150 does not detect concept drift.
- the communication method between the devices described in the above embodiments is not particularly limited.
- the wireless communication method is, for example, ZigBee (registered trademark), Bluetooth (registered trademark), or short-range wireless communication such as wireless LAN (Local Area Network).
- the wireless communication method may be communication via a wide area communication network such as the Internet.
- wire communication may be performed between devices instead of wireless communication. Wired communication is, specifically, communication using power line communication (PLC: Power Line Communication) or wired LAN.
- processing executed by a specific processing unit may be executed by another processing unit.
- order of multiple processes may be changed, or multiple processes may be executed in parallel.
- processing described in the above embodiments may be implemented by centralized processing using a single device (system), or may be implemented by distributed processing using a plurality of devices. good.
- the number of processors executing the above program may be singular or plural. That is, centralized processing may be performed, or distributed processing may be performed.
- all or part of the components such as the control unit may be configured with dedicated hardware, or implemented by executing a software program suitable for each component. good too.
- Each component may be implemented by a program execution unit such as a CPU (Central Processing Unit) or processor reading and executing a software program recorded in a recording medium such as a HDD (Hard Disk Drive) or semiconductor memory. good.
- a program execution unit such as a CPU (Central Processing Unit) or processor reading and executing a software program recorded in a recording medium such as a HDD (Hard Disk Drive) or semiconductor memory. good.
- components such as the control unit may be configured with one or more electronic circuits.
- Each of the one or more electronic circuits may be a general-purpose circuit or a dedicated circuit.
- One or more electronic circuits may include, for example, a semiconductor device, an IC (Integrated Circuit), or an LSI (Large Scale Integration).
- An IC or LSI may be integrated on one chip or may be integrated on a plurality of chips. Although they are called ICs or LSIs here, they may be called system LSIs, VLSIs (Very Large Scale Integration), or ULSIs (Ultra Large Scale Integration) depending on the degree of integration.
- An FPGA Field Programmable Gate Array
- general or specific aspects of the present disclosure may be implemented as a system, apparatus, method, integrated circuit, or computer program.
- the computer program may be implemented by a computer-readable non-temporary recording medium such as an optical disc, HDD, or semiconductor memory.
- any combination of systems, devices, methods, integrated circuits, computer programs and recording media may be implemented.
- the present disclosure can be used as an information processing device that can detect concept drift with high immediacy and with a small amount of calculation. can be used for
Landscapes
- Engineering & Computer Science (AREA)
- Theoretical Computer Science (AREA)
- General Physics & Mathematics (AREA)
- Physics & Mathematics (AREA)
- Software Systems (AREA)
- General Engineering & Computer Science (AREA)
- Evolutionary Computation (AREA)
- Medical Informatics (AREA)
- Computing Systems (AREA)
- Data Mining & Analysis (AREA)
- Computer Vision & Pattern Recognition (AREA)
- Mathematical Physics (AREA)
- Artificial Intelligence (AREA)
- Automation & Control Theory (AREA)
- Computer Hardware Design (AREA)
- Quality & Reliability (AREA)
- General Factory Administration (AREA)
- Testing And Monitoring For Control Systems (AREA)
Priority Applications (2)
| Application Number | Priority Date | Filing Date | Title |
|---|---|---|---|
| JP2023507120A JPWO2022196666A1 (https=) | 2021-03-16 | 2022-03-15 | |
| US18/549,811 US20240184284A1 (en) | 2021-03-16 | 2022-03-15 | Information processing device and information processing method |
Applications Claiming Priority (2)
| Application Number | Priority Date | Filing Date | Title |
|---|---|---|---|
| JP2021042839 | 2021-03-16 | ||
| JP2021-042839 | 2021-03-16 |
Publications (1)
| Publication Number | Publication Date |
|---|---|
| WO2022196666A1 true WO2022196666A1 (ja) | 2022-09-22 |
Family
ID=83321009
Family Applications (1)
| Application Number | Title | Priority Date | Filing Date |
|---|---|---|---|
| PCT/JP2022/011470 Ceased WO2022196666A1 (ja) | 2021-03-16 | 2022-03-15 | 情報処理装置及び情報処理方法 |
Country Status (3)
| Country | Link |
|---|---|
| US (1) | US20240184284A1 (https=) |
| JP (1) | JPWO2022196666A1 (https=) |
| WO (1) | WO2022196666A1 (https=) |
Cited By (2)
| Publication number | Priority date | Publication date | Assignee | Title |
|---|---|---|---|---|
| JP7536219B1 (ja) * | 2023-06-12 | 2024-08-19 | 三菱電機株式会社 | 学習管理プログラム、学習管理装置、及び、学習システム |
| WO2024261955A1 (ja) * | 2023-06-22 | 2024-12-26 | 株式会社日立ハイテク | データ取扱装置、および、データ取扱方法 |
Families Citing this family (1)
| Publication number | Priority date | Publication date | Assignee | Title |
|---|---|---|---|---|
| US12561686B2 (en) * | 2023-04-13 | 2026-02-24 | Capital One Services, Llc | Systems and methods for outlier detection using unsupervised machine learning models trained on balanced data |
Citations (4)
| Publication number | Priority date | Publication date | Assignee | Title |
|---|---|---|---|---|
| US20170330109A1 (en) * | 2016-05-16 | 2017-11-16 | Purepredictive, Inc. | Predictive drift detection and correction |
| US20170372232A1 (en) * | 2016-06-27 | 2017-12-28 | Purepredictive, Inc. | Data quality detection and compensation for machine learning |
| CN110618983A (zh) * | 2019-08-15 | 2019-12-27 | 复旦大学 | 基于json文档结构的工业大数据多维分析与可视化方法 |
| CN112328425A (zh) * | 2020-12-04 | 2021-02-05 | 杭州谐云科技有限公司 | 一种基于机器学习的异常检测方法和系统 |
Family Cites Families (7)
| Publication number | Priority date | Publication date | Assignee | Title |
|---|---|---|---|---|
| US10410135B2 (en) * | 2015-05-21 | 2019-09-10 | Software Ag Usa, Inc. | Systems and/or methods for dynamic anomaly detection in machine sensor data |
| US10635939B2 (en) * | 2018-07-06 | 2020-04-28 | Capital One Services, Llc | System, method, and computer-accessible medium for evaluating multi-dimensional synthetic data using integrated variants analysis |
| US11481665B2 (en) * | 2018-11-09 | 2022-10-25 | Hewlett Packard Enterprise Development Lp | Systems and methods for determining machine learning training approaches based on identified impacts of one or more types of concept drift |
| US12039415B2 (en) * | 2019-09-30 | 2024-07-16 | Amazon Technologies, Inc. | Debugging and profiling of machine learning model training |
| US20210224696A1 (en) * | 2020-01-21 | 2021-07-22 | Accenture Global Solutions Limited | Resource-aware and adaptive robustness against concept drift in machine learning models for streaming systems |
| US11531903B2 (en) * | 2020-08-02 | 2022-12-20 | Actimize Ltd | Real drift detector on partial labeled data in data streams |
| US20220188694A1 (en) * | 2020-12-15 | 2022-06-16 | Oracle International Corporation | Automatically change anomaly detection threshold based on probabilistic distribution of anomaly scores |
-
2022
- 2022-03-15 US US18/549,811 patent/US20240184284A1/en active Pending
- 2022-03-15 WO PCT/JP2022/011470 patent/WO2022196666A1/ja not_active Ceased
- 2022-03-15 JP JP2023507120A patent/JPWO2022196666A1/ja active Pending
Patent Citations (4)
| Publication number | Priority date | Publication date | Assignee | Title |
|---|---|---|---|---|
| US20170330109A1 (en) * | 2016-05-16 | 2017-11-16 | Purepredictive, Inc. | Predictive drift detection and correction |
| US20170372232A1 (en) * | 2016-06-27 | 2017-12-28 | Purepredictive, Inc. | Data quality detection and compensation for machine learning |
| CN110618983A (zh) * | 2019-08-15 | 2019-12-27 | 复旦大学 | 基于json文档结构的工业大数据多维分析与可视化方法 |
| CN112328425A (zh) * | 2020-12-04 | 2021-02-05 | 杭州谐云科技有限公司 | 一种基于机器学习的异常检测方法和系统 |
Non-Patent Citations (1)
| Title |
|---|
| LAURENT BOB: "Maintaining Data Science at Scale With Model Monitoring", DOMINODATALAB CORPERATE BLOG, US, 20 July 2020 (2020-07-20), US, pages 1 - 4, XP055968217, Retrieved from the Internet <URL:https://www.dominodatalab.com/blog/model-monitoring-best-practices-maintaining-data-science-at-scale> [retrieved on 20221005] * |
Cited By (4)
| Publication number | Priority date | Publication date | Assignee | Title |
|---|---|---|---|---|
| JP7536219B1 (ja) * | 2023-06-12 | 2024-08-19 | 三菱電機株式会社 | 学習管理プログラム、学習管理装置、及び、学習システム |
| WO2024257190A1 (ja) * | 2023-06-12 | 2024-12-19 | 三菱電機株式会社 | 学習管理プログラム、学習管理装置、及び、学習システム |
| WO2024261955A1 (ja) * | 2023-06-22 | 2024-12-26 | 株式会社日立ハイテク | データ取扱装置、および、データ取扱方法 |
| KR20250143792A (ko) | 2023-06-22 | 2025-10-02 | 주식회사 히타치하이테크 | 데이터 취급 장치, 및, 데이터 취급 방법 |
Also Published As
| Publication number | Publication date |
|---|---|
| JPWO2022196666A1 (https=) | 2022-09-22 |
| US20240184284A1 (en) | 2024-06-06 |
Similar Documents
| Publication | Publication Date | Title |
|---|---|---|
| US11295993B2 (en) | Maintenance scheduling for semiconductor manufacturing equipment | |
| US10921775B2 (en) | Production system | |
| JP4878085B2 (ja) | 製造工程のための管理方法 | |
| WO2022196666A1 (ja) | 情報処理装置及び情報処理方法 | |
| TWI416429B (zh) | 半導體製造設施可視化系統 | |
| CN1324515C (zh) | 处理工具优化系统和方法 | |
| KR20210109662A (ko) | 반도체 장비 툴들에서 뉴럴 네트워크들을 이용한 챔버 매칭 | |
| CN114551271A (zh) | 监测机台运行状况的方法及装置、存储介质及电子设备 | |
| JP7853971B2 (ja) | センサマッピングおよびトリガされるデータロギングを含む、健全性に基づいてモニタリング、評価、および応答するための基板処理システムツール | |
| US20190064253A1 (en) | Semiconductor yield prediction | |
| CN113853275A (zh) | 基板处理系统 | |
| US11054815B2 (en) | Apparatus for cost-effective conversion of unsupervised fault detection (FD) system to supervised FD system | |
| CN107850889A (zh) | 管理系统及管理方法 | |
| KR101960755B1 (ko) | 미취득 전력 데이터 생성 방법 및 장치 | |
| JP2023535721A (ja) | プロセストレースからの装置故障モードの予測 | |
| KR20200047772A (ko) | 장애 검출 분류 | |
| CN108334652B (zh) | 机台的预诊断方法及预诊断装置 | |
| WO2019240019A1 (ja) | 異常解析装置、製造システム、異常解析方法及びプログラム | |
| JP5538955B2 (ja) | 半導体製造における装置異常の予兆検知方法およびシステム | |
| CN105793789A (zh) | 用于过程单元中的全部过程区段的自动的监视和状态确定的计算机实现的方法和系统 | |
| JP2007165721A (ja) | プロセス異常分析装置及びプログラム | |
| KR102623390B1 (ko) | 장비 이상 탐지 모델의 정확도를 유지하기 위한 방법,장치 및 프로그램 | |
| US20240184283A1 (en) | Time-Series Segmentation and Anomaly Detection | |
| JPWO2019016892A1 (ja) | 品質分析装置及び品質分析方法 | |
| CN118482817A (zh) | 一种基于数据分析的数字化纺织设备管理方法及系统 |
Legal Events
| Date | Code | Title | Description |
|---|---|---|---|
| 121 | Ep: the epo has been informed by wipo that ep was designated in this application |
Ref document number: 22771411 Country of ref document: EP Kind code of ref document: A1 |
|
| ENP | Entry into the national phase |
Ref document number: 2023507120 Country of ref document: JP Kind code of ref document: A |
|
| WWE | Wipo information: entry into national phase |
Ref document number: 18549811 Country of ref document: US |
|
| NENP | Non-entry into the national phase |
Ref country code: DE |
|
| 122 | Ep: pct application non-entry in european phase |
Ref document number: 22771411 Country of ref document: EP Kind code of ref document: A1 |