WO2022176686A1 - 異物を検出する方法および装置 - Google Patents
異物を検出する方法および装置 Download PDFInfo
- Publication number
- WO2022176686A1 WO2022176686A1 PCT/JP2022/004780 JP2022004780W WO2022176686A1 WO 2022176686 A1 WO2022176686 A1 WO 2022176686A1 JP 2022004780 W JP2022004780 W JP 2022004780W WO 2022176686 A1 WO2022176686 A1 WO 2022176686A1
- Authority
- WO
- WIPO (PCT)
- Prior art keywords
- image data
- image
- data
- band
- bands
- Prior art date
- Legal status (The legal status is an assumption and is not a legal conclusion. Google has not performed a legal analysis and makes no representation as to the accuracy of the status listed.)
- Ceased
Links
Images





















Classifications
-
- G—PHYSICS
- G06—COMPUTING OR CALCULATING; COUNTING
- G06V—IMAGE OR VIDEO RECOGNITION OR UNDERSTANDING
- G06V10/00—Arrangements for image or video recognition or understanding
- G06V10/20—Image preprocessing
- G06V10/25—Determination of region of interest [ROI] or a volume of interest [VOI]
-
- G—PHYSICS
- G01—MEASURING; TESTING
- G01J—MEASUREMENT OF INTENSITY, VELOCITY, SPECTRAL CONTENT, POLARISATION, PHASE OR PULSE CHARACTERISTICS OF INFRARED, VISIBLE OR ULTRAVIOLET LIGHT; COLORIMETRY; RADIATION PYROMETRY
- G01J3/00—Spectrometry; Spectrophotometry; Monochromators; Measuring colours
- G01J3/28—Investigating the spectrum
- G01J3/2823—Imaging spectrometer
-
- G—PHYSICS
- G01—MEASURING; TESTING
- G01N—INVESTIGATING OR ANALYSING MATERIALS BY DETERMINING THEIR CHEMICAL OR PHYSICAL PROPERTIES
- G01N21/00—Investigating or analysing materials by the use of optical means, i.e. using sub-millimetre waves, infrared, visible or ultraviolet light
- G01N21/84—Systems specially adapted for particular applications
- G01N21/88—Investigating the presence of flaws or contamination
- G01N21/8851—Scan or image signal processing specially adapted therefor, e.g. for scan signal adjustment, for detecting different kinds of defects, for compensating for structures, markings, edges
-
- G—PHYSICS
- G01—MEASURING; TESTING
- G01N—INVESTIGATING OR ANALYSING MATERIALS BY DETERMINING THEIR CHEMICAL OR PHYSICAL PROPERTIES
- G01N21/00—Investigating or analysing materials by the use of optical means, i.e. using sub-millimetre waves, infrared, visible or ultraviolet light
- G01N21/84—Systems specially adapted for particular applications
- G01N21/88—Investigating the presence of flaws or contamination
- G01N21/94—Investigating contamination, e.g. dust
-
- G—PHYSICS
- G06—COMPUTING OR CALCULATING; COUNTING
- G06T—IMAGE DATA PROCESSING OR GENERATION, IN GENERAL
- G06T5/00—Image enhancement or restoration
- G06T5/20—Image enhancement or restoration using local operators
-
- G—PHYSICS
- G06—COMPUTING OR CALCULATING; COUNTING
- G06T—IMAGE DATA PROCESSING OR GENERATION, IN GENERAL
- G06T7/00—Image analysis
- G06T7/0002—Inspection of images, e.g. flaw detection
- G06T7/0004—Industrial image inspection
-
- G—PHYSICS
- G06—COMPUTING OR CALCULATING; COUNTING
- G06T—IMAGE DATA PROCESSING OR GENERATION, IN GENERAL
- G06T9/00—Image coding
-
- G—PHYSICS
- G06—COMPUTING OR CALCULATING; COUNTING
- G06V—IMAGE OR VIDEO RECOGNITION OR UNDERSTANDING
- G06V10/00—Arrangements for image or video recognition or understanding
- G06V10/10—Image acquisition
- G06V10/12—Details of acquisition arrangements; Constructional details thereof
- G06V10/14—Optical characteristics of the device performing the acquisition or on the illumination arrangements
- G06V10/143—Sensing or illuminating at different wavelengths
-
- G—PHYSICS
- G06—COMPUTING OR CALCULATING; COUNTING
- G06V—IMAGE OR VIDEO RECOGNITION OR UNDERSTANDING
- G06V10/00—Arrangements for image or video recognition or understanding
- G06V10/40—Extraction of image or video features
- G06V10/58—Extraction of image or video features relating to hyperspectral data
-
- G—PHYSICS
- G06—COMPUTING OR CALCULATING; COUNTING
- G06V—IMAGE OR VIDEO RECOGNITION OR UNDERSTANDING
- G06V10/00—Arrangements for image or video recognition or understanding
- G06V10/70—Arrangements for image or video recognition or understanding using pattern recognition or machine learning
- G06V10/764—Arrangements for image or video recognition or understanding using pattern recognition or machine learning using classification, e.g. of video objects
-
- G—PHYSICS
- G06—COMPUTING OR CALCULATING; COUNTING
- G06V—IMAGE OR VIDEO RECOGNITION OR UNDERSTANDING
- G06V20/00—Scenes; Scene-specific elements
- G06V20/50—Context or environment of the image
- G06V20/52—Surveillance or monitoring of activities, e.g. for recognising suspicious objects
-
- G—PHYSICS
- G06—COMPUTING OR CALCULATING; COUNTING
- G06V—IMAGE OR VIDEO RECOGNITION OR UNDERSTANDING
- G06V20/00—Scenes; Scene-specific elements
- G06V20/60—Type of objects
- G06V20/68—Food, e.g. fruit or vegetables
-
- G—PHYSICS
- G01—MEASURING; TESTING
- G01J—MEASUREMENT OF INTENSITY, VELOCITY, SPECTRAL CONTENT, POLARISATION, PHASE OR PULSE CHARACTERISTICS OF INFRARED, VISIBLE OR ULTRAVIOLET LIGHT; COLORIMETRY; RADIATION PYROMETRY
- G01J3/00—Spectrometry; Spectrophotometry; Monochromators; Measuring colours
- G01J3/28—Investigating the spectrum
- G01J3/2823—Imaging spectrometer
- G01J2003/2826—Multispectral imaging, e.g. filter imaging
-
- G—PHYSICS
- G01—MEASURING; TESTING
- G01J—MEASUREMENT OF INTENSITY, VELOCITY, SPECTRAL CONTENT, POLARISATION, PHASE OR PULSE CHARACTERISTICS OF INFRARED, VISIBLE OR ULTRAVIOLET LIGHT; COLORIMETRY; RADIATION PYROMETRY
- G01J3/00—Spectrometry; Spectrophotometry; Monochromators; Measuring colours
- G01J3/28—Investigating the spectrum
- G01J2003/283—Investigating the spectrum computer-interfaced
- G01J2003/2833—Investigating the spectrum computer-interfaced and memorised spectra collection
-
- G—PHYSICS
- G01—MEASURING; TESTING
- G01N—INVESTIGATING OR ANALYSING MATERIALS BY DETERMINING THEIR CHEMICAL OR PHYSICAL PROPERTIES
- G01N21/00—Investigating or analysing materials by the use of optical means, i.e. using sub-millimetre waves, infrared, visible or ultraviolet light
- G01N21/84—Systems specially adapted for particular applications
- G01N21/88—Investigating the presence of flaws or contamination
- G01N21/8851—Scan or image signal processing specially adapted therefor, e.g. for scan signal adjustment, for detecting different kinds of defects, for compensating for structures, markings, edges
- G01N2021/8854—Grading and classifying of flaws
-
- G—PHYSICS
- G01—MEASURING; TESTING
- G01N—INVESTIGATING OR ANALYSING MATERIALS BY DETERMINING THEIR CHEMICAL OR PHYSICAL PROPERTIES
- G01N21/00—Investigating or analysing materials by the use of optical means, i.e. using sub-millimetre waves, infrared, visible or ultraviolet light
- G01N21/84—Systems specially adapted for particular applications
- G01N21/88—Investigating the presence of flaws or contamination
- G01N21/8851—Scan or image signal processing specially adapted therefor, e.g. for scan signal adjustment, for detecting different kinds of defects, for compensating for structures, markings, edges
- G01N2021/8887—Scan or image signal processing specially adapted therefor, e.g. for scan signal adjustment, for detecting different kinds of defects, for compensating for structures, markings, edges based on image processing techniques
-
- G—PHYSICS
- G06—COMPUTING OR CALCULATING; COUNTING
- G06T—IMAGE DATA PROCESSING OR GENERATION, IN GENERAL
- G06T2207/00—Indexing scheme for image analysis or image enhancement
- G06T2207/10—Image acquisition modality
- G06T2207/10032—Satellite or aerial image; Remote sensing
- G06T2207/10036—Multispectral image; Hyperspectral image
-
- G—PHYSICS
- G06—COMPUTING OR CALCULATING; COUNTING
- G06T—IMAGE DATA PROCESSING OR GENERATION, IN GENERAL
- G06T2207/00—Indexing scheme for image analysis or image enhancement
- G06T2207/30—Subject of image; Context of image processing
- G06T2207/30108—Industrial image inspection
- G06T2207/30128—Food products
-
- G—PHYSICS
- G06—COMPUTING OR CALCULATING; COUNTING
- G06V—IMAGE OR VIDEO RECOGNITION OR UNDERSTANDING
- G06V2201/00—Indexing scheme relating to image or video recognition or understanding
- G06V2201/07—Target detection
Definitions
- the present disclosure relates to a method and apparatus for detecting foreign matter.
- Patent Literature 1 discloses a method for processing hyperspectral image data in the analysis of living tissue.
- US Pat. No. 5,300,000 discloses an imaging device that obtains hyperspectral images of objects using a technique of compressed sensing.
- the present disclosure provides a technique for reducing the processing load in foreign object detection.
- a method is a computer-implemented method of detecting a foreign object in an object, comprising obtaining image data of the object including information about four or more bands; extracting partial image data corresponding to at least one of the four or more bands for each of a plurality of regions of the object from the image data; and outputting data indicating a detection result, wherein the at least one band is selected according to each of the plurality of regions.
- a wavelength band may be referred to as a band.
- Computer-readable recording media include non-volatile recording media such as CD-ROMs (Compact Disc-Read Only Memory).
- a device may consist of one or more devices. When the device is composed of two or more devices, the two or more devices may be arranged in one device, or may be divided and arranged in two or more separate devices. As used herein and in the claims, a "device” can mean not only one device, but also a system of multiple devices. A plurality of devices included in the "system” may include devices installed remotely from other devices and connected via a communication network.
- FIG. 1A is a diagram for explaining the relationship between a target wavelength range and multiple bands included therein.
- FIG. 1B is a diagram schematically showing an example of a hyperspectral image.
- FIG. 2A is a diagram schematically showing an example of a filter array.
- 2B is a diagram showing an example of a transmission spectrum of a first filter included in the filter array shown in FIG. 2A;
- FIG. 2C is a diagram showing an example of a transmission spectrum of a second filter included in the filter array shown in FIG. 2A;
- FIG. FIG. 2D is a diagram showing an example of the spatial distribution of the light transmittance of each of a plurality of bands W 1 , W 2 , . . . , W i included in the target wavelength range.
- FIG. 3A is a block diagram that schematically illustrates an inspection system according to exemplary embodiment 1 of the present disclosure
- FIG. 3B is a diagram schematically showing an example of arrangement of imaging devices and operating devices in a manufacturing line
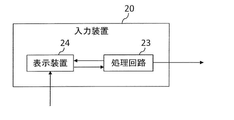
- FIG. 4A is a block diagram schematically showing a first example of the input device shown in FIG. 3A.
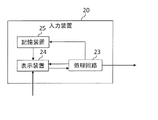
- FIG. 4B is a block diagram schematically showing a second example of the input device shown in FIG. 3A.
- FIG. 4C is a block diagram schematically showing a third example of the input device shown in FIG. 3A.
- FIG. 5A is a flow chart showing an example of the operation of the input device shown in FIG. 4A.
- FIG. 5B is a diagram schematically showing an example of data stored in the storage device shown in FIG. 4C.
- FIG. 6A is a diagram schematically showing a first example of reference data stored in the storage device shown in FIG. 3A
- FIG. FIG. 6B is a diagram schematically showing a second example of reference data stored in the storage device shown in FIG. 3A
- 6C is a diagram schematically showing a third example of reference data stored in the storage device shown in FIG. 3A
- FIG. 7A is a flow chart showing an example of the operation of the processing circuit in foreign matter inspection.
- FIG. 7B is a flow chart showing an example of the operation of the processing circuitry in step S104 shown in FIG. 7A.
- FIG. 7C is a flow chart showing an example of the operation of the processing circuitry in step S105 shown in FIG. 7A.
- FIG. 8A is a diagram showing a result of segmenting an image of an object into a plurality of regions by an input device.
- FIG. 8B is a diagram schematically showing reference data in the example.
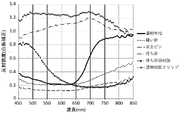
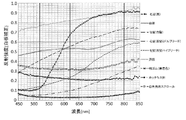
- FIG. 8C is a graph showing the reflectance spectra of navy blue fabric and an assumed foreign object in the area labeled "navy blue.”
- FIG. 9A is a diagram showing an image for 750 nm when a sewing needle is mixed in the area classified as "dark blue”.
- FIG. 9B is a diagram showing a black and white inverted image of FIG. 9A.
- FIG. 9C is a diagram showing a processed image when a safety pin is included in the area classified as "dark blue”.
- FIG. 9A is a diagram showing a result of segmenting an image of an object into a plurality of regions by an input device.
- FIG. 8B is a diagram schematically showing reference data in the example.
- FIG. 8C is a graph showing the reflectance spectra of navy blue
- FIG. 10 is a block diagram that schematically illustrates an inspection system according to exemplary embodiment 2 of the present disclosure.
- 11A is a block diagram schematically showing a first example of the input device shown in FIG. 10.
- FIG. 11B is a block diagram schematically showing a second example of the input device shown in FIG. 10.
- FIG. 11C is a block diagram schematically showing a third example of the input device shown in FIG. 10.
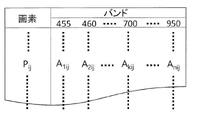
- FIG. 12A is a diagram schematically showing an example of a complete restoration table.
- FIG. 12B is a diagram schematically showing an example of a restoration table by area.
- FIG. 13A is a flow chart showing an example of the operation of a processing circuit in foreign matter inspection using a complete restoration table.
- FIG. 13B is a flow chart showing an example of the operation of the processing circuit in foreign matter inspection using the restoration table for each area.
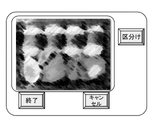
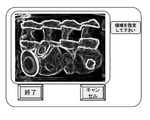
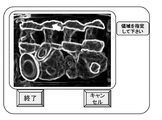
- FIG. 14A is a diagram for explaining a procedure of dividing a compressed image of a lunch box into a plurality of areas and designating the contents of the areas using the input device shown in FIG. 11B.
- FIG. 14B is a diagram for explaining the procedure for dividing the compressed image of lunch box into a plurality of areas and designating the contents of the areas using the input device shown in FIG. 11B.
- FIG. 14C is a diagram for explaining the procedure for dividing the compressed image of lunch box into a plurality of areas and designating the contents of the areas using the input device shown in FIG. 11B.
- FIG. 14A is a diagram for explaining a procedure of dividing a compressed image of a lunch box into a plurality of areas and designating the contents of the areas using the input device shown in FIG. 11B.
- FIG. 14B is a diagram for explaining the procedure for dividing the compressed
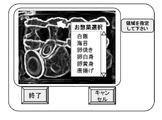
- FIG. 14D is a diagram for explaining the procedure of dividing the compressed image of lunch box into a plurality of areas and designating the contents of the areas using the input device shown in FIG. 11B.
- FIG. 14E is a diagram for explaining the procedure of dividing the compressed image of lunch box into a plurality of areas and designating the contents of the areas using the input device shown in FIG. 11B.
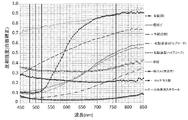
- FIG. 15A is a graph showing the reflection spectra of "white rice” and assumed foreign matter in the region classified as "white rice”.
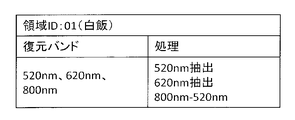
- FIG. 15B is a diagram schematically showing a table showing the relationship between the restoration band and the processing method for the region classified as "white rice”.
- FIG. 15C is a diagram showing an image at 520 nm when hair (black hair) is mixed in the region classified as “white rice”.
- FIG. 15D is a diagram showing a black and white reversed image of FIG. 15C.
- FIG. 15E is a diagram showing a processed image when hair (white hair) is mixed in the area classified as "white rice”.
- FIG. 16A is a graph showing the reflectance spectra of "seaweed” and assumed foreign matter in the area classified as “seaweed”.
- FIG. 16B is a diagram schematically showing a table showing the relationship between restoration bands and processing methods for areas classified as "seaweed”.
- FIG. 16C is a diagram showing an image for 800 nm when hair (black hair) is mixed in the area classified as "seaweed”.
- FIG. 16D is a diagram showing a black and white inverted image of FIG. 16C.
- FIG. 17A is a graph showing reflection spectra of "fried chicken” and assumed foreign matter in the area classified as “fried chicken”.
- FIG. 17B is a diagram schematically showing a table showing the relationship between restoration bands and processing methods for areas classified as “fried chicken”.
- FIG. 17C is a diagram showing a processed image when hair (brown hair high bleach) is included in the region classified as “fried chicken”.
- FIG. 18 is a diagram showing an example of coordinate axes and coordinates.
- FIG. 19 shows multiple positions of multiple pixels in the compressed image, multiple pixel values of multiple pixels included in the compressed image, data g of the compressed image, and multiple pixels in image Ik corresponding to wavelength band Wk .
- FIG. 19 shows multiple positions of multiple pixels in the compressed image, multiple pixel values of multiple pixels included in the compressed image, data g of the compressed image, and multiple pixels in image Ik corresponding to wavelength band Wk .
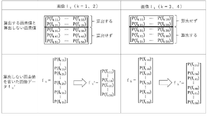
- FIG. 20 is a diagram showing pixel values calculated by the processing circuit 40, pixel values not calculated, and image data fk ' from which the pixel values not calculated are omitted.
- FIG. 21 is a diagram showing a comparison of f, H, f', H'.
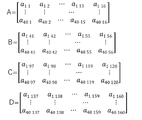
- FIG. 22 shows A, B, C, and D included in FIG.
- all or part of a circuit, unit, device, member or section, or all or part of a functional block in a block diagram is, for example, a semiconductor device, a semiconductor integrated circuit (IC), or an LSI (large scale integration). ) may be performed by one or more electronic circuits.
- An LSI or IC may be integrated on one chip, or may be configured by combining a plurality of chips.
- functional blocks other than memory elements may be integrated into one chip.
- LSIs or ICs may be called system LSIs, VLSIs (very large scale integration), or ULSIs (ultra large scale integration) depending on the degree of integration.
- a Field Programmable Gate Array (FPGA), which is programmed after the LSI is manufactured, or a reconfigurable logic device that can reconfigure the connection relationships inside the LSI or set up the circuit partitions inside the LSI can also be used for the same purpose.
- FPGA Field Programmable Gate Array
- circuits, units, devices, members or parts can be executed by software processing.
- the software is recorded on one or more non-transitory storage media, such as ROMs, optical discs, hard disk drives, etc., such that when the software is executed by a processor, the functions specified in the software are performed. It is executed by processors and peripherals.
- a system or apparatus may include one or more non-transitory storage media on which software is recorded, a processor, and required hardware devices such as interfaces.
- a hyperspectral image is image data that has more wavelength information than a typical RGB image.
- An RGB image has values for each of three bands, red (R), green (G), and blue (B), for each pixel.
- a hyperspectral image has values for more bands per pixel than the number of bands in an RGB image.
- "hyperspectral image” means image data in which each pixel has a value for each of four or more bands contained in a predetermined wavelength range of interest. A value that each pixel has for each band is referred to as a "pixel value" in the following description.
- the number of bands in a hyperspectral image is typically 10 or more, and may exceed 100 in some cases.
- a "hyperspectral image” is sometimes referred to as a “hyperspectral datacube” or “hyperspectral cube.”
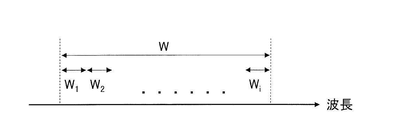
- FIG. 1A is a diagram for explaining the relationship between a target wavelength band W and a plurality of bands W 1 , W 2 , . . . , W i included therein.
- the target wavelength band W can be set in various ranges depending on the application.
- the target wavelength range W can be, for example, a visible light wavelength range from about 400 nm to about 700 nm, a near-infrared wavelength range from about 700 nm to about 2500 nm, or a near-ultraviolet wavelength range from about 10 nm to about 400 nm.
- the target wavelength range W may be a mid-infrared or far-infrared wavelength range.
- the wavelength range used is not limited to the visible light range. In this specification, not only visible light but also electromagnetic waves with wavelengths outside the visible light wavelength range, such as ultraviolet rays and near-infrared rays, are referred to as "light" for convenience.
- i is an arbitrary integer equal to or greater than 4, and the respective wavelength ranges obtained by equally dividing the target wavelength range W into i are defined as bands W 1 , W 2 , . . . , W i .
- a plurality of bands included in the target wavelength band W may be set arbitrarily.
- the bands may have uneven widths. There may be gaps between adjacent bands. If the number of bands is four or more, more information can be obtained from the hyperspectral image than from the RGB image.
- FIG. 1B is a diagram schematically showing an example of the hyperspectral image 12.
- the imaging target is an apple.
- Hyperspectral image 12 includes image 12W 1 for band W 1 , image 12W 2 for band W 2 , . . . , image 12W i for band W i .
- Each of these images includes a plurality of pixels arranged two-dimensionally.
- FIG. 1B exemplifies vertical and horizontal dashed lines indicating divisions of pixels. Although the actual number of pixels per image can be a large value, for example, tens of thousands to tens of millions, in FIG. delimiters are shown.
- Reflected light generated when an object is irradiated with light is detected by each photodetector element in the image sensor.
- a signal indicating the amount of light detected by each photodetector represents the pixel value of the pixel corresponding to that photodetector.
- Each pixel in the hyperspectral image 12 has a pixel value for each band. Therefore, by acquiring the hyperspectral image 12, information on the two-dimensional distribution of the spectrum of the object can be obtained. Based on the spectrum of the object, the optical properties of the object can be accurately analyzed.
- a hyperspectral image can be acquired by imaging using a spectroscopic element such as a prism or grating, for example.
- a spectroscopic element such as a prism or grating
- the light is emitted from the emission surface of the prism at an emission angle corresponding to the wavelength.
- a grating when reflected light or transmitted light from an object enters the grating, the light is diffracted at a diffraction angle according to the wavelength.
- a hyperspectral image can be obtained by separating light from an object into bands by a prism or grating and detecting the separated light by band.
- a hyperspectral image can also be obtained using the compressed sensing technique disclosed in Patent Document 2.
- an image sensor detects light reflected from an object through a filter array called an encoding element.
- the filter array includes a plurality of filters arranged two-dimensionally. Each of these filters has a unique transmission spectrum. Imaging using such a filter array yields a compressed image in which image information of a plurality of bands is compressed as one two-dimensional image.
- the spectral information of the object is compressed and recorded as one pixel value for each pixel.
- FIG. 2A is a diagram schematically showing an example of the filter array 80.
- FIG. Filter array 80 includes a plurality of filters arranged two-dimensionally. Each filter has an individually set transmission spectrum. The transmission spectrum is represented by a function T( ⁇ ), where ⁇ is the wavelength of incident light. The transmission spectrum T( ⁇ ) can take a value of 0 or more and 1 or less.
- the filter array 80 has 48 rectangular filters arranged in 6 rows and 8 columns. This is only an example and in actual applications more filters may be provided. The number of filters included in the filter array 80 may be approximately the same as the number of pixels of the image sensor.
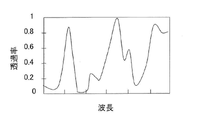
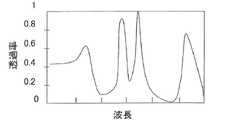
- FIG. 2B and 2C are diagrams showing examples of transmission spectra of the first filter A1 and the second filter A2, respectively, among the plurality of filters included in the filter array 80 of FIG. 2A.
- the transmission spectrum of the first filter A1 and the transmission spectrum of the second filter A2 are different from each other.
- the transmission spectrum of filter array 80 differs from filter to filter.
- the filter array 80 at least two filters out of the plurality of filters have different transmission spectra. That is, the filter array 80 includes two or more filters with different transmission spectra.
- the number of transmission spectral patterns of the plurality of filters included in filter array 80 may be equal to or greater than the number i of bands included in the wavelength range of interest.
- Filter array 80 may be designed such that more than half of the filters have different transmission spectra.
- FIG. 2D is a diagram showing an example of the spatial distribution of the light transmittance of each of a plurality of bands W 1 , W 2 , . . . , W i included in the target wavelength range.
- the difference in shade of each filter represents the difference in light transmittance.
- a lighter filter has a higher light transmittance, and a darker filter has a lower transmittance.
- the spatial distribution of light transmittance differs depending on the band.
- a hyperspectral image can be reconstructed from the compressed image.
- Compressed sensing technology is used for restoration.
- Data indicating the spatial distribution of light transmittance for each band in the filter array, which is used in the restoration process, is called a "restoration table.” Since compressed sensing techniques do not require the use of prisms or gratings, hyperspectral cameras can be made smaller. Furthermore, in compressed sensing techniques, compressed images can reduce the amount of data processed by the processing circuitry.
- the compressed image data g, the restoration table H, and the hyperspectral image data f acquired by the image sensor satisfy the following formula (1).
- N g be the number of pixels in the compressed image, and the hyperspectral image includes an image for band W 1 , . If the number of pixels of each image for the image, .
- the matrix and reconstruction table H can be represented as a matrix with N g rows (N f ⁇ M) columns. N g and N f can be designed to the same value.
- f' represents the estimated data of f.
- the first term in parentheses in the above formula represents the amount of deviation between the estimation result Hf and the acquired data g, ie, the so-called residual term.
- the sum of squares is used as the residual term here, the absolute value or the square root of the sum of squares may be used as the residual term.
- the second term in parentheses is a regularization term or a stabilization term, which will be described later. Equation (2) means finding f that minimizes the sum of the first and second terms.
- the processing circuit can converge the solution by recursive iteration and calculate the final solution f.
- the first term in the parenthesis of formula (2) means an operation for obtaining the sum of the squares of the difference between the obtained data g and Hf obtained by system-transforming f in the estimation process using the matrix H.
- the second term, ⁇ (f), is a constraint on the regularization of f, and is a function that reflects the sparse information of the estimated data. As a function, it has the effect of smoothing or stabilizing the estimated data.
- the regularization term may be represented by, for example, the Discrete Cosine Transform (DCT), Wavelet Transform, Fourier Transform, or Total Variation (TV) of f. For example, when the total variation is used, it is possible to acquire stable estimated data that suppresses the influence of noise in the observed data g.
- DCT Discrete Cosine Transform
- TV Total Variation
- the sparsity of an object in the space of each regularization term depends on the texture of the object.
- a regularization term may be chosen that makes the texture of the object more spars in the space of regularization terms.
- multiple regularization terms may be included in the operation.
- ⁇ is a weighting factor. The larger the weighting factor ⁇ , the larger the reduction amount of redundant data and the higher the compression rate. The smaller the weighting factor ⁇ , the weaker the convergence to the solution.
- the weighting factor ⁇ is set to an appropriate value with which f converges to some extent and does not become over-compressed.
- Patent Document 2 A more detailed method of obtaining hyperspectral images by the technique of compressed sensing is disclosed in Patent Document 2. The entire disclosure of Patent Document 2 is incorporated herein by reference. Note that the method of acquiring a hyperspectral image by imaging is not limited to the method using compressed sensing described above.
- a hyperspectral image may be acquired by imaging using a filter array in which a plurality of pixel regions each including four or more filters with different transmission wavelength ranges are two-dimensionally arranged.
- a hyperspectral image may be obtained using spectroscopy using a prism or grating.
- a hyperspectral camera can be used to inspect the presence or absence of foreign matter on or inside articles such as industrial products and processed foods.
- a hyperspectral camera can detect foreign objects that may be missed by a monochrome or RGB color camera.
- hyperspectral images can be obtained over a wider range of wavelengths of interest than the visible light range. Therefore, foreign matter can be detected in a wavelength range that cannot be detected visually.
- hyperspectral image data contains image information of many bands, its size is larger than that of monochrome image data and RGB image data. Furthermore, in foreign matter inspection of industrial products and processed food products with complex configurations, the spectral data of articles without foreign matter used for comparison with the hyperspectral image data can also be complicated. For this reason, in-line inspection for inspecting the presence or absence of foreign matter on a manufacturing line requires a large-sized, high-performance processing circuit, which consumes a lot of time.
- a method according to an embodiment of the present disclosure is as follows. Partial image data corresponding to at least one band is extracted for each of a plurality of regions of the object from the hyperspectral image data or compressed image data. "Partial image data" means a portion of hyperspectral image data or compressed image data having three-dimensional image information consisting of two-dimensional space and wavelength. A "portion" may be a portion in space or a portion in the wavelength axis. Foreign matter in the object is detected for each region based on the partial image data.
- the method according to this embodiment can reduce the size of data handled in one process. As a result, the processing load on the processing circuit can be reduced, and an appropriate processing speed can be achieved in in-line inspection.
- a method related to the first item is a method of detecting a foreign object in an object, which is executed by a computer.
- the method comprises obtaining image data of the object including information about four or more bands; extracting partial image data corresponding to at least one band of, detecting a foreign substance in the object for each region based on the partial image data, and outputting data indicating the detection result; wherein the at least one band is selected according to each of the plurality of regions.
- This method can reduce the processing load in foreign object detection.
- the method according to the second item is the method according to the first item, wherein the acquiring the image data comprises acquiring hyperspectral image data representing an image of the object for the four or more bands. including.
- the method according to the third item is the method according to the first item, wherein the obtaining of the image data is performed by compressing the image information of the object for the four or more bands as one image. Including acquiring image data.
- the method according to the fourth item is the method according to the third item, wherein the extracting the partial image data restores the partial image data corresponding to the at least one band from the compressed image data. including.
- the method according to the fifth item is the method according to the fourth item, wherein the compressed image data is acquired by imaging the object through a filter array.
- the filter array includes a plurality of filters arranged two-dimensionally. Transmission spectra of at least two or more of the plurality of filters are different from each other.
- Restoring the partial image data includes restoring using at least one restoration table corresponding to the at least one band.
- the reconstruction table indicates a spatial distribution of light transmittance for each band for the filter array in each of the plurality of regions.
- partial image data corresponding to at least one band can be restored from the compressed image data.
- the method according to the sixth item in the method according to any one of the first to fifth items, further includes acquiring area segmentation data according to the type of the object.
- the plurality of areas are determined based on the image data and the area segmentation data.
- the method according to the seventh item is the method according to the sixth item, wherein the at least one band is selected based on the region segmentation data.
- the method according to the eighth item is the method according to the sixth item or the seventh item, wherein the area division data includes area information for determining the plurality of areas, and the method is based on the area division data. , obtaining reference data including information of bands corresponding to the region information, wherein the at least one band is selected based on the reference data.
- the method according to the ninth item in the method according to any one of the sixth to eighth items, further includes updating the area division data and updating the plurality of areas.
- the method according to the tenth item is the method according to the ninth item, further comprising updating the at least one band.
- a method according to an eleventh item is the method according to any one of the sixth to tenth items, wherein the target object is an industrial product, and the area division data is data indicating a parts layout of the industrial product. include.
- a method according to a twelfth item is the method according to any one of the sixth to tenth items, wherein the object is a processed food product, and the area division data is a layout map of the contents of the processed food product. including the data shown.
- the method according to the thirteenth item is the method according to any one of the sixth to eleventh items, wherein the area division data is generated by performing image recognition processing on an image of the object in which no foreign matter exists. .
- the area segmentation data can be automatically generated by image recognition processing.
- a processing device is a processing device comprising a processor and a memory storing a computer program executed by the processor.
- the computer program instructs the processor to acquire image data of the object including information about four or more bands, to detect foreign objects in the object; extracting partial image data corresponding to at least one of the four or more bands for each of a plurality of regions; and detecting a foreign substance of the object for each region based on the partial image data. and outputting data indicating a detection result, wherein the at least one band is selected according to each of the plurality of regions.
- a hyperspectral camera that does not rely on compression sensing technology is used to detect foreign matter on the object.
- An overview of the foreign matter detection method according to the first embodiment is as follows. Hyperspectral image data is acquired for an object under inspection. An image represented by hyperspectral image data is segmented into a plurality of regions. Partial image data corresponding to at least one band among four or more bands included in the target wavelength band is extracted from the hyperspectral image data for each of the plurality of regions. Foreign matter in the object is detected for each region based on the extracted partial image data.
- the reflection spectrum of a foreign object can be different from the reflection spectrum of an object. Due to the difference in reflection spectrum between the object and the foreign matter, the foreign matter appears white or black in the image represented by the partial image data compared to the surroundings. As a result, foreign matter can be detected.
- As the band of the partial image data a band suitable for foreign matter detection is specified for each region.
- the type of foreign matter is often known before inspection.
- the foreign object may include, for example, sewing needles, pins, or clips.
- the foreign matter may include hair or egg shells, for example. In the following description, it is assumed that the type of foreign matter is known before inspection.
- FIG. 3A is a block diagram that schematically illustrates an inspection system according to exemplary embodiment 1 of the present disclosure.
- the processing circuitry 40 controls operations of the imaging device 10 , the storage device 30 and the output device 50 .
- the imaging device 10 functions as a hyperspectral camera that generates and outputs hyperspectral image data of an object by imaging. Imaging device 10 does not use compressed sensing techniques.
- the imaging device 10 can include, for example, an optical system, a spectroscopic element, and an image sensor positioned on the optical path of reflected light or transmitted light from the object, in this order. If distance A is the distance between the image sensor and the object, distance B is the distance between the image sensor and the optical system, and distance C is the distance between the image sensor and the spectroscopic element, distance A>distance B>distance C may be satisfied.
- the optical system forms an image on the photodetector surface of the image sensor.
- the spectroscopic element separates the light from the object into bands.
- the image sensor detects light separated by bands.
- one-dimensional hyperspectral image data for a portion of the object along one direction is obtained in one imaging.
- Two-dimensional hyperspectral image data of the object can be obtained by taking images a plurality of times while shifting the positions of the object and the imaging device 10 stepwise in a direction perpendicular to the one direction.
- the input device 20 is a device that generates various data necessary for foreign matter inspection, and is used before inspection. Using the input device 20, an image of an object that is the same type as the object to be inspected and that does not contain any foreign matter is divided into a plurality of areas, and the area contents indicating the shape, color tone, composition, etc. are displayed for each area. It is specified.
- "multiple regions of an object” means multiple regions of an object segmented in an image.
- the domain content can be, for example, the colors and/or patterns of industrial products, and the side dishes and ingredients of processed food products.
- the input device 20 generates and outputs area division data indicating a plurality of areas for which area contents are designated.
- the area division data differ depending on the type of object.
- the area segmentation data can be, for example, data indicating the parts layout of an industrial product or data indicating the layout of the contents of a processed food product. The configuration of the input device 20 will be described later.
- the storage device 30 stores the area division data output from the input device 20, the reference data used for the foreign matter inspection, and the data indicating the result of the foreign matter inspection for each area.
- the reference data includes information on the bands used for each region and information on how to process the partial image data for the bands. Details of the reference data will be described later.
- the storage device 30 includes any storage medium such as a semiconductor memory, a magnetic storage device, an optical storage device, or the like.
- the processing circuit 40 acquires hyperspectral image data from the imaging device 10 and acquires segmentation data and reference data from the storage device 30 .
- the processing circuit 40 inspects whether or not the object contains foreign matter based on these acquired data. When a foreign object is detected, the processing circuit 40 outputs data indicating the detection result to the output device 50 .
- a computer program executed by the processing circuitry 40 is stored in a memory 42 such as ROM or RAM (Random Access Memory).
- Processing circuitry 40 and memory 42 function as a processing unit.
- the processing circuitry 40 and memory 42 may be integrated on one circuit board or provided on separate circuit boards.
- the output device 50 acquires data indicating the detection result from the processing circuit 40 and outputs that a foreign object is present in the object. This output is performed, for example, by displaying an image or characters on an image display device such as a display, emitting a beep sound or voice by an audio device such as a speaker, or lighting a warning light. In addition, output device 50 transmits control signals to actuator device 60 .
- the actuating device 60 receives the control signal from the output device 50 and discards the object with foreign matter from the production line. This disposal is performed, for example, by path switching of a belt conveyor in a production line or by picking of objects.
- FIG. 3B is a diagram schematically showing an example of arrangement of the imaging device 10 and the operating device 60 on the production line.
- the actuation device 60 is a conveyor belt carrying multiple objects 70 .
- the imaging device 10 sequentially images a plurality of objects 70 .
- the processing circuit 40 executes the foreign matter inspection operation of the object 70 each time an image is captured.
- FIGS. 4A to 4C are block diagrams schematically showing examples of the input device 20 shown in FIG. 3A.
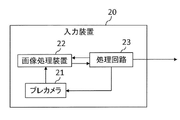
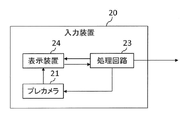
- the input device 20 includes a pre-camera 21, an image processing device 22, and a processing circuit 23.
- Pre-camera 21 may be, for example, a monochrome camera or an RBG camera.
- the image processing device 22 may be, for example, an image recognition device.
- the image processing device 22 preliminarily stores data indicating the arrangement of area contents, such as the arrangement of colors and/or patterns of industrial products, or the arrangement of side dishes and/or foodstuffs of processed food products.
- the processing circuit 23 causes the pre-camera 21 to image an object that is the same type as the inspection object and that does not contain any foreign matter.
- the pre-camera 21 generates and outputs image data of an object.
- the processing circuit 23 causes the image processing device 22 to divide a plurality of areas in the image indicated by the image data.
- the processing circuit 23 causes the image processing device 22 to specify the area contents for each area based on the stored data indicating the arrangement of the area contents. For example, the image processing device 22 determines whether or not the color pattern of the image indicated by the RGB image data generated by the pre-camera 21 matches the color pattern of the layout of the area content indicated by the stored data. If the two color patterns match, the image processing device 22 designates the content of each region based on the data with the matching color patterns.
- the processing circuit 23 acquires the data output from the image processing device 22, generates and outputs area segmentation data indicating a plurality of areas with specified area contents.
- the input device 20 includes a pre-camera 21, a processing circuit 23, and a display device 24 that displays a GUI (Graphical User Interface) for the user to divide regions and specify region contents.
- the processing circuit 23 causes the display device 24 to display the image indicated by the image data generated by the pre-camera 21 on the GUI.
- the user divides the image displayed on the GUI into a plurality of areas and designates the content of each area.
- the processing circuit 23 acquires the data output from the display device 24, generates and outputs area segmentation data indicating a plurality of areas with specified area contents.
- the input device 20 includes a pre-camera 21, a processing circuit 23, a display device 24, and a storage device 25.
- the storage device 25 stores in advance data indicating the arrangement of area contents.
- the processing circuit 23 causes the display device 24 to display the image indicated by the image data generated by the pre-camera 21 and information on the layout of the area content contained in the data stored in the storage device 25 on the GUI.
- the selection switch the user selects the layout of the area contents from the information displayed on the GUI.
- the selection switch may be displayed on the GUI or may be a hardware switch.
- the processing circuit 23 acquires the data output from the display device 24, generates and outputs area segmentation data indicating a plurality of areas with specified area contents.
- the processing circuit 23 included in the input device 20 shown in FIGS. 4A to 4C and the processing circuit 40 included in the inspection system 100A may be configured as one processing circuit.
- FIG. 5A is a flow chart showing an example of the operation of the processing circuit 23 included in the input device 20 shown in FIG. 4A.
- the processing circuit 23 performs the operations of steps S11 to S14 shown in FIG. 5A.
- the processing circuit 23 causes the pre-camera 21 to image an object.
- the pre-camera 21 generates and outputs image data of an object.
- the processing circuit 23 causes the image processing device 22 to divide the image indicated by the image data into a plurality of areas.
- the processing circuit 23 causes the image processing device 22 to specify the area content for each of the plurality of divided areas.
- the processing circuit 23 acquires the data output from the image processing device 22, generates and outputs area division data.
- FIG. 5B is a diagram schematically showing an example of data stored in the storage device 25 shown in FIG. 4C.
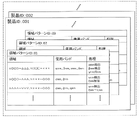
- the data shown in FIG. 5B includes a table showing the relationship between input IDs and area pattern IDs associated with the input IDs.
- the area pattern ID is an ID that identifies an area pattern defined by a pattern of arrangement of area contents. The user uses the selection switch to select the input ID displayed on the GUI of the display device 24 to determine the area pattern ID.
- FIGS. 6A to 6C are diagrams schematically showing examples of reference data stored in the storage device 30 shown in FIG. 3A.
- Product IDs shown in FIGS. 6A to 6C are IDs for identifying product types.
- 6A to 6C illustrate three formats as reference data formats.
- the reference data includes a plurality of tables to which a plurality of area pattern IDs are attached for each of a plurality of product IDs.
- the table includes area information, band information, and processing information directly linked to area pattern IDs.
- the area information includes information on the XY coordinate range that defines the area.
- the X-axis and Y-axis can be parallel to the horizontal and vertical directions, respectively, of a rectangular shaped image, for example.
- the origin of the XY coordinates may be, for example, the center of a rectangular image or any of the four corners.
- the band information includes information on at least one used band corresponding to the area information. The number of bands used may be one or may be plural.
- ⁇ nm, ⁇ nm, ⁇ nm, ⁇ nm means using these four bands among the bands included in the target wavelength range.
- ⁇ nm means a band with a certain wavelength width, such as 5nm or 10nm. The same applies to “ ⁇ nm”, “ ⁇ nm”, and “ ⁇ nm”.
- ⁇ nm is written by omitting what should be written as "( ⁇ )nm".
- ⁇ nm is written by omitting what should be written as "( ⁇ )nm".
- ⁇ nm is written by omitting what should be written as "( ⁇ )nm".
- ⁇ nm is written by omitting what should be written as "( ⁇ )nm".
- ⁇ nm is written by omitting what should be written as "( ⁇ )" nm.
- ⁇ nm is written by omitting the content that should be written as "( ⁇ )" nm.
- ⁇ nm is written by omitting the content that should be written as "( ⁇ )" nm.
- the processing information includes processing method information on how to process partial image data for a plurality of used bands.
- ⁇ nm extraction and “ ⁇ nm extraction” mean extracting partial image data for ⁇ nm and ⁇ nm, respectively.
- ⁇ nm/ ⁇ nm means generating processed image data by dividing the pixel value of the partial image data for ⁇ nm by the pixel value of the partial image data for ⁇ nm.
- the processed image data can be generated by adding, subtracting, multiplying, or dividing pixel values of partial image data for multiple bands.
- the reference data includes a plurality of main tables each assigned a plurality of area pattern IDs for each of a plurality of product IDs.
- the main table includes area information directly linked to the area pattern ID and information on the spectrum pattern ID.
- the reference data further includes a sub-table showing the relationship between the spectrum pattern ID and the used band, and a sub-table showing the relationship between the spectrum pattern ID and the processing method.
- the balloons shown in FIG. 6B represent correspondence relationships between the information contained in the main table and the sub-tables.
- the reference data includes a plurality of main tables each assigned a plurality of area pattern IDs for each of a plurality of product IDs.
- the main table includes area information directly linked to the area pattern ID, spectrum pattern ID information, and processing pattern ID information.
- the reference data further includes a sub-table showing the relationship between spectrum pattern IDs and bands used, and a sub-table showing the relationship between processing pattern IDs and processing methods for each spectrum pattern ID.
- the balloon shown in FIG. 6C is similar to the balloon shown in FIG. 6B.
- one spectrum pattern ID has a plurality of processing pattern IDs.
- the processing method differs for each processing pattern ID.
- the third format is applied when the processing method differs depending on the object even if the band used is the same.
- the reference data as shown in FIGS. 6A to 6C are pre-stored in the storage device 30 by the user.
- a user may generate reference data using, for example, the input device 20 shown in FIG. 4B.
- a user enters region information, band information, and processing information into a GUI displayed on display device 24 .
- the processing circuit 23 acquires data output from the display device 24 and generates and outputs reference data.
- the processing circuit 40 causes the storage device 30 to store the reference data output from the input device 20 .
- processing circuit 40 in foreign matter inspection will be described with reference to FIGS. 7A to 7C.
- the user uses the input device 20 to divide the image of an object of the same type as the inspection object and free of foreign matter into a plurality of regions, and to specify the content of each region.
- the processing circuit 40 causes the storage device 30 to store the region division data output from the input device 20 .
- processing circuitry 40 obtains reference data from storage device 30 based on the region segmentation data. The area pattern included in the obtained reference data matches the arrangement pattern of area contents included in the area segmentation data.
- FIG. 7A is a flowchart showing an example of the operation of the processing circuit 40 in foreign matter inspection.
- the processing circuit 40 performs the operations of steps S101 to S111 shown in FIG. 7A.
- FIG. 7B is a flow chart showing an example of the operation of the processing circuitry 40 in step S104 shown in FIG. 7A.
- FIG. 7C is a flow chart showing an example of the operation of the processing circuitry 40 in step S105 shown in FIG. 7A.
- the steps of the flowcharts in this specification may be changed in order, or new steps may be added between the steps.
- the processing circuit 40 causes the imaging device 10 to image an object.
- the imaging device 10 generates and outputs hyperspectral image data of an object.
- "HS image data" shown in FIG. 7A represents hyperspectral image data.
- the processing circuit 40 acquires the hyperspectral image data from the imaging device 10 and the segmentation data from the storage device 30 . Processing circuitry 40 determines a plurality of regions in the image represented by the hyperspectral image data based on the region segmentation data.
- Step S103> The processing circuitry 40 selects a region to be processed from the plurality of regions determined in step S102.
- Step S104 The processing circuit 40 executes the operations of steps S104A to S104C shown in FIG. 7B to extract a plurality of partial image data respectively corresponding to a plurality of use bands. Based on the reference data, processing circuit 40 acquires information on a plurality of used bands corresponding to the selected region (step S104A). Next, processing circuitry 40 extracts a plurality of partial image data corresponding to a plurality of use bands from the hyperspectral image data (step S104B). Next, the processing circuit 40 stores the plurality of extracted partial image data in the storage device 30 (step S104C).
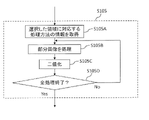
- the processing circuit 40 processes the plurality of partial image data extracted by executing the operations of steps S105A to S105C shown in FIG. 7C.
- the processing circuit 40 acquires information on a plurality of processing methods corresponding to the selected region based on the reference data (step S105A).
- the processing circuit 40 processes the partial image data based on the acquired processing method (step S105B).
- the processed partial image data can be, for example, extracted partial image data for a single band, or processed image data obtained by processing a plurality of extracted partial image data for a plurality of bands.
- the processing circuit 40 binarizes each pixel value in the processed partial image data based on a constant value (step S105C).
- processing circuit 40 determines whether or not all the processing methods included in the processing information have been completed (step S105D). If the determination is Yes, processing circuitry 40 performs the operation of step S106. If the determination is No, processing circuit 40 performs the operation of step S105B again.
- Step S106 The processing circuit 40 inspects the presence or absence of foreign matter in the selected region based on the binarized result in step S105. For example, if the image represented by the processed partial image data includes a portion having a pixel value greater than or equal to a certain value or less than a certain value, the processing circuitry 40 can determine that there is a foreign object in that portion.
- the processing circuit 40 stores data indicating the inspection result in the storage device 30 .
- Step S108> The processing circuit 40 determines whether or not the processing has been completed for all of the divided regions. If the determination is Yes, processing circuitry 40 performs the operation of step S109. If the determination is No, processing circuit 40 performs the operation of step S103 again.
- Step S109> The processing circuit 40 determines whether or not a foreign object is detected based on the data indicating the inspection result stored in the storage device 30 . If the determination is Yes, processing circuit 40 performs the operation of step S110. If the determination is No, processing circuitry 40 terminates its operation.
- Processing circuitry 40 causes output device 50 to output information about the warning.
- the output method is as described in the description of the output device 50 shown in FIG. 3A.
- Step S111> The processing circuit 40 causes the actuator 60 to discard the object for which foreign matter is detected.
- the disposal method is as described in the description of the actuator 60 shown in FIG. 3A.
- processing circuitry 40 When multiple objects 70 are conveyed sequentially as shown in FIG. 3B, processing circuitry 40 performs the operations of steps S101 to S111 for each of the multiple objects 70.
- the user uses the input device 20 to newly generate area segmentation data for an object that is the same type as the inspection object and does not contain any foreign matter.
- Processing circuitry 40 causes storage device 30 to update the stored area division data with new area division data.
- processing circuitry 40 updates the reference data based on the new segmentation data.
- the processing circuit 40 updates the plurality of regions in the image indicated by the hyperspectral image data in step S102, updates the information of the used band included in the band information in step S104, and updates the band information in step S105. , update the processing method information contained in the processing information.
- foreign matter inspection is performed using image data for some of the four or more bands included in the target wavelength range.
- Image data for some bands can be obtained from hyperspectral image data generated by a hyperspectral camera.
- Embodiment 1 a processing method is specified for each divided area. If the regions are not partitioned, it is necessary to perform the processing method in all regions, even if it is necessary in some regions but not in others. In Embodiment 1, there is no need to spend time executing such useless processing methods.
- the partitioning of areas is effective in reducing the processing load.
- foreign matter inspection can be performed at an appropriate processing speed in in-line inspection.
- FIG. 8A is a diagram showing a result of segmenting the image of the target object into a plurality of regions by the input device 20.
- FIG. 8A the object is divided into six areas, and the six areas include "blue/pattern A,”"white/patternA,””darkblue,””darkblue,” and “blue/pattern A.” Colors and/or patterns are designated such as "pattern B” and "white/pattern B”. There are two regions labeled "dark blue”. The two areas are areas of navy blue fabric contained in the clothing item.
- FIG. 8B is a diagram schematically showing reference data in the example.
- the reference data shown in FIG. 8B has a third format.
- the reference data shown in FIG. 8B shows information about "dark blue" for simplicity.
- the same spectral pattern 005 is assigned to the two regions in the main table.
- Spectral pattern 005 in the left sub-table specifies the working bands of 500 nm, 550 nm, 650 nm, 700 nm and 750 nm.
- a processing pattern 005-1 in the right sub-table specifies a processing method for extracting image data for 500 nm, 550 nm, 650 nm, and 750 nm.
- Processing pattern 005-2 in the right sub-table includes a processing method for extracting image data for 500 nm, 550 nm, and 650 nm, and a pixel value for image data for 700 nm is subtracted from the pixel value for image data for 650 nm.
- a processing method for generating processed image data is specified.
- FIG. 8C is a graph showing the reflectance spectra of dark blue fabric and assumed foreign matter in the area classified as "dark blue". Conceivable foreign substances are sewing needles, marking pins, transparent resin clips, safety pins, and marking pin head resin. The thick vertical lines shown in FIG. 8C represent the used bands. The reflectance spectrum shown in FIG. 8C forms the basis for the reference data shown in FIG. 8B.
- image data of 500 nm, 550 nm, and 650 nm are extracted.
- the reflection intensity of foreign objects that are shiny or have a color tone other than black or dark blue is higher than that of navy blue fabric. If such foreign matter is present on the navy blue cloth, the foreign matter will appear white and the navy blue cloth other than the foreign matter will appear black in the image of these bands.
- the processing circuit 40 detects a foreign object, for example, as follows. The processing circuit 40 counts the number of white or gray pixels whose pixel values in the image data are equal to or greater than a certain value.
- processing circuit 40 can determine that a foreign object has been detected. .
- the processing circuit 40 may detect the foreign object using an algorithm such as machine learning. If a hyperspectral image of an object without a foreign object is taken as pre-learned training data, and the hyperspectral image of the object under inspection is different from the training data, processing circuitry 40 may determine that a foreign object has been detected. .
- image data for 750 nm is further extracted.
- the 'safety pin' and 'needle' appear black and the rest of the dark blue fabric appears white due to the high reflectance of the dark blue fabric in this band.
- the processing pattern 500-2 includes the same processing method as the processing pattern 500-1 and a processing method different from the processing pattern 500-1.
- the same processing method as processing pattern 500-1 is to extract image data for 500 nm, 550 nm and 650 nm.
- a processing method different from the processing pattern 500-1 is to generate processed image data by subtracting the pixel value of the image data of 700 nm from the pixel value of the image data of 650 nm. In the processed image, the "safety pin" appears white, and the other dark blue fabric appears black.
- the processing pattern 500-1 is adopted when a halogen lamp is used as the light source for irradiating the object.
- Light emitted from a halogen lamp includes light in the near-infrared region. Therefore, image data of 750 nm can be used in foreign matter inspection.
- processing pattern 500-2 is adopted when LEDs are used as the light source for illuminating the object. The light emitted from the LED contains little light with wavelengths longer than 700 nm. Therefore, the processed image data described above is used.
- the reflection spectrum shown in FIG. 8C suggests that there is a combination of dark blue fabric and foreign matter that is not easy to identify in foreign matter inspection using a monochrome camera or an RBG camera.
- foreign matter inspection using a hyperspectral camera can more accurately detect such foreign matter, which is not easy to identify.
- FIG. 9A is a diagram showing an image of 750 nm when a sewing needle is mixed in the area classified as "dark blue".
- the sewing needle appears black and the navy blue fabric appears white.
- FIG. 9B is a diagram showing a black and white inverted image of FIG. 9A.
- the sewing needle appears white and the navy blue fabric appears black.
- processing circuitry 40 can determine that a foreign object has been detected based on the number of white or gray pixels counted.
- FIG. 9C is a diagram showing the above processed image when a safety pin is included in the area classified as "dark blue".
- the safety pin appears white and the navy blue fabric appears black. Accordingly, processing circuitry 40 may determine that a foreign object has been detected based on the number of white or gray pixels counted, as described above.
- a hyperspectral camera using compression sensing technology is used to detect foreign matter on the object.
- An overview of the foreign matter detection method according to the second embodiment is as follows. Compressed image data is acquired for the object under inspection. An image represented by the compressed image data is divided into a plurality of areas. Partial image data corresponding to at least one band among four or more bands included in the target wavelength band is restored from the compressed image data for each of the plurality of regions. A foreign substance in the object is detected for each region based on the restored partial image data.
- FIG. 10 is a block diagram that schematically illustrates an inspection system according to exemplary embodiment 2 of the present disclosure.
- An inspection system 100B shown in FIG. 10 includes an imaging device 10, an input device 20, a storage device 30, a processing circuit 40, a memory 42, an output device 50, and an operating device 60.
- differences between the inspection system 100B according to the second embodiment and the inspection system 100A according to the first embodiment will be mainly described.
- the imaging device 10 functions as a hyperspectral camera that generates and outputs compressed image data of an object by imaging using compressed sensing technology.
- the imaging device 10 may include, for example, an optical system, a filter array, and an image sensor positioned on the optical path of reflected light or transmitted light from the object, in that order.
- the optical system forms an image on the photodetector surface of the image sensor.
- the filter array modulates the intensity of incident light for each filter and emits the light.
- the image sensor detects light that has passed through the filter array.
- the input device 20 acquires the compressed image data output from the imaging device 10, generates and outputs area segmentation data based on the compressed image data.
- 11A to 11C are block diagrams schematically showing examples of the input device 20 shown in FIG. 10.
- FIG. The input device 20 shown in FIGS. 11A to 11C differs from the input device 20 shown in FIGS. 4A to 4C in that the input device 20 does not include a pre-camera 21 .
- the input device 20 generates and outputs area division data based on the compressed image data output from the imaging device 10 rather than the image data generated by the pre-camera 21 .
- the generation of the region division data in the input device 20 shown in FIGS. 11A to 11C is as described in the description of the input device 20 shown in FIGS. 4A to 4C.
- the input device 20 may have the configuration shown in FIGS. 4A to 4C, and may generate and output area division data based on the image data generated by the pre-camera 21.
- FIG. 4A to 4C may have the configuration shown in FIGS. 4A to 4C, and may generate and output area division data based on the image data generated by the pre-camera 21.
- the storage device 30 stores the region segmentation data output from the input device 20, the restoration table of the filter array used for the compression sensing technique, the reference data used for the foreign matter inspection, and the data indicating the result of the foreign matter inspection for each region. do.
- the restore table is a restore table for all areas or a restore table for each of a plurality of partitioned areas.
- a restoration table for all areas is called a "complete restoration table”
- a restoration table for each of a plurality of partitioned areas is called an "area-by-area restoration table”.
- the reference data includes a table showing the relationship between restoration bands and processing methods for each of a plurality of regions.
- FIG. 12A is a diagram schematically showing an example of a complete restoration table.
- P ij shown in FIG. 12A represents the position of the pixel.
- FIG. 12B is a diagram schematically showing an example of a restoration table by area. As shown in FIG. 12B, a plurality of area IDs are assigned to the plurality of partitioned areas.
- P ij shown in FIG. 12B represents the pixel position for each region.
- the processing circuitry 40 restores the foreign object data based on the right sub-table shown in FIG. 6B or the right sub-table shown in FIG. 6C. inspection can be carried out.
- the right sub-table shown in FIG. 6B shows the relationship between spectral pattern IDs and processing methods in the second format.
- the right sub-table shown in FIG. 6C shows the relationship between the processing pattern ID and the processing method for each spectrum pattern ID in the third format.
- the processing circuit 40 stores the region segmentation data output from the input device 20 in the storage device 30, and the processing circuit 40 acquires reference data from the storage device 30 based on the region segmentation data. is as described in the first embodiment.
- FIG. 13A is a flow chart showing an example of the operation of the processing circuit 40 in foreign matter inspection using the complete restoration table.
- the processing circuit 40 performs the operations of steps S201 to S212 shown in FIG. 13A.
- the processing circuit 40 causes the imaging device 10 to image an object.
- the imaging device 10 generates and outputs compressed image data of an object.
- Step S202> The processing circuit 40 acquires the compressed image data from the imaging device 10 and acquires the complete restoration table from the storage device 30 . Processing circuitry 40 uses the full decompression table to decompress hyperspectral image data from the compressed image data.
- the processing circuit 40 acquires the area division data from the storage device 30 .
- Processing circuitry 40 determines a plurality of regions in the image represented by the hyperspectral image data based on the region segmentation data.
- Steps S204 to S212 The operations from steps S204 to S212 are the same as the operations from steps S103 to S111 shown in FIG. 7A.
- the processing circuit 40 stores the region segmentation data output from the input device 20 in the storage device 30, and the processing circuit 40 acquires reference data from the storage device 30 based on the region segmentation data. is as described in the first embodiment.
- the processing circuit 40 generates an area restoration table based on the area division data and the complete restoration table obtained from the storage device 30 .
- FIG. 13B is a flow chart showing an example of the operation of the processing circuit 40 in foreign matter inspection using the region-specific restoration table.
- the processing circuit 40 performs the operations of steps S301 to S311 shown in FIG. 13B.
- the processing circuit 40 causes the imaging device 10 to image an object.
- the imaging device 10 generates and outputs compressed image data of an object.
- the processing circuit 40 acquires the compressed image data from the imaging device 10 and acquires the segmentation data from the storage device 30 . Processing circuitry 40 determines a plurality of regions in the image represented by the compressed image data based on the region segmentation data.
- Processing circuitry 40 selects a region to be processed from the plurality of regions determined in step S302.
- Step S304> The processing circuit 40 acquires restoration data by area from the storage device 30 .
- the processing circuitry 40 selectively restores partial image data for the band used in the region selected in step S303 from the compressed image data using the restoration table for each region.
- processing circuit 40 may restore partial image data for all bands in the region selected in step S303 from the compressed image data using the restoration table for each region.
- the processing circuit 40 extracts partial image data for the used band from partial image data for all bands.
- Steps S305 to S311 The operations from steps S305 to S311 are the same as the operations from steps S105 to S111 shown in FIG. 7A.
- an image can be segmented into a plurality of regions by acquiring user's region designation input for compressed image data, and partial image data for a use band can be selectively extracted from compressed image data for each region. can be restored to
- the number of times of processing and the amount of data to be temporarily stored can be significantly reduced compared to a configuration that does not use compressed image data and does not divide regions.
- foreign matter inspection can be performed at an appropriate processing speed in in-line inspection.
- Embodiment 2 An example of Embodiment 2 will be described below with reference to FIGS. 14A to 17C.
- the object in the example is a packed lunch containing a plurality of side dishes and foodstuffs in a container among processed food products.
- foreign matter inspection is performed using the restoration table for each region.
- FIGS. 14A to 14E are diagrams for explaining the procedure for dividing the compressed image of the lunch box into a plurality of areas and designating the contents of the areas using the input device 20 shown in FIG. 11B.
- the GUI displayed on the display device 24 displays compressed images captured by the imaging device 10 and classification buttons.
- the user selects a segmentation button to initiate segmentation of regions for the compressed image.
- the GUI also displays a cancel button and an exit button.
- the user may select the cancel button to cancel the previous selection, or the end button to end the input operation.
- the GUIs shown in FIGS. 14B-14E also display cancel and exit buttons. Buttons to be displayed may be other than the sorting button, the cancel button, and the end button. In addition, it may have a function for designating an area in the displayed image.
- the GUI displays a compressed image divided into multiple areas and buttons for specifying areas.
- the user selects an area designation button.
- the plurality of areas may be stored in advance as a division pattern for the contents of the boxed lunch.
- each region may be divided into regions according to pixel values or brightness in the compressed image. Region division based on pixel values or luminance is based on clustering, for example. Alternatively, for example, a closed region is created based on the edge extraction result of the compressed image, and the divided regions are determined by the active contour method or the like. Region segmentation of the compressed image may be performed using other methods.
- the GUI displays a cursor represented by a white arrow as a pointing device on the compressed image divided into a plurality of areas.
- the user designates the area using the cursor.
- the GUI displays a list of ingredients and side dishes for the specified area.
- the user selects ingredients or side dishes in the specified area from the list. In this way, the user designates ingredients or side dishes for each area.
- the GUI displays a compressed image in which ingredients or side dishes are specified for each region, an OK button, and a reset button.
- the user selects a determination button to determine the designation of ingredients or side dishes for each area.
- the user may select the reset button to redo the designation of ingredients or side dishes for each area.
- the processing circuit 40 updates the region-by-region restoration table based on the newly generated region division data before the foreign matter inspection.
- FIG. 15A is a graph showing the reflection spectra of "white rice” and assumed foreign matter in the region classified as "white rice".
- the foreign matter is hair (black), hair (white), hair (brown green bleach), hair (brown high bleach), eggshell, rubber band (uncolored), staples, and white styrofoam.
- the reflection spectrum of "white rice” does not depend much on the wavelength, and the reflection intensity is around 0.5.
- the reflection intensity of the eggshell is higher than that of "white rice” in all bands in the wavelength range of interest.
- the eggshell appears whiter than the "white rice” in the image for any band.
- the reflection intensity of some foreign objects is lower than that of “white rice” in all bands of the wavelength range of interest.
- Such a foreign substance appears black in comparison with "white rice” in the image for any band.
- the reflectance spectrum of hair (white hair) is close to the reflectance spectrum of “white rice”. Therefore, in an image of a single band, the difference between hair (white hair) and "white rice” is not clear, and detection of hair (white hair) is not easy.
- FIG. 15B is a diagram schematically showing a table showing the relationship between restoration bands and processing methods for areas classified as "white rice".
- Restoration bands are at 520 nm, 620 nm and 800 nm.
- the thick vertical lines shown in FIG. 15A represent these restoration bands.
- the table shown in FIG. 15B includes a processing method for extracting image data for 520 nm and 620 nm, and a processing method for generating processed image data by subtracting the pixel value of the image data for 520 nm from the pixel value of the image data for 800 nm. is specified.
- the image data for 620 nm is used to detect foreign matter, such as egg shells, that appears whiter than "white rice”.
- Image data for 520 nm is used to detect foreign matter that appears black compared to "white rice”.
- the processed image data described above is used for detecting hair (white hair).
- FIG. 15C is a diagram showing an image at 520 nm when hair (black hair) is mixed in the area classified as "white rice".
- hair (black hair) appears as a black line
- "white rice” appears as a white line.
- FIG. 15D is a diagram showing a black and white reversed image of FIG. 15C.
- hair (black hair) appears as a white line
- "white rice” appears as a black line.
- Processing circuitry 40 may determine that a foreign object has been detected based on the number of white or gray pixels counted, as previously described. Considering that the foreign matter is hair, the processing circuitry 40 counts the white or gray pixels that form a line. Alternatively, the processing circuitry 40 may detect the foreign object using an algorithm such as machine learning.
- FIG. 15E is a diagram showing a processed image when hair (white hair) is mixed in the area classified as "white rice".
- hair (white hair) appears as white lines
- "white rice” appears as black.
- Processing circuitry 40 may determine that a foreign object has been detected based on the number of white or gray pixels counted, as previously described. Due to the similarity of the spectra of "white rice” and hair (gray hair), hair (gray hair) is not easily discernible in the image for any single band. On the other hand, it is possible to identify hair (white hair) in the processed image.
- FIG. 16A is a graph showing the reflectance spectra of "seaweed” and assumed foreign matter in the area classified as “seaweed".
- the reflection intensity is low in the visible light range of 450 nm or more and 700 nm or less. In the image of the bands included in the visible light region, "seaweed" appears black.
- FIG. 16B is a diagram schematically showing a table showing the relationship between restoration bands and processing methods for areas classified as "seaweed".
- Restoration bands are at 500 nm, 660 nm, and 800 nm.
- the thick vertical lines shown in FIG. 16A represent these restoration bands.
- the table shown in FIG. 16B specifies processing methods for extracting image data for 500 nm, 660 nm, and 800 nm. Image data for these bands is used to detect black or dark foreign matter.
- Image data for 500 nm is advantageous for detecting hair (white hair), as shown in FIG. 16A.
- Image data for 660 nm favors detection of hair (brown high bleach) and rubber bands, as shown in FIG. 16A.
- Image data for 800 nm is advantageous for hair (black hair) detection, as shown in FIG. 16A.
- FIG. 16C is a diagram showing an image at 800 nm when hair (black hair) is mixed in the area classified as "seaweed".
- hair (black hair) appears as a black line
- "seaweed” appears as gray.
- FIG. 16D is a diagram showing a black and white inverted image of FIG. 16C.
- hair (black hair) appears as a white line.
- Processing circuitry 40 may determine that a foreign object has been detected based on the number of white or gray pixels counted, as previously described.
- FIG. 17A is a graph showing reflection spectra of "fried chicken” and assumed foreign matter in the area classified as “fried chicken”.
- the reflection intensity increases from the short wavelength side to the long wavelength side. That is, "fried chicken” appears black in the image of the band on the short wavelength side, and appears white or gray in the image of the band on the long wavelength side.
- the image for the band on the short wavelength side is used to detect white or near-white contaminants.
- the image for the longer wavelength band is used to detect black or dark foreign matter.
- the reflectance spectrum of hair (brown hair high bleach) is almost equal to the reflectance spectrum of "fried chicken". Therefore, in the image of a single band, the difference between hair (brown high bleach) and "white rice” is not clear, and detection of hair (brown high bleach) is not easy.
- FIG. 17B is a diagram schematically showing a table showing the relationship between restoration bands and processing methods for areas classified as "fried chicken".
- Restoration bands are at 480 nm, 500 nm, 520 nm, and 760 nm.
- the thick vertical lines shown in FIG. 17A represent these restoration bands.
- the table shown in FIG. 17B specifies a processing method for extracting image data for 500 nm and 760 nm, and a processing method for generating processed image data by adding pixel values of image data for 480 nm, 500 nm, and 520 nm.
- the image data for 500 nm is used to detect white or near-white contaminants.
- Image data for 760 nm is used for detection of black or dark foreign matter.
- the above processed image data is used for detecting hair (brown hair with high bleach).
- FIG. 17C is a diagram showing the above processed image when hair (brown hair high bleach) is mixed in the area classified as "fried chicken".
- the hair (brown high bleach) appears as a white line.
- Processing circuitry 40 may determine that a foreign object has been detected based on the number of white or gray pixels counted, as previously described.
- a method comprises: (a) receive an image; an imaging device imaging a subject to generate the image; A filter array including a plurality of filters arranged two-dimensionally is arranged between the subject and the imaging device, and the plurality of filters have different light transmission characteristics, (b) based on said image, a plurality of first pixel values of a plurality of first pixels included in a first region included in a first image corresponding to light in a first wavelength band from the subject; a plurality of second pixel values of a plurality of second pixels included in a second region included in a second image corresponding to light in a second wavelength band from the subject; a plurality of third pixel values of a plurality of third pixels included in a third region included in a third image corresponding to light in a third wavelength band from the subject; calculating a plurality of fourth pixel values of a plurality of fourth pixels included in a fourth region included in a fourth image corresponding to light in a fourth wavelength band from
- the method may be used in the production line.
- the method may be used in an inspection process for the presence of foreign objects in a manufactured lunch box (ie, object 70) (see FIG. 3B).
- a manufactured bento includes a container and multiple ingredients.
- each of the plurality of foodstuffs is arranged in a predetermined area of the container.
- the processing circuit 40 receives the image output from the image sensor included in the imaging device 10, that is, the compressed image (see FIG. 10).
- the image sensor captures an image of a subject (for example, a manufactured lunch box) to generate an image.
- a filter array 80 including a plurality of two-dimensionally arranged filters is arranged between the subject and the image sensor. The transmission characteristics of the plurality of lights of the plurality of filters are different from each other (see FIGS. 2A-2C).
- the multiple pixel values of multiple pixels included in the compressed image are
- FIG. 18 shows examples of coordinate axes and coordinates.
- a plurality of pixel values of a plurality of pixels included in the image 12W k are
- the pixel value P(f p rs ) included in the image data f p and the pixel value P(f q rs ) included in the image data f q are the pixel values of the same part of the subject.
- Formula (1) can be expressed as follows.
- g is a matrix of m ⁇ n rows and 1 column
- f is a matrix of m ⁇ n ⁇ i rows and 1 column
- H is a matrix of m ⁇ n rows and m ⁇ n ⁇ i columns.
- the processing circuit 40 performs the following processing based on the received compressed image.
- White rice and seaweed, which are a plurality of foodstuffs, are arranged at predetermined positions in the container.
- the imaging device 10 takes an image of the manufactured lunch. Since each of the plurality of foodstuffs is arranged in a predetermined area of the container, the processing circuit 40 can identify the positions of the plurality of foodstuffs in the compressed image output from the imaging device 10 .
- FIG. 19 shows multiple positions of multiple pixels in the compressed image, multiple pixel values of multiple pixels included in the compressed image, data g of the compressed image, and multiple pixels in image Ik corresponding to wavelength band Wk .
- white rice is specified by coordinates (1, 1) to coordinates (1, 8), coordinates (2, 1) to coordinates (2, 8), and seaweed is specified by coordinates (3, 8). 1), to coordinates (3, 8), to coordinates (5, 1), to coordinates (5, 8).
- the multiple pixel values of multiple pixels included in the compressed image are
- Compressed image data g is
- white rice is specified by coordinates (1, 1) to coordinates (1, 8), coordinates (2, 1) to coordinates (2, 8), and seaweed is specified by coordinates (3 , 1), ⁇ , coordinates (3, 8), ⁇ , coordinates (5, 1), ⁇ , coordinates (5, 8).
- a plurality of pixel values of a plurality of pixels included in the image Ik are
- the processing circuit 40 calculates f 1 ', f 2 ', f 3 ' and f 4 ' based on the following equation (10).
- FIG. 20 shows pixel values calculated by the processing circuit 40, pixel values not calculated, and image data fk ' from which the pixel values not calculated are omitted. Note that the processing circuitry computes f k ', not f k .
- Processing circuitry 40 determines a first region (in image I1 , coordinates (1, 1), . Calculate the values (P(f 1 11 ), . . . , P(f 1 18 ), P(f 1 21 ), . . . , P(f 1 28 )).
- the processing circuit 40 processes a second region (coordinates ( 1 , 1 ), . . . , coordinates (1, 8), coordinates ( 2 , 1), . ), . . . , P(f 2 18 ), P(f 2 21 ), .
- the processing circuit 40 processes the third region (coordinates ( 3 , 1 ), . . . , . . . , coordinates (3, 8), coordinates (4, 1), ⁇ , coordinates (4, 8), coordinates (5, 1), ⁇ , coordinates (5, 8)).
- a plurality of third pixel values of the third pixel P( f331 ), ..., P( f338 ), P( f341 ), ..., P( f348 ), P( f351 ), .
- the processing circuit 40 processes the fourth region (coordinates ( 3 , 1), . . . , . . . , coordinates (3, 8), coordinates (4, 1), ⁇ , coordinates (4, 8), coordinates (5, 1), ⁇ , coordinates (5, 8)).
- a plurality of fourth pixel values of the fourth pixel P( f431 ), ..., P( f438 ), P( f441 ), ..., P( f448 ), P( f451 ), .
- the first and second areas correspond to the areas where the white rice included in the lunch box is placed.
- the 3rd and 4th areas correspond to the areas where the seaweed contained in the lunch box is placed.
- the processing circuit 40 processes regions other than the first region included in the image I1 (in the image I1, coordinates (3, 1 ), . . . , coordinates (3, 8), coordinates (4, 1), . . . , coordinates ( 4, 8), coordinates (5, 1), ⁇ , a plurality of pixel values (P(f 1 31 ), ..., P(f 1 38 ), P(f 1 41 ), ..., P(f 1 48 ), P(f 1 51 ), ..., P(f 1 58 )) are not calculated.
- the processing circuit 40 processes regions other than the second region included in the image I 2 ( coordinates (3, 1), . . . , coordinates (3, 8), coordinates (4, 1), . . . , coordinates ( 4, 8), coordinates (5, 1), ⁇ , a plurality of pixel values (P(f 2 31 ), ..., P(f 2 38 ), P(f 2 41 ), ..., P(f 2 48 ), P(f 2 51 ), ..., P(f 2 58 )) are not calculated.
- the processing circuit 40 processes regions other than the third region included in the image I 3 ( coordinates (1, 1), . . . , coordinates (1, 8), coordinates (2, 1), . . . , coordinates ( 2, 8)) of a plurality of pixels (P(f 3 11 ), ..., P(f 3 18 ), P(f 3 21 ), ..., P(f 3 28 )) is not calculated.
- the processing circuit 40 processes regions other than the fourth region included in the image I 4 ( coordinates (1, 1), . . . , coordinates (1, 8), coordinates (2, 1), . . . , coordinates ( 2, 8)) of a plurality of pixels (P(f 4 11 ), ..., P(f 4 18 ), P(f 4 21 ), ..., P(f 4 28 )) is not calculated.
- FIG. 21 shows a comparison of f, H, f', H'.
- FIG. 22 shows A, B, C, and D included in FIG.
- H is a matrix of 40 rows and 160 columns, while H' is a matrix of 40 rows and 80 columns. That is, the number of components of H' is half the number of components of H.
- the processing circuit 40 generates a first region (coordinates ( 1 , 1 ), . . . , A region specified by coordinates (1, 8), coordinates (2, 1), . P(f 1 11 ), . . . , P(f 1 18 ), P(f 1 21 ), .
- processing circuitry 40 may determine that the first region does not contain a foreign object. Otherwise, processing circuitry 40 may determine that the first region contains a foreign object.
- the predetermined range may be determined based on the data in FIG. 15A.
- the processing circuit 40 processes a second region (coordinates ( 1 , 1 ), . . . , A region specified by coordinates (1, 8), coordinates (2, 1), . P(f 2 11 ), . . . , P(f 2 18 ), P(f 2 21 ), .
- processing circuitry 40 may determine that the second region does not contain a foreign object. Otherwise, processing circuitry 40 may determine that the second region contains a foreign object.
- the predetermined range may be determined based on the data in FIG. 15A.
- the processing circuit 40 determines that the white rice included in the lunch to be inspected (that is, the area in which the white rice is arranged) does not include any foreign matter. decide. If the first area contains a foreign object, the second area contains a foreign object, or the first area contains a foreign object and the second area contains a foreign object, the processing circuit 40 detects the white rice contained in the boxed lunch to be inspected. That is, the area where white rice is placed) is determined to contain foreign matter (see FIGS. 15A, B and related description).
- the processing circuit 40 generates a third region (coordinates ( 3 , 1 ), . . . , coordinates (3, 8), coordinates (4, 1), ⁇ , coordinates (4, 8), coordinates (5, 1), ⁇ , coordinates (5, 8)) is one or more , P( f341 ), P ( f341 ), P(f 3 48 ), P(f 3 51 ), .
- processing circuitry 40 may determine that the third region does not contain a foreign object. Otherwise, processing circuitry 40 may determine that the third region contains a foreign object.
- the predetermined range may be determined based on the data in FIG. 16A.
- the processing circuit 40 generates a fourth region (coordinates ( 3 , 1), . . . , coordinates (3, 8), coordinates (4, 1), ⁇ , coordinates (4, 8), coordinates (5, 1), ⁇ , coordinates (5, 8)) is one or more of the plurality of fourth pixels (P(f431), ..., P( f438 ), P ( f441 ), ..., P(f 4 48 ), P(f 4 51 ), .
- processing circuitry 40 may determine that the fourth region does not contain a foreign object. Otherwise, processing circuitry 40 may determine that the fourth region contains a foreign object.
- the predetermined range may be determined based on the data in FIG. 16A.
- the processing circuit 40 determines that the seaweed contained in the lunch box to be inspected (that is, the area in which the seaweed is arranged) does not contain any foreign matter. decide. If the third region contains foreign matter, or the fourth region contains foreign matter, or the third region contains foreign matter and the fourth region contains foreign matter, processing circuit 40 detects seaweed (That is, the area where the seaweed is located) is determined to contain foreign matter (see Figures 16A, B and related description).
- the technology of the present disclosure is useful, for example, for foreign matter inspection of industrial products and processed foods.
- the technology of the present disclosure can be used, for example, for non-visual in-line inspection.
- REFERENCE SIGNS LIST 10 imaging device 12 hyperspectral image 20 input device 21 pre-camera 22 image recognition device 23 processing circuit 24 display device 25 storage device 30 storage device 40 processing circuit 50 output device 60 operating device 70 object 80 filter array 100A, 100B inspection system
Landscapes
- Engineering & Computer Science (AREA)
- Physics & Mathematics (AREA)
- General Physics & Mathematics (AREA)
- Theoretical Computer Science (AREA)
- Multimedia (AREA)
- General Health & Medical Sciences (AREA)
- Health & Medical Sciences (AREA)
- Computer Vision & Pattern Recognition (AREA)
- Spectroscopy & Molecular Physics (AREA)
- Medical Informatics (AREA)
- Artificial Intelligence (AREA)
- Databases & Information Systems (AREA)
- Computing Systems (AREA)
- Software Systems (AREA)
- Evolutionary Computation (AREA)
- Life Sciences & Earth Sciences (AREA)
- Chemical & Material Sciences (AREA)
- Analytical Chemistry (AREA)
- Biochemistry (AREA)
- Immunology (AREA)
- Pathology (AREA)
- Quality & Reliability (AREA)
- Signal Processing (AREA)
- Image Processing (AREA)
- Investigating Or Analysing Materials By Optical Means (AREA)
Priority Applications (3)
| Application Number | Priority Date | Filing Date | Title |
|---|---|---|---|
| JP2023500747A JPWO2022176686A1 (https=) | 2021-02-22 | 2022-02-08 | |
| CN202280012995.6A CN116848399A (zh) | 2021-02-22 | 2022-02-08 | 检测异物的方法及装置 |
| US18/360,958 US20230368487A1 (en) | 2021-02-22 | 2023-07-28 | Method and apparatus for detecting foreign object |
Applications Claiming Priority (2)
| Application Number | Priority Date | Filing Date | Title |
|---|---|---|---|
| JP2021-026525 | 2021-02-22 | ||
| JP2021026525 | 2021-02-22 |
Related Child Applications (1)
| Application Number | Title | Priority Date | Filing Date |
|---|---|---|---|
| US18/360,958 Continuation US20230368487A1 (en) | 2021-02-22 | 2023-07-28 | Method and apparatus for detecting foreign object |
Publications (1)
| Publication Number | Publication Date |
|---|---|
| WO2022176686A1 true WO2022176686A1 (ja) | 2022-08-25 |
Family
ID=82930870
Family Applications (1)
| Application Number | Title | Priority Date | Filing Date |
|---|---|---|---|
| PCT/JP2022/004780 Ceased WO2022176686A1 (ja) | 2021-02-22 | 2022-02-08 | 異物を検出する方法および装置 |
Country Status (4)
| Country | Link |
|---|---|
| US (1) | US20230368487A1 (https=) |
| JP (1) | JPWO2022176686A1 (https=) |
| CN (1) | CN116848399A (https=) |
| WO (1) | WO2022176686A1 (https=) |
Cited By (1)
| Publication number | Priority date | Publication date | Assignee | Title |
|---|---|---|---|---|
| EP4667908A1 (en) * | 2024-06-21 | 2025-12-24 | Nulab Analitica Alimentaria, S.L.U. | Methods and systems for detecting solids in food products based on hyperspectral images |
Families Citing this family (2)
| Publication number | Priority date | Publication date | Assignee | Title |
|---|---|---|---|---|
| JP2023141906A (ja) * | 2022-03-24 | 2023-10-05 | ソニーセミコンダクタソリューションズ株式会社 | 撮像装置、撮像方法および撮像プログラム |
| US20250086782A1 (en) * | 2023-09-07 | 2025-03-13 | Altria Client Services Llc | Methods of tobacco classification via hyperspectral imaging |
Citations (10)
| Publication number | Priority date | Publication date | Assignee | Title |
|---|---|---|---|---|
| JPS63251865A (ja) * | 1987-04-08 | 1988-10-19 | Alps Electric Co Ltd | 濃淡画像データの圧縮化方法 |
| JP2003014580A (ja) * | 2001-06-11 | 2003-01-15 | Internatl Business Mach Corp <Ibm> | 検査装置、検査方法 |
| JP2008298680A (ja) * | 2007-06-01 | 2008-12-11 | Oki Electric Ind Co Ltd | 基板外観検査装置、基板外観検査方法及びそのプログラム |
| JP2009128345A (ja) * | 2007-11-28 | 2009-06-11 | Omron Corp | 物体認識方法およびこの方法を用いた基板外観検査装置 |
| JP2010032259A (ja) * | 2008-07-25 | 2010-02-12 | Sumitomo Electric Ind Ltd | 異物の検出装置及び検出方法 |
| JP2011141809A (ja) * | 2010-01-08 | 2011-07-21 | Sumitomo Electric Ind Ltd | 画像データ分析装置及び画像データ分析方法 |
| WO2018100768A1 (ja) * | 2016-11-29 | 2018-06-07 | Ckd株式会社 | 検査装置及びptp包装機 |
| JP2020053910A (ja) * | 2018-09-28 | 2020-04-02 | パナソニックIpマネジメント株式会社 | 光学デバイス、および撮像装置 |
| JP2020524328A (ja) * | 2017-06-19 | 2020-08-13 | インパクトビジョン インコーポレイテッド | 異物を識別するためのハイパースペクトル画像処理用のシステム及び方法 |
| WO2021192891A1 (ja) * | 2020-03-26 | 2021-09-30 | パナソニックIpマネジメント株式会社 | 信号処理方法、信号処理装置、および撮像システム |
Family Cites Families (3)
| Publication number | Priority date | Publication date | Assignee | Title |
|---|---|---|---|---|
| CN105611117B (zh) * | 2014-11-19 | 2018-12-07 | 松下知识产权经营株式会社 | 摄像装置以及分光系统 |
| CN110441264B (zh) * | 2019-07-22 | 2022-04-01 | 上海集成电路研发中心有限公司 | 一种基于压缩感知的频域谱成像装置及方法 |
| EP4018180A4 (en) * | 2019-08-20 | 2023-05-31 | P&P Optica Inc. | DEVICES, SYSTEMS AND METHODS FOR SORTING AND LABELING FOOD |
-
2022
- 2022-02-08 JP JP2023500747A patent/JPWO2022176686A1/ja active Pending
- 2022-02-08 CN CN202280012995.6A patent/CN116848399A/zh active Pending
- 2022-02-08 WO PCT/JP2022/004780 patent/WO2022176686A1/ja not_active Ceased
-
2023
- 2023-07-28 US US18/360,958 patent/US20230368487A1/en active Pending
Patent Citations (10)
| Publication number | Priority date | Publication date | Assignee | Title |
|---|---|---|---|---|
| JPS63251865A (ja) * | 1987-04-08 | 1988-10-19 | Alps Electric Co Ltd | 濃淡画像データの圧縮化方法 |
| JP2003014580A (ja) * | 2001-06-11 | 2003-01-15 | Internatl Business Mach Corp <Ibm> | 検査装置、検査方法 |
| JP2008298680A (ja) * | 2007-06-01 | 2008-12-11 | Oki Electric Ind Co Ltd | 基板外観検査装置、基板外観検査方法及びそのプログラム |
| JP2009128345A (ja) * | 2007-11-28 | 2009-06-11 | Omron Corp | 物体認識方法およびこの方法を用いた基板外観検査装置 |
| JP2010032259A (ja) * | 2008-07-25 | 2010-02-12 | Sumitomo Electric Ind Ltd | 異物の検出装置及び検出方法 |
| JP2011141809A (ja) * | 2010-01-08 | 2011-07-21 | Sumitomo Electric Ind Ltd | 画像データ分析装置及び画像データ分析方法 |
| WO2018100768A1 (ja) * | 2016-11-29 | 2018-06-07 | Ckd株式会社 | 検査装置及びptp包装機 |
| JP2020524328A (ja) * | 2017-06-19 | 2020-08-13 | インパクトビジョン インコーポレイテッド | 異物を識別するためのハイパースペクトル画像処理用のシステム及び方法 |
| JP2020053910A (ja) * | 2018-09-28 | 2020-04-02 | パナソニックIpマネジメント株式会社 | 光学デバイス、および撮像装置 |
| WO2021192891A1 (ja) * | 2020-03-26 | 2021-09-30 | パナソニックIpマネジメント株式会社 | 信号処理方法、信号処理装置、および撮像システム |
Cited By (1)
| Publication number | Priority date | Publication date | Assignee | Title |
|---|---|---|---|---|
| EP4667908A1 (en) * | 2024-06-21 | 2025-12-24 | Nulab Analitica Alimentaria, S.L.U. | Methods and systems for detecting solids in food products based on hyperspectral images |
Also Published As
| Publication number | Publication date |
|---|---|
| CN116848399A (zh) | 2023-10-03 |
| JPWO2022176686A1 (https=) | 2022-08-25 |
| US20230368487A1 (en) | 2023-11-16 |
Similar Documents
| Publication | Publication Date | Title |
|---|---|---|
| US20230368487A1 (en) | Method and apparatus for detecting foreign object | |
| Li et al. | Fast detection and visualization of early decay in citrus using Vis-NIR hyperspectral imaging | |
| US10379035B2 (en) | Appearance inspection apparatus and appearance inspection method | |
| Zhang et al. | Detection of common defects on mandarins by using visible and near infrared hyperspectral imaging | |
| Garrido-Novell et al. | Grading and color evolution of apples using RGB and hyperspectral imaging vision cameras | |
| Edreschi et al. | Classification of potato chips using pattern recognition | |
| Arivazhagan et al. | Fruit recognition using color and texture features | |
| JP3369772B2 (ja) | 物体認識システム及び方法 | |
| Vadivambal et al. | Bio-imaging: principles, techniques, and applications | |
| US12293522B2 (en) | Signal processing method, signal processing device, and imaging system | |
| US20230419478A1 (en) | Method and apparatus for detecting foreign object included in inspection target | |
| US12309506B2 (en) | Processing apparatus, method, and non-transitory computer-readable recording medium | |
| Eyarkai Nambi et al. | Comparison of various RGB image features for nondestructive prediction of ripening quality of “Alphonso” mangoes for easy adoptability in machine vision applications: a multivariate approach | |
| Sandoval et al. | Color Analysis and Image Processing Applied in | |
| Siswantoro | Application of color and size measurement in food products inspection | |
| CN117460947A (zh) | 信号处理装置及信号处理方法 | |
| US20240127574A1 (en) | Imaging system, method used in imaging system, and storage medium storing computer program used in imaging system | |
| JP2022098157A (ja) | 対象物の検査方法、処理装置、および検査システム | |
| CN114965346A (zh) | 基于深度学习和高光谱成像技术的猕猴桃品质检测方法 | |
| US20230414166A1 (en) | Method and apparatus for evaluating skin condition | |
| Wisuthiphaet et al. | Non-destructive detection of the wax bloom on European plum during post-harvest handling | |
| JP2009168743A (ja) | 検査方法および検査装置 | |
| JP7248284B2 (ja) | 異物の検出装置及び異物の検出方法ならびに異物の検出プログラム | |
| Hira et al. | Detection of fruit ripeness using image processing | |
| Sippel et al. | Cross spectral image reconstruction using a deep guided neural network |
Legal Events
| Date | Code | Title | Description |
|---|---|---|---|
| 121 | Ep: the epo has been informed by wipo that ep was designated in this application |
Ref document number: 22756007 Country of ref document: EP Kind code of ref document: A1 |
|
| WWE | Wipo information: entry into national phase |
Ref document number: 202280012995.6 Country of ref document: CN |
|
| WWE | Wipo information: entry into national phase |
Ref document number: 2023500747 Country of ref document: JP |
|
| NENP | Non-entry into the national phase |
Ref country code: DE |
|
| 122 | Ep: pct application non-entry in european phase |
Ref document number: 22756007 Country of ref document: EP Kind code of ref document: A1 |