WO2022059629A1 - 非接触材料同定方法、非接触温度同定方法、及び熱処理加工進行度同定方法 - Google Patents
非接触材料同定方法、非接触温度同定方法、及び熱処理加工進行度同定方法 Download PDFInfo
- Publication number
- WO2022059629A1 WO2022059629A1 PCT/JP2021/033443 JP2021033443W WO2022059629A1 WO 2022059629 A1 WO2022059629 A1 WO 2022059629A1 JP 2021033443 W JP2021033443 W JP 2021033443W WO 2022059629 A1 WO2022059629 A1 WO 2022059629A1
- Authority
- WO
- WIPO (PCT)
- Prior art keywords
- reference data
- similarity
- data
- temperature
- identifying
- Prior art date
- Legal status (The legal status is an assumption and is not a legal conclusion. Google has not performed a legal analysis and makes no representation as to the accuracy of the status listed.)
- Ceased
Links
Images






Classifications
-
- G—PHYSICS
- G01—MEASURING; TESTING
- G01N—INVESTIGATING OR ANALYSING MATERIALS BY DETERMINING THEIR CHEMICAL OR PHYSICAL PROPERTIES
- G01N21/00—Investigating or analysing materials by the use of optical means, i.e. using sub-millimetre waves, infrared, visible or ultraviolet light
- G01N21/62—Systems in which the material investigated is excited whereby it emits light or causes a change in wavelength of the incident light
- G01N21/71—Systems in which the material investigated is excited whereby it emits light or causes a change in wavelength of the incident light thermally excited
-
- G—PHYSICS
- G01—MEASURING; TESTING
- G01N—INVESTIGATING OR ANALYSING MATERIALS BY DETERMINING THEIR CHEMICAL OR PHYSICAL PROPERTIES
- G01N21/00—Investigating or analysing materials by the use of optical means, i.e. using sub-millimetre waves, infrared, visible or ultraviolet light
- G01N21/17—Systems in which incident light is modified in accordance with the properties of the material investigated
- G01N21/25—Colour; Spectral properties, i.e. comparison of effect of material on the light at two or more different wavelengths or wavelength bands
- G01N21/27—Colour; Spectral properties, i.e. comparison of effect of material on the light at two or more different wavelengths or wavelength bands using photo-electric detection ; circuits for computing concentration
- G01N21/274—Calibration, base line adjustment, drift correction
-
- G—PHYSICS
- G01—MEASURING; TESTING
- G01N—INVESTIGATING OR ANALYSING MATERIALS BY DETERMINING THEIR CHEMICAL OR PHYSICAL PROPERTIES
- G01N21/00—Investigating or analysing materials by the use of optical means, i.e. using sub-millimetre waves, infrared, visible or ultraviolet light
- G01N21/17—Systems in which incident light is modified in accordance with the properties of the material investigated
- G01N21/25—Colour; Spectral properties, i.e. comparison of effect of material on the light at two or more different wavelengths or wavelength bands
- G01N21/31—Investigating relative effect of material at wavelengths characteristic of specific elements or molecules, e.g. atomic absorption spectrometry
- G01N21/35—Investigating relative effect of material at wavelengths characteristic of specific elements or molecules, e.g. atomic absorption spectrometry using infrared light
-
- G—PHYSICS
- G01—MEASURING; TESTING
- G01N—INVESTIGATING OR ANALYSING MATERIALS BY DETERMINING THEIR CHEMICAL OR PHYSICAL PROPERTIES
- G01N25/00—Investigating or analyzing materials by the use of thermal means
- G01N25/72—Investigating presence of flaws
-
- G—PHYSICS
- G01—MEASURING; TESTING
- G01N—INVESTIGATING OR ANALYSING MATERIALS BY DETERMINING THEIR CHEMICAL OR PHYSICAL PROPERTIES
- G01N33/00—Investigating or analysing materials by specific methods not covered by groups G01N1/00 - G01N31/00
- G01N33/44—Resins; Plastics; Rubber; Leather
- G01N33/442—Resins; Plastics
Definitions
- the present invention relates to a method for identifying a material or state to be measured and / or its temperature in a non-contact manner, and particularly to a method for performing the above identification using thermal radiation from a measurement target.
- the present invention also relates to a method for identifying the progress of processing by heat treatment or the modification or deterioration of a material.
- any object emits electromagnetic waves (infrared rays in the normal temperature range) determined by its temperature.
- Devices called radiation thermometers, thermography, etc. are provided that measure the infrared rays emitted from an object using this phenomenon (called thermal radiation or thermal radiation) to determine the surface temperature of the object (for example,).
- thermal radiation or thermal radiation to determine the surface temperature of the object (for example,).
- the emissivity of infrared radiation from an object depends not only on the temperature but also on the material of the surface thereof, it is not possible to accurately determine the surface temperature by simply measuring the amount of infrared radiation emitted.
- the surface temperature should be obtained with high accuracy using a radiation thermometer or thermography by calibrating the temperature dependence of the amount of infrared rays and the emissivity of the material on the surface of the object. Is possible.
- the relative temperature relationship of the same material or object can be identified in increments (resolution) of about 0.05 K, but the absolute value of the obtained temperature is 1 to 2 accurate. %.
- the latter accuracy is an error due to the accuracy of the emissivity value provided in advance for each material, the sensitivity of the light receiving element, the environmental temperature, and the like. If information about the type of material on the surface of the object and the emissivity is not provided separately, the accuracy of the absolute value of temperature is not guaranteed and causes a large error.
- FIGS. 1 and 1 show an example in which epoxy is used as the object to be measured and the radiation temperature is measured by the two-color method using two sensors with high wavelength resolution in the wavelength range where the emissivity can be regarded as a constant. This will be described with reference to 2.
- FIG. 1 shows the emissivity function of the epoxy and the change in the spectral emissivity of the blackbody and the epoxy sample depending on the wavelength.
- FIG. 1 further has peaks at two wavelengths ⁇ 1 and ⁇ 2 within the wavelength range of 3.5 ⁇ m to 4 ⁇ m, respectively, and detects two adjacent wavelengths within such a narrow wavelength range with high wavelength resolution.
- the sensitivity curves of the two wavelength identification infrared sensors with high wavelength resolution capable of performing For an example of creating such an infrared sensor, refer to, for example, Non-Patent Document 2.
- L 1 and L 2 the intensities of thermal radiation at the temperature T L ( ⁇ 1 , T) and L ( ⁇ 2 , T) (hereinafter, abbreviated as L 1 and L 2 , respectively).
- ⁇ ( ⁇ ) the emissivity
- B ( ⁇ , T) Planck's radiation formula.
- L ( ⁇ 1 , T) ⁇ ( ⁇ 1 ) B ( ⁇ 1 , T)
- L 1 / L 2 ⁇ B ( ⁇ 1 , T) / B ( ⁇ 2 , T) Can be.
- the thermal radiation intensities L 1 and L 2 at wavelengths ⁇ 1 and ⁇ 2 are measurable, and the function of Planck's radiation formula on the right side of the above equation is known, the adjacent wavelengths ⁇ 1 and ⁇ 2 are known.
- the temperature T of the sample to be measured (epoxy in the example shown in FIG. 1) can be obtained from the value of the ratio of the respective thermal radiation intensities L 1 and L 2 measured in 1.
- the two wavelengths ⁇ 1 and ⁇ 2 in the wavelength range where the emissivity ⁇ can be considered to be almost constant over a certain wavelength range (where ⁇ 2 ⁇
- ⁇ 2 ⁇ An example of true temperature measurement by performing infrared measurement in ⁇ 1 ) is shown below.
- a sensor with a wavelength resolution of 0.05 ⁇ m was used as the wavelength identification infrared sensor.
- the solid line curve is the value of the ratio of thermal radiation L 1 and L 2 at wavelengths ⁇ 1 and ⁇ 2 when the temperature of the perfect blackbody is changed in the range of 700 K from around room temperature (L 2 /).
- L 1 that is, it is a graph plotted by finding the energy ratio between thermal radiation at these two wavelengths.
- the temperature plot range was set to 300 to 700K.
- the energy ratio is obtained from the heat radiation from the epoxy at the same wavelengths ⁇ 1 and ⁇ 2 as in the case of a perfect blackbody, and it is shown as a broken line curve in FIG.
- the energy ratio should be on almost the same curve as the energy ratio in the case of a perfect blackbody.
- the temperature of the epoxy was estimated from the calculation result shown in FIG.
- the temperature of the epoxy was accurately determined by another measuring method, and the difference between the above estimated temperature and the accurately determined epoxy temperature was obtained. This difference was taken as the error in temperature measurement between the complete blackbody and the epoxy as the measurement target material. The results are shown in the table below.
- the temperature of the measurement target can be estimated with considerable accuracy by using the two-color method.
- the emissivity of the object surface is too wavelength-dependent and cannot be regarded as a constant, use a radiation thermometer or thermography to obtain it. It was difficult to reduce the error of the surface temperature obtained.
- Non-Patent Document 3 there is a database in which the spectrum is presented by selecting a molecule and then selecting Raman, ATR-IR, transmission IR, or the like. Using such a database, it is possible to identify some materials by checking whether the measured infrared absorption spectra are similar to those from the guessed material.
- a method of identifying a material from an infrared absorption spectrum may be able to identify the material of an object composed of a single material, but it is not easy to identify a mixture, and it is possible to optimize the baseline correction.
- Non-Patent Document 3 has a sharp peak due to molecular vibration. In such cases, it is relatively easy to identify the material based on the number of peaks and their wavelength values and intensity ratios, but identification based on spectra that do not have such sharp peaks is possible. It is usually difficult.
- Non-Patent Document 4 There is a review of Non-Patent Document 4 regarding the latest trends in infrared radiation temperature measurement. From the conclusions of this review, it can be seen that the method of multi-wavelength analysis assuming a function of emissivity requires various restrictions such as specific conditions and material types. It is considered that the current state of the technology is that there are still many restrictions and problems in determining the temperature, and research has not progressed until the identification of the material.
- FIG. 3 shows the results when anodized alumina is used as the material to be measured, the sin function and the cubic function are assumed as the functional form of the emissivity, and the emissivity is estimated by performing the minimum square fitting. Is shown.
- the solid curve in the emissivity graph indicates the true emissivity
- the circles in the upper and lower emissivity graphs indicate the initial value and the result of the least squares fitting, respectively.
- the circles in the upper and lower graphs are the measured values of radiant intensity
- the broken line in the lower radiant intensity graph is the minimum square fitting result, that is, the radiant intensity curve radiates. This is the result of adjusting the radiant intensity function so as to get on the measured value of intensity well.
- the broken line in the upper radiation intensity graph is a curve in which the initial value of the temperature is appropriately set and the Planck's radiation formula of the temperature is multiplied by the initial value of the emissivity indicated by ⁇ . In this curve, the divergence becomes large when the initial temperature is low.
- FIG. 3 also shows the fitting result when a specific functional form is not assumed for the emissivity function.
- the emissivity is a complicated function, the fitting itself is possible, but the initial value at that time is artificially derived, that is, what the true emissivity function is is appropriate. It is required to set the initial value in anticipation of the fitting result. Without such a deliberate derivation of initial values, in most cases it will not converge to a valid solution.
- the function of the spectral emissivity is complicated, it is easier to fit if the functional form is not set as shown in the right end of FIG. 3, but the artificial derivation of the initial value is still necessary.
- the flexibility of the fitting is limited according to the form of the selected function, and in some cases, the fitting may not be successful.
- the function form is not restricted and the radiation changes drastically and drastically. Even if it is a rate, it will definitely fit. As a result, the fitting can be performed with higher accuracy.
- the above-mentioned artificial induction of the initial value at the time of fitting will be described with reference to the example shown in FIG.
- the same measurement target material and radiation intensity measurement data as in FIG. 3 are used, the initial value of the estimated temperature T'is set to 300K at the time of fitting, and the wavelength is set as the initial value of the emissivity function ⁇ ( ⁇ ).
- the actual temperature T of the measurement target was 350K.
- the value of the deviation ⁇ T of the estimated temperature T'after the square fitting from the actual temperature T also becomes small. From this result, it can be seen that the closer the initial value is to the correct solution, the more accurate the fitting result can be obtained. In other words, it can be seen that high-precision fitting cannot be realized without knowing the information of the measurement target to some extent in advance.
- FIG. 5 shows, as an example of such a material, a common building material having an emissivity ⁇ in the range of approximately 0.8 to 1, tile, brick, and concrete as an example, and having a wavelength in the range of 3 to 4 ⁇ m.
- FIG. 5 also cites glass as an example.
- the value of the emissivity function ⁇ ( ⁇ ) of glass is about 0.6 in the wavelength range of 3 to 4 ⁇ m, so by setting the initial value to 0.6, highly accurate temperature estimation can be performed. It has become possible.
- Non-Patent Document 5 which is said to have solved the above problem in obtaining the emissivity function, has been published.
- This non-patent document states that accurate temperatures can be obtained regardless of the initial conditions (ie, even if the emissivity function of the material is uncertain).
- the radiant intensity from the object to be measured at a plurality of wavelengths is measured, and the temperature of the object is obtained by the newly proposed GIM-EPF (Generalized Inverse Matrix-Exterior Penalty Function) data processing algorithm.
- GIM-EPF Generalized Inverse Matrix-Exterior Penalty Function
- Non-Patent Document 5 there are only 6 types of materials, and there is no verification as to whether or not they can function equally for various materials. Further, the applicable temperature is only in the visible-near-infrared band where the visible light is emitted at 1600 K or higher, and there is no verification as to whether or not the temperature functions equally even at temperatures lower than that. Furthermore, it is not even suggested that the GIM-EPF algorithm is used to determine the material. Even if such a determination is made within the scope of the description of Non-Patent Document 5, it is unclear whether or not it is possible.
- intensity data which is a combination of thermal radiation intensities at three wavelengths or more in the infrared band radiated from the measurement object itself, and for identifying the material to be measured.
- reference data which is a combination of thermal radiation intensity data at a plurality of wavelengths in the infrared band from each of the plurality of different materials that are candidates for the above, and the plurality of the reference data based on the plurality of the different materials.
- the similarity with at least one of the combined reference data for the mixture of the plurality of different materials is compared, and the material to be measured is one or more of the reference data having the highest similarity.
- a method of measuring the measurement object itself as a thermal radiation source and identifying the material in a non-contact manner is provided, which identifies the candidate material or a mixture thereof corresponding to the combined reference data.
- the similarity comparison may be made for at least all of the combined reference data.
- the solution of the combinatorial optimization problem may be applied to the comparison of the similarity and the identification.
- points or features to be used for obtaining the similarity are extracted from at least one of the reference data and the combined reference data, and the reference data is combined with the reference data.
- a process selected from the group consisting of dividing at least one of the reference data into a plurality of categories and subjecting a part of the plurality of categories to the comparison of the similarity may be performed.
- the measurement target may be a solid, a liquid, a gas or a mixture thereof.
- the reference data may be intensity data measured at a plurality of discrete wavelengths. Further, the plurality of wavelengths may be at least three wavelengths. Further, the similarity may be determined based on the difference in intensity between the intensity data and the reference data at a plurality of wavelengths. Further, the reference data may be a combination of a plurality of temperatures that are candidates for identifying the material to be measured and heat radiation intensity data at a plurality of wavelengths in the infrared band for each of the plurality of different materials. Further, the similarity may be determined based on the difference in intensity between the intensity data and the reference data at a plurality of wavelengths at each temperature.
- the similarity may be obtained after normalizing the intensity data and the reference data, respectively.
- thermal radiation from other than the measurement target may be removed by using an optical system.
- the optical system may be a curved mirror such as a parabolic mirror, a plane mirror, a lens or an iris using an infrared transmitting material, or a combination thereof.
- the similarity may be determined based on the root mean square error between the intensity data and the reference data.
- intensity data which is a combination of thermal radiation intensities at three or more wavelengths in the infrared band radiated from the object to be measured, and to identify the material to be measured.
- Reference data that is a combination of thermal radiation intensity data at a plurality of wavelengths in an infrared band for each known temperature from each of a plurality of different materials that are candidates for the above and a plurality of the reference data based on the different materials.
- the similarity with at least one of the combined reference data for the mixture of the plurality of different materials obtained by binding the two is compared, and the material and / or temperature to be measured has the highest similarity.
- the measurement object itself identified as a material or mixture of materials and / or temperature corresponding to the high one or more said reference data or the combined reference data, is measured as a thermal radiant source and is non-contact with the material and temperature.
- a method of identifying at least one of the above is given.
- the similarity comparison may be made for at least all of the combined reference data.
- the solution of the combinatorial optimization problem may be applied to the comparison of the similarity and the identification.
- points or features to be used for obtaining the similarity are extracted from at least one of the reference data and the combined reference data, and the reference data is combined with the reference data.
- a process selected from the group consisting of dividing at least one of the reference data into a plurality of categories and subjecting a part of the plurality of categories to the comparison of the similarity may be performed.
- the measurement target may be a solid, a liquid, a gas or a mixture thereof.
- the reference data may be intensity data measured at a plurality of discrete wavelengths.
- the plurality of wavelengths may be at least three wavelengths.
- the similarity may be determined based on the difference in intensity between the intensity data and the reference data at a plurality of wavelengths at each temperature. Further, the similarity may be obtained after normalizing the intensity data and the reference data, respectively. Further, thermal radiation from other than the measurement target may be removed by using an optical system.
- the optical system may be a curved mirror, a plane mirror, a lens or an iris using an infrared transmitting material, or a combination thereof. Further, the similarity may be determined based on the root mean square error between the intensity data and the reference data.
- the intensity data is a combination of thermal radiation intensities at multiple wavelengths in the infrared band radiated from the material itself at each predetermined stage of processing during the heat treatment process of the material. It is a combination of thermal radiation intensities at a plurality of wavelengths in the infrared band radiated from the same kind of material itself, which is obtained at each predetermined stage of processing in the process of heat-treating a plurality of different materials of the same kind as the said material.
- the similarity with at least one of the reference data and the combined reference data for the mixture of the plurality of different materials obtained by combining the plurality of reference data based on the plurality of the different materials is compared.
- the similarity comparison may be made for at least all of the combined reference data.
- the solution of the combinatorial optimization problem may be applied to the comparison of the similarity and the identification.
- points or features to be used for obtaining the similarity are extracted from at least one of the reference data and the combined reference data, and the reference data is combined with the reference data.
- a process selected from the group consisting of dividing at least one of the reference data into a plurality of categories and subjecting a part of the plurality of categories to the comparison of the similarity may be performed.
- the plurality of wavelengths may be at least three wavelengths.
- the reference data may further include a combination of thermal radiation intensities at multiple wavelengths within the infrared band radiated from the defective material itself, which may be generated by anomalous progress in the heat treatment process of the material.
- the similarity may be obtained after normalizing the intensity data and the reference data, respectively. Further, the similarity may be determined based on the difference in intensity between the intensity data and the reference data at a plurality of wavelengths. Further, the similarity may be determined based on the root mean square error between the intensity data and the reference data.
- intensity data which is a combination of thermal radiation intensities at a plurality of wavelengths in the infrared band radiated from the material to be measured, and a plurality of the same type as the material to be measured.
- reference data which is a combination of thermal radiation intensities at multiple wavelengths in the infrared band radiated from the reference material itself, which is a different material, and a plurality of the reference data based on the different materials.
- the similarity with at least one of the combined reference data for the mixture of the plurality of different materials is compared to identify one or more of the reference data or the combined reference data having the highest similarity.
- a method of detecting a material change which is a change of the material to be measured from the reference material.
- the similarity comparison may be made for at least all of the combined reference data.
- the solution of the combinatorial optimization problem may be applied to the comparison of the similarity and the identification.
- points or features to be used for obtaining the similarity are extracted from at least one of the reference data and the combined reference data, and the reference data is combined with the reference data.
- a process selected from the group consisting of dividing at least one of the reference data into a plurality of categories and subjecting a part of the plurality of categories to the comparison of the similarity may be performed.
- the reference data may be intensity data measured at a plurality of discrete wavelengths at a plurality of temperatures.
- the similarity may be obtained after normalizing the intensity data and the reference data corresponding to the measurement target. Further, the similarity may be determined based on the difference in intensity between the intensity data corresponding to the measurement target and the reference data at a plurality of wavelengths. Further, thermal radiation from other than the measurement target may be removed by using an optical system. Further, the optical system may be a curved mirror, a plane mirror, a lens or an iris using an infrared transmitting material, or a combination thereof. Further, the similarity may be determined based on the root mean square error between the intensity data corresponding to the measurement target and the reference data.
- the change may be a change over time.
- the reference data may further include the strength data when the reference material is changed to an abnormal state.
- the material to be measured may be the same individual as the reference material. Further, the material to be measured may be an individual different from the reference material.
- the intensity of electromagnetic waves such as infrared rays emitted from an object to be measured is measured at one or a plurality of temperatures or a plurality of wavelengths, and the temperature-wavelength of a plurality of candidate materials measured separately is measured.
- the intensity set it is possible to easily identify the material constituting the measurement target object in a non-contact manner and without irradiating the measurement target object with infrared rays or the like.
- the accuracy of material identification can be dramatically improved, and the surface temperature of the object to be measured is also obtained at the same time. be able to.
- the material can be specified only by comparing the candidate material with the wavelength-intensity pair at the known temperature. Further, the spectrum of thermal radiation has a large component that changes slowly according to plank radiation as compared with the fine spectrum caused by molecular vibration, and the fine peak is often not sharp. According to the present invention, it is possible to easily and highly accurately identify the material and temperature to be measured in spite of such heat radiation characteristics.
- FIG. 6 is a graph showing the results of comparison / identification with a reference material when graphite is used as the measurement target material in one embodiment of the present invention in the format shown in FIG.
- FIG. 6 is a graph showing the results of comparison / identification with a reference material when polyimide is used as the measurement target material in one embodiment of the present invention in the format shown in FIG. FIG.
- FIG. 6 is a graph showing the results of comparison / identification with a reference material when aluminum anodized aluminum is used as the measurement target material in one embodiment of the present invention in the format shown in FIG.
- FIG. 6 is a graph showing the results of comparison / identification with a reference material when ebonite is used as the measurement target material in one embodiment of the present invention in the format shown in FIG.
- FIG. 6 is a graph showing the results of comparison / identification with a reference material when mica is used as the material to be measured in one embodiment of the present invention in the format shown in FIG.
- FIG. 6 is a graph showing the results of comparison / identification with a reference material when silicon is used as the measurement target material in one embodiment of the present invention in the format shown in FIG.
- FIG. 6 is a graph showing the results of comparison / identification with a reference material when Teflon (registered trademark) is used as the material to be measured in one embodiment of the present invention in the format shown in FIG.
- FIG. 6 is a graph showing the results of comparison / identification with a reference material when steel is used as the material to be measured in one embodiment of the present invention in the format shown in FIG.
- FIG. 6 is a graph showing the results of comparison / identification with a reference material when zirconium is used as the measurement target material in one embodiment of the present invention in the format shown in FIG.
- FIG. 6 is a graph showing the results of comparison / identification with a reference material when polycarbonate is used as the measurement target material in one embodiment of the present invention in the format shown in FIG. FIG.
- FIG. 6 is a graph showing the results of comparison / identification with a reference material when tantalum is used as the measurement target material in one embodiment of the present invention in the format shown in FIG.
- FIG. 6 is a graph showing the results of comparison / identification with a reference material when aluminum is used as the measurement target material in one embodiment of the present invention in the format shown in FIG.
- FIG. 6 is a graph showing the results of comparison / identification with a reference material when molybdenum is used as the measurement target material in one embodiment of the present invention in the format shown in FIG.
- FIG. 6 is a graph showing the results of comparison / identification with a reference material when acrylic is used as the measurement target material in one embodiment of the present invention in the format shown in FIG. FIG.
- FIG. 6 is a graph showing the results of comparison / identification with a reference material when alumina is used as the measurement target material in one embodiment of the present invention in the format shown in FIG.
- FIG. 6 is a graph showing the results of comparison / identification with a reference material when a Nomex (registered trademark) 410 sheet is used as a measurement target material in one embodiment of the present invention in the format shown in FIG. 7.
- FIG. 6 is a graph showing the results of comparison / identification with a reference material when bakelite is used as the material to be measured in one embodiment of the present invention in the format shown in FIG.
- FIG. 6 is a graph showing the results of comparison / identification with a reference material when cloth is used as the material to be measured in one embodiment of the present invention in the format shown in FIG.
- the figure which shows the discrimination result of the material in the case of repeating the measurement in one Example of this invention using artificial mica as an unknown sample. They are arranged in descending order of similarity from the top. Artificial mica occupies the top position, and it was determined that the unknown material is artificial mica with high accuracy.
- the figure which shows the discrimination result of the material in the case of repeating the measurement in one Example of this invention showing the polyimide thin film as an unknown sample. They are arranged in descending order of similarity from the top. Polyimide occupies the top position, and it was determined that the unknown material is polyimide with high accuracy.
- the wavelength-temperature-intensity combination of electromagnetic waves such as infrared rays (typically in the mid-infrared region (wavelength 2.5 to 30 ⁇ m)) emitted from the object to be measured itself is measured.
- This identifies the material and temperature that make up the object.
- I f T ( ⁇ ) with the temperature T from the wavelength ⁇ in the continuous wavelength range to the thermal radiation intensity I as a parameter.
- the above wavelength-temperature-intensity combination is a discrete wavelength ⁇ 1 , ..., ⁇ M and a discrete temperature T 1 , ..., Thermal radiation intensity I 1 , ... At TN .
- IP measurement value triplet ( ⁇ m , T n , I p ) (where m, n, p are in the range of 1 ⁇ m ⁇ M, 1 ⁇ n ⁇ N, 1 ⁇ p ⁇ P, respectively. It is a set of integer values).
- the set of the above-mentioned continuous function and the triplet of measured values is referred to as reference data for the measurement result of the material that is a candidate for identification, and measurement target data for the measurement result of the measurement target.
- the discrete wavelength is at least 3 wavelengths, but more preferably 4 wavelengths or more. Even in the mid-infrared wavelength range, 3 to 4.2 ⁇ m and 8 to 14 ⁇ m, which are called atmospheric windows, can be used for remote sensing at a distance of about several meters or more. Around 2.5 to 4.5 ⁇ m is advantageous when measuring high temperature objects such as ceramics and metals because the rise of plank radiation is steep. Further, a wavelength range of 14 ⁇ m or more is effective for measuring an object having a low temperature.
- the wavelength range for measuring the reference data and the measurement target data is useful to properly use the wavelength range for measuring the reference data and the measurement target data according to the application.
- a manufacturing site such as a factory or other relatively short-distance object becomes hot
- 2.5 to 4.5 ⁇ m is used for recognition of objects near room temperature used in daily life and applications such as IoT devices.
- 4.5-14 ⁇ m may be used, and for drug discovery, medical treatment and other low temperature applications 14-30 ⁇ m may be used.
- the combination of the radiation intensity of electromagnetic waves at multiple wavelengths emitted from multiple types of candidate materials (hereinafter, also referred to as reference materials) at multiple temperatures (multi-temperature, multi-wavelength intensity data) is measured. And store it in the database as reference data.
- each reference data stored in the database is associated with the material and its temperature, one material with the highest similarity to the material to be measured can be identified, or multiple types with high similarity can be identified. It becomes possible to identify candidate materials.
- the temperature to be measured can also be identified. Of course, both the material to be measured and the temperature may be identified and the results presented, or only one of them may be presented. It should be noted here that the present invention does not measure the light that appears as a response to the incident light from the light source, such as the conventional FTIR and Raman spectrum.
- an electromagnetic wave radiated from the object to be measured itself as a light source that is, a radiated electromagnetic wave determined by the temperature of the object to be measured is measured regardless of the presence or absence of incident light.
- the means for that is not particularly limited. Specific examples include heat conduction through a stage on which an object is placed, heat conduction from an atmosphere around the object such as blowing hot air or cold air, and the like. If only heating is sufficient, microwave heating, heating by heat radiation from a heat source, or the like can be used.
- a means for measuring the surface temperature of the measurement target as accurately as possible is required.
- the degree varies depending on the heating / cooling means, for example, when measuring the temperature by a thermoelectric pair provided inside or on the back surface of an object, the temperature inside or on the back surface may not necessarily be the same as the temperature on the front surface. do not have. If the difference in temperature depending on the location becomes a problem, take measures such as minimizing the above error by making the temperature of the entire object as uniform as possible by continuing heating for a sufficiently long time under certain conditions. It can be carried out. Further, even if the temperature is limited to the temperature on the front side of the object to be measured, the temperature may differ depending on the location.
- a curved mirror such as a parabolic mirror, a plane mirror, a lens using an infrared transmissive material (for example, silicon oxide, Si, Ge, etc.), an iris, etc.
- an infrared optical system that combines them, only heat radiation from as narrow a region as possible on the surface is captured and measured, and the heating / cooling stage is uniformly contacted in as large an area as possible. Measures are possible.
- infrared rays from the heat source are superimposed on the infrared rays emitted from the object to be measured, which may introduce an error in the measurement result.
- the heat radiation from the object may be measured after the heat radiation from the heat source is terminated or interrupted, but if this is difficult, it is due to direct reflection from the heat source or reflection from surrounding objects.
- the influence of the heat source may be blocked during the measurement by using a shutter-shaped movable member that blocks the infrared rays, or the influence from the heat source may be canceled by some arithmetic processing or machine learning from the measurement result. Further, the same problem may occur with respect to thermal radiation from the inner wall of the container accommodating the object to be measured, other members in the vicinity of the object to be measured, and the optical system of the measuring instrument itself.
- the surface of the object to be measured is the temperature of the inner wall surface, nearby members, the optical system of the measuring instrument, etc., which uses an infrared optical system that blocks heat radiation from unnecessary parts as described above.
- measures such as making the infrared energy radiated from the heating / cooling sufficiently smaller than the infrared energy radiated from the surface of the object to be measured. Can be taken.
- the reference data and the measurement target data are stored in a database by processing intensity data for a large number of wavelength points into discrete wavelength and discrete temperature reference data for each wavelength point at predetermined intervals defined by various factors. Then, the measurement target data of the thermal radiation intensity measured at the discrete wavelength from the measurement target may be compared with the discrete reference data in the database for identification. Alternatively, conversely, a large number of measurement target data having substantially continuous wavelengths may be compared with reference data having discrete wavelengths.
- FIG. 6 shows an example in which the intensity at a discrete wavelength on a continuous spectrum is selected, measured, and recorded. In the example shown in FIG.
- the continuous spectrum of the emitted infrared rays is shown by a solid line, and the intensity at 16 discrete wavelengths is selected as the intensity (feature value) of the point (feature point) indicating the feature of the data.
- the selected feature points are shown as light-colored small disks in the figure.
- slightly oblong discs are shown in two places near the peak of the data, these are both oblong because they are shown in a partially overlapped state because the two discs are close to each other. Note that it looks like a disk.
- the horizontal axis of the graph in FIG. 6 is represented by the wave number, it should be noted that since the wavelength and the wave number have a reciprocal relationship with each other, they are treated as equivalent to each other in the present application.
- FIG. 6 features thermal radiation intensity at 16 discrete wavelengths, it may be less or more than this.
- the number of wavelengths was increased to about 16 points, it was possible to identify common materials and articles with an accuracy of 95% or more.
- the wavelength resolution of the measuring device that can be used in the present invention is limited, in actual measurement, increasing the number of wavelength points does not necessarily improve the accuracy. It is possible to improve the identification accuracy by increasing the number of temperature points when preparing the reference data.
- a plurality of temperatures are set within the temperature range that the measurement target can take, and reference data corresponding to these temperatures are prepared.
- the set temperature points are increased by subdividing the temperature range into smaller pieces, Identification accuracy is improved.
- the measurement accuracy of the surface temperature of the material when measuring the reference data is close to the temperature resolution (temperature interval or step) in the temperature setting, the temperature is determined. The accuracy can be increased to the extent of the surface temperature.
- the accuracy of discrimination of the reference data is improved by measuring the exact same sample multiple times.
- the accuracy will increase.
- the database maintenance of reference data is very effective in improving the accuracy.
- the accuracy is improved by performing multiple measurements on a large number of samples as described above. Therefore, in order to expand the objects that can be discriminated and improve the accuracy, the database consisting of reference data becomes enormous, and as a result, the time required for discriminating on the computer tends to increase. As a measure to suppress this increase in discrimination time, machine learning that allows the characteristics of the data of the sample to be measured to be grasped and efficiently finds them from the candidate data classified as data with similar characteristics from the database accordingly. An algorithm can be used. It has also been confirmed that this can greatly reduce the time required for analysis.
- the characteristics of the data to be measured are efficiently determined by machine learning, and then classified according to the characteristics and stored in the database.
- the time can be shortened by discriminating and classifying the characteristics of the wavelength-intensity combination by machine learning and searching for the candidate with the minimum RMSE in the classified database. For example, by using a random forest as a machine learning algorithm, it is possible to realize a time reduction of one digit or more.
- the characteristics are quantified from the minimum value of the intensity value, the maximum value and its wavelength, the magnitude of the difference between the values of multiple data of adjacent wavelengths, the direction of the slope of the baseline, etc., and are similar.
- the measurement target data obtained from the measurement target is classified by the same method, the reference data having similar characteristics and the RMSE value are directly compared from the classified group, and the sample showing the minimum RMSE value is used as the solution. decide.
- the present invention is usually performed in the atmosphere, it is preferable to select the wavelength of the feature point from within the wavelength region where the absorption of gas in the atmosphere is small. In the actual measurement, it is necessary to avoid the wavelength region where the absorption of water and carbon dioxide is particularly large.
- the gas other than the atmospheric component is measured from the measurement target or surrounding articles. If there is a risk of other gases being mixed in, such as being released, consideration should be given to the absorption of such gases.
- the wavelength of the data point in the reference data and the wavelength of the data point in the discrete wavelength are the same. It may or may not be.
- the same wavelengths can be compared by performing data interpolation on the wavelength axis, for example.
- both the reference data and the data to be measured are discrete data given by a finite number of points on the wavelength axis, and the wavelengths of the data points in the reference spectrum and the data points in the measurement target spectrum are the wavelengths.
- the comparison between the measurement target data and the reference data is not limited to this, but first, the maximum and minimum values of the intensities in each data are set to predetermined values (for example, 0 and 1). Normalize the data. That is, when normalizing the measurement target data and each reference data, these data are used.
- RMSE root mean square error
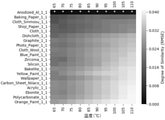
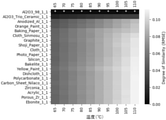
- FIG. 7 shows an example of a graph that graphically represents the identification of the material to be measured by obtaining the RMSE between the reference data and the measurement target data in which the respective intensities are normalized.
- the temperature of a certain measurement target is set at intervals of 5 ° C. between 65 and 110 ° C., and the measurement target data at each temperature is obtained from 20 kinds of materials (reference materials) shown on the vertical axis thereof.
- the RMSE was obtained by comparing with the reference data obtained in the above figure so that the concentration of the intersection between each material and the temperature corresponds to the RMSE value of the intersection shown in the concentration chart shown at the right end. Shows.
- the RMSE between the reference data from graphite and the data to be measured is minimized, so that the object to be measured can be identified as consisting of graphite.
- the reference material having the minimum RMSE at the temperature is indicated.
- the vertical axis of FIG. 7 defines the order of reference materials so that the order in which RMSE is small, that is, the material having a large degree of similarity is on the top.
- the reference material that minimizes RMSE may differ depending on the temperature, depending on the material to be measured and the measurement conditions at each location.
- the reference material having the smallest mean value of RMSE over all temperatures may be the material having the highest similarity, that is, the material to be identified as the material to be measured.
- another evaluation criterion may be set, such as adopting a weighted average with a large weight given to the temperature at which the difference between materials is likely to appear instead of the simple average of RMSE over all temperatures.
- the determination is made while also utilizing the change in the intensity of the thermal radiation spectrum. For this reason, there is an advantage that the determination can be made with high accuracy even if the number of wavelengths used is overwhelmingly smaller than that of the absorption spectroscopy or the like.
- a light source for irradiating the sample with light is unnecessary (in other words, no light source is used for measurement, and a light source is used. It can be omitted).
- Non-Patent Document 5 thermal radiation from an object to be measured is measured at a plurality of wavelengths, and these measurement results are similarly measured at a plurality of temperatures for reference at a plurality of wavelengths from a plurality of types of substances.
- a reference set consisting of a set of thermal radiation intensities
- the best matching material and temperature combination can be determined. If the substance constituting the surface of the object is known in advance, it is naturally sufficient to compare it with only the set of thermal radiation intensity for the substance in the above reference set, and conversely, the temperature is known.
- Non-Patent Document 5 the intensity of heat radiation from the object to be measured is measured at a plurality of wavelengths, and these intensities are used by a newly proposed algorithm. Therefore, the temperature of the object is obtained from these intensities.
- the method of Non-Patent Document 5 is common to the present invention in that the intensity of heat radiation from the measurement target is measured at a plurality of wavelengths, but the comparison with the reference set in the present invention is not performed. The temperature is determined using only the thermal radiation intensity at multiple wavelengths from the measurement target. In this respect, the procedure is completely different from that of the present invention. Due to this difference, the method of Non-Patent Document 5 does not identify the material constituting the surface of the substance to be measured, and how the method described therein should be modified in order to make this identification. Is not suggested at all.
- Non-Patent Document 5 uses a fairly complicated algorithm instead of comparing with a set for reference in identifying the temperature. Therefore, high data processing performance is required to process the data to be measured.
- the value of temperature or emissivity is not uniquely determined, and in principle, it is always ambiguous and arbitrary. Accompanied by.
- both the temperature measurement of an object and the identification of its material can be performed by a simple and clear method of comparison with a database, and the solution is uniquely determined.
- the present invention can further improve the measurement accuracy and the like by performing additional processing such as machine learning.
- Non-Patent Document 5 as a specific example of measurement, the thermal radiation intensity is measured at 1600 K or higher temperature, and the wavelength for measuring the radiation intensity is mainly within the visible band. This point is an essential difference from the method of the present invention, which mainly utilizes thermal radiation due to molecular vibrations and phonon vibrations in the mid-infrared band to improve the accuracy of substance identification. In addition, there are only 6 types of materials to be measured. Therefore, since Non-Patent Document 5 only verifies a special and small number of materials that can withstand such extremely high temperatures, its generality is not always certain.
- Non-Patent Document 5 has been widely verified for various materials (metals, ceramics, semiconductors, organic materials, their composite materials, and gas and liquid materials) having greatly different characteristics as shown in the examples of the present application. It can be said that it is significantly different from the present invention.
- the present specification exclusively describes an embodiment in which a method of determining based on the root mean square error (RMSE method) is used.
- the methods that can be used for the comparison are not limited to this.
- the definition of similarity is not limited to RMSE, and any similarity, including cosine similarity, can be used.
- important points on the spectrum can be extracted by machine learning (feature extraction by machine learning), and the degree of similarity can be evaluated from the features. For example, by using a variational autoencoder, it is possible to extract spectral features as continuous and discrete values, evaluate similarity, and use them to discriminate substances, temperatures, and states. be.
- each spectrum may be represented by a 0/1 bit string by using a machine learning method that extracts features at 0/1, such as a variational autoencoder that can hash features (represented by 0/1). ..
- a similarity search technique using a hash can be used, and a similarity search can be executed at high speed.
- various similar search techniques for vectors having continuous values and discrete values can be used.
- the present invention is also applied when the measurement target is not one of a plurality of candidate materials for identification of the measurement target material, but a mixture of two or more of these candidate materials. be able to. That is, by considering the spectrum of a mixture composed of a plurality of materials as the synthesis of the spectra of each material, it is possible to deal with the spectrum of the mixture. At this time, either linear or non-linear synthesis method may be used for spectrum synthesis. In addition, in order to understand which single substance spectrum is synthesized, it can be reduced to a combinatorial optimization problem, and as a solution to the combinatorial optimization problem, optimization using machine learning such as a black box optimization method is used. A set of reference data with a high degree of similarity can be selected using the optimization method. Then, in order to further increase the speed, various combinatorial optimization solution methods represented by the quantum annealing method can be used.
- the present invention is (A) mainly for infrared band measurement and molecular / atomic vibration measurement, so that materials can also be identified (B). ) It can be used not only at high temperature but also near room temperature, (C) It is a simple and clear comparison method based on comparison with a database, and it does not depend on elaborate analysis methods. Have.
- the temperature of the measurement target should be as constant as possible while measuring the data of one measurement target (data of wavelength-intensity), but as described above with reference to FIG. 7, one measurement.
- the identification accuracy can be improved by changing the temperature of the target in a plurality of ways, measuring the measurement target data for each of the plurality of temperatures, and comparing the measurement target data with the reference data. In this case as well, the identification accuracy is improved by increasing the number of measurement temperature points. Although it depends on the resolution of the sensor used and other measurement conditions, in the experiment of the inventor of the present application, sufficient accuracy was obtained by measuring at a temperature of about 1 to 3 points within a temperature range of about 50 to 70 ° C. .. It should be noted that the difference from the above-mentioned Non-Patent Document 5 is clear in that the material can be identified by performing the measurement using the temperature change near the room temperature in this way, and the temperature near the room temperature can be measured. Is.
- the thermal radiation intensity is proportional to the product of Planck's radiation formula I ( ⁇ , T) and the emissivity ⁇ ( ⁇ ). Therefore, if the temperature changes, the spectrum changes.
- Planck's radiation formula I affects the shape of a wide wavelength range of the spectrum, and the emissivity ⁇ causes a fine and steep difference in spectral shape due to the difference in materials. That is, the shape of the spectrum of thermal radiation changes depending on both the material and the temperature. Therefore, by knowing the thermal radiation intensity at a plurality of wavelengths, the temperature of the measurement target can be obtained. Of course, both the material to be measured and the temperature can be obtained at the same time.
- the degree of similarity is high, but among the reference data corresponding to the same material, the reference data obtained at a temperature different from the material temperature when the measurement target data was obtained is the reference data obtained at the same temperature. Will give a lower degree of similarity compared to.
- the gentle envelope curve of thermal radiation according to Planck's radiation formula I ( ⁇ , T) changes, which is effective when making a determination using, for example, the above-mentioned RMSE.
- Planck's radiation formula I Planck's radiation formula I ( ⁇ , T)
- the result of the above-mentioned similarity measurement that is, the result of comparing the measurement target data with the reference data under the condition that the temperature at the time of measuring the measurement target data is a specific single temperature is shown in FIG. 7.
- the similarity is along the vertical axis direction (material axis direction) of the graph.
- the identification result is given that the measurement target material and temperature are the materials and temperatures associated with the reference data, respectively.
- the identification result of the material to be measured is the identification candidate, that is, the plurality of materials and temperatures associated with each of the selected reference data. A list is given.
- the measurement of the reference data and the measurement target data is not limited to this, but for example, FTIR (Fourier Transform Infrared Spectroscopy) can be used.
- FTIR Fastier Transform Infrared Spectroscopy
- multi-wavelength intensity data of incident thermal radiation is used. You can use the device that asks for.
- the wavelength range useful for identifying the material and temperature of the thermal radiation is divided into a plurality of narrow wavelength ranges, and the radiation intensity in each wavelength range is obtained.
- the larger the number of divisions in the wavelength region the better the identification accuracy.
- the small wavelength region resulting from the above division and the small wavelength region for which the radiant intensity is obtained can be selected from the wavelength region in which the absorption of gas (water vapor, carbon dioxide, etc.) in the atmosphere is small. preferable.
- the infrared sensor that can be used to detect thermal radiation is not particularly limited as long as it can be incorporated into a device that can measure the wavelength dependence of thermal radiation intensity and the spectrum, and there are no particular restrictions on the temperature of the measurement target and various other measurement environments. , Can be selected as appropriate within the range that meets the required measurement accuracy and other various requirements.
- hydrogen ions from the mercury cadmium tellurized (MCT) detector, triglycine sulfate (TGS) detector, and TGS detector There are dehydrogenated DTGS detectors and the like. In the example, the measurement was performed using the MCT detector. Measurements using a DTGS detector were also performed.
- the measurement target temperature is compared with the measurement target data (combination of wavelength and intensity) and the reference data (combination of wavelength and intensity) stored in the database. It is possible to collate only the reference data corresponding to. By doing so, it is possible to eliminate small reference data that needs to be collated in advance, so that the collation time can be shortened, especially when the number of reference data is huge, and the probability of erroneous identification is reduced.
- it is possible to measure by changing the temperature of the measurement target it is possible to identify the material with higher accuracy as already explained by measuring at multiple different temperatures and comparing this with the reference data. Become.
- the plurality of temperatures in the reference data can be the temperatures required to achieve material and / or temperature identification with the required accuracy. This temperature depends on the heat resistance of the material used and the accuracy and sensitivity of the sensor, but in the following examples, it is possible to measure with high accuracy within the range of 65 ° C to 110 ° C at 5 ° C intervals. The material could be identified.
- the temperature of the measurement target itself changes considerably depending on, for example, the thermal resistance between the measurement target and the heat conduction of the measurement target itself, and the contact state between the measurement target and the heating stage. Specifically, it is about 5 ° C. Measurement error may occur. Therefore, when high accuracy is required for identification of materials and temperatures, it is necessary to accurately know the relationship between the temperature of the heating stage and the temperature of the measurement target.
- the thermal radiation spectrum differs depending on the surface roughness and surface conditions such as the nano-micrometer scale surface structure.
- the present invention can also be applied when it is a mixture of materials.
- the identification target may be one of a plurality of candidate materials, but there is no guarantee thereof, and it may be a mixture of a plurality of materials selected from these.
- the present invention can be applied. For example, when the unknown material is a mixture of a plurality of materials A and B, it is assumed that the spectrum can be expressed by superimposing the spectra of A and B, and the measured spectrum of the unknown material has already been measured.
- this method finds a combination of spectra that can best represent the input spectrum by linear (non-linear) coupling of the spectra of the unknown material between the spectra (any number) in the constructed reference data. Can be replaced with the problem of.
- the reference data obtained from the spectra obtained by combining an arbitrary number of spectra in the reference data will also be referred to as the combined reference data.
- the combined reference data may be prepared in advance for comparison, but instead, only the data that is needed when it is needed is calculated on the spot. Can also be provided.
- the combined reference data As a result, it is possible to reduce the capacity for storing the combined reference data, which tends to be a huge amount, and the amount of calculation and the calculation time for the preparation thereof. Furthermore, by using the combined reference data, for example, it is possible to identify a material that does not exist yet or a material to be produced from the limited reference data.
- the combined reference data set Rc in which 1 to n reference data are selected from the n reference data set R and combined (note that when only one reference data is selected).
- the corresponding combined reference data is the original reference data itself).
- the number of elements in the reference data set Rc is often quite large.
- the mixing ratio of single materials that are the basis of reference data is changed in many stages, the number of elements of the combined reference data set becomes enormous. Therefore, when determining the binding reference data having the highest similarity with the measurement data of the material to be identified from the set Rc of the reference data, if the similarity determination of the round-robin formula is attempted, the number of comparisons for that purpose becomes enormous. , Often unrealistic.
- the multi-wavelength intensity data is linearly converted using the equation (1) so that the maximum value and the minimum value of each data are predetermined values (for example, 0 and 1).
- normalization does not necessarily have to use this formula. For example, when there is noise on the spike near the peak of the measured data, the maximum intensity of the data is considered to be larger than the true maximum intensity, so equation (1) is used. If normalization is performed, the strength of the data after normalization becomes excessively small, which may adversely affect the subsequent error evaluation. Other types of normalization can be performed to avoid or mitigate the effects of such noise.
- the measurement results of multiple data obtained by measuring the data multiple times are obtained, averaged, and then normalized (obtained here). Examine multiple sets of measurement results and eliminate inconvenient measurement results such as excessive noise that is clearly unnatural data (such as unnatural jumps in intensity) before averaging. (Also possible), instead of adopting the measured value of the data at a single wavelength when extracting the individual feature value from the data, the feature value is obtained from the intensity at multiple adjacent wavelengths (for example, the nominal feature value).
- the average of the three intensities measured at the wavelength and the wavelengths before and after it is taken as the intensity of the data at the nominal wavelength), and the average value of the intensity within the entire wavelength range to be measured or a part thereof (the same is true).
- the influence of noise and device drift may be removed or reduced by scaling the intensity data so that the total value / integrated value of the intensity data becomes a constant value.
- the linear conversion is performed in the equation (1), for example, by giving a large weight to a specific part (specific measurement value range, wavelength range, etc.) in the multi-wavelength intensity data, the relevant part is compared. The result may be more influential.
- the main purpose of the normalization performed here is to make the reference multi-wavelength intensity data and the multi-wavelength intensity data to be measured the same when the same material is measured at the same temperature. Where it should be, this is to deal with the fact that this is not an exact match due to various factors. That is, in order to eliminate the above-mentioned various factors, at least one of the reference multi-wave intensity data and the multi-wave intensity data to be measured is converted by some rule, and then the converted multi-wave intensity data is compared.
- the error evaluation value between the two data at the same material and the same temperature (for example, the root-mean square square error according to the equation (2)) may be set to the minimum or close to the minimum.
- the comparison of the intensity data after normalization that is, the calculation of the similarity is performed by obtaining the root mean square error between the intensity data as shown in the equation (2) in the above explanation.
- the normalization described in the explanation of the method using RMSE above may be indispensable. However, there are some cases where normalization is not always required for comparisons using machine learning. For example, the latter corresponds to the case of comparing the features reflecting the shape of the spectrum.
- the feature amount of the spectrum can be expressed as 0/1 (each spectrum can be expressed by a bit string of 0/1), and the similarity search can be executed at high speed. can.
- This method of searching for similarity can be used instead of the RMSE method to discriminate substances, temperatures, and states.
- the values of some points in the spectrum are used, but they may be extracted as some feature quantity, and the feature quantity may be a discrete value as well as a continuous value, or even a binary value. You may convert it.
- this method may be applied to the above-mentioned classification method for improving efficiency and speeding up the discrimination involving a large amount of reference data. It may also be used for classification of measurement data. That is, a rough classification prior to the final discrimination of unknown materials by RMSE is performed using this classification method, and then RMSE discrimination is performed on a small number of reference data of the classification destination to shorten the time required for discrimination. It is also possible to do. Alternatively, it can be used in parallel with the RMSE method to perform discrimination while comparing with each other or incorporating the results of both to improve the accuracy of discrimination.
- the speeding up of the spectral similarity search by the variational autoencoder can be attributed to how important points are extracted from the spectrum. For this reason, some data points are extracted for discrete wavelengths in the spectrum, but data points at important wavelengths may be extracted using a machine learning method using an autoencoder.
- the feature may be extracted by using various machine learning methods for feature extraction, not limited to the autoencoder.
- the values of some discrete data points of the spectrum are used, some features may be extracted and used instead.
- the feature amount not only a continuous value but also a discrete value or a binary value may be converted.
- a method of calculating the similarity at high speed may be used when the feature is quantified. For example, a similar search technique using a hash can be used.
- various similar search techniques for vectors having continuous values and discrete values can be used.
- thermal radiation from a reference sample for obtaining reference intensity data for a combination of a specific material and a specific case with conditions such as temperature.
- the multi-wavelength intensity data of the thermal radiation is measured only once, or even if the measurement is performed multiple times, the measurement results are averaged, for example, to obtain the material. It was assumed that the combination with the conditions would be combined into one reference data.
- the present invention is not limited to limiting the reference strength data for the combination of a specific material and a specific condition as described above.
- a set of reference data includes a plurality of different (or may be different) data obtained by measurement of the same material and under the same conditions, and the measurement result for identifying the material and / or the temperature, that is, Comparison with the measurement target data may be performed.
- Identify as the material and / or temperature of interest if the variation when measuring with the same material and under the same conditions is not extremely large, the reference data corresponding to the measurement with the same material and the same temperature are in order of similarity. It comes to the top of the arranged reference data. Therefore, if the majority vote is taken as described above, the reference data corresponding to the same as the material and / or temperature to be measured will have a high degree of similarity. As a result, the material and / or temperature identified will usually be accurate if such a majority vote is taken. Further, the influence of variation and error when obtaining individual reference data is reduced by the majority vote as described above. As a result, when preparing multiple reference data for the same material and under the same conditions, the accuracy of identification will be higher than the policy of preparing only one for each case. Can be expected.
- all the objects to be measured are solids, but from the above-mentioned principle of the present invention, the present invention naturally determines whether the object to be measured is a gas, a liquid, or a mixed object thereof.
- the present invention naturally determines whether the object to be measured is a gas, a liquid, or a mixed object thereof.
- gels that are macroscopically solid but microscopically have a structure in which liquids and solids are mixed, and mesophases that take an intermediate state between solids and liquids. In the present application, these are all considered to be solid. Therefore, it should be noted that the term "object to be measured” in the present application includes all phases and states of solids, liquids and gases, and mixtures thereof.
- gas gas and plasma also emit light when the temperature is high, which can also be called thermal radiation. The same applies to liquids.
- the temperature is usually limited to a temperature that does not irreversibly change the material to be measured, but the present invention is limited to this. is not it.
- the degree of processing in the processing process of a material or an article it is also possible to determine the degree of processing in the processing process of a material or an article.
- the spectrum of electromagnetic waves such as infrared rays emitted from the material is not only the surface temperature but also the initial spectrum. It also changes by reflecting the deterioration due to the reaction between multiple materials contained in it and other factors, and the fact that the material that was originally one was changed to another substance by decomposition due to phase separation and other factors.
- Such alteration and decomposition are affected not only by the temperature but also by the heating time, the heating profile, and the heating means (heating by radiant heat, heating by hot air, microwave heating, etc.). Furthermore, the raw material, shape and size of the heat-treated object, and variations in pretreatment also affect the progress of alteration and decomposition. The same situation occurs not only in food processing but also in determining the state of drying and curing of paint, plastic, etc. It has not been easy in the past to realize such evaluation of the progress of processing in a non-contact manner, but if this becomes possible, it will be very useful for quality control of production lines.
- the present invention due to the progress of processing such as processing or modification of the material (hereinafter, simply referred to as processing), not only the temperature but also the physical or chemical change of the material and the volatile components are affected. Utilize the fact that the composition of components and the structure of the surface change with evaporation. Specifically, the multi-wavelength data of the heat radiation is measured at each processing stage and recorded in the database as reference data, and the heat radiation from the material during heat treatment for which the processing stage should be determined is measured. By comparing with the recorded reference data, it is possible to determine how far the processing of the material or the like to be measured has progressed.
- the normality of this type of processing is identified, that is, whether the processing proceeded normally or did not proceed normally for some reason (or the product obtained after processing was processed normally. Whether it is a product or a defective product) can also be determined. In this case, by collating with the reference data of the normal work stored in the database, if it is identified as a normal work, it is identified that the work was normal, and it is identified as a normal work. If not, it is identified that the processing was abnormal.
- reference data obtained from typical defective materials (component composition, surface condition, etc.) that may be generated due to abnormal progress of processing is also stored in the database and obtained from the object during the processing process or after processing.
- the normal / abnormal processing that is, to determine whether the processing is proceeding normally (or whether the processing was finally performed normally). ..
- the measurement target is identified as the reference data of a typical defective material accumulated in the database
- useful information for estimating what kind of abnormality has occurred in the processing process can be obtained. Will be.
- no match can be made with the material in the middle of processing or the final result, or with any defective material, it is identified as "other defective material”. In this case, it is presumed that something that has not been stored in the database (in many cases, something that happens rarely or something that has never happened before) has occurred. This can be applied to the quality control of a wide variety of industrial products.
- the present invention can be applied not only to monitoring the progress of processing during processing, but also to investigating changes over time such as deterioration during use and storage of arbitrary materials and articles. More specifically, I would like to acquire it at a certain point in time (at the time of manufacture, shipment, initial state such as start of use, or any other time point) based on the above reference data, and then investigate the change over time. Obtain thermal radiation data in the same way at any time point (during regular inspections such as after long-term storage, after using for a certain period of time, when determining whether or not a used product can be reused, when an abnormality is suspected, etc.) and collate the two. Then, it is possible to inspect whether or not the change over time has occurred.
- the wavelength of the data point in the reference data and at any of the above points in time when measuring, recording, and collating data (wavelength-intensity combination) at discrete wavelength and temperature, the wavelength of the data point in the reference data and at any of the above points in time. It may be the same as or different from the wavelength of the data point in the discrete wavelength at the time of measurement.
- the wavelengths of the data points of the two data to be compared are different, the same wavelengths can be compared by performing data interpolation on the wavelength axis, for example.
- the measurement of the reference data and the measurement at an arbitrary time point may be performed at a single temperature or may be performed at a plurality of temperatures.
- the material or article for which reference data is to be acquired may or may not be the same as the material or article for which the subsequent secular variation / deterioration or the presence or absence of an abnormal state is to be investigated.
- Materials and articles with the same specifications may have heat radiation characteristics that are close to sufficient.
- all the materials and articles that may appear as targets for inspection and the like do not have to be sufficiently close to any one of the materials and articles for which reference data is to be acquired in terms of thermal radiation characteristics. .. More specifically, as already mentioned, at least a part of a set of materials or articles that may appear as targets for inspection or the like is a plurality of materials or articles for which reference data is to be acquired.
- the elements of such a mixture and the mixing ratio of these elements can be determined.
- preparations should be made when the components of the object and their ratios change continuously in the process of processing or changes over time, or when multiple types of changes may occur at the same time.
- the effect of suppressing the increase in the amount of reference data can be obtained.
- the materials and articles are not limited to this, and examples thereof include parts, foods, works of art, and exhibits.
- the present invention is not limited to this, and can be applied to a liquid or even a gas.
- Planck's radiation formula can also be applied to molecular vibrations, that is, since Planck's radiation formula changes the intensity of each radiation of a specific wavelength of gas in a circumferential manner, it was explained above. This is because the principle also applies to gases.
- the measurement target is a liquid, especially when the liquid is volatile, it should be avoided that the radiation from the vapor generated from the liquid is mixed with the radiation from the liquid itself.
- a container that quickly removes steam while flowing a carrier gas that does not absorb infrared light, such as nitrogen gas, on the surface of the liquid, and that absorbs little in the wavelength range to be measured when measuring radiation. It is possible to measure the radiation in a state where the gas does not intervene through the wall or the like, or if the absorption spectrum of the container wall or the like is known, compensate for the influence of the absorption after the same measurement.
- a carrier gas that does not absorb infrared light, such as nitrogen gas
- the information being measured is measured by utilizing the radiation intensity curve due to plank radiation when the temperature is changed and the overall change over a wide wavelength range, although it is gradual, due to radiation from plasma vibration due to thermal excitation carriers. In order to effectively utilize the above, high accuracy can be realized even if the number of wavelengths for measuring the intensity of thermal radiation is reduced. Further, for a material that changes due to heat treatment or the like, the progress of heat treatment or the like can be determined from the heat radiation data from the material.
- thermal radiation data (wavelength-intensity data) from 18 types of materials to be measured are measured from 65 ° C to 110 ° C in 5 ° C increments, and this is measured in the same temperature range for 50 types of reference materials. -Compared with the reference data obtained by measuring in temperature increments.
- an MCT detector is used as an infrared sensor for detecting these intensities.
- FIGS. 8 to 25 show graphs in which the comparison results of both data are arranged in the same format as in FIG. 7 and for the top 20 types of reference materials in descending order of similarity (Degree of Similarity). ..
- the reference material indicating the minimum RMSE may differ depending on the temperature (in other words, not all of the intersections marked with an asterisk are present in the top row of the graph in these figures). Therefore, strictly speaking, the arrangement of the reference materials in the vertical axis direction on this graph is arranged in ascending order of the average value of RMSE over the entire temperature as described in the explanation of FIG.
- the 18 types of materials to be measured are specifically graphite (Graphite), polyimide (Polyimide), aluminum anodized (Anodized_Al), ebonyte (Ebonite), mica (Mica), silicon (Silicon), and Teflon (Teflon). Teflon (registered trademark), Steel, Zirconium, Polycarbonate, Tantalum, Aluminum, Molybdenum, Acrylic, Alumina (Al 2 O 3 ), Using Nomex® 410 sheet (Nomex_410), Bakelite, and 100% cotton cloth (Cloth), the comparison results between the reference material and these measurement target materials are shown in FIGS. 8 to 25 in this order. Indicated.
- those appearing as the top 20 types of reference materials in at least one of FIGS. 8 to 25 in comparison with any of the measurement target materials are as follows: Acrylic. ), Gray colored electrodeposition-coated alumite (Anodized_G-600) (Al G600) provided by Kaimei Shindo Co., Ltd., 98% pure alumina plate (2-305-01) (Al2O3 98) supplied by AS ONE Co., Ltd. ), 96% pure Al2O3 ( Al2O3 Trio Ceramic), Aluminum, Anodized M6 Black alumite (Anodized Al), Bakelite, Cooking Sheet (Cooking Sheet) provided by Trio Ceramics Co., Ltd.
- one reference data is prepared for one material.
- reference data corresponding to each material a plurality of data obtained by measuring the material under the same conditions can be prepared.
- these plurality of reference data corresponding to the same material often differ from each other due to variations due to measurement errors and the like. Of course, it does not rule out that they happen to be the same.
- the measurement result for identifying the material and / or the temperature, that is, the comparison with the measurement target data may be performed.
- a plurality of reference data obtained by measurement from the same material by multiple measurements by the same measurement method as in the first example are prepared.
- each of the reference data referred to here is a set of data obtained by measuring between 65 ° C. and 110 ° C. by changing the temperature every 5 ° C.
- reference data from the same material dominated the top 10 for any combination of material and temperature. If the same material is measured multiple times (10 times in this embodiment) and the measured values of the reference data vary widely, it is possible that these 10 reference data do not monopolize the upper part of the root mean square error. .. However, even in such a case, the probability that the comparison result with the reference data from the same material is ranked high is usually higher than the comparison result with the reference data from other materials. Therefore, for example, it is possible to identify the material to be measured by taking a majority vote for the material to which the reference data in the upper side of the comparison result corresponds.
- the present invention can be used in a very wide range of fields because its material and temperature can be identified by using heat radiation from an object.
- an environment recognition sensor road surface condition sensor
- Sensors for pedestrians, animals and other things, etc. Sensors for pedestrians, animals and other things, etc.
- the object since the object may be a gas phase, it can be applied to, for example, a gas sensor of a humidity sensor or a carbon dioxide sensor, an exhaust gas test from an automobile engine or various other combustion engines, and a poisonous gas detection.
- it is also effective as a method of monitoring changes in the environment such as changes in the distribution of component gases and their temperatures by measuring radiation from gases such as offices.
Landscapes
- Physics & Mathematics (AREA)
- Health & Medical Sciences (AREA)
- General Physics & Mathematics (AREA)
- Immunology (AREA)
- Chemical & Material Sciences (AREA)
- Analytical Chemistry (AREA)
- Biochemistry (AREA)
- General Health & Medical Sciences (AREA)
- Spectroscopy & Molecular Physics (AREA)
- Life Sciences & Earth Sciences (AREA)
- Pathology (AREA)
- Nuclear Medicine, Radiotherapy & Molecular Imaging (AREA)
- Engineering & Computer Science (AREA)
- Mathematical Physics (AREA)
- Theoretical Computer Science (AREA)
- Radiation Pyrometers (AREA)
- Investigating, Analyzing Materials By Fluorescence Or Luminescence (AREA)
Abstract
Description
L(λ1,T)=ε(λ1)B(λ1,T)
L(λ2,T)=ε(λ2)B(λ2,T)
と置くことができる。上の両式を辺々除算することにより、
L1/L2=L(λ1,T)/L(λ2,T)
=[ε(λ1)/ε(λ2)]・[B(λ1,T)/B(λ2,T)]
を得る。ここで、近接する2つの波長λ1、λ2において放射率の値がほぼ一定、すなわちε(λ1)/ε(λ2)≒1であれば、上式中から放射率ε(λ)を消去して
L1/L2≒B(λ1,T)/B(λ2,T)
とすることができる。ここで、波長λ1、λ2における熱輻射強度L1、L2は測定可能であり、また上式右辺のプランクの放射公式の関数は既知であることから、近接した波長λ1、λ2において測定されたそれぞれの熱輻射強度L1、L2の比の値から測定対象試料(図1に示す例ではエポキシ)の温度Tを求めることができる。
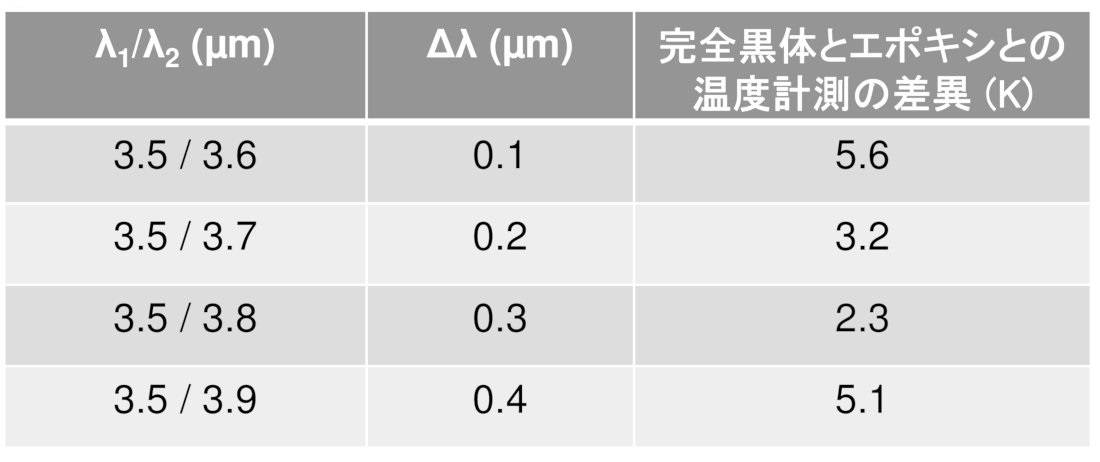
ここで、前記類似度の比較は少なくとも前記結合された参照データのすべてについて行ってよい。
また、前記類似度の比較及び前記同定に組み合わせ最適化問題の解法を適用してよい。
また、前記類似度を求めるにあたって、前記類似度を求めるために使用すべき点または特徴量を前記参照データと前記結合された参照データの少なくとも一方から抽出すること及び前記参照データと前記結合された参照データの少なくとも一方を複数の類に分けて前記複数の類の一部を前記類似度の比較に供することからなる群から選択された処理を行ってよい。
また、前記測定対象は固体、液体、気体またはこれらの混合物であってよい。
また、前記参照データは複数の離散的な波長で測定された強度データであってよい。
また、前記複数波長は少なくとも3つの波長であってよい。
また、前記類似度は、複数の波長における前記強度データと前記参照データとの強度の差に基づいて定められてよい。
また、前記参照データは前記測定対象の材料の同定のための候補となる複数の温度と複数の異なる材料毎の赤外帯域内の複数波長における熱輻射強度データとの組み合わせであってよい。
また、前記類似度はそれぞれの温度について複数の波長における前記強度データと前記参照データとの強度の差に基づいて定められてよい。
また、前記強度データ及び前記参照データを夫々正規化したのちに前記類似度を求めてよい。
また、光学系を用いて前記測定対象以外からの熱輻射を除去してよい。
また、前記光学系は放物面鏡などの曲面鏡、平面鏡、赤外線透過材料を用いたレンズまたは虹彩、あるいはそれらの組み合わせであってよい。
また、前記類似度は、前記強度データと前記参照データとの二乗平均平方根誤差に基づいて定められてよい。
ここで、前記類似度の比較は少なくとも前記結合された参照データのすべてについて行ってよい。
また、前記類似度の比較及び前記同定に組み合わせ最適化問題の解法を適用してよい。
また、前記類似度を求めるにあたって、前記類似度を求めるために使用すべき点または特徴量を前記参照データと前記結合された参照データの少なくとも一方から抽出すること及び前記参照データと前記結合された参照データの少なくとも一方を複数の類に分けて前記複数の類の一部を前記類似度の比較に供することからなる群から選択された処理を行ってよい。
また、前記測定対象は固体、液体、気体またはこれらの混合物であってよい。
また、前記参照データは複数の離散的な波長で測定された強度データであってよい。
また、前記複数波長は少なくとも3つの波長であってよい。
また、前記類似度はそれぞれの温度について複数の波長における前記強度データと前記参照データとの強度の差に基づいて定められてよい。
また、前記強度データ及び前記参照データを夫々正規化したのちに前記類似度を求めてよい。
また、光学系を用いて前記測定対象以外からの熱輻射を除去してよい。
また、前記光学系は曲面鏡、平面鏡、赤外線透過材料を用いたレンズまたは虹彩、あるいはそれらの組み合わせであってよい。
また、前記類似度は、前記強度データと前記参照データとの二乗平均平方根誤差に基づいて定められてよい。
ここで、前記類似度の比較は少なくとも前記結合された参照データのすべてについて行ってよい。
また、前記類似度の比較及び前記同定に組み合わせ最適化問題の解法を適用してよい。
また、前記類似度を求めるにあたって、前記類似度を求めるために使用すべき点または特徴量を前記参照データと前記結合された参照データの少なくとも一方から抽出すること及び前記参照データと前記結合された参照データの少なくとも一方を複数の類に分けて前記複数の類の一部を前記類似度の比較に供することからなる群から選択された処理を行ってよい。
また、前記複数波長は少なくとも3つの波長であってよい。
また、前記参照データは更に前記材料の熱処理過程の異常進行によって生成される可能性のある不良材料自身から放射される赤外帯域内の複数波長における熱輻射強度の組み合わせを含んでよい。
また、前記強度データ及び前記参照データを夫々正規化したのちに前記類似度を求めてよい。
また、前記類似度は、複数の波長における前記強度データと前記参照データとの強度の差に基づいて定められてよい。
また、前記類似度は、前記強度データと前記参照データとの二乗平均平方根誤差に基づいて定められてよい。
ここで、前記類似度の比較は少なくとも前記結合された参照データのすべてについて行ってよい。
また、前記類似度の比較及び前記同定に組み合わせ最適化問題の解法を適用してよい。
また、前記類似度を求めるにあたって、前記類似度を求めるために使用すべき点または特徴量を前記参照データと前記結合された参照データの少なくとも一方から抽出すること及び前記参照データと前記結合された参照データの少なくとも一方を複数の類に分けて前記複数の類の一部を前記類似度の比較に供することからなる群から選択された処理を行ってよい。
また、前記参照データは複数の温度において複数の離散的な波長で測定された強度データであってよい。
また、前記測定対象に対応する強度データ及び前記参照データを夫々正規化したのちに前記類似度を求めてよい。
また、前記類似度は、複数の波長における前記測定対象に対応する強度データと前記参照データとの強度の差に基づいて定められてよい。
また、光学系を用いて前記測定対象以外からの熱輻射を除去してよい。
また、前記光学系は曲面鏡、平面鏡、赤外線透過材料を用いたレンズまたは虹彩、あるいはそれらの組み合わせであってよい。
また、前記類似度は、前記測定対象に対応する強度データと前記参照データとの二乗平均平方根誤差に基づいて定められてよい。
また、前記変化は経時変化であってよい。
また、前記参照データは前記基準材料が正常でない状態に変化した際の前記強度データを更に含んでよい。
また、前記測定対象である材料は前記基準材料と同一の個体であってよい。
また、前記測定対象である材料は前記基準材料と別の個体であってよい。



Claims (49)
- 測定対象自身から放射される赤外帯域内の3波長またはそれより多くの波長における熱輻射強度の組み合わせである強度データと、前記測定対象の材料の同定のための候補となる複数の異なる材料のそれぞれからの赤外帯域内の複数波長における熱輻射強度データの組み合わせである参照データと複数の前記異なる材料に基づく複数の前記参照データ同士を結合することにより得られる前記複数の前記異なる材料の混合物についての結合された参照データとの少なくとも一方との類似度を比較し、
前記測定対象の材料が、前記類似度が最も高い一つまたは複数の前記参照データもしくは前記結合された参照データに対応する前記候補となる材料またはそれらの混合物であると同定する、
測定対象自体を熱輻射光源として測定し、非接触で材料を同定する方法。 - 前記類似度の比較は少なくとも前記結合された参照データのすべてについて行う、請求項1に記載の非接触で材料を同定する方法。
- 前記類似度の比較及び前記同定に組み合わせ最適化問題の解法を適用する、請求項1に記載の非接触で材料を同定する方法。
- 前記類似度を求めるにあたって、前記類似度を求めるために使用すべき点または特徴量を前記参照データと前記結合された参照データの少なくとも一方から抽出すること及び前記参照データと前記結合された参照データの少なくとも一方を複数の類に分けて前記複数の類の一部を前記類似度の比較に供することからなる群から選択された処理を行う、請求項1から3の何れかに記載の非接触で材料を同定する方法。
- 前記測定対象は固体、液体、気体またはこれらの混合物である、請求項1から4の何れかに記載の非接触で材料を同定する方法。
- 前記参照データは複数の離散的な波長で測定された強度データである、請求項1から5の何れかに記載の非接触で材料を同定する方法。
- 前記複数波長は少なくとも3つの波長である、請求項6に記載の非接触で材料を同定する方法。
- 前記類似度は、複数の波長における前記強度データと前記参照データとの強度の差に基づいて定められる、請求項1から7の何れかに記載の非接触で材料を同定する方法。
- 前記参照データは前記測定対象の材料の同定のための候補となる複数の温度と複数の異なる材料毎の赤外帯域内の複数波長における熱輻射強度データとの組み合わせである、請求項1から8の何れかに記載の非接触で材料を同定する方法。
- 前記類似度はそれぞれの温度について複数の波長における前記強度データと前記参照データとの強度の差に基づいて定められる、請求項9に記載の非接触で材料を同定する方法。
- 前記強度データ及び前記参照データを夫々正規化したのちに前記類似度を求める、請求項1から10の何れかに記載の非接触で材料を同定する方法。
- 光学系を用いて前記測定対象以外からの熱輻射を除去する、請求項1から11の何れかに記載の非接触で材料を同定する方法。
- 前記光学系は曲面鏡、平面鏡、赤外線透過材料を用いたレンズまたは虹彩、あるいはそれらの組み合わせである、請求項12に記載の非接触で材料を同定する方法。
- 前記類似度は、前記強度データと前記参照データとの二乗平均平方根誤差に基づいて定められる、請求項1から13の何れかに記載の非接触で材料を同定する方法。
- 測定対象自身から放射される赤外帯域内の3波長またはそれより多くの波長における熱輻射強度の組み合わせである強度データと、前記測定対象の材料の同定のための候補となる複数の異なる材料のそれぞれからの複数の既知の温度毎の赤外帯域内の複数波長における熱輻射強度データの組み合わせである参照データと複数の前記異なる材料に基づく複数の前記参照データ同士を結合することにより得られる前記複数の前記異なる材料の混合物についての結合された参照データとの少なくとも一方との類似度を比較し、
前記測定対象の材料及びまたは温度が、前記類似度が最も高い一つまたは複数の前記参照データもしくは前記結合された参照データに対応する材料もしくは材料の混合物及びまたは温度であると同定する、測定対象自体を熱輻射光源として測定し、非接触で材料と温度との少なくとも一方を同定する方法。 - 前記類似度の比較は少なくとも前記結合された参照データのすべてについて行う、請求項15に記載の非接触で材料と温度との少なくとも一方を同定する方法。
- 前記類似度の比較及び前記同定に組み合わせ最適化問題の解法を適用する、請求項15に記載の非接触で材料と温度との少なくとも一方を同定する方法。
- 前記類似度を求めるにあたって、前記類似度を求めるために使用すべき点または特徴量を前記参照データと前記結合された参照データの少なくとも一方から抽出すること及び前記参照データと前記結合された参照データの少なくとも一方を複数の類に分けて前記複数の類の一部を前記類似度の比較に供することからなる群から選択された処理を行う、請求項15または16に記載の非接触で材料と温度との少なくとも一方を同定する方法。
- 前記測定対象は固体、液体、気体またはこれらの混合物である、請求項15から18の何れかに記載の非接触で材料と温度との少なくとも一方を同定する方法。
- 前記参照データは複数の離散的な波長で測定された強度データである、請求項15から19の何れかに記載の非接触で材料と温度との少なくとも一方を同定する方法。
- 前記複数波長は少なくとも3つの波長である、請求項20に記載の非接触で材料と温度との少なくとも一方を同定する方法。
- 前記類似度はそれぞれの温度について複数の波長における前記強度データと前記参照データとの強度の差に基づいて定められる、請求項15から21の何れかに記載の非接触で材料と温度との少なくとも一方を同定する方法。
- 前記強度データ及び前記参照データを夫々正規化したのちに前記類似度を求める、請求項15から22の何れかに記載の非接触で材料と温度との少なくとも一方を同定する方法。
- 光学系を用いて前記測定対象以外からの熱輻射を除去する、請求項15から23の何れかに記載の非接触で材料を同定する方法。
- 前記光学系は曲面鏡、平面鏡、赤外線透過材料を用いたレンズまたは虹彩、あるいはそれらの組み合わせである、請求項24に記載の非接触で材料と温度との少なくとも一方を同定する方法。
- 前記類似度は、前記強度データと前記参照データとの二乗平均平方根誤差に基づいて定められる、請求項15から25の何れかに記載の非接触で材料と温度との少なくとも一方を同定する方法。
- 材料の熱処理過程中の加工の所定の段階毎に、前記材料自身から放射される赤外帯域内の複数波長における熱輻射強度の組み合わせである強度データと、前記材料と同種の複数の異なる材料を熱処理する過程中の加工の所定の段階毎に得られる、前記同種の材料自身から放射される赤外帯域内の複数波長における熱輻射強度の組み合わせである参照データと複数の前記異なる材料に基づく複数の前記参照データ同士を結合することにより得られる前記複数の前記異なる材料の混合物についての結合された参照データとの少なくとも一方との類似度を比較し、
前記類似度の最も高い一つまたは複数の前記参照データもしくは前記結合された参照データを同定する、
熱処理による加工中の生成物、あるいは前記加工の状態、進行度または正常性を同定する方法。 - 前記類似度の比較は少なくとも前記結合された参照データのすべてについて行う、請求項27に記載の熱処理による加工中の生成物、あるいは前記加工の状態、進行度または正常性を同定する方法。
- 前記類似度の比較及び前記同定に組み合わせ最適化問題の解法を適用する、請求項27に記載の熱処理による加工中の生成物、あるいは前記加工の状態、進行度または正常性を同定する方法。
- 前記類似度を求めるにあたって、前記類似度を求めるために使用すべき点または特徴量を前記参照データと前記結合された参照データの少なくとも一方から抽出すること及び前記参照データと前記結合された参照データの少なくとも一方を複数の類に分けて前記複数の類の一部を前記類似度の比較に供することからなる群から選択された処理を行う、請求項27から29の何れかに記載の熱処理による加工中の生成物、あるいは前記加工の状態、進行度または正常性を同定する方法。
- 前記複数波長は少なくとも3つの波長である、請求項27から30の何れかに記載の熱処理による加工中の生成物、あるいは前記加工の状態、進行度または正常性を同定する方法。
- 前記参照データは更に前記材料の熱処理過程の異常進行によって生成される可能性のある不良材料自身から放射される赤外帯域内の複数波長における熱輻射強度の組み合わせを含む、請求項27から31の何れかに記載の熱処理による加工中の生成物、あるいは前記加工の状態、進行度または正常性を同定する方法。
- 前記強度データ及び前記参照データを夫々正規化したのちに前記類似度を求める、請求項27から32の何れかに記載の熱処理による加工中の生成物、あるいは前記加工の状態、進行度または正常性を同定する方法。
- 前記類似度は、複数の波長における前記強度データと前記参照データとの強度の差に基づいて定められる、請求項27から33の何れかに記載の熱処理による加工中の生成物、あるいは前記加工の状態、進行度または正常性を同定する方法。
- 前記類似度は、前記強度データと前記参照データとの二乗平均平方根誤差に基づいて定められる、請求項34に記載の熱処理による加工中の生成物、あるいは前記加工の状態、進行度または正常性を同定する方法。
- 測定対象である材料自身から放射される赤外帯域内の複数波長における熱輻射強度の組み合わせである強度データと、前記測定対象である材料と同種の複数の異なる材料である基準材料自身から放射される赤外帯域内の複数波長における熱輻射強度の組み合わせである参照データと複数の前記異なる材料に基づく複数の前記参照データ同士を結合することにより得られる前記複数の前記異なる材料の混合物についての結合された参照データとの少なくとも一方との類似度を比較し、
前記類似度の最も高い一つまたは複数の前記参照データもしくは前記結合された参照データを同定することにより
前記測定対象材料の前記基準材料からの変化である材料変化を検出する方法。 - 前記類似度の比較は少なくとも前記結合された参照データのすべてについて行う、請求項36に記載の材料変化を検出する方法。
- 前記類似度の比較及び前記同定に組み合わせ最適化問題の解法を適用する、請求項36に記載の材料変化を検出する方法。
- 前記類似度を求めるにあたって、前記類似度を求めるために使用すべき点または特徴量を前記参照データと前記結合された参照データの少なくとも一方から抽出すること及び前記参照データと前記結合された参照データの少なくとも一方を複数の類に分けて前記複数の類の一部を前記類似度の比較に供することからなる群から選択された処理を行う、請求項36から38の何れかに記載の材料変化を検出する方法。
- 前記参照データは複数の温度において複数の離散的な波長で測定された強度データである、請求項36から39の何れかに記載の材料変化を検出する方法。
- 前記測定対象に対応する強度データ及び前記参照データを夫々正規化したのちに前記類似度を求める、請求項36から40の何れかに記載の材料変化を検出する方法。
- 前記類似度は、複数の波長における前記測定対象に対応する強度データと前記参照データとの強度の差に基づいて定められる、請求項36から41の何れかに記載の材料変化を検出する方法。
- 光学系を用いて前記測定対象以外からの熱輻射を除去する、請求項36から42の何れかに記載の材料変化を検出する方法。
- 前記光学系は曲面鏡、平面鏡、赤外線透過材料を用いたレンズまたは虹彩、あるいはそれらの組み合わせである、請求項43に記載の材料変化を検出する方法。
- 前記類似度は、前記測定対象に対応する強度データと前記参照データとの二乗平均平方根誤差に基づいて定められる、請求項36から44の何れかに記載の材料変化を検出する方法。
- 前記変化は経時変化である、請求項36から45の何れかに記載の材料変化を検出する方法。
- 前記参照データは前記基準材料が正常でない状態に変化した際の前記強度データを更に含む、請求項36から46の何れかに記載の材料変化を検出する方法。
- 前記測定対象である材料は前記基準材料と同一の個体である、請求項36から47の何れかに記載の材料変化を検出する方法。
- 前記測定対象である材料は前記基準材料と別の個体である、請求項36から47の何れかに記載の材料変化を検出する方法。
Priority Applications (2)
| Application Number | Priority Date | Filing Date | Title |
|---|---|---|---|
| JP2022550537A JP7460202B2 (ja) | 2020-09-16 | 2021-09-13 | 非接触材料同定方法、非接触温度同定方法、及び熱処理加工進行度同定方法 |
| US18/026,190 US12345648B2 (en) | 2020-09-16 | 2021-09-13 | Method of non-contact material identification, method of non-contact temperature identification, and method for identifying progress of heat treatment processing |
Applications Claiming Priority (2)
| Application Number | Priority Date | Filing Date | Title |
|---|---|---|---|
| JP2020155085 | 2020-09-16 | ||
| JP2020-155085 | 2020-09-16 |
Publications (1)
| Publication Number | Publication Date |
|---|---|
| WO2022059629A1 true WO2022059629A1 (ja) | 2022-03-24 |
Family
ID=80776644
Family Applications (1)
| Application Number | Title | Priority Date | Filing Date |
|---|---|---|---|
| PCT/JP2021/033443 Ceased WO2022059629A1 (ja) | 2020-09-16 | 2021-09-13 | 非接触材料同定方法、非接触温度同定方法、及び熱処理加工進行度同定方法 |
Country Status (3)
| Country | Link |
|---|---|
| US (1) | US12345648B2 (ja) |
| JP (1) | JP7460202B2 (ja) |
| WO (1) | WO2022059629A1 (ja) |
Families Citing this family (3)
| Publication number | Priority date | Publication date | Assignee | Title |
|---|---|---|---|---|
| CN117169273B (zh) * | 2023-09-07 | 2024-04-26 | 华南理工大学 | 一种基于反射法测量材料常温方向发射率的装置及方法 |
| CN117960621A (zh) * | 2023-12-26 | 2024-05-03 | 国核维科锆铪有限公司 | 一种海绵锆光学分拣方法及系统 |
| CN118443156B (zh) * | 2024-07-08 | 2024-10-18 | 深圳查尔孟科技有限公司 | 一种精确测温控制系统及方法 |
Citations (4)
| Publication number | Priority date | Publication date | Assignee | Title |
|---|---|---|---|---|
| JPS60169742A (ja) * | 1984-02-13 | 1985-09-03 | Shinkawa Ltd | ダイボンド接着状態の検査装置 |
| JP2003010989A (ja) * | 2001-06-29 | 2003-01-15 | Hamamatsu Photonics Kk | レーザ照射領域監視装置、レーザ照射領域監視方法、レーザ加工装置及びレーザ加工方法 |
| JP2003521687A (ja) * | 2000-01-27 | 2003-07-15 | ピーイー コーポレイション (エヌワイ) | スペクトル較正を行うための方法および装置 |
| JP2019220337A (ja) * | 2018-06-20 | 2019-12-26 | 日立グローバルライフソリューションズ株式会社 | 誘導加熱調理器 |
Family Cites Families (3)
| Publication number | Priority date | Publication date | Assignee | Title |
|---|---|---|---|---|
| US4561786A (en) | 1984-03-15 | 1985-12-31 | Williamson Corporation | Temperature measuring apparatus |
| US9297749B2 (en) * | 2012-03-27 | 2016-03-29 | Innovative Science Tools, Inc. | Optical analyzer for identification of materials using transmission spectroscopy |
| US8829437B2 (en) | 2012-07-04 | 2014-09-09 | Apple Inc. | Method for quantifying amorphous content in bulk metallic glass parts using thermal emissivity |
-
2021
- 2021-09-13 WO PCT/JP2021/033443 patent/WO2022059629A1/ja not_active Ceased
- 2021-09-13 JP JP2022550537A patent/JP7460202B2/ja active Active
- 2021-09-13 US US18/026,190 patent/US12345648B2/en active Active
Patent Citations (4)
| Publication number | Priority date | Publication date | Assignee | Title |
|---|---|---|---|---|
| JPS60169742A (ja) * | 1984-02-13 | 1985-09-03 | Shinkawa Ltd | ダイボンド接着状態の検査装置 |
| JP2003521687A (ja) * | 2000-01-27 | 2003-07-15 | ピーイー コーポレイション (エヌワイ) | スペクトル較正を行うための方法および装置 |
| JP2003010989A (ja) * | 2001-06-29 | 2003-01-15 | Hamamatsu Photonics Kk | レーザ照射領域監視装置、レーザ照射領域監視方法、レーザ加工装置及びレーザ加工方法 |
| JP2019220337A (ja) * | 2018-06-20 | 2019-12-26 | 日立グローバルライフソリューションズ株式会社 | 誘導加熱調理器 |
Also Published As
| Publication number | Publication date |
|---|---|
| JPWO2022059629A1 (ja) | 2022-03-24 |
| US20230333023A1 (en) | 2023-10-19 |
| JP7460202B2 (ja) | 2024-04-02 |
| US12345648B2 (en) | 2025-07-01 |
Similar Documents
| Publication | Publication Date | Title |
|---|---|---|
| JP7460202B2 (ja) | 非接触材料同定方法、非接触温度同定方法、及び熱処理加工進行度同定方法 | |
| Xiao et al. | Precision measurements of temperature‐dependent and nonequilibrium thermal emitters | |
| Ng et al. | Use of a multiwavelength pyrometer in several elevated temperature aerospace applications | |
| Yang et al. | Fast determination of oxide content in cement raw meal using NIR spectroscopy with the SPXY algorithm | |
| Wang et al. | Measurement technology for material emissivity under high temperature dynamic heating conditions | |
| Watanabe et al. | Spectral emissivity measurements | |
| Hatzl et al. | Direct measurements of infrared normal spectral emissivity of solid materials for high-temperature applications | |
| González-Fernández et al. | Analysis of calibration methods for direct emissivity measurements | |
| CN118641484A (zh) | 一种基于实时温度测量的热去除装置及方法 | |
| CN116086617B (zh) | 一种基于优化思想的多光谱温度测量方法 | |
| JPWO2022059629A5 (ja) | ||
| Jaworske et al. | Portable infrared reflectometer for evaluating emittance | |
| Costa et al. | Performance evaluation of colour codes on thermal image analysis–application in the wood damage detection | |
| El Bakali et al. | A fast and versatile method for spectral emissivity measurement at high temperatures | |
| Dai et al. | Peak-wavelength method for temperature measurement | |
| CN118624538A (zh) | 一种深空原位光谱探测方法 | |
| Wangmaneerat et al. | Determination of temperature and composition of phosphosilicate glass thin films from infrared emission spectral data | |
| Chen et al. | Converting the infrared thermal image into temperature field for detection the defects inside materials | |
| Bauer et al. | Emissivities of ceramics for temperature measurements | |
| Lucas | Numerical optimization of the radial dependence of effective emissivity in blackbody cylindrical cavities | |
| Hu et al. | Emissivity measurement with the dual-temperature method | |
| Hain et al. | The use of infrared radiation in measurement and non-destructive testing | |
| Cone et al. | Temperature emissivity separation using optimized atmospheric water band regions | |
| Kayikci et al. | Infrared emissivity measurement approach for solid and opaque materials | |
| Chen et al. | An in situ online methodology for emissivity measurement between 100 C and 500 C utilizing infrared sensor |
Legal Events
| Date | Code | Title | Description |
|---|---|---|---|
| 121 | Ep: the epo has been informed by wipo that ep was designated in this application |
Ref document number: 21869316 Country of ref document: EP Kind code of ref document: A1 |
|
| ENP | Entry into the national phase |
Ref document number: 2022550537 Country of ref document: JP Kind code of ref document: A |
|
| NENP | Non-entry into the national phase |
Ref country code: DE |
|
| 122 | Ep: pct application non-entry in european phase |
Ref document number: 21869316 Country of ref document: EP Kind code of ref document: A1 |
|
| WWG | Wipo information: grant in national office |
Ref document number: 18026190 Country of ref document: US |