WO2022024263A1 - 評価装置及び評価システム - Google Patents
評価装置及び評価システム Download PDFInfo
- Publication number
- WO2022024263A1 WO2022024263A1 PCT/JP2020/029064 JP2020029064W WO2022024263A1 WO 2022024263 A1 WO2022024263 A1 WO 2022024263A1 JP 2020029064 W JP2020029064 W JP 2020029064W WO 2022024263 A1 WO2022024263 A1 WO 2022024263A1
- Authority
- WO
- WIPO (PCT)
- Prior art keywords
- evaluation
- value
- plant
- unit
- facility
- Prior art date
- Legal status (The legal status is an assumption and is not a legal conclusion. Google has not performed a legal analysis and makes no representation as to the accuracy of the status listed.)
- Ceased
Links
Images



Classifications
-
- G—PHYSICS
- G05—CONTROLLING; REGULATING
- G05B—CONTROL OR REGULATING SYSTEMS IN GENERAL; FUNCTIONAL ELEMENTS OF SUCH SYSTEMS; MONITORING OR TESTING ARRANGEMENTS FOR SUCH SYSTEMS OR ELEMENTS
- G05B23/00—Testing or monitoring of control systems or parts thereof
- G05B23/02—Electric testing or monitoring
Definitions
- the present invention relates to an evaluation device and an evaluation system.
- a method is known that can grasp the operating status of a device based on the output of a sensor provided in the device (for example, Patent Document 1).
- An object of the present invention is to provide an evaluation device and an evaluation system that make it easier to grasp the overall stability of a plant.
- the evaluation device of the present invention is based on an acquisition unit that acquires information on the operating status of a plurality of facilities included in the plant and a sensing value included in the information.
- the process of calculating the evaluation value indicating the soundness of the facility is performed for each of the plurality of facilities, and the comprehensive evaluation value indicating the stability of the operating condition of the plant is calculated based on the evaluation value of each of the plurality of facilities. It has an evaluation unit.
- the evaluation unit performs the comprehensive evaluation showing stability lower than the stability shown by the evaluation value of a single facility when there are a plurality of facilities whose evaluation values do not show normal operation of the facilities. Calculate the value.
- the evaluation unit calculates the comprehensive evaluation value as the Lp norm of the evaluation values of the plurality of facilities.
- the acquisition unit acquires the information from a plurality of sensors individually provided in a plurality of facilities included in the plant.
- the senor detects at least one of the temperature, humidity, pressure, vibration, capacity, flow rate, operating speed, and opening / closing state of the opening / closing part of the provided facility.
- a part or all of the plurality of sensors and the acquisition unit are connected via wireless communication.
- the evaluation value is the operating status of the facility derived from the range from the most stable state including the normal operation of the facility to the most alarming state including the abnormal operation of the facility as a percentage. It is a value shown.
- a notification unit for performing notification related to evaluation of the operating status of the plant is provided.
- the notification unit includes a display unit that displays information related to the evaluation of the operating status of the plant.
- a plurality of sensors individually provided in a plurality of facilities included in the plant an evaluation device for evaluating the operating status of the plant based on the outputs of the plurality of sensors, and an operation of the plant. It is an evaluation system including a terminal provided with a notification unit for notifying the situation, and the evaluation device is the above-mentioned evaluation device.
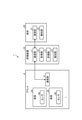
- FIG. 1 is a diagram showing a main configuration example of an evaluation system according to an embodiment.
- FIG. 2 is a block diagram showing a configuration example of the evaluation device.
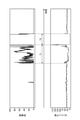
- FIG. 3 is a graph showing an example of the relationship between the sensing value and the evaluation value indicated by the output of the sensor.
- FIG. 4 is a graph showing an example of the relationship between the time-series change of the sensing value and the time-series change of the evaluation value.
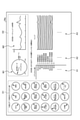
- FIG. 5 is a diagram showing an example of notification related to evaluation of the operating status of the plant.
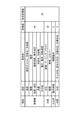
- FIG. 6 is a diagram showing an example of the correspondence between the type of facility, the item sensed by the sensor according to the type of facility, and the specific example of the item sensed by the sensor according to the type of facility.
- FIG. 7 is a graph schematically showing an example of calculating the comprehensive evaluation value of the plant based on the evaluation values of the two facilities 3.
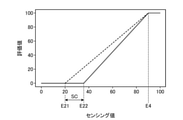
- FIG. 8 is a graph showing an example of changing the upper limit of dispersion according to the season.
- FIG. 1 is a diagram showing a main configuration example of the evaluation system 1 according to the embodiment.
- the evaluation system 1 is a system for evaluating the operating status of the plant.
- the evaluation system 1 includes a plurality of sensors 4a, 4b, ... Provided in the plant 2, an evaluation device 10, and a terminal 20.
- the plant 2 includes a plurality of facilities 3a, 3b, ..., a plurality of sensors 4a, 4b, ..., And a communication unit 5.
- Facilities 3a, 3b, ... Are facilities provided for the effect of plant 2 as a whole.
- the facilities 3a, 3b, ... are facilities provided by the hydroelectric power plant such as a generator, a water turbine, and so on.
- the specific form of the facilities 3a, 3b, ... According to the purpose of the plant 2.
- the plurality of sensors 4a, 4b, ... Are sensors individually provided in the plurality of facilities 3a, 3b, ....
- the specific modes of the sensors 4a, 4b, ... And the items to be detected correspond to the specific modes of the facilities 3a, 3b, ....
- the number of the plurality of facilities 3a, 3b, ... And the number of the plurality of sensors 4a, 4b, ... may be 3 or more.
- one sensor 4 is provided in one facility 3, but a plurality of sensors 4 may be provided in one facility 3, and one item common to the plurality of facilities 3 is one.
- the sensor 4 may be provided so as to be detectable by the sensor 4.
- Items common to the plurality of facilities 3 include, for example, the weather, temperature, humidity, and the like in the area where the plant 2 is located.
- facility 3 When comprehensively explaining facilities 3a, 3b, ... Without particular distinction, it may be described as facility 3. Further, when the sensors 4a, 4b, ... Are described comprehensively without any particular distinction, they may be described as the sensor 4. Of the configurations of the plant 2, the configurations included in the evaluation system 1 according to the embodiment are the sensor 4 and the communication unit 5. The facility 3 is illustrated as a configuration in which the sensor 4 is provided.
- the communication unit 5 transmits the outputs of the plurality of sensors 4a, 4b, ... To the evaluation device 10.
- the communication unit 5 according to the embodiment has a circuit or the like for functioning as a NIC (Network interface controller) corresponding to a predetermined communication protocol. Examples of the communication protocol include TCP / IP (Transmission Control Protocol / Internet Protocol), but the communication protocol is not limited to this and can be changed as appropriate.
- the communication unit 5 transmits data corresponding to the outputs of the plurality of sensors 4a, 4b, ... To the evaluation device 10 via communication with the evaluation device 10.
- FIG. 1 Although one communication unit 5 is shown in FIG. 1, a configuration for communication that functions in the same manner as the communication unit 5 individually for a part or all of the plurality of sensors 4a, 4b, ... Is shown. It may be provided. Further, although not shown, when the output of the sensor 4 is analog, an analog / digital conversion circuit for transmitting data corresponding to the output of the sensor 4 is provided via digital communication by the communication unit 5.
- the evaluation device 10 includes a communication unit 11, an acquisition unit 12, an evaluation unit 13, and a notification unit 14.
- the communication unit 11 has a circuit or the like for functioning as a NIC corresponding to the communication protocol of the communication unit 5.
- the communication unit 11 communicates with the communication unit 5 and receives data corresponding to the outputs of the plurality of sensors 4a, 4b, ....
- the communication line between the communication unit 5 and the communication unit 11 is a wireless communication line using an electromagnetic wave such as a radio wave.
- the plurality of sensors 4a, 4b, ... And the acquisition unit 12 are connected via wireless communication by the communication unit 5 and the communication unit 11.
- the acquisition unit 12 acquires information related to the operating status of a plurality of facilities 3a, 3b, ... Included in the plant 2. Specifically, the acquisition unit 12 acquires the data received by the communication unit 11 so that the plurality of sensors 4a, 4b, ... Get the information obtained from.
- the evaluation unit 13 evaluates the operating status of the plant 2 based on the information acquired by the acquisition unit 12.
- the notification unit 14 notifies the evaluation of the operating status of the plant 2 evaluated by the evaluation unit 13.
- the evaluation device 10 is an information processing device provided to function as a communication unit 11, an acquisition unit 12, an evaluation unit 13, and a notification unit 14.
- a communication unit 11 An information processing device provided to function as a communication unit 11, an acquisition unit 12, an evaluation unit 13, and a notification unit 14.
- a configuration example of the information processing apparatus will be described with reference to FIG.
- FIG. 2 is a block diagram showing a configuration example of the evaluation device 10.
- the evaluation device 10 includes a communication unit 11, a storage unit 31, a calculation unit 32, an input unit 33, and an output unit 34.
- the storage unit 31 stores software programs and data read out by various processes performed by the evaluation device 10.
- program, etc.” it refers to the relevant software program and data.
- the storage unit 31 includes a storage device such as a hard disk drive (HDD: Hard Disk Drive), a solid state drive (SSD: Solid State Drive), or a flash memory, and stores the data in the storage device. do.
- HDD Hard Disk Drive
- SSD Solid State Drive
- flash memory stores the data in the storage device. do.
- the evaluation program 31a is a software program for making the calculation unit 32 function as the acquisition unit 12 and the evaluation unit 13.
- the sensing data 31b is information obtained from a plurality of sensors 4a, 4b, ... Individually provided in the plurality of facilities 3a, 3b, ... Received via the communication unit 11 and acquired by the acquisition unit 12. It is the data to be included.
- the evaluation reference data 31c is data referred to in the evaluation based on the sensing data 31b.
- the arithmetic unit 32 includes an arithmetic unit such as a CPU (Central Processing Unit), and functions as an acquisition unit 12 and an evaluation unit 13 by arithmetic processing using the above-mentioned program or the like, and performs various processes.
- the input unit 33 has a configuration for receiving an input operation from the administrator of the evaluation device 10. Examples of such a configuration include, but are not limited to, a keyboard, a mouse, and the like, and various input devices can be adopted.
- the output unit 34 performs various outputs according to the processing contents performed by the calculation unit 32.
- the output unit 34 includes, for example, a display output unit 34a, an audio output unit 34b, and the like in the configuration.
- the display output unit 34a has one or more display devices such as a liquid crystal display and an organic EL (Electro Luminescence) display, and displays an image according to the processing content performed by the calculation unit 32.
- the audio output unit 34b has a configuration capable of outputting audio, such as a speaker, and outputs audio according to the processing content performed by the arithmetic unit 32.
- the display output unit 34a and the audio output unit 34b function as a notification unit 14.
- FIG. 3 is a graph showing an example of the relationship between the sensing value and the evaluation value indicated by the output of the sensor 4.
- the distribution of the sensing values is shown by a histogram, and the evaluation values corresponding to the sensing values are shown by a line graph.
- the sensing value illustrated in FIG. 3 is a normal sensing value adopted as a basis for deriving the evaluation value.
- the evaluation value is determined based on the distribution of the sensing value in the normal state.
- the distribution of the sensing values shown by the histogram functions as information indicating the normal value range of the sensing values of the facility 3 provided with the sensor 4 that outputs the sensing values from the kernel density estimation based on the distribution.
- the sensing values illustrated in FIG. 3 are distributed in the range of 25 to 50.
- the median value of the sensing value indicated by the alternate long and short dash line C1 is tau ( ⁇ ), and the variance of the sensing value is sigma ( ⁇ ).
- the lower limit E1 of the normal value range of the sensing value can be expressed as ⁇ .
- the upper limit E2 of the normal value range of the sensing value can be expressed as ⁇ + ⁇ .
- the evaluation value of the embodiment is set as expressing the high possibility of such a percentage. For example, when the sensing value is below the lower limit E1, the evaluation value is derived as a value exceeding 0.
- FIG. 3 illustrates a setting in which the evaluation value gradually increases as the sensing value decreases from ⁇ to ⁇ -3 ⁇ . Further, in FIG. 3, ⁇ -3 ⁇ is shown as the evaluation lower limit E3. Further, when the sensing value exceeds the upper limit E2, the evaluation value is derived as a value exceeding 0.
- FIG. 3 illustrates a setting in which the evaluation value gradually increases as the sensing value increases from ⁇ + ⁇ toward ⁇ + 3 ⁇ . Further, in FIG. 3, ⁇ + 3 ⁇ is shown as an evaluation upper limit E4.
- the evaluation value becomes larger in the range from the lower limit E3 to the lower limit E1 and in the range from the upper limit E2 to the upper limit E4 according to the degree of deviation of the sensing value from the normal value range. Is set to. That is, the larger the evaluation value is, the more it is shown that the sensing value deviates from the normal value range, and it is more likely that some abnormality has occurred in the facility 3 provided with the sensor 4 that outputs the sensing value. It is suggested. When a sensing value of the evaluation lower limit E3 or less or a sensing value of the evaluation upper limit E4 or more is obtained, the evaluation value is saturated at the maximum (100).
- the evaluation value of the embodiment is derived from the range from the most stable state (0) including the normal operation of the facility 3 to the most alarming state (100) including the abnormal operation of the facility 3 as a percentage. It is a value indicating the operation status of the facility 3 that has been completed.
- the setting of the lower limit E1 and the upper limit E2 of the normal value range and the evaluation lower limit E3 and the evaluation upper limit E4 based on the median value ( ⁇ ) and the variance ( ⁇ ) of the sensing value is only an example and is limited to this. However, the coefficients and specific formulas can be changed as appropriate.
- FIG. 4 is a graph showing an example of the relationship between the time-series change of the sensing value and the time-series change of the evaluation value.
- the facility 3 from which the sensing value shown in FIG. 4 has been obtained will be described as being the facility 3 from which the sensing value shown in FIG. 3 has been obtained.
- the sensing value in the time zone before the time zone T1 is within the normal value range of 25 to 50, and is stable at a value significantly lower than 50.
- the evaluation value of the time zone is a relatively low value even if it is 0 or a value exceeding 0.
- the sensing value significantly exceeds 50, then decreases below 25, shows 25 or less for a while, and then suddenly rises so as to generate a moment above 50. It is changing unstable.
- the evaluation value of the time zone T1 is significantly higher than 0, suggesting that some abnormality may have occurred in the facility 3 provided with the sensor 4 that outputs the sensing value.
- the sensing value is 0 in most of the blank time zone T2 that occurs after the time zone T1, but it is determined that there is something wrong with the facility 3 based on the evaluation value in the time zone T1. As a result, the facility 3 or the plant 2 including the facility 3 was stopped. The evaluation value is not derived while the plant 2 is stopped. By restarting the plant 2 including the facility 3 after the blank time zone T2, the output of the sensing value and the derivation of the evaluation value are restarted. In the example shown in FIG. 4, although there is a temporary fluctuation in the sensing value and the evaluation value immediately after the restart, it is stable thereafter.
- the sensing value of one sensor 4 provided in one facility 3 and the evaluation value corresponding to the sensing value are exemplified, but the output of the sensing value and the evaluation value are illustrated.
- Derivation is performed individually by a plurality of sensors 4a, 4b, ....
- the evaluation unit 13 periodically performs a process of deriving an evaluation value according to the sensing values indicated by the outputs of the plurality of sensors 4a, 4b, ... For each sensing value.
- the processing cycle in which the acquisition unit 12 acquires the information related to the facility 3 and the evaluation unit 13 derives the evaluation value is arbitrary, but when an abnormality occurs in the facility 3, the evaluation value promptly suggests the abnormality. It is desirable that the cycle is short-term (for example, less than 1 second).
- one or more evaluation values are derived for each facility.
- the evaluation value derived according to the sensing value of the one sensor 4 is treated as the evaluation value of the facility.
- the evaluation value deviating from the normal value among the plurality of evaluation values derived according to the sensing values of the plurality of sensors 4 is treated as the evaluation value of the facility. .. In the case of the embodiment, the evaluation value deviating from the normal value is the highest evaluation value.
- the evaluation unit 13 calculates the evaluation value indicating the soundness of the facility based on the sensing value included in the information related to the operating status of the plurality of facilities 3a, 3b, ... Acquired by the communication unit 11. Perform for each of multiple facilities 3a, 3b, .... Further, information on the operating status of the plurality of facilities 3a, 3b, ... Can be obtained from a plurality of sensors 4a, 4b, ... Individually provided in the plurality of facilities 3a, 3b, ... Included in the plant 2.
- FIG. 5 is a diagram showing an example of notification related to the evaluation of the operating status of the plant 2.
- the display output content by the display output unit 34a includes a first display area D1 and a second display area D2.
- the sensing values indicated by the outputs of the plurality of sensors 4a, 4b, ... are displayed.
- the sensing values indicated by the outputs from each of the 18 sensors 4 are displayed in an analog meter format, but this is an example of a display and is limited to this. Not.
- the number and types of sensing values displayed in the first display area D1 and the specific modes such as the display format and layout in the first display area D1 and the second display area D2 are arbitrary. Further, when the plant 2 is provided with a number of sensors 4 that cannot be collectively displayed in the first display area D1, a scroll bar or the like for making it possible to select the sensing value to be displayed in the first display area D1 is additionally provided. ..
- the second display area D2 display is performed based on the highest evaluation value among the plurality of evaluation values derived by the evaluation unit 13 according to the outputs of the plurality of sensors 4a, 4b, ....
- the highest evaluation value is synonymous with the evaluation value of the facility whose evaluation value is the least healthy.
- the second display area D2 includes a plant stability display unit M1 and a trend graph display unit M2.
- the plant stability display unit M1 displays the overall evaluation value r indicating the stability of the operating status of the plant 2. The process related to the calculation of the comprehensive evaluation value r will be described with reference to FIGS. 6 and 7.
- FIG. 6 shows a type of facility 3 (“facility”), an “item” sensed by the sensor 4 according to the type of facility 3, and a “specific example” of an item sensed by the sensor 4 according to the type of facility 3. It is a figure which shows an example of the correspondence relation with.
- FIG. 6 illustrates, but is not limited to, the correspondence when the plant 2 is a hydroelectric power plant. Each item shown in FIG. 6 corresponds to the plant 2.
- the facility 3 is a "generator", as shown by the “item” included in the record in which the "facility” is a “generator” in FIG. 6, the “temperature”, as the information related to the “generator”,
- the sensor 4 is provided to acquire information on “vibration”, “hydraulic pressure / oil level”, “flow rate”, and “others”. Further, as shown by the combination of these "items” and “specific examples”, the sensor 4 is provided. Taking “temperature” as an example of “items”, there are multiple so that the “stator” of the “stator coil” provided in the generator and the “cooling water” and “cooling air” that cool the generator can be detected.
- Sensor 4 is provided in the "generator” of plant 2.
- the sensor 4 is provided in the facility 3 so that information can be acquired about the items indicated by the combination of the “item” and the “specific example” as illustrated in FIG.
- the type of facility 3 (“facility”), the “item” sensed by the sensor 4 according to the type of facility 3, and the item sensed by the sensor 4 according to the type of facility 3.
- a plurality of sensing values can be obtained according to the number of combinations with the "specific example” of. That is, the plurality of sensors 4a, 4b, ... Are provided according to such a combination.
- the sensing value is a temperature sensing value
- the sensor 4 that outputs the sensing value is a temperature sensor.
- the sensing value is a vibration sensing value
- the sensor 4 that outputs the sensing value is a vibration sensor.
- a sensor 4 corresponding to the sensing value is provided.
- the evaluation unit 13 derives an evaluation value for each of the plurality of sensing values.
- FIG. 6 illustrates the evaluation values of the generator, the water turbine, the inlet valve, and the water channel.
- the evaluation value of the generator shown in FIG. 6 is 40.
- the evaluation value of the water turbine is 30.
- the evaluation values of the inlet valve and the water channel are 0. That is, the evaluation values show that the operating conditions of the inlet valve and the water channel are extremely stable.
- the evaluation value is calculated individually for each of the plurality of facilities 3 such as the generator, the water turbine, the inlet valve and the water channel.
- the evaluation unit 13 calculates the evaluation of the comprehensive evaluation value r based on the evaluation values of the plurality of facilities 3.
- a more detailed method for calculating the comprehensive evaluation value r will be described with reference to FIG. 7.
- FIG. 7 is a graph schematically showing a calculation example of the comprehensive evaluation value r of the plant 2 based on the evaluation values x 1 and x 2 of the two facilities 3. In the explanation with reference to FIG. 7, it is assumed that the evaluation of the plant 2 is represented by the comprehensive evaluation value r.
- the evaluation unit 13 calculates the comprehensive evaluation value r based on the following equation (1).
- x can be expressed as in the equation (2).
- x 1 , x 2 , x 3 , ..., X n are evaluation values of different facilities 3. That is, n corresponds to the number of facilities.
- p in the equation (1) is a weighting constant, and a real number of 1 or more is set. In this way, the evaluation unit 13 of the embodiment calculates the comprehensive evaluation value r as the Lp norm of the evaluation values of the plurality of facilities 3.
- the comprehensive evaluation value r calculated based on the formula (1) is equal to or higher than the evaluation value of each of the plurality of facilities. For example, when only the evaluation value of one facility 3 is larger than 0 and the evaluation values of the other facilities 3 are all 0, the total evaluation value r is the evaluation of the one facility 3 according to the equation (1). Equal to the value. On the other hand, when the evaluation value of the plurality of facilities 3 is larger than 0, according to the equation (1), the total evaluation value r is a value exceeding the evaluation value of each of the plurality of facilities 3 whose evaluation value is larger than 0. ..
- the evaluation unit 13 lowers the evaluation of the operating status of the plant 2 from the evaluation indicated by the evaluation value of a single facility 3 when there are a plurality of facilities 3 whose evaluation values do not indicate the normal operation of the facility 3.
- the relationship between the magnitude of the "evaluation value" and the upper and lower sides of the "evaluation” is opposite.
- the comprehensive evaluation value r may exceed the upper limit of the percentage (100). This makes it easier to emphasize that the stability of the plant 2 related to the operating status of a plurality of facilities 3 is not limited to the operating status of a single facility 3.
- the plant stability display unit M1 is displayed as the latest evaluation of the operating status of the plant 2 evaluated by the evaluation unit 13. Therefore, as illustrated in FIG. 5, the plant stability display unit M1 is displayed to be larger and more conspicuous than the individual sensing values included in the first display area D1.
- the evaluation value is displayed in the analog meter format named "stability meter" on the plant stability display unit M1, but this is an example of the display and is limited to this. It can be changed as appropriate.
- the plant stability display unit M1 shown in FIG. 5 shows that the “alarm level” is set when the total stability r reaches 100 [%].
- the "alarm level” is such that an alarm indicating that some abnormality has occurred that threatens the stable operation of the plant 2 is issued by the voice output unit 34b or the like, or even if it is not issued, an alarm is issued. It indicates that it has occurred.
- 120 [%] is exemplified as a value exceeding 100 [%], but the value exceeding the value is not essential and is a value exceeding 100 [%].
- the value may be less than 120 [%] or may be more than 120 [%].
- it paradoxically shows that the ideal stability condition of the plant is obtained when the total stability is smaller than 100 [%] and the fluctuation is small.
- the character string "real time” is attached to the plant stability display unit M1.
- the character string is such that the comprehensive evaluation value r displayed by the plant stability display unit M1 can confirm the stability of the plant in substantially real time, as in the above evaluation value (for example, 1). It means that it is updated in a cycle (less than a second).
- the character strings of "alarm level” and “real time” are not essential, and the specific contents of the character strings can be changed as appropriate.
- FIG. 7 shows a specific method for lowering the evaluation of the operating status of the plant 2 from the evaluation value of a single facility 3 when there are a plurality of facilities 3 whose evaluation values do not indicate the normal operation of the facility 3. It is not limited to the referenced example.
- the plant stability display unit M1 is evaluated based on the highest evaluation value among a plurality of evaluation values derived in the latest cycle among the evaluation values derived periodically by the evaluation unit 13.
- the value may be displayed. That is, in this case, the evaluation unit 13 specifies the highest evaluation value among the evaluation values x 1 , x 2 , x 3 , ..., X n of the plurality of facilities, and evaluates based on the specified evaluation value. conduct. Further, the evaluation unit 13 derives a value obtained by correcting the highest evaluation value as a comprehensive evaluation value r.
- the evaluation value related to the facility 3 which is the "generator” of the plant 2 is the highest.
- the evaluation value of the "temperature" of the "bearing” provided in the facility 3 which is the “generator” is the highest.
- the evaluation value displayed on the plant stability display unit M1 is based on the evaluation value of the "temperature" of the "bearing”.
- the evaluation value displayed by the plant stability display unit M1 is a value obtained by correcting the evaluation value of the “temperature” of the “bearing”. This amendment is an indication that the plant 2 is in a more vigilant state. That is, in the case of the embodiment, the evaluation unit 13 corrects the evaluation value so as to raise the highest evaluation value at that time, and causes the plant stability display unit M1 to display the corrected total evaluation value r.
- the case where the conversion index of the evaluation value is primary that is, the case where the evaluation value increases temporarily as the degree of deviation from the upper limit or the lower limit of the dispersion of the sensing value increases, is taken as an example.
- the evaluation value becomes 100, and an alarm accompanied by the voice output is issued by the voice output unit 34b, resulting in an abnormality. It shall be notified. It is assumed that the evaluation value is 0 and the variance is 0 when the temperature is the same as the air temperature (for example, 20 [° C.]).
- the sensing value indicating the "temperature” of the "bearing” is 50 [° C] at a certain point
- the "temperature” of the "bearing” is 30 [° C] higher than the air temperature
- the evaluation value is 100, which is an alarm. Will be 15 [° C] lower than when is emitted.
- the evaluation unit 13 corrects the highest evaluation value by 5 [%]. Is displayed on the plant stability display unit M1.
- the evaluation values of facilities 3 other than the "generator” do not include values of "highest evaluation value -5" or higher, but include values of "highest evaluation value -10" or higher. In this case, the evaluation unit 13 corrects the highest evaluation value by 2.5 [%] and displays it on the plant stability display unit M1.
- the evaluation unit 13 determines the evaluation value of the second unhealthy facility based on the predetermined multi-stage evaluation standard of the facility when there are a plurality of facilities 3 whose evaluation values do not show the normal operation of the facility 3. It may be evaluated in multiple stages.
- the evaluation value of the second unhealthy facility is set as the "multi-stage evaluation standard of the predetermined facility", and the evaluation value of the other facility that is not the facility from which the highest evaluation value is derived is the "highest evaluation value”. 2 Whether the evaluation value of other facilities that are not the facility from which the highest evaluation value was derived is less than "highest evaluation value -5" and "highest evaluation value -10" or more.
- the evaluation criteria of the grade are applied, but it may be three or more grades.
- the specific content of the multi-level evaluation criteria is arbitrary and can be changed as appropriate.
- the evaluation unit 13 derives a correction value based on the multi-step evaluation. In this explanation, the correction values of "5 [%] increase of the highest evaluation value” and "2.5 [%] increase of the highest evaluation value” are applied. Is optional and can be changed as appropriate.
- the evaluation unit 13 may calculate the value obtained by correcting the evaluation value (highest evaluation value) of the facility whose evaluation value is the least sound with the correction value as the comprehensive evaluation value r indicating the operating status of the plant 2.
- the evaluation unit 13 corrects the highest evaluation value and plants. It may be displayed on the stability display unit M1. In this case, the evaluation unit 13 makes a correction to increase the highest evaluation value by a degree of less than 2.5 [%] (for example, 1 [%]) and displays it on the plant stability display unit M1.
- the various numerical values and situations exemplified in the explanation relating to the correction are merely examples and are not limited to these, and detailed parameters such as the amount of increase in the evaluation value due to the correction can be changed as appropriate.
- the correction of the highest evaluation value by the "correction value” may be by adding the correction value to the highest evaluation value or by multiplying the highest evaluation value by the correction value.
- what kind of calculation is applied is determined in advance as a condition included in the evaluation standard data 31c.
- the evaluation unit 13 may calculate the value obtained by correcting the evaluation value of the facility whose evaluation value is the least sound by the correction value as the evaluation value indicating the operating status of the plant 2.
- the operating status of the plant 2 is more serious for the notified person (manager, worker, etc. in the plant 2). It becomes easier to understand that there is.
- An addition indicating whether the evaluation value displayed on the plant stability display unit M1 is based on the evaluation value of a single facility 3 or the evaluation value larger than 0 of a plurality of facilities 3 is taken into consideration. Display may be further performed in the vicinity of the plant stability display unit M1 or the plant stability display unit M1. This makes it easier to more intuitively grasp whether or not there is a situation in which some abnormality is suggested in the plurality of facilities 3.
- FIG. 3 shows an example of the "vibration amount" of the "bearing” provided in the "generator”, but the same applies to other sensing values, and data related to various conditions are included in the evaluation standard data 31c. It has been. Further, the sensing value acquired by the acquisition unit 12 is stored and stored as sensing data 31b.
- the trend graph display unit M2 shows the time-series change of the plant stability display unit M1 within a certain period.
- the evaluation unit 13 stores at least data indicating the evaluation value derived within the fixed period in the storage unit 31, and refers to the data when displaying the trend graph display unit M2.
- the trend graph display unit M2 shows the change in the value of the plant stability display unit M1 in the period from the time when the display is performed to 48 hours before, although the trend graph display unit M2 shows the change in the value.
- the specific display mode of M2 can be changed as appropriate.
- the calculation unit 32 functions as the evaluation unit 13 and performs processing related to determination of display contents (display data generation processing), but the present invention is not limited to this.
- the evaluation unit 13 may derive the evaluation value, and a dedicated configuration independent of the evaluation unit 13 may perform the process related to the determination of the notification content based on the evaluation value.
- the display output content by the display output unit 34a may further include content not included in the first display area D1 and the second display area D2.
- the display content shown in FIG. 5 further includes a real-time value display unit A1, a target name display unit A2, and a trend display unit A3.
- the real-time value display unit A1 a part or all of the sensing values from which the evaluation values exceeding 0 are derived are displayed in a list.
- the real-time value display unit A1 may preferentially display the sensing value from which the higher evaluation value is derived, or the facility from which the evaluation value displayed as the plant stability display unit M1 is derived.
- the sensing value indicated by the output of the other sensor 4 provided in 3 may be preferentially displayed.
- the target name display unit A2 displays information (character string or the like) indicating which item in which facility the sensing value listed in the real-time value display unit A1 is the sensing value obtained.
- the trend display unit A3 displays a time-series change of the sensing value selected and displayed as the real-time value display unit A1 within a certain period.
- the evaluation unit 13 stores at least the data indicating the sensing value derived within the fixed period in the storage unit 31 as the sensing data 31b, and refers to the sensing data 31b when displaying the trend display unit A3.
- the notification may be performed by the terminal 20 (see FIG. 1).
- the terminal 20 includes a communication unit 21 and a notification unit 22.
- the communication unit 21 has the same configuration as the communication unit 11, and evaluates data corresponding to the display content of the display output unit 34a and data corresponding to the audio output content of the audio output unit 34b by communicating with the communication unit 11. Obtained from device 10.
- the notification unit 22 has the same configuration as the output unit 34, and performs the same display output as the display output unit 34a described above and the same audio output as the audio output unit 34b.
- the terminal 20 includes a notification unit 22 that performs notification related to the evaluation of the operating status of the plant 2.
- the notification unit 22 includes the same configuration as the display output unit 34a as a configuration for displaying information related to the evaluation of the operating status of the plant 2.
- the communication unit 11 communicates with the communication unit 5 and the communication unit 21, but the configuration for communicating with the communication unit 5 and the configuration for communicating with the communication unit 21 are separate configurations. May be good.
- the evaluation value is 0 when the temperature is the same as the air temperature (for example, 20 [° C.]), but the temperature the same as the air temperature is the ambient temperature. It is affected and varies greatly depending on the season. Therefore, it may be conditioned in advance that the upper limit or the lower limit of the variance is changed depending on the season. In this case, the data corresponding to the conditioning is included in the evaluation reference data 31c in advance. Further, a software program or a circuit (timer circuit or the like) that functions as a calendar that can specify the season is provided in advance in the evaluation device 10.
- FIG. 8 is a graph showing an example of changing the upper limit of dispersion according to the season.
- FIG. 8 assumes a case where the temperature is sensed by the sensor 4, which is a temperature sensor.
- a first upper limit E21 having a value farther from the evaluation upper limit E4 and a second upper limit E22 having a closer value are individually set.
- Both the first upper limit E21 and the second upper limit E22 function as the above-mentioned upper limit E2. That is, the fluctuation amount SC between the first upper limit E21 and the second upper limit E22 is the seasonal fluctuation amount of the upper limit E2.
- the first upper limit E21 and the second upper limit E22 are briefly shown in FIG.
- the unit 13 may change the upper limit E2 applied in a multi-step or stepless manner between the first upper limit E21 and the second upper limit E22.
- the evaluation device 10 determines the overall stability of the plant 2 based on the acquisition unit 12 that acquires the information related to the operating status of the plurality of facilities 3 included in the plant 2. It is provided with an evaluation unit 13 for evaluation.
- the evaluation unit 13 performs a process of calculating an evaluation value indicating the soundness of the facility 3 based on the sensing value included in the information for each of the plurality of facilities 3a, 3b, ... Based on each evaluation value x 1 , x 2 , ...,
- the comprehensive evaluation value r indicating the stability of the operating condition of the plant 2 is calculated. As a result, it becomes easier for the person who confirms the comprehensive evaluation value r to grasp the overall stability of the plant 2 as compared with the case where only the acquisition of the simple sensing value and the enumeration notification thereof are performed.
- the evaluation unit 13 lowers the evaluation of the operating status of the plant 2 from the evaluation indicated by the evaluation value of a single facility 3 when there are a plurality of facilities 3 whose evaluation values do not indicate the normal operation of the facility 3.
- the evaluation value displayed on the plant stability display unit M1 is corrected, and it is notified that the soundness evaluation of the plant is further lowered.
- the evaluation unit 13 calculates the comprehensive evaluation value r indicating the evaluation of the operating status of the plant 2 as the Lp norm of the evaluation values of the plurality of facilities 3a, 3b, .... As a result, the plant 2 can be evaluated based on predetermined mathematical formulas (formulas (1) and (2)) regardless of the number of facilities 3.
- the acquisition unit 12 obtains information on the operating status of the plurality of facilities 3a, 3b, ... From the plurality of sensors 4a, 4b, ... Individually provided in the plurality of facilities 3a, 3b, ... Included in the plant 2. get. As a result, the output of the sensor 4 can be used as information related to the operating status of the facility 3.
- the senor 4 has at least one of the temperature, humidity, pressure, vibration, capacity, flow rate, operating speed, and opening / closing status of the opening / closing portion (for example, the inlet valve) of the facility 3 provided. Detect one. As a result, more diverse information can be used as information related to the operating status of the facility 3.
- a part or all of the plurality of sensors 4 and the acquisition unit 12 are connected via wireless communication. This makes it easier to relax the installation conditions of the evaluation device 10 for the plant 2. In addition, it becomes easier to relax the physical constraints for providing the sensor 4. That is, since the sensor 4 and the evaluation device 10 do not necessarily have to be directly connected to each other, the degree of freedom in installing the sensor 4 and the evaluation device 10 is further improved.
- the evaluation value is derived from, for example, the range from the most stable state including the normal operation of the facility 3 to the state including the abnormal operation of the facility such as the situation to be wary of at the above alarm level as a percentage. It is a value indicating the operating status of the facility. As a result, the operating status of the plant 2 can be grasped with more intuitive numerical information expressed in the range of 0 to 100.
- the "stable state" does not mean only the ideal operating condition without any problem, and as long as the state is maintained, the facility 3 and the plant 2 including the facility 3 can continue to operate without any problem. Refers to the overall condition.
- the "most vigilant state” is set as the control level of the plant 2, and an alarm indicating that immediate measures are required to eliminate the abnormality, such as an alarm level, is notified by voice or the like.
- the operating status of the facility 3 is applicable to this, but is not limited to this. Voice notification of alarms is not essential, and it is natural that the operating status of facility 3, which is considered to be the "most vigilant state", may be changed based on cases such as temporary or new accidents.
- the evaluation device 10 of the embodiment includes a notification unit 14 that notifies the evaluation of the operating status of the plant 2. As a result, even a person who does not have the terminal 20 can have an opportunity to recognize the content of the notification.
- the notification unit 14 includes a display output unit 34a that displays information related to the evaluation of the operating status of the plant 2.
- a display output unit 34a that displays information related to the evaluation of the operating status of the plant 2.
- the evaluation device 10 is not limited to the information processing device, and may be a dedicated device provided so as to perform at least the functions of the acquisition unit 12 and the evaluation unit 13 among the above-mentioned functions.
- the route for transmitting the output of the sensor 4 to the evaluation device 10 is not limited to the one via wireless communication between the communication unit 5 and the communication unit 11.
- a part or all of the communication line between the communication unit 5 and the communication unit 11 may include a wired communication circuit, or may include a public communication line network such as the Internet.
- the route for transmitting the output of a part or all of the sensor 4 to the evaluation device 10 may be a directly connected bus provided exclusively for the evaluation device 10.
Landscapes
- Physics & Mathematics (AREA)
- General Physics & Mathematics (AREA)
- Engineering & Computer Science (AREA)
- Automation & Control Theory (AREA)
- Testing And Monitoring For Control Systems (AREA)
Abstract
評価装置は、プラントに含まれる複数の施設の稼働状況に係る情報を取得する取得部と、情報に含まれるセンシング値に基づいて施設の健全度を示す評価値を算出する処理を複数の施設毎に行い、複数の施設の各々の評価値に基づいてプラントの稼働状況の安定度を示す総合評価値を算出する評価部とを備える。
Description
本発明は、評価装置及び評価システムに関する。
機器に設けられたセンサの出力に基づいて機器の稼働状況を把握可能な方法が知られている(例えば、特許文献1)。
プラントでも、プラントに含まれる各種の施設が備える機器にセンサを設けてプラントの稼働状況を把握したいという需要がある。一方、発電所等の大規模なプラントでは、プラントに含まれる各種の施設の稼働状況が互いに関与し合うことで一体的な動作が成立する。このようなプラントに含まれる各種の施設が備える機器に単にセンサを設けてセンサの出力を羅列したとしても、プラントの全体的な安定度を把握することは困難だった。
本発明では、プラントの全体的な安定度をより把握しやすい評価装置及び評価システムを提供することを目的とする。
上述した課題を解決し、目的を達成するために、本発明の評価装置は、プラントに含まれる複数の施設の稼働状況に係る情報を取得する取得部と、前記情報に含まれるセンシング値に基づいて施設の健全度を示す評価値を算出する処理を前記複数の施設毎に行い、前記複数の施設の各々の前記評価値に基づいてプラントの稼働状況の安定度を示す総合評価値を算出する評価部とを備える。
本発明の望ましい態様として、前記評価部は、前記評価値が施設の正常動作を示さない施設が複数ある場合、単一の施設の評価値が示す安定度よりも低い安定度を示す前記総合評価値を算出する。
本発明の望ましい態様として、前記評価部は、前記複数の施設の評価値のLpノルムとして、前記総合評価値を算出する。
本発明の望ましい態様として、前記取得部は、前記プラントに含まれる複数の施設に個別に設けられた複数のセンサから前記情報を取得する。
本発明の望ましい態様として、前記センサは、設けられた施設の温度、湿度、圧力、振動、容量、流量、動作速度及び開閉部の開閉状況のうち少なくとも1つを検知する。
本発明の望ましい態様として、前記複数のセンサの一部又は全部と前記取得部とは無線通信を介して接続される。
本発明の望ましい態様として、前記評価値は、施設の正常動作時を含む最も安定した状態から施設の異常動作時を含む最も警戒すべき状態までの範囲を百分率として導出された施設の稼働状況を示す値である。
本発明の望ましい態様として、前記プラントの稼働状況の評価に係る報知を行う報知部を備える。
本発明の望ましい態様として、前記報知部は、前記プラントの稼働状況の評価に係る情報を表示する表示部を含む。
本発明の望ましい態様として、プラントに含まれる複数の施設に個別に設けられた複数のセンサと、前記複数のセンサの出力に基づいて前記プラントの稼働状況を評価する評価装置と、前記プラントの稼働状況の評価に係る報知を行う報知部を備える端末とを備える評価システムであって、前記評価装置は、上述した評価装置である。
本発明によれば、プラントの全体的な安定度をより把握しやすくなる。
次に、本発明の実施形態を、図面を参照して詳細に説明する。図1は、実施形態に係る評価システム1の主要構成例を示す図である。評価システム1は、プラントの稼働状況を評価するシステムである。
図1に示すように、評価システム1は、プラント2に設けられた複数のセンサ4a,4b,…と、評価装置10と、端末20とを含む。プラント2は、複数の施設3a,3b,…と、複数のセンサ4a,4b,…と、通信部5とを備える。施設3a,3b,…はそれぞれ、プラント2が全体として奏する効果のために設けられた施設である。具体例を挙げると、プラント2が水力発電所である場合、施設3a,3b,…は、発電機、水車、…のような水力発電所が備える施設である。施設3a,3b,…の具体的形態は、プラント2の目的に応じたものになる。
複数のセンサ4a,4b,…は、複数の施設3a,3b,…に個別に設けられたセンサである。センサ4a,4b,…の各々の具体的態様及び検出対象となる事項は、施設3a,3b,…の具体的態様に応じたものになる。複数の施設3a,3b,…の数及び複数のセンサ4a,4b,…の数は3以上であってもよい。
なお、図1では、1つの施設3に1つのセンサ4が設けられているが、1つの施設3に複数のセンサ4が設けられてもよいし、複数の施設3に共通する事項を1つのセンサ4で検出可能にセンサ4が設けられてもよい。複数の施設3に共通する事項として、例えばプラント2がある地域の天候、気温、湿度等が挙げられる。
施設3a,3b,…を特に区別せず包括的に説明する場合、施設3と記載することがある。また、センサ4a,4b,…を特に区別せず包括的に説明する場合、センサ4と記載することがある。なお、プラント2の構成のうち、実施形態に係る評価システム1に含まれる構成は、センサ4と通信部5である。施設3は、センサ4が設けられる構成として図示されている。
通信部5は、複数のセンサ4a,4b,…の出力を評価装置10に伝送する。実施形態に係る通信部5は、予め定められた通信プロトコルに対応したNIC(Network interface controller)として機能するための回路等を有する。係る通信プロトコルとして、例えばTCP/IP(Transmission Control Protocol/Internet Protocol)が挙げられるが、採用可能な通信プロトコルこれに限られるものでなく、適宜変更可能である。通信部5は、評価装置10との通信を介して複数のセンサ4a,4b,…の出力に応じたデータを評価装置10に伝送する。
なお、図1では、1つの通信部5が図示されているが、複数のセンサ4a,4b,…の一部又は全部に対して個別に通信部5と同様に機能する通信のための構成が設けられていてもよい。また、図示しないが、センサ4の出力がアナログである場合、通信部5によるデジタル通信を介してセンサ4の出力に応じたデータを伝送するためのアナログ/デジタル変換回路が設けられる。
評価装置10は、通信部11と、取得部12と、評価部13と、報知部14とを備える。通信部11は、通信部5の通信プロトコルに対応するNICとして機能するための回路等を有する。通信部11は、通信部5と通信を行い、複数のセンサ4a,4b,…の出力に応じたデータを受信する。実施形態では、通信部5と通信部11との間の通信回線は、電波等の電磁波を利用した無線の通信回線である。このように、実施形態では、複数のセンサ4a,4b,…と取得部12とは、通信部5及び通信部11による無線通信を介して接続される。
取得部12は、プラント2に含まれる複数の施設3a,3b,…の稼働状況に係る情報を取得する。具体的には、取得部12は、通信部11が受信したデータを取得することで、プラント2に含まれる複数の施設3a,3b,…に個別に設けられた複数のセンサ4a,4b,…から得られた情報を取得する。評価部13は、取得部12が取得した情報に基づいてプラント2の稼働状況を評価する。報知部14は、評価部13が評価したプラント2の稼働状況の評価に係る報知を行う。
実施形態に係る評価装置10は、通信部11、取得部12、評価部13及び報知部14としての機能を奏するよう設けられた情報処理装置である。係る情報処理装置の構成例について、図2を参照して説明する。
図2は、評価装置10の構成例を示すブロック図である。評価装置10は、通信部11と、記憶部31と、演算部32と、入力部33と、出力部34とを備える。記憶部31は、評価装置10が行う各種の処理で読み出されるソフトウェア・プログラム及びデータを記憶する。以下、プログラム等と記載した場合、係るソフトウェア・プログラム及びデータをさす。具体的には、記憶部31は、例えばハードディスクドライブ(HDD:Hard Disk Drive)やソリッドステートドライブ(SSD:Solid State Drive)、フラッシュメモリのような記憶装置を含み、係る記憶装置に当該データを記憶する。
図2では、プログラム等の一例として、評価プログラム31a、センシングデータ31b及び評価基準データ31cが例示されている。評価プログラム31aは、演算部32を取得部12、評価部13として機能させるためのソフトウェア・プログラムである。センシングデータ31bは、通信部11を介して受信されて取得部12によって取得された、複数の施設3a,3b,…に個別に設けられた複数のセンサ4a,4b,…から得られた情報を含むデータである。評価基準データ31cは、センシングデータ31bに基づいた評価に際して参照されるデータである。
演算部32は、CPU(Central Processing Unit)等の演算装置を含み、上述のプログラム等を利用した演算処理によって取得部12、評価部13として機能し、各種の処理を行う。入力部33は、評価装置10の管理者からの入力操作を受け付けるための構成を有する。係る構成として、例えばキーボード、マウス等が挙げられるが、これに限られるものでなく、各種の入力装置を採用可能である。
出力部34は、演算部32が行った処理内容に応じた各種の出力を行う。出力部34は、例えば表示出力部34a、音声出力部34b等を構成に含む。表示出力部34aは、例えば液晶ディスプレイ、有機EL(Electro Luminescence)ディスプレイ等の表示装置を1つ以上有し、演算部32が行った処理内容に応じた画像を表示する。音声出力部34bは、例えばスピーカ等、音声を出力可能な構成を有し、演算部32が行った処理内容に応じた音声を出力する。表示出力部34a、音声出力部34bは、報知部14として機能する。
以下、図3と図4を参照し、評価部13によるプラント2の稼働状況の評価について説明する。図3は、センサ4の出力が示すセンシング値と評価値との関係の一例を示すグラフである。図3では、センシング値の分布をヒストグラムで示し、センシング値に応じた評価値を線グラフで示している。
図3で例示するセンシング値は、評価値を導出する根拠として採用された正常時のセンシング値である。評価値は、正常時のセンシング値の分布に基づいて決定される。ヒストグラムが示すセンシング値の分布は、当該分布に基づいたカーネル密度推定から当該センシング値を出力するセンサ4が設けられた施設3のセンシング値の正常値範囲を示す情報として機能する。
具体的には、図3で例示するセンシング値は、ほとんどが25から50の範囲内に分布している。ここで、一点鎖線C1が示すセンシング値の中央値をタウ(τ)とし、センシング値の分散をシグマ(σ)とする。この場合、センシング値の正常値範囲の下限E1はτ-σとして表せる。また、この場合、センシング値の正常値範囲の上限E2はτ+σとして表せる。下限E1から上限E2までのセンシング値の正常値範囲から外れたセンシング値が検出された場合、当該センシング値を出力するセンサ4が設けられた施設3に何らかの異常が生じている可能性が示唆される。
実施形態の評価値は、係る可能性の高さを百分率で現すものとして設定される。例えば、センシング値が下限E1を下回ると、評価値は0を超えた値として導出される。図3では、センシング値がτ-σからτ-3σに向かって下がるに従って評価値が漸増する設定が例示されている。また、図3ではτ-3σを評価下限E3として示している。また、センシング値が上限E2を上回ると、評価値は0を超えた値として導出される。図3では、センシング値がτ+σからτ+3σに向かって上がるに従って評価値が漸増する設定が例示されている。また、図3ではτ+3σを評価上限E4として示している。このように、実施形態では、評価下限E3から下限E1までの範囲内及び上限E2から評価上限E4までの範囲内では、センシング値の正常値範囲からの乖離の度合いに応じて評価値が大きくなるよう設定されている。すなわち、評価値が大きくなるほど、センシング値が正常値範囲から乖離していることが示され、当該センシング値を出力するセンサ4が設けられた施設3に何らかの異常が生じている可能性がより強く示唆される。評価下限E3以下のセンシング値又は評価上限E4以上のセンシング値が得られた場合、評価値は最大(100)で飽和する。
このように、実施形態の評価値は、施設3の正常動作時を含む最も安定した状態(0)から施設3の異常動作時を含む最も警戒すべき状態(100)までの範囲を百分率として導出された施設3の稼働状況を示す値である。
なお、センシング値の中央値(τ)と分散(σ)とに基づいた正常値範囲の下限E1及び上限E2並びに評価下限E3及び評価上限E4の設定はあくまで一例であってこれに限られるものでなく、係数や具体的な式については適宜変更可能である。
図4は、センシング値の時系列変化と評価値の時系列変化との関係の一例を示すグラフである。ここでは、図4に示すセンシング値が得られた施設3は、図3に示すセンシング値が得られた施設3であるものとして説明を行う。
図4に示すように、時間帯T1以前の時間帯におけるセンシング値は25から50の正常値範囲内であり、概ね50を有意に下回る値で安定している。係る時間帯の評価値は、0又は0を超える値であっても比較的低い値である。これに対し、時間帯T1に入るとセンシング値が有意に50を上回った後、25を下回るように下降し、しばらく25以下を示した後に急激に50を上回る瞬間を生じるように上昇する等、不安定に変化している。このような時間帯T1の評価値は、0を有意に上回り、当該センシング値を出力するセンサ4が設けられた施設3に何らかの異常が生じている可能性を示唆している。
なお、時間帯T1の後に生じている空白時間帯T2の大半は、センシング値が0となっているが、これは時間帯T1における評価値に基づいて施設3に何らかの異常があると判断されたことによって当該施設3又は当該施設3を含むプラント2が停止されたことによる。プラント2の停止中は、評価値も導出されない。空白時間帯T2を経て当該施設3を含むプラント2が再稼働することで、センシング値の出力及び評価値の導出が再開されている。図4に示す例では、再稼働直後には一時的にセンシング値及び評価値の揺らぎがあるものの、その後安定している。
図3及び図4を参照した説明では、1つの施設3に設けられた1つのセンサ4のセンシング値及び当該センシング値に応じた評価値を例示しているが、センシング値の出力及び評価値の導出は、複数のセンサ4a,4b,…で個別に行われる。評価部13は、複数のセンサ4a,4b,…の出力が示すセンシング値に応じた評価値の導出処理を、各センシング値毎に周期的に行う。取得部12が施設3に係る情報を取得して評価部13が評価値を導出する処理周期は任意であるが、施設3に異常が生じた場合にすみやかに評価値によって当該異常が示唆される程度の短期間(例えば、1秒未満)周期であることが望ましい。
ここで、1つの施設3には1つ以上のセンサ4が設けられるので、施設毎に1つ以上の評価値が導出されることになる。施設に設けられたセンサ4が1つである場合、その1つのセンサ4のセンシング値に応じて導出された評価値が当該施設の評価値として扱われる。施設に設けられたセンサ4が複数である場合、その複数のセンサ4のセンシング値に応じて導出された複数の評価値のうち最も正常値から乖離した評価値が当該施設の評価値として扱われる。実施形態の場合、最も正常値から乖離した評価値は、最も高い評価値である。
このように、評価部13は、通信部11が取得した複数の施設3a,3b,…の稼働状況に係る情報に含まれるセンシング値に基づいて施設の健全度を示す評価値を算出する処理を複数の施設3a,3b,…毎に行う。また、複数の施設3a,3b,…の稼働状況に係る情報は、プラント2に含まれる複数の施設3a,3b,…に個別に設けられた複数のセンサ4a,4b,…から得られる。
次に、プラント2の稼働状況の評価に係る報知について説明する。図5は、プラント2の稼働状況の評価に係る報知の一例を示す図である。表示出力部34aによる表示出力内容は、第1表示領域D1と、第2表示領域D2と、を含む。
第1表示領域D1では、複数のセンサ4a,4b,…の出力が示すセンシング値が表示される。図5に示す第1表示領域D1では、18のセンサ4の各々からの出力が示すセンシング値がアナログメータ形式で表示されているが、これは表示の一形態例であってこれに限られるものでない。第1表示領域D1に表示されるセンシング値の数及び種類並びに第1表示領域D1及び第2表示領域D2における表示形式、レイアウト等の具体的な態様については任意である。また、第1表示領域D1に一括表示できない数のセンサ4がプラント2に設けられている場合、第1表示領域D1に表示させるセンシング値を選択可能とするためのスクロールバー等が追加で設けられる。
第2表示領域D2では、複数のセンサ4a,4b,…の各々の出力に応じて評価部13によって導出された複数の評価値のうち、最高の評価値に基づいた表示が行われる。ここで、最高の評価値は、評価値が最も健全でない施設の評価値と同義である。第2表示領域D2は、プラント安定度表示部M1と、トレンドグラフ表示部M2とを含む。
プラント安定度表示部M1では、プラント2の稼働状況の安定度を示す総合評価値rに対応した表示が行われる。総合評価値rの算出に係る処理について、図6及び図7を参照して説明する。
図6は、施設3の種類(「施設」)と、施設3の種類に応じてセンサ4がセンシングする「項目」と、施設3の種類に応じてセンサ4がセンシングする項目の「具体例」との対応関係の一例を示す図である。図6は、プラント2が水力発電所である場合の対応関係を例示しているが、これに限られるものでない。図6に示す各事項は、プラント2に応じたものになる。
例えば、施設3が「発電機」である場合、図6で「施設」が「発電機」であるレコードが含む「項目」が示すように、「発電機」に係る情報として、「温度」、「振動」、「油圧・油面」、「流量」、「その他」の情報を取得するようセンサ4が設けられる。さらに、これらの「項目」と「具体例」との組み合わせが示すように、センサ4が設けられる。「項目」のうち「温度」を例とすると、発電機に設けられている「固定子コイル」並びに発電機を冷却する「冷却水」及び「冷却風」の「温度」を検出できるよう、複数のセンサ4がプラント2の「発電機」に設けられる。「発電機」以外の施設3についても、図6で例示するような「項目」と「具体例」との組み合わせが示す事項について情報を取得できるよう、センサ4が施設3に設けられる。
このように、プラント2からは、施設3の種類(「施設」)と、施設3の種類に応じてセンサ4がセンシングする「項目」と、施設3の種類に応じてセンサ4がセンシングする項目の「具体例」との組み合わせの数に応じた複数のセンシング値が得られる。すなわち、複数のセンサ4a,4b,…は、このような組み合わせに応じて設けられる。センシング値が温度のセンシング値である場合、当該センシング値を出力するセンサ4は温度センサである。センシング値が振動のセンシング値である場合、当該センシング値を出力するセンサ4は振動センサである。他のセンシング値についても同様に、センシング値に対応したセンサ4が設けられる。評価部13は、係る複数のセンシング値の各々について評価値を導出する。
図6では、発電機、水車、入口弁及び水路の各々の評価値を例示している。図6に示す発電機の評価値は、40である。また、水車の評価値は、30である。また、入口弁及び水路の評価値は、0である。すなわち、入口弁及び水路の稼働状況が極めて安定していることが評価値に現れている。一方、発電機及び水車については、評価値が0になる理想的な安定状況よりも何らかの理由によって注意すべき状況が生じていることが評価値に現れている。図6に示すように、評価値は、発電機、水車、入口弁及び水路のような複数の施設3の各々について個別に算出される。
評価部13は、複数の施設3の評価値に基づいて総合評価値rの評価を算出する。図6では、r=50の総合評価値が算出されている場合を例示している。以下、より詳細な総合評価値rの算出方法について、図7を参照して説明する。
図7は、2つの施設3の評価値x1,x2に基づいたプラント2の総合評価値rの算出例を模式的に示すグラフである。図7を参照した説明では、総合評価値rによってプラント2の評価が表されるものとする。
評価部13は、以下の式(1)に基づいて、総合評価値rを算出する。ここで、xは、式(2)のように表せる。式(1)及び式(2)におけるx1,x2,x3,…,xnは、それぞれ異なる施設3の評価値である。すなわち、nは施設の数に対応する。また、式(1)におけるpは、重み付け定数であり、1以上の実数が設定される。このように、実施形態の評価部13は、複数の施設3の評価値のLpノルムとして総合評価値rを算出する。


式(1)に基づいて算出される総合評価値rは、複数の施設の各々の評価値以上になる。例えば、ある1つの施設3の評価値のみ0より大きく、他の施設3の評価値が全て0である場合、式(1)によれば、総合評価値rは当該ある1つの施設3の評価値と等しくなる。一方、複数の施設3の評価値が0より大きい場合、式(1)によれば、総合評価値rは、評価値が0より大きい複数の施設3の各々の評価値を超えた値になる。
図7を参照した以下の説明では、理解を容易にする目的で、n=2かつp=2である場合を例として説明を行うが、n及びpは任意の自然数であってよい。ただし、nは施設3の数に対応する。
図7に示すように、n=2かつp=2である場合、2つの施設3のうち一方の評価値x1が40であり、他方の評価値x2が30であるとき、評価部13は、式(1)によってr=50を算出する。このように、2つの施設3の各々の評価値x1,x2の値が共に0より大きい場合、総合評価値rは、2つの施設3の各々の評価値x1,x2を超えた値になる。ここで、実施形態では、評価値が大きいほど当該評価値を導出された対象がより警戒すべき状態であることが示される。従って、評価部13は、評価値が施設3の正常動作を示さない施設3が複数ある場合にプラント2の稼働状況の評価を単一の施設3の評価値が示す評価よりも下げる。なお、実施形態では、「評価値」の大小と、「評価」の上下とは、その関係性が反対である。
なお、総合評価値rは、百分率の上限(100)を超える値となってもよい。これによって、単一の施設3の稼働状況に限定されない複数の施設3の稼働状況に係るプラント2の安定度の評価が行われていることがより強調されやすくなる。
プラント安定度表示部M1は、評価部13が評価したプラント2の稼働状況の最新の評価として表示される。このため、図5で例示するように、第1表示領域D1に含まれる1つ1つのセンシング値に比して、プラント安定度表示部M1は、より大きくより目立つよう表示される。
なお、図5では、プラント安定度表示部M1において評価値が「安定度メータ」という名称のアナログメータ形式で表示されているが、これは表示の一形態例であってこれに限られるものでなく、適宜変更可能である。図5に示すプラント安定度表示部M1では、総合安定度rが100[%]になった場合に「警報レベル」であることが示されている。「警報レベル」は、プラント2の安定的な稼働を脅かす何らかの異常が生じたことを示す警報が音声出力部34b等によって発せられるか、発せられないとしても警報が発せられる程のレベルの異常が生じたことを示すものである。なお、プラント安定度表示部M1のアナログメータは、100[%]を超える値として120[%]が例示されているが、当該超える値は必須ではないし、100[%]を超える値であって120[%]未満の値であってもよいし、120[%]を超える値であってもよい。逆に、総合安定度が100[%]より小さくて、変動が少ない場合にプラントの理想的な安定状況であることを逆説的に示している。
また、図5では、プラント安定度表示部M1において「リアルタイム」という文字列が付されている。係る文字列は、当該プラント安定度表示部M1によって表示されている総合評価値rが、上述の評価値と同様、プラントの安定度が実質的にリアルタイムで確認できる程度の短期間(例えば、1秒未満)周期で更新されていることを表している。「警報レベル」や「リアルタイム」の文字列は必須でないし、文字列の具体的内容については適宜変更可能である。
なお、評価値が施設3の正常動作を示さない施設3が複数ある場合にプラント2の稼働状況の評価を単一の施設3の評価値が示す評価よりも下げる具体的方法は、図7を参照した例に限られるものでない。まず、前提として、プラント安定度表示部M1には、評価部13が周期的に導出している評価値のうち最新の周期で導出した複数の評価値のうち、最高の評価値に基づいた評価値が表示されるようにしてもよい。すなわち、この場合、評価部13は、複数の施設の評価値x1,x2,x3,…,xnのうち、最高の評価値を特定して特定された評価値に基づいた評価を行う。さらに、評価部13は、最高の評価値を補正した値を総合評価値rとして導出する。
具体例を挙げると、ある時点で導出された複数の評価値のうち、例えばプラント2の「発電機」である施設3に係る評価値が最も高かった場合を想定する。より具体例を挙げると、「発電機」である施設3設けられている「軸受」の「温度」の評価値が最も高かった場合を想定する。この場合、プラント安定度表示部M1で表示される評価値は、「軸受」の「温度」の評価値に基づいたものになる。この場合において、プラント2の「発電機」以外の施設3に設けられたセンサ4のセンシング値に基づいた評価値が正常動作を示さない値(例えば、0を超える値)であった場合、評価部13は、プラント安定度表示部M1で表示される評価値を、「軸受」の「温度」の評価値を補正した値とする。この補正は、プラント2がより警戒すべき状態であることを示す補正になる。すなわち、実施形態の場合、評価部13は、その時点で最も高い評価値をより上げるよう評価値を補正し、補正された総合評価値rをプラント安定度表示部M1に表示させる。
図3を参照した説明と同様、評価値の変換指数が一次である場合、すなわち、センシング値の分散の上限又は下限から乖離する度合いが大きくなるほど一次的に評価値が高まる場合を例とする。また、「発電機」である施設3の「軸受」の「温度」が75[℃]を超えた場合に評価値が100となり、音声出力部34bによる音声出力を伴う警報が発されて異常が報知されるものとする。気温と同一の温度(例えば、20[℃])である場合に評価値が0となり、分散が0であることを想定する。ある時点で「軸受」の「温度」を示すセンシング値が50[℃]であれば、「軸受」の「温度」は、気温に対して30[℃]高く、評価値が100となって警報が発される場合に比して15[℃]低いことになる。この場合、警報の発令条件に対して30/(30+15)=67[%]の状態であることとなり、「67」が評価値になる。
「発電機」である施設3の評価値のうち、ある時点での評価値で「67」が最高の評価値であるとする。「発電機」以外の他の施設3の評価値に「最高の評価値-5」以上の値が含まれている場合、評価部13は、最高の評価値を5[%]増しとする補正を行ってプラント安定度表示部M1に表示させる。また、「発電機」以外の他の施設3の評価値に「最高の評価値-5」以上の値が含まれておらず、「最高の評価値-10」以上の値が含まれている場合、評価部13は、最高の評価値を2.5[%]増しとする補正を行ってプラント安定度表示部M1に表示させる。
このように、評価部13は、評価値が施設3の正常動作を示さない施設3が複数ある場合、2番目に健全でない施設の評価値を予め定められた施設の多段階評価基準に基づいて多段階評価するようにしてもよい。この説明では、「2番目に健全でない施設の評価値を予め定められた施設の多段階評価基準」として、最高の評価値が導出された施設でない他の施設の評価値が「最高の評価値-5」以上であるか、最高の評価値が導出された施設でない他の施設の評価値が「最高の評価値-5」未満かつ「最高の評価値-10」以上であるか、という2段階の評価基準が適用されているが、3段階以上であってもよい。多段階評価基準の具体的な内容については任意であり、適宜変更可能である。評価部13は、当該多段階評価に基づいた補正値を導出する。この説明では、「最高の評価値の5[%]増し」、「最高の評価値の2.5[%]増し」という補正値が適用されているが、補正値の具体的な決定方法については任意であり、適宜変更可能である。評価部13は、評価値が最も健全でない施設の評価値(最高の評価値)を補正値で補正した値をプラント2の稼働状況を示す総合評価値rとして算出するようにしてもよい。
なお、「発電機」以外の他の施設3の評価値に「最高の評価値-10」以上の値が含まれていない場合についても、評価部13は、最高の評価値を補正してプラント安定度表示部M1に表示させるようにしてもよい。この場合、評価部13は、最高の評価値を2.5[%]未満の程度(例えば、1[%])増しとする補正を行ってプラント安定度表示部M1に表示させる。以上、補正に係る説明で例示された各種の数値や状況はあくまで一例であってこれに限られるものでなく、補正による評価値の上昇量等の詳細なパラメータについては適宜変更可能である。
また、「補正値」による最高の評価値の補正は、最高の評価値に対する補正値の加算によるものでもよいし、最高の評価値に対する補正値の乗算によるものであってもよい。ただし、どのような演算が適用されるかについては、評価基準データ31cに含まれる条件として予め決定されている。
このように、評価値が施設3の正常動作を示さない施設3が複数ある場合、2番目に健全でない施設3の評価値を予め定められた施設3の多段階評価基準に基づいて多段階評価し、当該多段階評価に基づいた補正値を導出するようにしてもよい。そして、評価部13は、評価値が最も健全でない施設の評価値を当該補正値で補正した値をプラント2の稼働状況を示す評価値として算出するようにしてもよい。これによって、評価値が施設3の正常動作を示さない施設3が複数ある場合にプラント2の稼働状況がより深刻である可能性が高いことが報知内容を確認した者により確実に伝わりやすくなり、より迅速な対応を促しやすくなる。従って、プラント2の稼働状況に応じた適切な対処がなされやすくなる。
プラント安定度表示部M1の表示によって、複数の施設3の評価値が0より大きい場合、被報知者(プラント2における管理者、作業者等)にとって、プラント2の稼働状況がより深刻な状態であることが把握しやすくなる。なお、プラント安定度表示部M1に表示された評価値が単一の施設3の評価値によるものか、複数の施設3の0より大きい評価値が考慮されたものであるのか否かを示す付加的な表示がさらにプラント安定度表示部M1又はプラント安定度表示部M1近傍で行われるようにしてもよい。これによって、複数の施設3に何らかの異常が示唆される状況であるのか否かをより直観的に把握しやすくなる。
「評価値が100となる条件」や「評価値が0となる条件」等、図3を参照して説明したような「評価値の導出方法」、「補正値」等の各種条件に係るデータは、評価基準データ31cとして予め記憶部31に記憶されている。図3は「発電機」に設けられた「軸受」の「振動量」を例としたものであるが、他のセンシング値についても同様であり、各種条件に係るデータが評価基準データ31cに含まれている。また、取得部12によって取得されたセンシング値は、センシングデータ31bとして記憶、蓄積される。
トレンドグラフ表示部M2は、プラント安定度表示部M1の一定期間内の時系列変化を示す。実施形態では、評価部13は、少なくとも当該一定期間内に導出された評価値を示すデータを記憶部31に記憶させ、トレンドグラフ表示部M2の表示に際して当該データを参照する。図5では、トレンドグラフ表示部M2は、表示が行われている時点から48時間前までの期間におけるプラント安定度表示部M1の値の変化が線グラフで示されているが、トレンドグラフ表示部M2の具体的な表示態様は適宜変更可能である。
実施形態では、演算部32が評価部13として機能するとともに表示内容の決定に係る処理(表示データの生成処理)を行うが、これに限られるものでない。評価部13が評価値の導出を行い、評価値に基づいた報知内容の決定に係る処理を評価部13から独立した専用の構成が行うようにしてもよい。
図5に示すように、表示出力部34aによる表示出力内容は、第1表示領域D1、第2表示領域D2に含まれない内容をさらに含んでいてもよい。図5に示す表示内容は、第1表示領域D1、第2表示領域D2に加えて、さらに、リアルタイム値表示部A1、対象名表示部A2、トレンド表示部A3を含んでいる。リアルタイム値表示部A1には、0を超える評価値が導出されたセンシング値の一部又は全部が一覧表示される。リアルタイム値表示部A1には、より高い評価値が導出されたセンシング値が優先して表示されるようにしてもよいし、プラント安定度表示部M1として表示されている評価値が導出された施設3に設けられた他のセンサ4の出力が示すセンシング値が優先して表示されるようにしてもよい。対象名表示部A2には、リアルタイム値表示部A1で一覧表示されたセンシング値がどの施設のどの項目で得られたセンシング値であるのかを示す情報(文字列等)が表示される。トレンド表示部A3では、リアルタイム値表示部A1として選定して表示されたセンシング値の一定期間内の時系列変化を示す表示が行われる。実施形態では、評価部13は、少なくとも当該一定期間内に導出されたセンシング値を示すデータをセンシングデータ31bとして記憶部31に記憶させ、トレンド表示部A3の表示に際してセンシングデータ31bを参照する。
以上、評価装置10が備える出力部34による報知を例とした説明を行ってきたが、報知は端末20(図1参照)によって行われてもよい。図1に示すように、端末20は、通信部21と、報知部22とを備える。通信部21は、通信部11と同様の構成であり、通信部11と通信を行うことで表示出力部34aの表示内容に対応したデータや音声出力部34bの音声出力内容に対応したデータを評価装置10から取得する。報知部22は、出力部34と同様の構成であり、上述のように説明された表示出力部34aと同様の表示出力や音声出力部34bと同様の音声出力を行う。このように、端末20は、プラント2の稼働状況の評価に係る報知を行う報知部22を備える。また、報知部22は、プラント2の稼働状況の評価に係る情報を表示する構成として、表示出力部34aと同様の構成を含む。
なお、図1では、通信部11が通信部5及び通信部21と通信を行っているが、通信部5と通信を行う構成と通信部21と通信を行う構成とは別個の構成であってもよい。
なお、上述の説明において、一例として気温と同一の温度(例えば、20[℃])である場合に評価値が0となるものとしている事項があるが、気温と同一の温度は周囲の温度に影響を受けるものであり、特に季節によって大きく変化する。このため、季節によって分散の上限又は下限が変更されるようあらかじめ条件付けがされていてもよい。この場合、当該条件付けに対応したデータが予め評価基準データ31cに含まれている。また、季節を特定可能なカレンダーとして機能するソフトウェア・プログラムや回路(タイマー回路等)が予め評価装置10に設けられる。
図8は、季節に応じた分散の上限の変更例を示すグラフである。図8は、温度センサであるセンサ4によって温度がセンシングされる場合を想定している。図8では、評価上限E4に対してより遠い値の第1上限E21とより近い値の第2上限E22とが個別に設定されている。第1上限E21と第2上限E22は、ともに上述の上限E2として機能する。すなわち、第1上限E21と第2上限E22との間の変動量SCが、上限E2の季節変動量である。なお、図8では第1上限E21と第2上限E22の2つのみ端的に示しているが、季節を特定可能なカレンダーとして機能するソフトウェア・プログラムや回路(タイマー回路等)等に応じて、評価部13が第1上限E21と第2上限E22との間で多段階的又は無段階的に適用される上限E2を変更するようにしてもよい。
以上、実施形態によれば、評価装置10は、プラント2に含まれる複数の施設3の稼働状況に係る情報を取得する取得部12と、当該情報に基づいてプラント2の全体的な安定度を評価する評価部13とを備える。評価部13は、当該情報に含まれるセンシング値に基づいて施設3の健全度を示す評価値を算出する処理を複数の施設3a,3b,…毎に行い、複数の施設3a,3b,…の各々の評価値x1,x2,…に基づいてプラント2の稼働状況の安定度を示す総合評価値rを算出する。これによって、単純なセンシング値の取得及びその羅列的な報知のみである場合に比して、総合評価値rを確認した者がプラント2の全体的な安定度をより把握しやすくなる。
また、評価部13は、評価値が施設3の正常動作を示さない施設3が複数ある場合にプラント2の稼働状況の評価を単一の施設3の評価値が示す評価よりも下げる。実施形態では、複数の施設で0を超える評価値が導出された場合、プラント安定度表示部M1において表示される評価値が補正されてプラントの健全度評価がより下がったように報知される。これによって、評価値が施設3の正常動作を示さない施設3が複数ある場合にプラント2の稼働状況がより深刻である可能性が高いことが報知内容を確認した者により確実に伝わりやすくなり、より迅速な対応を促しやすくなる。従って、プラント2の稼働状況に応じた適切な対処がなされやすくなる。
また、評価部13は、複数の施設3a,3b,…の評価値のLpノルムとして、プラント2の稼働状況の評価を示す総合評価値rを算出する。これによって、施設3の数によらず、予め定められた数式(式(1)、式(2))に基づいたプラント2の評価を行える。
また、取得部12は、プラント2に含まれる複数の施設3a,3b,…に個別に設けられた複数のセンサ4a,4b,…から複数の施設3a,3b,…の稼働状況に係る情報を取得する。これによって、センサ4の出力を施設3の稼働状況に係る情報として利用できる。
また、図6の例で示すように、センサ4は、設けられた施設3の温度、湿度、圧力、振動、容量、流量、動作速度及び開閉部(例えば、入口弁)の開閉状況のうち少なくとも1つを検知する。これによって、より多様な情報を施設3の稼働状況に係る情報として利用可能になる。
また、複数のセンサ4の一部又は全部と取得部12とは無線通信を介して接続される。これによって、プラント2に対する評価装置10の設置条件をより緩和しやすくなる。また、センサ4を設けるための物理的な制約条件をより緩和しやすくなる。すなわち、センサ4と評価装置10とが必ずしも直結されている必要がなくなることで、センサ4及び評価装置10の設置に係る自由度がより向上する。
また、評価値は、例えば、施設3の正常動作時を含む最も安定した状態から、上述の警報レベルで警戒すべき状況のように施設の異常動作時を含む状態までの範囲を百分率として導出された施設の稼働状況を示す値である。これによって、0から100までの範囲内で表されたより直観的な数値情報でプラント2の稼働状況を把握できる。なお、「安定した状態」は、何の問題もない理想的な稼働状況のみをさすものでなく、その状態が維持される限り問題なく施設3及び当該施設3を含むプラント2が稼働し続けられる状態全般をさす。また、「最も警戒すべき状態」は、プラント2の管理レベルとして設定されるものであり、例えば警報レベルのように異常を解消するための即時対処が必要なことを示す警報が音声等で報知される施設3の稼働状況がこれに該当するが、これに限られるものでない。警報の音声報知は必須でないし、一時的又は新たに生じた事故等の事例に基づいて「最も警戒すべき状態」とされる施設3の稼働状況が変更されることは当然あってよい。
また、実施形態の評価装置10は、プラント2の稼働状況の評価に係る報知を行う報知部14を備える。これによって、端末20を保有していない者でも報知内容を認知する機会を得られる。
また、報知部14は、プラント2の稼働状況の評価に係る情報を表示する表示出力部34aを含む。これによって、プラント2の管理者や作業者等は、表示出力部34aを視認することでプラント2の稼働状況の評価に係る情報を任意のタイミングで容易に確認できる。
なお、上記の実施形態はあくまで一例であり、本発明の技術的特徴を逸脱しない範囲内において適宜変更可能である。例えば、評価装置10は、情報処理装置に限られるものでなく、上述の機能のうち少なくとも取得部12、評価部13の機能を奏するよう設けられた専用の装置であってもよい。
センサ4の出力を評価装置10に伝送するための経路は、通信部5と通信部11とによる無線通信を介したものに限られない。通信部5と通信部11との間の通信回線の一部又は全部は、有線の通信回路を含んでいてもよいし、インターネット等の公共の通信回線網を含んでいてもよい。また、一部又は全部のセンサ4の出力を評価装置10に伝送するための経路は、専用に設けられた直結用のバスであってもよい。
また、図3では評価値の増減の次数が1次である場合を例としているが、評価値の増減の次数は任意である。また、評価値の高低と施設の評価の高低との関係は上述の説明と逆でもよい。
1 評価システム
2 プラント
3 施設
4 センサ
10 評価装置
5,11,21 通信部
12 取得部
13 評価部
14,22 報知部
20 端末
2 プラント
3 施設
4 センサ
10 評価装置
5,11,21 通信部
12 取得部
13 評価部
14,22 報知部
20 端末
Claims (10)
- プラントに含まれる複数の施設の稼働状況に係る情報を取得する取得部と、
前記情報に含まれるセンシング値に基づいて施設の健全度を示す評価値を算出する処理を前記複数の施設毎に行い、前記複数の施設の各々の前記評価値に基づいてプラントの稼働状況の安定度を示す総合評価値を算出する評価部とを備える
評価装置。 - 前記評価部は、前記評価値が施設の正常動作を示さない施設が複数ある場合、単一の施設の評価値が示す安定度よりも低い安定度を示す前記総合評価値を算出する
請求項1に記載の評価装置。 - 前記評価部は、前記複数の施設の評価値のLpノルムとして、前記総合評価値を算出する
請求項1又は2に記載の評価装置。 - 前記取得部は、前記プラントに含まれる複数の施設に個別に設けられた複数のセンサから前記情報を取得する
請求項1から3のいずれか一項に記載の評価装置。 - 前記センサは、設けられた施設の温度、湿度、圧力、振動、容量、流量、動作速度及び開閉部の開閉状況のうち少なくとも1つを検知する
請求項4に記載の評価装置。 - 前記複数のセンサの一部又は全部と前記取得部とは無線通信を介して接続される
請求項4又は5に記載の評価装置。 - 前記評価値は、施設の正常動作時を含む最も安定した状態から施設の異常動作時を含む最も警戒すべき状態までの範囲を百分率として導出された施設の稼働状況を示す値である
請求項1から6のいずれか一項に記載の評価装置。 - 前記プラントの稼働状況の評価に係る報知を行う報知部を備える
請求項1から7のいずれか一項に記載の評価装置。 - 前記報知部は、前記プラントの稼働状況の評価に係る情報を表示する表示部を含む
請求項8に記載の評価装置。 - プラントに含まれる複数の施設に個別に設けられた複数のセンサと、前記複数のセンサの出力に基づいて前記プラントの稼働状況を評価する評価装置と、前記プラントの稼働状況の評価に係る報知を行う報知部を備える端末とを備える評価システムであって、
前記評価装置は、請求項1から8のいずれか一項に記載の評価装置である
評価システム。
Priority Applications (2)
| Application Number | Priority Date | Filing Date | Title |
|---|---|---|---|
| JP2022534837A JP7240563B2 (ja) | 2020-07-29 | 2020-07-29 | 評価装置及び評価システム |
| PCT/JP2020/029064 WO2022024263A1 (ja) | 2020-07-29 | 2020-07-29 | 評価装置及び評価システム |
Applications Claiming Priority (1)
| Application Number | Priority Date | Filing Date | Title |
|---|---|---|---|
| PCT/JP2020/029064 WO2022024263A1 (ja) | 2020-07-29 | 2020-07-29 | 評価装置及び評価システム |
Publications (1)
| Publication Number | Publication Date |
|---|---|
| WO2022024263A1 true WO2022024263A1 (ja) | 2022-02-03 |
Family
ID=80035518
Family Applications (1)
| Application Number | Title | Priority Date | Filing Date |
|---|---|---|---|
| PCT/JP2020/029064 Ceased WO2022024263A1 (ja) | 2020-07-29 | 2020-07-29 | 評価装置及び評価システム |
Country Status (2)
| Country | Link |
|---|---|
| JP (1) | JP7240563B2 (ja) |
| WO (1) | WO2022024263A1 (ja) |
Citations (4)
| Publication number | Priority date | Publication date | Assignee | Title |
|---|---|---|---|---|
| JPH0362101A (ja) * | 1989-07-31 | 1991-03-18 | Hitachi Ltd | プラント運転支援装置 |
| JP2014016691A (ja) * | 2012-07-06 | 2014-01-30 | Hitachi Ltd | 設備維持管理業務支援システム、およびその方法 |
| US20140222379A1 (en) * | 2011-07-15 | 2014-08-07 | European Space Agency | Method and apparatus for monitoring an operational state of a system on the basis of telemetry data |
| JP2015529895A (ja) * | 2012-07-24 | 2015-10-08 | ゼネラル・エレクトリック・カンパニイ | 制御システムの信頼性を改善するためのシステムおよび方法 |
Family Cites Families (3)
| Publication number | Priority date | Publication date | Assignee | Title |
|---|---|---|---|---|
| JP5530019B1 (ja) | 2013-11-01 | 2014-06-25 | 株式会社日立パワーソリューションズ | 異常予兆検知システム及び異常予兆検知方法 |
| JP6458403B2 (ja) | 2014-08-25 | 2019-01-30 | 富士電機株式会社 | 予測モデル生成装置、予測モデル生成方法及びプログラム |
| JP7018297B2 (ja) | 2017-11-16 | 2022-02-10 | 日本電子株式会社 | スペクトル解析装置及び方法 |
-
2020
- 2020-07-29 WO PCT/JP2020/029064 patent/WO2022024263A1/ja not_active Ceased
- 2020-07-29 JP JP2022534837A patent/JP7240563B2/ja active Active
Patent Citations (4)
| Publication number | Priority date | Publication date | Assignee | Title |
|---|---|---|---|---|
| JPH0362101A (ja) * | 1989-07-31 | 1991-03-18 | Hitachi Ltd | プラント運転支援装置 |
| US20140222379A1 (en) * | 2011-07-15 | 2014-08-07 | European Space Agency | Method and apparatus for monitoring an operational state of a system on the basis of telemetry data |
| JP2014016691A (ja) * | 2012-07-06 | 2014-01-30 | Hitachi Ltd | 設備維持管理業務支援システム、およびその方法 |
| JP2015529895A (ja) * | 2012-07-24 | 2015-10-08 | ゼネラル・エレクトリック・カンパニイ | 制御システムの信頼性を改善するためのシステムおよび方法 |
Also Published As
| Publication number | Publication date |
|---|---|
| JP7240563B2 (ja) | 2023-03-15 |
| JPWO2022024263A1 (ja) | 2022-02-03 |
Similar Documents
| Publication | Publication Date | Title |
|---|---|---|
| JP3250147B2 (ja) | 電力系統の周波数特性推定方法および装置 | |
| JP5996384B2 (ja) | プロセス監視診断装置、プロセス監視診断プログラム | |
| JP3923529B2 (ja) | プロセス事象の処理装置および処理方法 | |
| JP6076571B1 (ja) | 情報処理装置、情報処理システム、情報処理方法及びプログラム | |
| US8803702B2 (en) | Instrument status displaying device and instrument status displaying method | |
| DE102013108193A1 (de) | Systeme und Verfahren zur Überwachung von Pumpenkavitation | |
| CN105320122A (zh) | 监视控制系统及监视控制方法 | |
| US20210333768A1 (en) | Control support apparatus, control support method, computer readable medium with control support program recorded thereon and control system | |
| CN119649535A (zh) | 一种变压器火灾的传感数据融合与异常动态权重调整方法 | |
| JP6618846B2 (ja) | 管理装置および制御方法 | |
| EP3239866A1 (en) | Closed loop control and built-in test utilizing reduced order model | |
| EP2631724B1 (en) | Method for measuring health index of plant in which state of lower component is reflected, and computer-readable storage medium in which program for performing the method is stored | |
| WO2022024263A1 (ja) | 評価装置及び評価システム | |
| JP2003208219A (ja) | 異常検知装置および方法 | |
| CN117369392B (zh) | 一种基于多参数逻辑关系的设备故障智能预警方法 | |
| TWI870899B (zh) | 用於最佳化預警管理的誤警評價系統及方法 | |
| EP2954580B1 (en) | Limit based threshold estimation for prognostics and health management | |
| JP7453049B2 (ja) | 異常予兆監視システム、異常予兆監視方法、及びプログラム | |
| JP7240564B1 (ja) | 評価装置及び評価システム | |
| JP5802575B2 (ja) | プラント監視装置、制御方法及び制御プログラム | |
| JP7108806B2 (ja) | 評価装置及び評価システム | |
| JP2021047523A (ja) | 異常予兆検知装置、方法及びプログラム | |
| JP7443840B2 (ja) | 情報処理装置およびプログラム | |
| CN117114248A (zh) | 一种水质监测系统健康度评价方法、计算机设备及介质 | |
| JP2005071136A (ja) | 納期管理支援システム、そのプログラム、そのプログラムを記録した記録媒体および製品の納期管理方法 |
Legal Events
| Date | Code | Title | Description |
|---|---|---|---|
| 121 | Ep: the epo has been informed by wipo that ep was designated in this application |
Ref document number: 20946591 Country of ref document: EP Kind code of ref document: A1 |
|
| ENP | Entry into the national phase |
Ref document number: 2022534837 Country of ref document: JP Kind code of ref document: A |
|
| NENP | Non-entry into the national phase |
Ref country code: DE |
|
| 122 | Ep: pct application non-entry in european phase |
Ref document number: 20946591 Country of ref document: EP Kind code of ref document: A1 |