WO2021241061A1 - 情報処理装置、情報処理方法、コンピュータプログラム、およびターゲット分子検出システム - Google Patents
情報処理装置、情報処理方法、コンピュータプログラム、およびターゲット分子検出システム Download PDFInfo
- Publication number
- WO2021241061A1 WO2021241061A1 PCT/JP2021/015679 JP2021015679W WO2021241061A1 WO 2021241061 A1 WO2021241061 A1 WO 2021241061A1 JP 2021015679 W JP2021015679 W JP 2021015679W WO 2021241061 A1 WO2021241061 A1 WO 2021241061A1
- Authority
- WO
- WIPO (PCT)
- Prior art keywords
- signal
- immunostaining
- information processing
- target molecule
- conditions
- Prior art date
- Legal status (The legal status is an assumption and is not a legal conclusion. Google has not performed a legal analysis and makes no representation as to the accuracy of the status listed.)
- Ceased
Links
Images











Classifications
-
- G—PHYSICS
- G01—MEASURING; TESTING
- G01N—INVESTIGATING OR ANALYSING MATERIALS BY DETERMINING THEIR CHEMICAL OR PHYSICAL PROPERTIES
- G01N1/00—Sampling; Preparing specimens for investigation
- G01N1/28—Preparing specimens for investigation including physical details of (bio-)chemical methods covered elsewhere, e.g. G01N33/50, C12Q
- G01N1/30—Staining; Impregnating ; Fixation; Dehydration; Multistep processes for preparing samples of tissue, cell or nucleic acid material and the like for analysis
-
- G—PHYSICS
- G01—MEASURING; TESTING
- G01N—INVESTIGATING OR ANALYSING MATERIALS BY DETERMINING THEIR CHEMICAL OR PHYSICAL PROPERTIES
- G01N21/00—Investigating or analysing materials by the use of optical means, i.e. using sub-millimetre waves, infrared, visible or ultraviolet light
- G01N21/62—Systems in which the material investigated is excited whereby it emits light or causes a change in wavelength of the incident light
- G01N21/63—Systems in which the material investigated is excited whereby it emits light or causes a change in wavelength of the incident light optically excited
- G01N21/64—Fluorescence; Phosphorescence
-
- G—PHYSICS
- G01—MEASURING; TESTING
- G01N—INVESTIGATING OR ANALYSING MATERIALS BY DETERMINING THEIR CHEMICAL OR PHYSICAL PROPERTIES
- G01N21/00—Investigating or analysing materials by the use of optical means, i.e. using sub-millimetre waves, infrared, visible or ultraviolet light
- G01N21/62—Systems in which the material investigated is excited whereby it emits light or causes a change in wavelength of the incident light
- G01N21/63—Systems in which the material investigated is excited whereby it emits light or causes a change in wavelength of the incident light optically excited
- G01N21/64—Fluorescence; Phosphorescence
- G01N21/6428—Measuring fluorescence of fluorescent products of reactions or of fluorochrome labelled reactive substances, e.g. measuring quenching effects, using measuring "optrodes"
-
- G—PHYSICS
- G01—MEASURING; TESTING
- G01N—INVESTIGATING OR ANALYSING MATERIALS BY DETERMINING THEIR CHEMICAL OR PHYSICAL PROPERTIES
- G01N33/00—Investigating or analysing materials by specific methods not covered by groups G01N1/00 - G01N31/00
- G01N33/48—Biological material, e.g. blood, urine; Haemocytometers
-
- G—PHYSICS
- G01—MEASURING; TESTING
- G01N—INVESTIGATING OR ANALYSING MATERIALS BY DETERMINING THEIR CHEMICAL OR PHYSICAL PROPERTIES
- G01N33/00—Investigating or analysing materials by specific methods not covered by groups G01N1/00 - G01N31/00
- G01N33/48—Biological material, e.g. blood, urine; Haemocytometers
- G01N33/483—Physical analysis of biological material
-
- G—PHYSICS
- G01—MEASURING; TESTING
- G01N—INVESTIGATING OR ANALYSING MATERIALS BY DETERMINING THEIR CHEMICAL OR PHYSICAL PROPERTIES
- G01N33/00—Investigating or analysing materials by specific methods not covered by groups G01N1/00 - G01N31/00
- G01N33/48—Biological material, e.g. blood, urine; Haemocytometers
- G01N33/50—Chemical analysis of biological material, e.g. blood, urine; Testing involving biospecific ligand binding methods; Immunological testing
- G01N33/53—Immunoassay; Biospecific binding assay; Materials therefor
-
- G—PHYSICS
- G01—MEASURING; TESTING
- G01N—INVESTIGATING OR ANALYSING MATERIALS BY DETERMINING THEIR CHEMICAL OR PHYSICAL PROPERTIES
- G01N21/00—Investigating or analysing materials by the use of optical means, i.e. using sub-millimetre waves, infrared, visible or ultraviolet light
- G01N21/62—Systems in which the material investigated is excited whereby it emits light or causes a change in wavelength of the incident light
- G01N21/63—Systems in which the material investigated is excited whereby it emits light or causes a change in wavelength of the incident light optically excited
- G01N21/64—Fluorescence; Phosphorescence
- G01N21/6428—Measuring fluorescence of fluorescent products of reactions or of fluorochrome labelled reactive substances, e.g. measuring quenching effects, using measuring "optrodes"
- G01N2021/6439—Measuring fluorescence of fluorescent products of reactions or of fluorochrome labelled reactive substances, e.g. measuring quenching effects, using measuring "optrodes" with indicators, stains, dyes, tags, labels, marks
Definitions
- This technology relates to information processing equipment, information processing methods, computer programs, and target molecule detection systems.
- a flow cytometer or a microscope is used to detect and / or analyze molecules such as antigen proteins using antibodies labeled with a plurality of fluorescent dyes.
- the detection and analysis of molecules by nucleic acid hybridization using a fluorescently labeled nucleic acid probe and the detection and analysis of enzyme molecules using a fluorescently labeled substrate have been widely performed.
- Various fluorescent dyes have been used in these detections and / or analyzes. Each fluorescent dye has unique properties, such as a unique fluorescence spectrum and fluorescence intensity.
- Patent Document 1 describes an invention relating to a technique for analyzing the type of fluorescence emitted from fine particles (paragraph 0001).
- detection data obtained by simultaneously detecting fluorescence emitted from fine particles flowing through a flow path in a plurality of wavelength regions is obtained by integrating or averaging a plurality of fine particles.
- a data display method for displaying a fluorescence spectrum. (Claim 1) is described.
- the reactivity determines the detection accuracy. Is also affected. In addition, the detection accuracy may decrease due to the binding and / or adsorption of the bound molecule to a molecule other than the target molecule.
- the setting of the staining conditions using the reagent containing the binding molecule is performed by the user who performs the detection and / or analysis, and the user is experienced.
- it is a laborious task.
- it cannot be denied that the set staining conditions are not suitable for the detection and / or analysis of the target molecule.
- the main purpose of this technique is to provide a technique for supporting the setting of staining conditions with a reagent containing a binding molecule when detecting and / or analyzing a target molecule.
- a signal acquisition unit that acquires signals derived from samples including biological samples
- a processing unit that calculates immunostaining conditions for reagents for the sample based on the signal
- It has an output unit that outputs the immunostaining condition, and has.
- the signal provides an information processing apparatus comprising a target molecule in the biological sample and a signal derived from the reagent including a binding molecule capable of binding to the target molecule and / or a signal derived from a non-target molecule and the reagent. ..
- the signal can include at least one of a signal, a specific signal / background, and a specific signal / non-specific signal.
- the processing unit can calculate the immunostaining condition of the reagent for the sample including the biological sample based on the signal derived from the sample stained with a plurality of reagent concentrations and the threshold value.
- the threshold can be the largest of the signals from the sample stained with multiple reagent concentrations.
- the processing unit calculates immunostaining conditions for the reagent for the sample containing the biological sample based on the signal derived from the sample stained with at least one reagent concentration and the reagent information taken into consideration from the database. Can be done.
- the processing unit calculates the immunostaining conditions of the reagent for the sample containing the biological sample based on the signal derived from the sample stained with the plurality of reagent concentrations, the region information, and the threshold value extracted by the above.
- the processing unit can identify the region based on the signal and / or the brightfield image.
- the region can include morphological information of the biological sample.
- the morphological information can include the distribution of cell membranes and nuclei, or the cell morphology obtained by segmentation.
- the processing unit can compare the specified plurality of the regions.
- the processing unit can analyze the localization of the region by comparing a plurality of the regions including at least one of a cell membrane, a cell nucleus, a specific binding region or a non-specific binding region. When the plurality of identified regions are single cells, the processing unit can exclude signals from single cells that are superimposed and / or adjacent within a predetermined distance.
- the signal acquisition unit can acquire the fluorescence signal after autofluorescence separation and / or dye intercolor separation.
- the output unit can output at least one of antibody clone, antibody concentration, antigen-antibody reaction time, reaction temperature, antigen activation condition, reaction solution composition, and stirring condition as the immunostaining condition.
- the information processing apparatus may further include a presenting unit that presents support information for the staining conditions to the user based on the output immunostaining conditions.
- a signal acquisition process for acquiring signals derived from samples including biological samples and A processing step of calculating immunostaining conditions for reagents for the sample based on the signal, and It has an output step of outputting the immunostaining condition and
- the signal comprises a signal derived from a reagent containing a target molecule in the biological sample and a binding molecule capable of binding to the target molecule and / or a signal derived from a non-target molecule and the reagent. It also provides information processing methods.
- this technology has a signal acquisition function that acquires signals derived from samples including biological samples.
- the signal comprises a signal derived from a reagent containing a target molecule in the biological sample and a binding molecule capable of binding to the target molecule and / or a signal derived from a non-target molecule and the reagent. It also provides computer programs.
- a signal acquisition unit that acquires signals derived from samples including biological samples, and A processing unit that calculates immunostaining conditions for reagents for the sample based on the signal, and An output unit that outputs the immunostaining conditions and A detector for detecting a signal derived from the sample stained based on the output immunostaining condition, and a detection unit.
- the signal comprises a signal derived from a reagent containing a target molecule in the biological sample and a binding molecule capable of binding to the target molecule and / or a signal derived from a non-target molecule and the reagent.
- a target molecule detection system is also provided.
- the target molecule detection system according to the present technology may further include a staining unit for staining the sample using the reagent.
- the target molecule detection system according to the present technology may further include an analysis unit that analyzes the sample based on the signal detected by the detection unit.
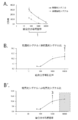
- FIG. 1A is a drawing-substituting graph showing the relationship between the concentration of bound molecules and the light intensity.
- FIG. 1B is a drawing-substituting graph showing the relationship between the concentration of bound molecules and the specific signal / non-specific signal ratio. It is a block diagram which shows an example of the information processing apparatus 1 which concerns on this technique.
- FIG. 3A is a drawing substitute graph showing the relationship between the concentration of the bound molecule and the light intensity.
- reaction efficiency greatly depends on the reaction conditions. That is, it takes labor and skill to efficiently search for appropriate conditions showing a high specific reaction and a low non-specific reaction.
- the antibody concentration when evaluating with a signal, if the antibody concentration is too high, not only the specific signal but also the non-specific signal becomes high, and the whole signal becomes high. Therefore, under the optimum antibody concentration condition in which the antibody concentration is lowered, the non-specific signal becomes low while the specific signal shows a high value. However, if the antibody concentration is further lowered, the concentration including the specific signal will be lowered.
- the ratio goes down. Therefore, under the optimum antibody concentration condition in which the antibody concentration is lowered, the signal / background ratio becomes high because the non-specific signal becomes low while the specific signal shows a high value. However, if the antibody concentration is further lowered, the signal as a whole becomes low, the signal including the specific signal is lowered, and the signal / background ratio is lowered.
- the non-specific signal becomes close to 0 in pixel units, so that the signal / background ratio becomes high, and when the antibody concentration is further lowered, the ratio of the signal showing 0 becomes high, so that the signal is signaled. / The background ratio may also decrease.
- FIG. 1A is a drawing-substituting graph showing the relationship between the concentration of bound molecules and the light intensity.
- FIG. 1B is a drawing-substituting graph showing the relationship between the concentration of bound molecules and the specific signal / non-specific signal ratio.
- the detection accuracy varies greatly depending on the selection of the concentration of the reagent and the like. Therefore, if appropriate staining conditions for the target molecule and the reagent containing the binding molecule can be calculated, complicated operations by the user can be simplified and the detection accuracy can be improved.
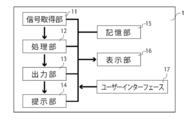
- FIG. 2 is a block diagram showing an example of the information processing apparatus 1 according to the present technology.
- the information processing apparatus 1 according to the present technology includes at least a signal acquisition unit 11, a processing unit 12, and an output unit 13. Further, if necessary, a presentation unit 14, a storage unit 15, a display unit 16, a user interface 17, and the like can be provided. Hereinafter, each part and the like will be described in detail.
- a target molecule is a molecule that can be detected and / or analyzed by binding to a binding molecule described later, and can be appropriately selected by those skilled in the art.
- Target molecules include, for example, molecules that can be detected and / or analyzed by binding to a binding molecule in analysis such as flow cytometry, microscopic observation, Western blotting, various arrays, and ELISA. That is, this technique can be used to support the setting of reaction conditions with the bound molecule used in these analyses.
- the target molecule is, for example, a molecule that can exist in a living body, and examples thereof include a biomolecule, a drug molecule, and a harmful molecule.
- biomolecules include nucleic acids, proteins, sugars, lipids, vitamins and the like.
- nucleic acids include DNA and RNA.
- proteins include antigen proteins, enzyme proteins, structural proteins, adhesive proteins and the like.
- the binding molecule is a molecule capable of detecting and / or analyzing the target molecule by binding to the target molecule described above, and can be appropriately selected by those skilled in the art.
- the bound molecule include molecules capable of detecting and / or analyzing the target molecule by binding to the target molecule in the various analyzes described above.
- the binding molecule is, for example, a molecule that can exist in a living body, and examples thereof include a biomolecule and a drug molecule.
- biomolecules include nucleic acids, proteins, sugars, lipids, vitamins, labeled molecules and the like.
- nucleic acids include DNA and RNA.
- proteins include antibody proteins, cell surface markers, enzyme proteins, structural proteins, adhesive proteins and the like.
- the labeled molecule that labels the bound molecule may be bound to the bound molecule.
- the bound molecule to which the labeled molecule is bound may be bound to the target molecule, thereby enabling the detection and / or analysis of the target molecule.
- Examples of the labeled molecule include molecules that can be used as the labeled molecule in the above-mentioned various analyses.
- the labeling molecule may be, for example, a dye or the like.
- the dye include various fluorescent dyes having a fluorescent wavelength in the visible light region, and examples thereof include an AlexaFluor® series fluorescent dye, a DyLight® series fluorescent dye, and a BD Horizon Brilliant (registered). Fluorescent dyes of the (trademark) series can be mentioned, but the present technology is not limited to these.
- the labeled molecule may be expressed as a target molecule or a part of a binding molecule, and may be, for example, a fluorescent protein contained in a fluorescent fusion protein.
- the fluorescent protein include GFP, BFP, CFP, EGFP, EYFP, PA-GFP and the like.
- Fluorescent immunostaining includes, for example, immunocytochemistry (ICC), immunohistochemistry (IHC) and the like.
- ICC is a method of staining cells isolated from tissues or cultured cells.
- IHC is a method of staining a target molecule within a thin section of tissue.
- the fluorescent immunostaining includes a direct fluorescent immunostaining method and an indirect fluorescent immunostaining method.
- the direct fluorescent immunostaining method is a method in which an antibody to which a fluorescent dye is bound directly binds to a target molecule and the fluorescent dye is detected to analyze the target molecule.
- an antibody to which a fluorescent dye is bound also referred to as "secondary antibody”
- binds to an antibody specifically bound to a target molecule also referred to as "primary antibody”
- an antibody to which a fluorescent dye is bound (also referred to as a "secondary antibody”) binds to a target molecule via a primary antibody and detects the fluorescent dye to detect the fluorescent dye of the target molecule.
- the method by which the analysis is performed is performed.
- the immunostaining conditions for the secondary antibody and the primary antibody can be calculated by the processing unit 12 described later.
- This technique can be applied to both direct fluorescent immunostaining and indirect fluorescent immunostaining, but the direct fluorescent immunostaining method has fewer reaction steps, so there is less variation and higher quantification. preferable.
- This technique can be suitably used for setting the reaction conditions of the antigen-antibody reaction performed in fluorescent immunostaining.
- Signal acquisition unit 11 acquires a signal derived from a sample including a biological sample. For example, a signal detected by a flow cytometer, a microscope, various photodetectors, or the like is acquired by the signal acquisition unit 11.
- the signal acquisition unit 11 can acquire not only the signals detected by various detection devices but also the signal data in the database stored in the storage unit 15 described later. For example, past detection data, data detected by another detection device and stored in a database, and the like can also be acquired by the signal acquisition unit 11.
- the signal acquisition unit 11 can acquire the fluorescence signal after autofluorescence separation and / or dye intercolor separation.
- the processing unit 12 calculates the immunostaining conditions of the reagent for the sample based on the signal acquired by the signal acquisition unit 11.
- the immunostaining conditions calculated in this technique include, for example, antibody clones, concentration of bound molecule (antibody), pH, temperature, antigen-antibody reaction time, antigen activation conditions, treatment conditions such as stirring conditions, and composition of reaction solution. , Selection of buffer type, enzyme treatment conditions, ionic strength, ionic type, ion concentration, stirring conditions, etc., are conditions for advancing the immunostaining reaction.
- the signal used for calculating the immunostaining condition is a signal derived from a reagent containing the target molecule in the biological sample and a binding molecule capable of binding to the target molecule, and / or a signal derived from the non-target molecule and the reagent. It is characterized by including.
- the signal may be a fluorescent signal itself, a specific signal / background, a specific signal / non-specific signal, or the like.
- the fluorescent signal may be a pixel unit such as a signal / pixel, or as described later, from morphological information (tissue, cell membrane, nuclear distribution, stroma, cytoplasm, etc.) determined based on the signal, a cell. It is also possible to perform segmentation to obtain cell units such as average fluorescent signal / cell and total fluorescent signal / cell.
- the thickness of the section of the pathological tissue specimen is several micrometers.
- the thickness used for immunostaining is about 4 micrometers, but some cells range from several micrometers to more than several tens of micrometers. Therefore, depending on the size of the cells contained in the section, the amount of the target molecule contained may change, which may affect the staining signal obtained by immunostaining.
- a reagent for a sample containing the biological sample is used based on a signal obtained when the concentration of the binding molecule (reagent concentration) is changed and a threshold value.
- a method of calculating immunostaining conditions can be mentioned. That is, the processing unit 12 can calculate the immunostaining condition of the reagent for the sample containing the biological sample based on the signal derived from the sample stained with the plurality of reagent concentrations and the threshold value.
- the threshold value is not limited to the method of setting the threshold value of the luminance signal, but for example, the average value of the background signal of the unstained sample data, the average value double standard deviation, or the value obtained by adding the triple standard deviation. May be used. Further, the maximum value of the unstained sample data, the half value of the maximum value, and the like may be used. Further, it is also possible to use a value obtained by adding an average value, a 2-fold standard deviation, or a 3-fold standard deviation of the bag ground signal arbitrarily selected from the stained sample data, or a maximum value or a half value of the maximum value.
- P-tile method discriminant analysis method, Minimum Error method, differential histogram method, Laplacian histogram method, mean adjacency threshold determination method, minimum complex binarization method, moving average method, domain decomposition method.
- the threshold can be set by using a method or the like.
- FIG. 3A is a drawing substitute graph showing the relationship between the concentration of the bound molecule (reagent concentration) and the light intensity.
- 3B and B' are drawing-substituting graphs showing the relationship between the concentration of the bound molecule (reagent concentration) and the specific signal / non-specific signal ratio.
- the processing unit 12 selects a bound molecule concentration (reagent concentration) at which specific signal> non-specific signal (see FIG. 3A, reference numeral 1).
- the binding molecule concentration (reagent concentration) that is the inflection point of the specific signal / non-specific signal ratio is selected (see FIG. 3B reference numeral 2).
- the binding molecule concentration (reagent concentration) at which the value of the specific signal is sufficient and the specific signal / non-specific signal ratio is maximized is selected (see FIG. 3B'reference numeral 3).
- the bound molecule and the target molecule having a single concentration can be referred to. From the signal obtained by reacting with, the signal when the binding molecule of another concentration is reacted with the target molecule can be calculated.
- the processing unit 12 calculates immunostaining conditions for the reagent for the sample containing the biological sample based on the signal derived from the sample stained with at least one reagent concentration and the reagent information taken into consideration from the database. can do.
- the calibration curve created from the accumulated signal data it is not necessary to measure the concentration of the bound molecule, and only by reacting the bound molecule with a single concentration with the target molecule. It is possible to calculate the signal when a binding molecule of another concentration is used.
- the calibration curve of each antibody clone or fluorescently labeled antibody (clone) may be referred to from the database.
- immunostaining conditions can be calculated, but when the proportion of signals showing zero increases, the area or area that should be originally detected decreases, and the area that should be detected decreases. There is a problem that information and morphological information cannot be obtained.
- the processing unit 12 calculates the immunostaining conditions of the reagent for the sample containing the biological sample based on the signal derived from the sample stained with the plurality of reagent concentrations and the threshold value extracted from the region information. be able to.
- the processing unit 12 can specify the region based on the signal and / or the bright field image.
- the region can also include morphological information of the biological sample (tissue, cell membrane, nuclear distribution, interstitium, cytoplasm, etc.).
- the method of defining the region is not particularly limited, but the cell nucleus is stained with a binding molecule for staining the cell nucleus, for example, DAPI (4', 6-Diamidino-2-phenylindole), Hoechst, PI (Propidium Iodide). It is possible to determine the distribution of the nucleus and the morphology of the cell membrane, cytoplasm, etc. by using the binding molecule for detecting the target molecule existing in the cell membrane, cytoplasm, etc.
- the region based on the specific signal can be sufficiently extracted. For example, in the case of membrane staining, it can be judged that it is sufficient if the membrane staining is continuous over a certain level, and in the case of nuclear staining, it can be judged that it is sufficient if the area of nuclear staining is above a certain level. ..
- the area in the sample it is possible to provide visual information to the user. Specifically, for example, by staining the cell nucleus to determine the distribution of the nucleus, it becomes easier to analyze the cell unit, or by staining the cell membrane or cytoplasm to determine the region (morphology) such as the cell membrane or cytoplasm. , It becomes easy to distinguish whether it is a cell membrane or not. Further, by specifying the region in the sample, the quantitativeness can be improved, and it becomes easy to distinguish between the specific staining and the non-specific staining.
- ⁇ Nuclear staining> When detecting a target molecule existing in a nuclear region such as Ki-67, a progesterone receptor, an estrogen receptor, which is a growth-related gene for breast cancer, a method for calculating staining conditions with a labeled antibody used for detection is exemplified.
- the cell nucleus is subjected to the binding molecule for staining the cell nucleus such as DAPI (4', 6-Diamidino-2-phenylindole), Hoechst, PI (Propidium Iodide). Stain to determine the morphological information (region) of the nucleus.
- DAPI 6-Diamidino-2-phenylindole
- Hoechst PI
- PI Propidium Iodide
- ⁇ Cell membrane> When detecting a target molecule present in the cell membrane of T cells such as CD8 and CD4, a method for calculating staining conditions with a labeled antibody used for detection is exemplified.
- a molecule different from the target molecule (for example, CD3) existing on the cell membrane of T cells is stained with a labeled antibody different from the labeled antibody used for detecting the target molecule, and the region (morphology) of the cell membrane is determined. ..
- ⁇ Cytoplasm> An example of a method for calculating staining conditions with a labeled antibody used for detection when detecting a target molecule present in the cytoplasm such as cytokeratin.
- cytoplasmic region morphology
- the processing unit 12 can also compare a plurality of the specified regions.
- the processing unit 12 can analyze the localization of the region by comparing a plurality of said regions including at least one of a cell membrane, a cell nucleus, a specific binding region, or a non-specific binding region.
- a binding molecule DAPI (4', 6-Diamidino-2-phenylindole), Hoechst, PI (Propidium Iodide), etc.
- the position of the nucleus can be determined by comparing multiple regions.
- the observation method for defining the area is not particularly limited, and may be any of bright field observation, dark field observation, and oblique illumination observation.
- the image used for defining the region may be a raw image, but an image processed image may also be used.
- the signal may be excluded by using the threshold value of the luminance signal, or an image from which the signal has been extracted, a multi-valued image, a binarized image, or the like may be used.
- a specific staining evaluation algorithm may be applied from the staining form for the image after autofluorescence separation or fluorescent dye color separation.
- an image converted into the number of bound molecules may be used instead of the light intensity. By using the image converted into the number of bound molecules (antibodies), comparison can be made even between bound molecules using different dyes and the like.
- the method of setting the luminance signal threshold is not limited, but for example, the average value of the background signal of the unstained sample data, the average value double standard deviation, or the value obtained by adding the triple standard deviation may be used. Further, the maximum value of the unstained sample data, the half value of the maximum value, and the like may be used. Further, it is also possible to use a value obtained by adding an average value, a 2-fold standard deviation, or a 3-fold standard deviation of the bag ground signal arbitrarily selected from the stained sample data, or a maximum value or a half value of the maximum value.
- P-tile method discriminant analysis method, Minimum Error method, differential histogram method, Laplacian histogram method, mean adjacency threshold determination method, minimum complex binarization method, moving average method, domain decomposition method.
- the threshold can be set by using a method or the like.
- the method for extracting the region is not particularly limited, but for example, region extraction by feature quantity extraction, region extraction by defect complementation, or the like can be appropriately selected. Further, regions and morphologies (tissue, cell membrane, nuclear distribution, interstitium, cytoplasm, etc.) extracted by template matching, pattern recognition, and image segmentation can also be used. Specifically, for example, a binary mask including a segmented region is created by calculating an image gradient and calculating a threshold value. If necessary, adjust the binary mask area using structuring elements and the like. If necessary, the blank area existing in the mask area is filled. If there are other objects or debris that come into contact with the segmented object, the connectivity of the pixels can be evaluated and weighted to increase or decrease or exclude them. If desired, structuring elements can also be used to smooth the mask area. By applying a mask area to the original image, the area can be extracted.
- the inside of the mask region is defined as a signal or specific staining region derived from a reagent containing a binding molecule capable of binding to the target molecule, and the other regions are defined as a non-target molecule and a signal or non-specific staining region derived from the reagent. Can be defined.
- the inside of the mask region can be used as a signal derived from the non-target molecule and the reagent or a non-specific staining region.
- each region of the reagent-derived signal or specific staining region containing the binding molecule capable of binding to the target molecule and the non-target molecule and the reagent-derived signal or non-specific staining region. By doing so, each region can be extracted independently.
- This technique can be used in analysis such as flow cytometry, microscopic observation, western blots, various arrays, and ELISA.
- the processing unit 12 excludes signals derived from the single cells adjacent to each other within a predetermined distance, and then superimposes and / or removes signals derived from adjacent single cells, and then performs the area staining conditions. It is also possible to make calculations.
- the immunostaining conditions can be calculated.
- the amount of the target molecule contained may change depending on the size of the cells contained in the section, which may affect the staining signal obtained by immunostaining.
- the total brightness or total area of cell nucleus staining (DAPI, etc.) is above a certain level, or the total brightness or total area of nuclear staining per cell in the photographed image is higher than the distribution. It is also possible to calculate the immunostaining conditions after making a certain ratio or more effective. As a result, variation in the staining signal can be suppressed.
- the information processing apparatus 1 may include an output unit 13 that outputs information processed by the processing unit 12.
- the output unit 13 has various information regarding the presentation of the immunostaining conditions calculated above, the immunostaining conditions such as the set threshold value, and various other detections for presenting the immunostaining conditions. Information and the like can also be output.
- the output unit 13 outputs at least one of antibody clone, antibody concentration, antigen-antibody reaction time, reaction temperature, antigen activation condition, reaction solution composition, and stirring condition as the immunostaining condition. can do.
- the presentation unit 14 presents the support information of the staining conditions to the user based on the immunostaining conditions output by the output unit 13.
- the dyeing conditions were set by the user's self-confidence, so that the dyeing conditions may not be appropriate, and even if the user has a lot of experience, it is a very time-consuming task.
- the present technology based on the immunostaining conditions calculated by the processing unit 12 and output by the output unit 13, for example, depending on the type of target molecule to be detected or analyzed, the state of the sample, or the like. Since the optimum immunostaining conditions are presented, highly accurate detection can be performed regardless of the user's experience value.
- the presentation unit 14 is not indispensable, and it is possible for a dyeing device or the like to automatically dye a sample without the intervention of a user.
- the immunostaining conditions output by the output unit 13 are directly output to various staining devices, and the various staining devices automatically stain the sample based on the immunostaining conditions acquired by the various staining devices. Is also possible.
- Storage unit 15 The information processing apparatus 1 according to the present technology may be provided with a storage unit 15 for storing various types of information.
- various information regarding the presentation of immunostaining conditions such as information processed by the processing unit 12, various signals, various thresholds, and various other information regarding detection performed for presenting the immunostaining conditions, etc. Data can be accumulated and stored.
- the storage unit 15 is not essential for the information processing device 1 according to the present technology, and it is also possible to output each information from the output unit 13 to the outside of the device and store it in an external storage device 21 as described later. be.
- the storage device 21 can be provided in a cloud environment, and can be connected to the information processing device 1 according to the present technology via a network. In this case, various information stored in the storage device 21 on the cloud can be shared by a plurality of users.
- the information output by the output unit 13, the detection data detected by the external detection devices 41A to 41D and the like as shown in FIG. 8 described later, and other samples are used.
- a database can be constructed based on the collected detection data and the like.
- the processing unit 12 can also perform various processing by referring to the database.
- the detection data detected by the external detection devices 41A to 41D, etc., the detection data collected by other samples, etc. the user does not actually perform the measurement by himself / herself. However, it is possible to calculate the reaction condition between the target molecule and the bound molecule and set a threshold value.
- Display unit 16 The information processing apparatus 1 according to the present technology may be provided with a display unit 16 for displaying various information output by the output unit 13.
- a display unit 16 for example, a general display device such as a display or a printer can be used.
- the information processing apparatus 1 may further be provided with a user interface 17 for the user to operate. The user can access each part and control each part through the user interface 17.
- the user interface 17 is not essential, and an external operating device may be connected.
- an external operating device for example, a mouse, a keyboard, or the like can be used.
- FIG. 4 is a conceptual diagram showing an example of the information processing system 2 according to the present technology.
- the information processing system 2 according to the present technology includes the information processing device 1 of the present technology described above and the storage device 21 for storing the information processed by the information processing device 1. Further, the information processing system 2 according to the present technology may be provided with a display device 22, a user interface 23, or the like, if necessary. Since the details of the information processing apparatus 1 are the same as the details of the information processing apparatus 1 of the present technology described above, the description thereof is omitted here. Further, the details of the storage device 21, the display device 22, and the user interface 23 are the same as the details of the storage unit 15, the display unit 16, and the user interface 17 of the information processing device 1 of the present technology described above, respectively. I will omit the explanation.
- FIG. 5 is a block diagram showing an example of the target molecule detection device 3 according to the present technology.
- the target molecule detection device 3 according to the present technology includes a detection unit 31 for detecting a signal derived from a sample including a biological sample, a signal acquisition unit 11, a processing unit 12, and an output unit 13. Further, the target molecule detection device 3 according to the present technology may be provided with a presentation unit 14, a storage unit 15, a display unit 16, a user interface 17, a staining unit 32, an analysis unit 33, and the like, if necessary.
- the details of the signal acquisition unit 11, the processing unit 12, the output unit 13, the presentation unit 14, the storage unit 15, the display unit 16, and the user interface 17 are described in detail in the signal acquisition unit 11, the processing unit 12, and the output unit of the information processing apparatus 1 described above. Since the details are the same as those of 13, the presentation unit 14, the storage unit 15, the display unit 16, and the user interface 17, the description thereof is omitted here.
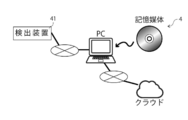
- FIG. 6 is a conceptual diagram showing an example of the target molecule detection system 4 according to the present technology.
- the target molecule detection system 4 according to the present technology includes a detection device 41 for detecting a signal derived from a sample including a biological sample, and an information processing device 1 according to the above-mentioned technology. Further, the target molecule detection system 4 according to the present technology includes a storage unit 15, a storage device 21, a display device 22, a user interface 23, a dyeing unit 32 and a dyeing device 42, an analysis unit 33 and an analysis device 43, as necessary. Etc. can also be provided. Since the details of the information processing apparatus 1 are the same as the details of the information processing apparatus 1 described above, the description thereof is omitted here. Further, the details of the storage unit 15, the storage device 21, the display device 22, and the user interface 23 are the same as the details of the storage unit 15, the display unit 16, and the user interface 17 of the information processing device 1 of the present technology described above. The explanation is omitted here.
- FIG. 7 is a conceptual diagram showing an example different from FIG. 6 of the target molecule detection system 4 according to the present technology.
- the target molecule detection system 4 according to the present technology includes a detection device 41 for detecting a signal derived from a sample including a biological sample, and a computer program described later.
- Detection unit 31, detection device 41 detect signals derived from a sample including a biological sample. Further, the detection unit 31 and the detection device 41 can also detect a signal derived from the sample stained based on the immunostaining condition information output from the output unit 13.
- the detection unit 31 and the detection device 41 that can be used in the present technology, if the signal emitted from the sample including the biological sample can be detected, the general detection unit 31 and the detection device 41 can be freely used. can.
- the detection unit 31 and the detection device 41 that can be used in analysis such as flow cytometry, microscopic observation, Western blotting, various arrays, and ELISA can be mentioned.
- the information processing device 1 and / or the storage device 21 can be provided in a cloud environment and connected to the detection device 41 via a network.
- various information stored in the storage device 21 on the cloud can be shared by a plurality of users.
- a plurality of detection devices 41A to 41D are connected to the information processing device 1 and / or the storage device 21 via a network, and the plurality of detection devices 41A to 41D are used. It is also possible to use the detected signal to process the information processing device 1 and share the immunostaining conditions output from the information processing device 1 among the plurality of detection devices 41A to 41D.
- the staining unit 32 and the staining apparatus 42 stain the sample including the biological sample using a reagent containing a binding molecule that can bind to the target molecule in the biological sample.
- the sample can be stained under the optimum conditions based on the immunostaining conditions output from the output unit 13. As a result, the accuracy of target molecule detection can be improved.
- the staining unit 32 and the staining device 42 are not essential in the target molecule detection device 3 and the target molecule detection system 4 according to the present technology, and are externally stained based on the immunostaining conditions output from the output unit 13. It is also possible to stain the sample using an apparatus or the like.
- Analysis unit 33, analysis device 43 analyze the sample based on the signals detected by the detection unit 31 and the detection device 41. More specifically, it is possible to analyze the type, amount, properties and the like of cells contained in the sample based on the signals detected by the detection unit 31 and the detection device 41.
- the analysis unit 33 and the analysis device 43 are not essential in the target molecule detection device 3 and the target molecule detection system 4 according to the present technology, and are external based on the signals detected by the detection unit 31 and the detection device 41. It is also possible to analyze the characteristics of the target molecule in the sample using an analyzer or the like.
- the analysis unit 33 and the analysis device 43 may be implemented by a personal computer or a CPU, and are programmed into a hardware resource including a recording medium (for example, a non-volatile memory (USB memory), an HDD, a CD, etc.). It is also possible to store it as and make it function by a personal computer or CPU.
- the analysis unit 33 and the analysis device 43 may be connected to each unit of the target molecule detection device 3 and the target molecule detection system 4 via a network.
- the computer program according to the present technology has a signal acquisition function for acquiring a signal derived from a sample including a biological sample, a processing function for calculating immunostaining conditions for a reagent for the sample containing the biological sample based on the signal, and the immunity. It is a program to realize the output function to output the dyeing conditions and the computer.
- the computer program related to this technology is recorded on an appropriate recording medium. Further, the computer program according to the present technology can be stored in a cloud environment or the like, and can be downloaded and used by a user to a personal computer or the like through a network.
- the signal acquisition function, processing function, and output function in the computer program according to the present technology are the same as the functions performed by the signal acquisition unit 11, the processing unit 12, and the output unit 13 of the information processing apparatus 1 described above. Therefore, the description thereof is omitted here.
- FIG. 9 is a flowchart showing an example of an information processing method according to the present technology.
- FIG. 10 is a flowchart showing an example different from FIG. 9 of the information processing method according to the present technology.
- the information processing method according to the present technology is at least S1 for acquiring image data (signal acquisition step), S3 for specifying a conjugate signal, S5 for calculating immunostaining conditions (processing step), and S6 for presenting immunostaining conditions (output step). I do. Further, if necessary, the region / morphology specification S2 and the comparison S4 between the conjugate signal and the region / morphology can be performed. Hereinafter, each process will be described in detail in chronological order.
- an anti-progesterone receptor (hereinafter, also referred to as “PgR”) antibody will be described as an example.
- An anti-PgR antibody is an antibody that specifically stains the nucleus under appropriate immunostaining conditions.
- (1) Acquisition of image data S1 First, the image data obtained by the detection unit 31 and / or the detection device 41 described above is acquired. More specifically, each image data immunostained with one or more antibody concentrations is acquired from the detection unit 31 and / or the detection device 41 described above. At this time, if necessary, it is also possible to acquire image data at a concentration not containing the antibody and image data immunostained with various isotype antibodies.
- the method of specifying the area / form is as described in the processing unit 12 described above.
- the region and morphology of the nucleus can be specified. It is also possible to perform image segmentation, if necessary, after extracting the positive region of the DAPI staining signal. Furthermore, it is also possible to refer to the images stored in the database when specifying the area / morphology.
- the conjugate signal is specified by setting a threshold value of the PgR staining signal and extracting a positive region of the PgR staining signal.
- the threshold value of immunostaining for PgR can be set from the concentration not containing the anti-PgR antibody or the staining signal of the immunostaining of the isotype antibody of the anti-PgR antibody.
- the threshold value of immunostaining for PgR can be set from the immunostaining signal of PgR for negative cells.
- the signal may be the signal itself, a signal / background ratio, a specific signal / non-specific signal ratio, or the like.
- a positive region (signal) above the threshold value and a negative region (background) below the threshold value are designated, and the signal of the PgR staining signal is specified.
- Background can be calculated.
- Specific examples include, for example, the ratio of PgR-positive regions in the DAPI-positive region (PgR-positive region / DAPI-positive region), the value of the PgR staining signal in the DAPI-segmented region, and PgR in the segmented DAPI-positive region.
- the ratio of positive regions (PgR positive region / segmented DAPI positive region) and the like are calculated.
- the immunostaining conditions for the reagent containing the target molecule and the binding molecule are calculated. Specifically, the staining conditions at which the conjugate signal (signal / background) specified above becomes the maximum value can be obtained, or as shown in FIG. 3 above, an inflection point in the relationship between the antibody concentration and the staining signal. If, the dyeing conditions that are the inflection points are acquired.
- the immunostaining condition in which the conjugate signal (signal / background) in the region / morphology specified above becomes the maximum value or the closest to the predetermined value is acquired. do.
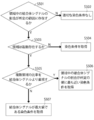
- a specific example of the calculation S5 of the dyeing condition when the region / morphology specific S2 is performed will be described with reference to the flowchart of FIG.
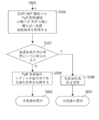
- FIG. 11 is a flowchart showing a specific example of the calculation S5 of the immunostaining condition when the region / morphology specific S2 is performed in the information processing method using the present technology.
- the proportion of the conjugate signal in the region does not exist in the predetermined range, it is determined that there is no appropriate staining condition (S502).
- the ratio of the conjugate signal in the region is within a predetermined range, it is determined whether or not there are a plurality of candidates (S503).
- the candidates are narrowed down to one, the staining conditions are acquired (S504).
- there are a plurality of candidates it is determined whether or not the ratio of the plurality of regions is more important than the conjugate signal (S505).
- the staining condition in which the ratio of the conjugate signal in the region is closest to the predetermined value is acquired (S506). At this time, if the staining conditions are not significantly narrowed down to one, the staining condition in which the conjugate signal is the maximum value among the staining conditions in which the ratio of the conjugate signal in the region is the closest to the predetermined value is selected. Can be obtained.
- the staining condition in which the conjugate signal is the maximum value is acquired (S507). At this time, if the staining conditions are not significantly narrowed down to one, among the staining conditions in which the conjugate signal is the maximum value, the staining condition in which the ratio of the conjugate signal in the region is closest to the predetermined value is selected. Can be obtained.
- a signal / background can also be used as the conjugate signal in FIG. It is also possible to make various judgments by referring to the information stored in the database as appropriate.
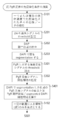
- FIG. 12 is a flowchart showing a specific example in the case of performing the calculation S5 of the dyeing condition using the information stored in the database in the information processing method using the present technology.
- image data is acquired from the database (S508), and a calibration curve is created from the information on the conjugate signal and staining conditions accumulated in the database (S509).
- the prepared calibration curve is adjusted to be applied to the conjugate signal identified above (S510).
- the staining conditions are obtained from the adjusted calibration curve (S511).
- First Embodiment 13 to 16 are flowcharts showing a first embodiment of a method of presenting immunostaining conditions for an anti-PgR antibody using an information processing apparatus according to the present technology.
- Antibody condition One or more antibody concentration conditions
- Specimen When the specimen contains only positive cells
- Stain signal Fluorescent signal value Database reference: None
- each image data immunostained with one or more antibody concentrations is acquired (S101).
- the threshold value of the DAPI staining signal is set (S201), and the positive region of the DAPI staining signal is extracted (S202).
- the threshold value of the PgR staining signal is set (S301), and the positive region of the PgR staining signal is specified (S302).
- the ratio of the PgR-positive region (PgR-positive region / DAPI-positive region) in the DAPI-positive region is calculated (S401).
- the ratio of the PgR-positive region in the DAPI-positive region has a plurality of candidates in a predetermined range (S503) and the ratio of the multiple regions is more important than the staining signal (S505)
- the ratio of the PgR-positive region is PgR-positive in the DAPI-positive region.
- the immunostaining conditions are significantly narrowed down to one (S507), the immunostaining conditions are acquired (S508) and the acquired immunostaining conditions are presented (S601).
- the acquired immunostaining conditions having the maximum PgR immunostaining signal are acquired (S509), and the acquired immunostaining conditions are presented. (S602).
- the PgR immunostaining signal is the maximum value. (S510).
- the acquired immunostaining conditions are significantly narrowed down to one (S511)
- the immunostaining conditions are acquired (S512), and the acquired immunostaining conditions are presented (S603).
- the immunostaining conditions are not significantly narrowed down to one (S511)
- the immunostaining conditions in which the ratio of the PgR-positive region in the DAPI-positive region is closest to an arbitrary value are acquired (S513).
- the acquired immunostaining conditions are presented (S604).
- FIG. 17 is a flowchart showing a second embodiment of a method of presenting immunostaining conditions for an anti-PgR antibody using an information processing apparatus according to the present technology.
- Antibody condition One or more antibody concentration conditions, antibody-free concentration, isotype antibody-containing specimen: When the specimen contains only positive cells
- Stain signal Fluorescent signal value Database reference: None
- each image data immunostained with one or more antibody concentrations is acquired (S101).
- the threshold value of the DAPI staining signal is set (S201), and the positive region of the DAPI staining signal is extracted (S202).
- the threshold value of immunostaining for PgR is set from the concentration containing no anti-PgR antibody or the immunostaining signal of the isotype antibody of the anti-PgR antibody (S301), and the positive region of the PgR staining signal is specified (S302). ). After that, it is the same as S401 to S604 of the first embodiment shown in FIGS. 13 to 16.
- FIG. 18 is a flowchart showing a third embodiment of a method of presenting immunostaining conditions for an anti-PgR antibody using an information processing apparatus according to the present technology.
- Antibody condition One or more antibody concentration conditions
- Specimen When using an image containing only positive cells in the specimen and an image containing only negative cells in the specimen Staining signal: Fluorescent signal value Database reference: None
- each image data (including image data of positive cells and negative cells) immunostained with one or more antibody concentrations is acquired (S101).
- the threshold value of the DAPI staining signal is set (S201), and the positive region of the DAPI staining signal is extracted (S202).
- the threshold value of immunostaining for PgR is set from the immunostaining signal of PgR for negative cells (S301), and the positive region of the PgR staining signal is designated (S302). After that, it is the same as S401 to S604 of the first embodiment shown in FIGS. 13 to 16.
- FIG. 19 is a flowchart showing a fourth embodiment of a method of presenting immunostaining conditions for an anti-PgR antibody using an information processing apparatus according to the present technology.
- Antibody condition One or more antibody concentration conditions
- Specimen When using an image containing positive cells and negative cells in one specimen
- Staining signal Fluorescent signal value Database reference: None
- each image data immunostained with one or more antibody concentrations is acquired (S101).
- a threshold value of the DAPI staining signal is set (S201), and a positive region of the DAPI staining signal is extracted (S202).
- the nucleus is segmented by DAPI to determine the morphology of the nucleus (S203).
- the threshold value of the PgR staining signal is set (S301), and the positive region of the PgR staining signal is specified (S302).
- the value of the PgR staining signal of the DAPI-segmented region or the ratio of the PgR-positive region in the DAPI region is calculated for each segmented DAPI-positive region (S401). .. At this time, only the region (nucleus) within a certain range is valid (S402). After that, it is the same as S501 to S604 of the first embodiment shown in FIGS. 14 to 16.
- [Fifth Embodiment] 20 to 25 are flowcharts showing a fifth embodiment of a method of presenting immunostaining conditions for an anti-PgR antibody using an information processing apparatus according to the present technology.
- Antibody condition One or more antibody concentration conditions
- Specimen If the specimen contains only positive cells
- Stain signal Signal / Background Database reference: None
- each image data immunostained with one or more antibody concentrations is acquired (S101).
- the threshold value of the DAPI staining signal is set (S201), and the positive region of the DAPI staining signal is extracted (S202).
- a threshold value of the PgR staining signal is set (S301), and a positive region (signal) above the threshold value and a negative region (background) below the threshold value are specified based on the set threshold value of the PgR staining signal.
- S302 the signal / background of the PgR staining signal is calculated (S501).
- FIG. 20 An immunostaining condition that maximizes the signal / background of the calculated PgR staining signal is acquired (S502), and the acquired immunostaining condition is presented (S601).
- FIG. 21 When an inflection is shown in the relationship between the antibody concentration and the staining signal (S502), the immunostaining condition to be the inflection is acquired (S503), and the acquired immunostaining condition is presented (S601). When no inflection is shown in the relationship between the antibody concentration and the staining signal (S502), the immunostaining condition that maximizes the calculated signal / background of the PgR staining signal is acquired (S504), and the acquired immunohistochemistry is obtained. Staining conditions are presented (S602).
- FIGS. 22 to 25 The ratio of the PgR-positive region (PgR-positive region / DAPI-positive region) in the DAPI-positive region is calculated (S401).
- S501 the proportion of the PgR-positive region in the DAPI-positive region does not exist in the predetermined range (S501)
- S502 the proportion of the PgR-positive region in the DAPI-positive region returns.
- S503 the immunostaining condition is acquired (S504) and the acquired immunostaining condition is presented (S600).
- the ratio of the PgR-positive region in the DAPI-positive region has a plurality of candidates in a predetermined range (S503) and the ratio of the multiple regions is more important than the staining signal (S505)
- the ratio of the PgR-positive region is PgR-positive in the DAPI-positive region.
- the acquired immunostaining conditions are significantly narrowed down to one (S507), the immunostaining conditions are acquired (S508) and the acquired immunostaining conditions are presented (S601).
- the signal / background of the PgR staining signal is calculated (S509).
- the staining condition in which the signal / background of the PgR staining signal is the maximum value is obtained (S510), and further, the PgR staining signal is obtained.
- the staining condition at which is the maximum value is acquired (S511), and the acquired immunostaining condition is presented (S602).
- the ratio of the PgR-positive region in the DAPI-positive region has a plurality of candidates in a predetermined range (S503) and the ratio of the plurality of regions is not more important than the staining signal (S505)
- the signal of the PgR staining signal. / Background is calculated (S512).
- the staining condition in which the signal / background of the PgR staining signal is the maximum value is acquired (S513).
- the staining conditions at which the PgR immunostaining signal is the maximum value are significantly narrowed down to one (S514), the immunostaining conditions are acquired (S515), and the acquired immunostaining conditions are presented (S603).
- the staining condition at which the PgR immunostaining signal is the maximum value is not significantly narrowed down to one (S514)
- the immunostaining condition in which the ratio of the PgR-positive region in the DAPI-positive region is closest to an arbitrary value is obtained.
- the acquired immunostaining conditions are presented (S604).
- FIGSixth Embodiment 26 and 27 are flowcharts showing a sixth embodiment of a method of presenting immunostaining conditions for an anti-PgR antibody using an information processing apparatus according to the present technology.
- Antibody condition One or more antibody concentration conditions
- Specimen When the specimen contains only positive cells
- Stain signal Fluorescent signal value Database reference: Yes
- each image data immunostained with one or a plurality of antibody concentrations is acquired (S102).
- the image data is acquired from the database (S101).
- the threshold value of the DAPI staining signal is set (S201), and the positive region of the DAPI staining signal is extracted (S202).
- the threshold value of the PgR staining signal is set (S301), and the positive region of the PgR staining signal is specified (S302).
- the ratio of the PgR-positive region (PgR-positive region / DAPI-positive region) in the DAPI-positive region is calculated (S401).
- the PgR-positive region / DAPI-positive region data in the database is acquired assuming that there is no appropriate immunostaining condition (S502). Whether or not it is determined (S503). If the database is not referenced, it returns as if there are no suitable immunostaining conditions (S504).
- the ratio of the PgR-positive region in the DAPI-positive region is such that a plurality of candidates exist in a predetermined range (S501)
- the PgR positive region / DAPI positive region calculated in S401 is obtained.
- image data is acquired from the database (S506), and the PgR positive region / DAPI positive region calculated in S401 is used.
- the immunostaining condition is acquired (S508), and the acquired immunostaining condition is presented (S601).
- FIG. 28 is a flowchart showing a seventh embodiment of a method of presenting immunostaining conditions for an anti-PgR antibody using an information processing apparatus according to the present technology.
- Antibody condition One or more antibody concentration conditions
- Specimen When the specimen contains only positive cells
- Stain signal Fluorescent signal value Database reference: Yes
- each image data immunostained with one or more antibody concentrations is acquired (S101).
- the staining signal data is acquired (S201 to S302) in the same manner as in S201 to S302 of the first embodiment.
- the image data in the database is acquired (S102), and a calibration curve is created based on the staining signal and staining conditions (S501).
- the calibration curve created from the database is adjusted so as to be applied to the staining signal data acquired in S101 to S302 (S502). From the adjusted calibration curve, immunostaining conditions are acquired (S503), and the acquired immunostaining conditions are presented (S601).
- a signal acquisition unit that acquires signals derived from samples including biological samples
- a processing unit that calculates immunostaining conditions for reagents for the sample based on the signal, and It has an output unit that outputs the immunostaining condition, and has.
- the signal comprises a target molecule in the biological sample and a signal derived from the reagent including a binding molecule capable of binding to the target molecule and / or a non-target molecule and a signal derived from the reagent.
- Information processing device (2) The information processing apparatus according to (1), wherein the signal includes at least one of a signal, a specific signal / background, and a specific signal / non-specific signal.
- the processing unit calculates immunostaining conditions for reagents for a sample containing the biological sample based on signals derived from the sample stained with a plurality of reagent concentrations and a threshold value, (1) or (2).
- the information processing device described in. (4) The information processing apparatus according to (3), wherein the threshold value is the largest signal among the signals derived from the sample stained with a plurality of reagent concentrations.
- the processing unit calculates immunostaining conditions for the reagent for the sample containing the biological sample based on the signal derived from the sample stained with at least one reagent concentration and the reagent information taken into consideration from the database.
- the information processing apparatus according to any one of (1) to (3).
- the processing unit calculates immunostaining conditions for reagents for a sample containing the biological sample based on the signal derived from the sample stained with a plurality of reagent concentrations and the threshold value extracted from the region information.
- the information processing apparatus according to any one of 1) to (5).
- the information processing apparatus according to (6), wherein the processing unit identifies a region based on the signal and / or a bright-field image.
- the information processing apparatus according to (7), wherein the region contains morphological information of the biological sample.
- the morphological information includes distribution of cell membranes and nuclei.
- the information processing apparatus according to (8) or (9), wherein the morphological information includes cell morphology obtained by segmentation.
- the processing unit includes comparing a plurality of specified regions.
- the processing unit comprises analyzing the localization of the region by comparing a plurality of said regions comprising at least one of a cell membrane, a cell nucleus, a specific binding region or a non-specific binding region (11). ).
- the information processing device In the processing unit, the specified plurality of the regions are single cells.
- the processing unit includes superimposing and / or excluding signals derived from adjacent single cells within a predetermined distance.
- the information processing apparatus according to any one of (1) to (13), wherein the signal acquisition unit acquires a fluorescence signal after autofluorescence separation and / or dye intercolor separation.
- the output unit outputs at least one of antibody clone, antibody concentration, antigen-antibody reaction time, reaction temperature, antigen activation condition, reaction solution composition, and stirring condition as the immunostaining condition.
- the information processing apparatus according to any one of (14).
- the signal comprises a signal derived from a reagent containing a target molecule in the biological sample and a binding molecule capable of binding to the target molecule and / or a signal derived from a non-target molecule and the reagent.
- a signal acquisition function that acquires signals derived from samples including biological samples
- a processing function for calculating immunostaining conditions for reagents for the sample based on the signal
- It is a computer program for realizing the output function for outputting the immunostaining condition and the computer.
- the signal comprises a signal derived from a reagent containing a target molecule in the biological sample and a binding molecule capable of binding to the target molecule and / or a signal derived from a non-target molecule and the reagent.
- a signal acquisition unit that acquires signals derived from samples including biological samples, A processing unit that calculates immunostaining conditions for reagents for the sample based on the signal, and An output unit that outputs the immunostaining conditions and A detection unit that detects a signal derived from the sample stained based on the output immunostaining condition information, and a detection unit.
- the signal comprises a signal derived from a reagent containing a target molecule in the biological sample and a binding molecule capable of binding to the target molecule and / or a signal derived from a non-target molecule and the reagent.
Landscapes
- Health & Medical Sciences (AREA)
- Life Sciences & Earth Sciences (AREA)
- Chemical & Material Sciences (AREA)
- Engineering & Computer Science (AREA)
- Physics & Mathematics (AREA)
- Immunology (AREA)
- Biomedical Technology (AREA)
- Pathology (AREA)
- Biochemistry (AREA)
- General Physics & Mathematics (AREA)
- General Health & Medical Sciences (AREA)
- Analytical Chemistry (AREA)
- Molecular Biology (AREA)
- Hematology (AREA)
- Urology & Nephrology (AREA)
- Medicinal Chemistry (AREA)
- Food Science & Technology (AREA)
- Biophysics (AREA)
- Nuclear Medicine, Radiotherapy & Molecular Imaging (AREA)
- Biotechnology (AREA)
- Cell Biology (AREA)
- Microbiology (AREA)
- Chemical Kinetics & Catalysis (AREA)
- Optics & Photonics (AREA)
- Investigating Or Analysing Biological Materials (AREA)
Priority Applications (2)
| Application Number | Priority Date | Filing Date | Title |
|---|---|---|---|
| US17/925,867 US20230184639A1 (en) | 2020-05-29 | 2021-04-16 | Information processing device, information processing method, computer program, and target molecule detection system |
| JP2022527576A JPWO2021241061A1 (https=) | 2020-05-29 | 2021-04-16 |
Applications Claiming Priority (2)
| Application Number | Priority Date | Filing Date | Title |
|---|---|---|---|
| JP2020094723 | 2020-05-29 | ||
| JP2020-094723 | 2020-05-29 |
Publications (1)
| Publication Number | Publication Date |
|---|---|
| WO2021241061A1 true WO2021241061A1 (ja) | 2021-12-02 |
Family
ID=78745634
Family Applications (1)
| Application Number | Title | Priority Date | Filing Date |
|---|---|---|---|
| PCT/JP2021/015679 Ceased WO2021241061A1 (ja) | 2020-05-29 | 2021-04-16 | 情報処理装置、情報処理方法、コンピュータプログラム、およびターゲット分子検出システム |
Country Status (3)
| Country | Link |
|---|---|
| US (1) | US20230184639A1 (https=) |
| JP (1) | JPWO2021241061A1 (https=) |
| WO (1) | WO2021241061A1 (https=) |
Cited By (1)
| Publication number | Priority date | Publication date | Assignee | Title |
|---|---|---|---|---|
| WO2025088910A1 (ja) * | 2023-10-26 | 2025-05-01 | 株式会社日立ハイテク | 情報処理装置及び情報処理方法 |
Citations (8)
| Publication number | Priority date | Publication date | Assignee | Title |
|---|---|---|---|---|
| JP2004532410A (ja) * | 2001-04-20 | 2004-10-21 | イェール ユニバーシティ | 細胞および組織の自動分析のためのシステムおよび方法 |
| US20060127956A1 (en) * | 1999-04-14 | 2006-06-15 | Sompuram Seshi R | Quality control for cytochemical assays |
| JP2007530949A (ja) * | 2004-03-24 | 2007-11-01 | トライパス イメイジング インク | 子宮頸部疾患を検出するための方法及び組成物 |
| US20090074266A1 (en) * | 2007-08-07 | 2009-03-19 | Historx, Inc. | Method and system for determining an optimal dilution of a reagent |
| JP2009168514A (ja) * | 2008-01-11 | 2009-07-30 | Shimadzu Corp | 乳癌マーカー及び乳癌の罹患の識別方法 |
| JP2011202967A (ja) * | 2010-03-24 | 2011-10-13 | Metawater Co Ltd | フローサイトメトリーによる微生物検出方法およびそれに用いる装置 |
| JP2015514716A (ja) * | 2012-03-30 | 2015-05-21 | イミュノジェン, インコーポレイテッド | Cd37に基づく治療の有効性を増大させる方法 |
| US20200167914A1 (en) * | 2017-07-19 | 2020-05-28 | Altius Institute For Biomedical Sciences | Methods of analyzing microscopy images using machine learning |
Family Cites Families (2)
| Publication number | Priority date | Publication date | Assignee | Title |
|---|---|---|---|---|
| US10422806B1 (en) * | 2013-07-25 | 2019-09-24 | Theranos Ip Company, Llc | Methods for improving assays of biological samples |
| WO2018118786A1 (en) * | 2016-12-19 | 2018-06-28 | Ventana Medical Systems, Inc. | Methods and systems for quantitative immunohistochemistry |
-
2021
- 2021-04-16 JP JP2022527576A patent/JPWO2021241061A1/ja not_active Ceased
- 2021-04-16 WO PCT/JP2021/015679 patent/WO2021241061A1/ja not_active Ceased
- 2021-04-16 US US17/925,867 patent/US20230184639A1/en active Pending
Patent Citations (8)
| Publication number | Priority date | Publication date | Assignee | Title |
|---|---|---|---|---|
| US20060127956A1 (en) * | 1999-04-14 | 2006-06-15 | Sompuram Seshi R | Quality control for cytochemical assays |
| JP2004532410A (ja) * | 2001-04-20 | 2004-10-21 | イェール ユニバーシティ | 細胞および組織の自動分析のためのシステムおよび方法 |
| JP2007530949A (ja) * | 2004-03-24 | 2007-11-01 | トライパス イメイジング インク | 子宮頸部疾患を検出するための方法及び組成物 |
| US20090074266A1 (en) * | 2007-08-07 | 2009-03-19 | Historx, Inc. | Method and system for determining an optimal dilution of a reagent |
| JP2009168514A (ja) * | 2008-01-11 | 2009-07-30 | Shimadzu Corp | 乳癌マーカー及び乳癌の罹患の識別方法 |
| JP2011202967A (ja) * | 2010-03-24 | 2011-10-13 | Metawater Co Ltd | フローサイトメトリーによる微生物検出方法およびそれに用いる装置 |
| JP2015514716A (ja) * | 2012-03-30 | 2015-05-21 | イミュノジェン, インコーポレイテッド | Cd37に基づく治療の有効性を増大させる方法 |
| US20200167914A1 (en) * | 2017-07-19 | 2020-05-28 | Altius Institute For Biomedical Sciences | Methods of analyzing microscopy images using machine learning |
Cited By (1)
| Publication number | Priority date | Publication date | Assignee | Title |
|---|---|---|---|---|
| WO2025088910A1 (ja) * | 2023-10-26 | 2025-05-01 | 株式会社日立ハイテク | 情報処理装置及び情報処理方法 |
Also Published As
| Publication number | Publication date |
|---|---|
| JPWO2021241061A1 (https=) | 2021-12-02 |
| US20230184639A1 (en) | 2023-06-15 |
Similar Documents
| Publication | Publication Date | Title |
|---|---|---|
| JP6604960B2 (ja) | バイオマーカー陽性の腫瘍細胞を識別するための医用画像解析 | |
| JP7250793B2 (ja) | 生体画像における連帯的細胞および領域分類のための深層学習システムならびに方法 | |
| CN107209934B (zh) | 用于定量分析异质生物标志物分布的方法、系统和装置 | |
| EP3776337B1 (en) | Systems for cell shape estimation | |
| JP2021506013A (ja) | 腫瘍空間異質性およびインターマーカ異質性の計算方法 | |
| US8060348B2 (en) | Systems for analyzing tissue samples | |
| US20100054560A1 (en) | Breast cancer pathological image diagnosis support system, breast cancer pathological image diagnosis support method, and recording medium recording breast cancer pathological image diagnosis support program | |
| US20110111435A1 (en) | Detecting Cell Surface Markers | |
| US20130338016A1 (en) | Method For Integrated Pathology Diagnosis And Digital Biomarker Pattern Analysis | |
| AU2015310886A1 (en) | Systems and methods for calculating immune scores | |
| JP2005525550A (ja) | 細胞の迅速自動化スクリーニングシステム及び方法 | |
| US12094571B2 (en) | Systems and methods for predictive molecular biomarker identification and quantification from morphology changes in histopathology tissue | |
| CN110168561B (zh) | 用于确定一个或多个组织样本中的细胞组成信息的装置 | |
| EP3699588A1 (en) | Biomaterial quantity measurement method, image processing device, pathology diagnosis support system, and program | |
| US8731845B2 (en) | Method and a system for determining a target in a biological sample by image analysis | |
| Torlakovic et al. | Development and validation of measurement traceability for in situ immunoassays | |
| JP7011067B2 (ja) | 膜特徴に基づいて組織画像内で細胞を分類するためのシステム及び方法 | |
| WO2021241061A1 (ja) | 情報処理装置、情報処理方法、コンピュータプログラム、およびターゲット分子検出システム | |
| Huang et al. | Quantitative fluorescence imaging analysis for cancer biomarker discovery: application to β-catenin in archived prostate specimens | |
| US11908130B2 (en) | Apparatuses and methods for digital pathology | |
| Akalestou-Clocher et al. | SpotitPy: a semi-automated tool for object-based co-localization of fluorescent labels in microscopy images |
Legal Events
| Date | Code | Title | Description |
|---|---|---|---|
| 121 | Ep: the epo has been informed by wipo that ep was designated in this application |
Ref document number: 21812832 Country of ref document: EP Kind code of ref document: A1 |
|
| ENP | Entry into the national phase |
Ref document number: 2022527576 Country of ref document: JP Kind code of ref document: A |
|
| NENP | Non-entry into the national phase |
Ref country code: DE |
|
| 122 | Ep: pct application non-entry in european phase |
Ref document number: 21812832 Country of ref document: EP Kind code of ref document: A1 |