WO2021199227A1 - エラー要因の推定装置及び推定方法 - Google Patents
エラー要因の推定装置及び推定方法 Download PDFInfo
- Publication number
- WO2021199227A1 WO2021199227A1 PCT/JP2020/014727 JP2020014727W WO2021199227A1 WO 2021199227 A1 WO2021199227 A1 WO 2021199227A1 JP 2020014727 W JP2020014727 W JP 2020014727W WO 2021199227 A1 WO2021199227 A1 WO 2021199227A1
- Authority
- WO
- WIPO (PCT)
- Prior art keywords
- error
- model
- prediction model
- unit
- error prediction
- Prior art date
- Legal status (The legal status is an assumption and is not a legal conclusion. Google has not performed a legal analysis and makes no representation as to the accuracy of the status listed.)
- Ceased
Links
Images



Classifications
-
- G—PHYSICS
- G06—COMPUTING OR CALCULATING; COUNTING
- G06F—ELECTRIC DIGITAL DATA PROCESSING
- G06F11/00—Error detection; Error correction; Monitoring
- G06F11/07—Responding to the occurrence of a fault, e.g. fault tolerance
- G06F11/0703—Error or fault processing not based on redundancy, i.e. by taking additional measures to deal with the error or fault not making use of redundancy in operation, in hardware, or in data representation
- G06F11/079—Root cause analysis, i.e. error or fault diagnosis
-
- G—PHYSICS
- G06—COMPUTING OR CALCULATING; COUNTING
- G06N—COMPUTING ARRANGEMENTS BASED ON SPECIFIC COMPUTATIONAL MODELS
- G06N20/00—Machine learning
-
- G—PHYSICS
- G06—COMPUTING OR CALCULATING; COUNTING
- G06F—ELECTRIC DIGITAL DATA PROCESSING
- G06F11/00—Error detection; Error correction; Monitoring
- G06F11/008—Reliability or availability analysis
-
- G—PHYSICS
- G06—COMPUTING OR CALCULATING; COUNTING
- G06F—ELECTRIC DIGITAL DATA PROCESSING
- G06F11/00—Error detection; Error correction; Monitoring
- G06F11/07—Responding to the occurrence of a fault, e.g. fault tolerance
- G06F11/0703—Error or fault processing not based on redundancy, i.e. by taking additional measures to deal with the error or fault not making use of redundancy in operation, in hardware, or in data representation
- G06F11/0706—Error or fault processing not based on redundancy, i.e. by taking additional measures to deal with the error or fault not making use of redundancy in operation, in hardware, or in data representation the processing taking place on a specific hardware platform or in a specific software environment
-
- G—PHYSICS
- G06—COMPUTING OR CALCULATING; COUNTING
- G06F—ELECTRIC DIGITAL DATA PROCESSING
- G06F11/00—Error detection; Error correction; Monitoring
- G06F11/30—Monitoring
- G06F11/34—Recording or statistical evaluation of computer activity, e.g. of down time, of input/output operation ; Recording or statistical evaluation of user activity, e.g. usability assessment
- G06F11/3447—Performance evaluation by modeling
Definitions
- the present invention relates to an error factor estimation device and an estimation method.
- the semiconductor measuring device and the semiconductor inspection device perform an inspection operation and a measurement operation at each inspection point determined to be abnormal on the surface of the semiconductor wafer according to a setting parameter called a recipe.
- recipe parameters it is common for engineers to manually optimize each item according to the attributes of the measurement / inspection target and the characteristics of the device. Therefore, for example, when a recipe that is not sufficiently adjusted is used, or when the characteristics of the device are changed due to a change over time, an error may occur in the inspection operation or the measurement operation. Such an error is called a recipe error as an error caused by the contents of the recipe.
- Patent Document 2 as a technique for estimating the cause when a defect occurs on the machined surface of the work, a machine learning device is used, and the inspection result of the machined surface of the work by the inspection device is observed as a state variable and processed.
- a processing defect factor estimation device that acquires label data indicating a cause of surface defects and learns by associating a state variable with label data is disclosed.
- Patent Document 1 In the method described in Patent Document 1, it is said that the root cause can be automatically determined using a typical error log. However, Patent Document 1 does not describe what kind of error is the normalized number of errors for the recipe used by the measurement tool.
- the applicable range of the processing defect factor estimation device described in Patent Document 2 is limited to the case where the state variable and the label data can be associated and learned. In other words, annotations are needed.
- An object of the present invention is to estimate the cause of various types of errors that occur without prior annotation of the error factor.
- the error factor estimation device of the present invention uses a feature quantity generator that generates a feature quantity suitable for a machine learning model using data sent from the outside, and a feature quantity generator that uses the feature quantity as input data to determine the presence or absence of an error.
- a model database having at least one error prediction model, a model evaluation unit that evaluates the performance of the error prediction model by comparing the prediction result of the error prediction model with the actually measured true error result, and model evaluation. If there is no match between the model selection unit that selects an error prediction model from the model database whose evaluation value calculated by the unit exceeds the preset specified value and the error prediction model selected by the model selection unit, It is equipped with an error prediction model generation unit that generates a new error prediction model for the measured error.
- the error factor estimation method of the present invention includes a feature quantity generation process for generating feature quantities suitable for a machine learning model using data sent from the outside, and a prediction result of an error prediction model stored in a model database. Calculated in the model evaluation process and the model evaluation process, which evaluate the performance of the error prediction model used to determine the presence or absence of an error by comparing the actual measured true error results with the feature amount as input data. If there is no match between the model selection process that selects an error prediction model whose evaluation value is equal to or greater than the preset specified value from the model database and the error prediction model selected in the model selection process, the measured error will be displayed. On the other hand, it includes an error prediction model generation step of generating a new error prediction model.
- FIG. It is a block diagram which shows the information processing system which includes the error factor estimation apparatus which concerns on Example 1.
- FIG. It is a block diagram which shows the error factor estimation apparatus of FIG.
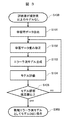
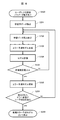
- It is a flowchart which shows the generation procedure of the new error prediction model in the 1st error prediction model generation part which concerns on Example 1.
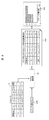
- FIG. It is a table which shows an example of the data structure of the input data which concerns on Example 1.
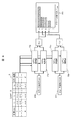
- FIG. It is a schematic diagram which shows the processing and display example in the model evaluation part and the model analysis part which concerns on Example 1.
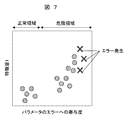
- FIG. It is a graph which shows an example of the relationship between the value of the feature amount which concerns on Example 1 and the degree of contribution to the occurrence of an error.
- FIG. It is a flowchart which shows the 2nd error prediction model generation procedure which concerns on Example 1.
- FIG. It is a block diagram which shows the error factor estimation apparatus provided with the data classification part which concerns on Example 2.
- FIG. It is a block diagram which shows the data classification part which concerns on Example 2.
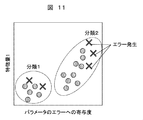
- FIG. It is a graph which shows the state which classified the error data by using the relationship between the value of a feature quantity and the degree of contribution to the occurrence of an error.
- It is a block diagram which shows the error factor estimation apparatus which performs only the error factor estimation which concerns on Example 3.
- FIG. It is a block diagram which shows the error factor estimation apparatus provided with the error factor label acquisition part and the error factor label database which concerns on Example 3.
- FIG. It is a figure which shows the error factor candidate to the user which concerns on Example 3.
- the "semiconductor inspection apparatus” is an apparatus for measuring the dimensions of a pattern formed on the surface of a semiconductor wafer, an apparatus for inspecting the presence or absence of defects in a pattern formed on the surface of a semiconductor wafer, or a pattern. It includes a device for inspecting the presence or absence of defects in a bare wafer in which a blank wafer is not formed, and also includes a composite device in which a plurality of these devices are combined.
- inspection shall be used in the sense of measurement or inspection
- inspection operation shall be used in the sense of measurement operation or inspection operation, and shall be referred to as "inspection target”.
- inspection target refers to the wafer to be measured or inspected, or the area to be measured or inspected on the wafer.
- the error factor estimation device is synonymous with the error factor estimation device, and the error factor estimation method is synonymous with the error factor estimation method.
- the estimation device includes a feature amount generation unit, a model database, a model evaluation unit, a model selection unit, and an error prediction model generation unit, and data classification that classifies error data in input data according to error factors. It is desirable to have more parts.
- the error prediction model generation unit labels the classified error data differently, generates an error prediction model together with this label, and transmits this error prediction model to the model database.
- the estimation device further includes a model analysis unit that quantifies the contribution of the feature amount to the error determination result in the error prediction model selected by the model selection unit.
- the estimation device has a configuration in which the feature amount of the high contribution value calculated by the model analysis unit is presented to the user as an error factor candidate.
- the model evaluation unit calculates the model evaluation value, and the contribution of each feature amount calculated by the model analysis unit is the model. It is desirable to have a configuration in which the feature amount of the one having a high corrected contribution value calculated from each of a plurality of error prediction models, which is corrected using the evaluation value, is presented to the user as an error factor candidate.
- the estimation device is another error prediction model that generates an error prediction model so that the corrected error factor is included in the analysis result of the model analysis unit when the user corrects the error factor candidate. It is desirable to have an additional generator.
- the estimation device has an error factor label database that stores the relationship between error factors corresponding to at least one of the feature quantities generated by the feature quantity generation unit and a combination thereof, and the contribution degree quantified by the model analysis unit. It is desirable to further include an error factor label acquisition unit that assigns the corresponding error factor to the feature amount corresponding to the error factor label using the label relationship in the database.
- the error prediction model generation unit generate a new error prediction model using the input data in the operation process in which the target error occurred and the operation process before that.
- the feature amount generation unit is in the feature amount generation process
- the model evaluation unit is in the model evaluation process
- the model selection unit is in the model selection process
- the error prediction model generation unit Corresponds to the error prediction model generation process. Further, these steps are not limited to those carried out in one device, and may be carried out by a plurality of distributed devices.
- FIG. 1 shows an example of an information processing system including an error factor estimation device according to the first embodiment.
- the semiconductor inspection device 1 is connected to the database 2 and the error factor estimation device 3 via the network 101.
- the error cause estimation device 3 is connected to the terminal 4 (GUI).
- the error factor estimation device 3 estimates the cause of the error in the inspection operation performed by the semiconductor inspection device 1.
- the data sent from the semiconductor inspection device 1 includes, for example, device data, a measurement recipe (hereinafter, may be simply referred to as a “recipe”), a measurement result, and an error result.
- the recipe may include the number of measurement points, the coordinate information of the measurement points (Evaluation Point: EP), the imaging conditions for capturing an image, the imaging sequence, and the like.
- the recipe may include the coordinates of the image acquired in the preparatory stage for measuring the measurement points in addition to the measurement points, the imaging conditions, and the like.
- the device data includes device-specific parameters, device-machine difference correction data, and observation condition parameters.
- the device-specific parameter is a correction parameter used to operate the semiconductor inspection device 1 according to the specified specifications.
- the device / machine difference correction data is a parameter used to correct the machine difference between semiconductor inspection devices.
- the observation condition parameter is a parameter that defines the observation condition of the scanning electron microscope (SEM) such as the acceleration voltage of the electron optical system.
- the recipe includes wafer map, alignment parameter, addressing parameter and length measurement parameter as recipe parameters.
- the wafer map is a coordinate map of the surface of the semiconductor wafer (for example, the coordinates of the pattern).
- the alignment parameter is, for example, a parameter used to correct a deviation between the coordinate system on the surface of the semiconductor wafer and the coordinate system inside the semiconductor inspection device 1.
- the addressing parameter is, for example, information for identifying a characteristic pattern existing in the inspection target region among the patterns formed on the surface of the semiconductor wafer.
- the length measurement parameter is a parameter that describes the conditions for measuring the length, and is, for example, a parameter that specifies which part of the pattern is to be measured.
- the measurement result includes the length measurement result, image data and operation log.
- the length measurement result describes the result of measuring the length of the pattern on the surface of the semiconductor wafer.
- the image data is an observation image of the semiconductor wafer.
- the operation log is data that describes the internal state of the semiconductor inspection device 1 in each operation process of alignment, addressing, and length measurement. For example, the operating voltage of each component, the coordinates of the observation field of view, and the like can be mentioned.
- the error result is a parameter indicating which of the alignment, addressing, and length measurement operation processes, when an error occurs, is the error.
- Data such as these device data, recipes, measurement results, error results, etc. are accumulated in the database 2 via the network 101.
- the accumulated data is analyzed by the error factor estimation device 3.
- the analysis result is displayed in a format that can be read by the user on the terminal 4.
- FIG. 2 shows the detailed configuration of the error factor estimation device of FIG.
- the error factor estimation device 3 includes a feature amount generation unit 11 connected to an external database 2, an input data recording unit 5, a model database 12 (model DB), a model evaluation unit 13, and a model selection. It has a unit 14, a model analysis unit 15, a first error prediction model generation unit 16, and a second error prediction model generation unit 17.
- the first error prediction model generation unit 16 is also simply referred to as an “error prediction model generation unit”.
- the second error prediction model generation unit 17 is also referred to as "another error prediction model generation unit”.
- the feature amount generation unit 11 extracts the feature amount suitable for the machine learning model from the raw data such as the device data, the recipe, and the measurement result sent from the database 2, and outputs the feature amount to the input data recording unit 5. .
- the feature amount extraction may include data scaling, categorical variable encoding, complex feature amount creation by combining a plurality of data such as interaction feature amounts, and the like.
- At least one error prediction model used for determining the presence or absence of an error at each inspection point is recorded in advance by inputting the data in the input data recording unit 5.
- a model generated in another semiconductor manufacturing factory or production line may be diverted, or a model generation procedure described later may be applied to any error in the database 2. It may be constructed based on.
- the model evaluation unit 13 evaluates the performance of the error prediction model in the model database 12 with respect to the data in the input data recording unit 5, such as the recipe unit, the wafer unit, and the inspection point unit.
- the performance evaluation is obtained by comparing the error prediction result determined by using the error prediction model with the true error result in the input data recording unit 5.
- accuracy, recall rate, precision rate, F1 value, AUC and the like can be used as the evaluation value of the performance.
- the F1 value is the harmonic mean of the precision rate and the recall rate.
- AUC is an abbreviation for Area Under the Curve.
- the model selection unit 14 selects one or more models having a high evaluation value in the model evaluation unit 13 as models suitable for determining an error included in the input data recording unit 5.
- a specified value is set in advance for the evaluation value used by the model evaluation unit 13, and a model with an evaluation value equal to or higher than this specified value is selected.
- model selection unit 14 if there is no model whose evaluation value is equal to or higher than the set specified value, it is assumed that a new error that does not match the generated error prediction model has been input, and the first error prediction model generation unit A new error prediction model is generated at 16.
- the model analysis unit 15 analyzes the error prediction model selected by the model selection unit 14 to what extent each feature amount in the input data recording unit 5 contributes to the error determination, thereby highly correlating with the error.
- the feature amount indicating is extracted.
- FIG. 3 shows a procedure for generating a new error prediction model in the first error prediction model generation unit 16 of FIG.
- step S100 as described above, when it is determined that there is no model having an evaluation value equal to or higher than the set specified value, the process proceeds to step S101.
- step S101 the learning data necessary for generating the error prediction model is selected (extracted).
- data including the same recipe or a similar recipe as the error that could not be detected by the error prediction model is extracted from the database 2 or the input data recording unit 5.
- step S102 the weighting of which feature amount of the training data is preferentially used is corrected.
- existing parameter search methods such as random search and Bayesian optimization can be utilized.
- an error prediction model which is a learning model used to determine whether or not an error has occurred included in the training data, is generated based on the weight calculated in step S102 by inputting the learning data.
- This error prediction model may be generated by using any machine learning algorithm such as a decision tree or a neural network.
- step S104 the performance of the error prediction model generated in step S103 is evaluated.
- the evaluation method as in the model evaluation unit 13 (FIG. 2), indexes such as accuracy, recall rate, precision rate, F1 value, and AUC can be used. Moreover, it is desirable that these evaluation values can be calculated by using a method such as cross-validation.
- step S105 it is determined whether or not the evaluation value calculated in step S104 is equal to or greater than a predetermined predetermined value. If it is less than the specified value, the process returns to step S102, and the same process is repeated again. If it is more than the specified value, the new error model is generated and saved in the model database 12 (FIG. 2).
- the feature amount generation unit 11 When extracting from the database 2, the feature amount generation unit 11 generates the feature amount in a format suitable for the machine learning model. Further, the period of the data to be extracted may be specified. If it is past data, there is a possibility that the wafer manufacturing conditions and the state of the equipment have changed. Therefore, it is desirable to specify the period for extracting the data retroactively from the time when the error occurred.
- the learning data includes the operation process in which the error to be the target (prediction target) occurs and the recipe or the measurement result in the operation process before that.
- the measurement in the semiconductor inspection apparatus 1 includes continuous operation steps such as alignment, addressing, and length measurement.
- FIG. 4 is a table showing an example of the data structure of the input data including the value of the feature amount obtained from the measurement in the semiconductor inspection device.
- an error occurs when the measurement index is 2 and the operation process is 2.
- the feature quantities after the operation step 3 after the operation step 2 may be excluded as being irrelevant to the occurrence of the error, but the previous operation step 1 may affect the error. Therefore, it will be included in the training data.
- FIG. 5 is a schematic diagram showing the calculation of the contribution of the input feature amount to the error prediction model to the error determination and the visualization method to the user.
- the input data of the input data recording unit 5 and the error prediction model A (210) of the model database 12 are input to the model analysis unit 15. Then, the calculation result 220 of the contribution degree is output, and the graph 230 of the contribution degree of each feature amount to the error can be displayed. In other words, the contribution of the feature quantity is quantified.
- the value of the feature amount (Z 1 , Z 2 , ..., Z m ) and the error occurrence result are assigned to each operation process of alignment, addressing, and length measurement. An example having a data structure stored for each measurement index is shown.
- the contribution of these features to the error judgment result in the error prediction model is, for example, the number of each feature appearing in a branch in the model when the error prediction model is constructed by an algorithm based on a decision tree. It can be evaluated by the variable importance (Fature Impact) calculated based on the improvement value of the objective function and the SHAP value for calculating the sensitivity of each feature value to the model output.
- SHAP is a method for obtaining the contribution of each variable (feature amount) to the prediction result of the model, and is an abbreviation for SHAPLEy Adaptive exPlanations.
- the model selected by the model selection unit 14 in FIG. 2 is the error prediction model A
- the data in the row where the measurement index is 1 is input to the input of the error prediction model A, and the feature amount Z 1 is included.
- ⁇ contribution ⁇ 1, 1 to the error judgment is calculated.
- the total ⁇ SUM of the SHAP values in each feature amount can be displayed on the terminal 4 in order from the feature amount having the largest value.
- a feature amount having a high contribution value calculated by the model analysis unit 15 can be used as an error factor candidate and presented to the user via the terminal 4 or the like.
- the analysis results of the plurality of models may be combined to present a highly correlated feature amount.
- FIG. 6 is a schematic diagram showing a processing and display example in the model evaluation unit and the model analysis unit according to this embodiment.
- the input data of the input data recording unit 5 and the error prediction model A (210) of the model database 12 (FIG. 2) are input to the model evaluation unit 13a and the model analysis unit 15a. Further, the input data of the input data recording unit 5 and the error prediction model B (211) of the model database 12 (FIG. 2) are input to the model evaluation unit 13b and the model analysis unit 15b. Then, the graph 231 of the degree of contribution of the feature amount to the error can be displayed.
- model evaluation units 13a and 13b and the model analysis units 15a and 15b are the same as those in FIG. Further, in FIG. 6, two model evaluation units 13a and 13b and two model analysis units 15a and 15b are shown for explanation, but in reality, one model evaluation unit 13a and 13b and one model analysis unit are shown, respectively.
- the processes may be executed in order or in parallel in 15a and 15b.
- the sum of the SHAP values for each feature amount calculated by the model analysis units 15a and 15b ⁇ SUM is finally corrected by the model evaluation values obtained by the model evaluation units 13a and 13b.
- Contribution ⁇ 'SUM is calculated.
- the model evaluation unit 13a if the model evaluation index at 13b was recall, by multiplying the recall models SHAP value phi SUM, the final contribution phi 'SUM Can be obtained.
- the calculated final contribution phi 'SUM in each error prediction model are arranged in the order of decreasing, via the terminal 4 of the feature amount with errors and high correlation complexed from multiple models in ranking format Can be presented to the user.
- FIG. 7 is a graph showing an example of the relationship between the value of the feature amount and the degree of contribution of the parameter to the error occurrence according to this embodiment.
- the horizontal axis is the feature amount, and the vertical axis is the contribution of the parameter to the error occurrence.
- the validity of the extracted features can be determined by determining the normal area and dangerous area based on the value of the contribution to the error and displaying the actual error occurrence position on the screen of the terminal 4. Can be evaluated by the user.
- the second error prediction model generation unit 17 When the error factor selected in FIG. 2 is different from the actual one, the user can specify (correct) the correct error factor via the terminal 4. When the designation is implemented, the second error prediction model generation unit 17 generates a new error prediction model.
- FIG. 8 is a flowchart showing a second error prediction model generation procedure according to this embodiment.
- step S800 when the cause parameter is corrected by the user (step S800), the process proceeds to step S201.
- step S201 the learning data necessary for generating the error prediction model is selected (extracted).
- the selection method is different from step S101 of FIG.
- step S201 of FIG. 8 data including the same recipe or a similar recipe is extracted for the error detected by the error prediction model.
- step S202 the error prediction model is analyzed, and the degree of contribution to the error determination in the feature amount in the learning data extracted in step S201 is quantified. This is the same process as the model analysis unit 15 in FIG.
- step S203 if the feature amount with a high degree of contribution within the predetermined ranking does not include the error factor specified by the user, the same processing is repeated from S102, and if it is included, a new error prediction model. Is saved in the model database 12 as the generation is completed (step S300).
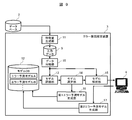
- FIG. 9 is a configuration diagram showing an error factor estimation device including a data classification unit according to the second embodiment.
- the error factor estimation device 3 is provided with a data classification unit 18 for classifying the data sent from the input data recording unit 5.
- Other configurations are the same as in FIG.
- Example 1 model evaluation and model generation are executed using the data of the same recipe or similar recipes on the assumption that the errors that occur in the same recipe have the same factors.
- the data classification unit 18 classifies error data for each error factor, and executes model evaluation and model generation for each classified error data.
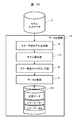
- FIG. 10 is a configuration diagram showing details of the data classification unit of FIG.
- the data classification unit 18 includes an error prediction model generation unit 19, a model analysis unit 115, an error factor clustering unit 20, a data division unit 21, and a division data recording unit 122.
- the error prediction model generation unit 19 generates an error prediction model, which is a learning model used for determining the presence or absence of an error included in the input data sent from the input data recording unit 5.
- an error prediction model which is a learning model used for determining the presence or absence of an error included in the input data sent from the input data recording unit 5.
- the same process as in step S103 of FIG. 8 can be used.
- the model analysis unit 115 calculates how much each feature contributes to the determination result of the model generated by the error prediction model generation unit 19, for example, using the SHAP value.
- the error factor clustering unit 20 classifies the contribution of each feature amount represented by the SHAP value calculated by the model analysis unit 115 to the error by applying unsupervised learning.
- the data division unit 21 divides the classified error and normal data.
- the divided data is stored in the divided data recording unit 122.
- FIG. 11 is a graph showing a state in which error data is classified using the relationship between the value of the feature amount and the contribution of the parameter to the occurrence of an error.
- the horizontal axis is the feature amount, and the vertical axis is the contribution of the parameter to the error occurrence.
- classifications 1 and 2 corresponding to different error factors are divided into each area, and the data (error data) in which an error has occurred is separated in each area.
- the branching formula inside the model for discriminating them is also different, and the SHAP value indicating the degree of contribution to the error judgment is the existence range for each feature amount related to the error factor. Is expected to be different.
- the error data is separated according to this SHAP value.
- the first error prediction model generation unit 16 and the second error prediction model generation unit 17 in FIG. 9 generate an error prediction model, and the model analysis unit 15
- the model analysis unit 15 By analyzing the model in, even if there are a plurality of error factors that cannot be dealt with by the error prediction model in the model database 12 in the input data of the input data recording unit 5, the low-related feature amount is regarded as noise. It is possible to avoid being extracted and improve the accuracy of the extracted feature amount.
- an error prediction model is generated using the error data divided by the data classification unit 18, normal data that is the same recipe or a similar recipe as the target error data is used together as training data. Can be done.
- different labels may be attached to each of the classified error data, an error prediction model may be generated together with this label, and the error prediction model may be stored in the model database 12.
- different indexes may be automatically assigned in order, or the user may label the error factor. Since the labeling of the error cause may be performed in units of divided data, the number of processes can be significantly reduced as compared with the conventional method of labeling in units of one occurrence error. In this case, the model evaluation unit 13 becomes unnecessary in FIG. 9, and the function of the model selection unit 14 is replaced with the operation of selecting the one in which the label of the error data and the label of the error prediction model match.
- the error factor estimation device of the first embodiment when a sufficient variation of the error prediction model is saved in the model database 12 of FIG. 2, a new error prediction model is not generated, and the input error data is used.
- the operation may be such that only the error factor is estimated.
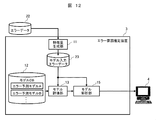
- FIG. 12 is a configuration diagram showing an error factor estimation device of this embodiment.
- the recipe / measurement result at the measurement point where the error occurred and the recipe / measurement result data set for the same wafer and the same recipe are input as error data from the database 22.
- the feature amount generation unit 11 extracts the feature amount suitable for the machine learning model from these data, and outputs the error data to the model input error data recording unit 23.
- the subsequent processing is the same as in FIG. 2, and one or more error prediction models having a high evaluation value for the error prediction of the model input error data recording unit 23 are selected from the model database 12 and used as the analysis result of the model.
- a feature amount having a large contribution to error prediction is presented to the user via the terminal 4. In this case, the model selection unit 14 becomes unnecessary.
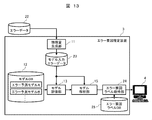
- FIG. 13 is a configuration diagram showing a modified example of the error factor estimation device.
- the error factor estimation device 3 includes an error factor label acquisition unit 24 and an error factor label database 25 (error factor label DB).
- error factor candidates can be acquired based on the feature quantities extracted by the model analysis unit 15.
- the error factor label database 25 stores the relationship between the error factors corresponding to each feature amount and its combination. In this case, it is necessary to label the feature amount with the error factor in advance, but the number of required processes can be significantly reduced as compared with the conventional method of labeling each occurrence error.
- the error factor label acquisition unit 24 assigns a corresponding error factor to the feature amount at the top of the ranking obtained by the model analysis unit 15 by using the label relationship in the error factor label database 25.
- the labeled error factor is presented to the user via the terminal 4. At this time, the magnitude of the contribution of each feature amount calculated by the model analysis unit 15 may be converted and displayed as the certainty of the corresponding error factor.
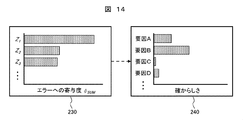
- FIG. 14 shows an example of displaying error factor candidates to the user according to this embodiment.
- the graph on the right side of the figure shows the magnitude of the contribution of each feature calculated by the model analysis unit 15.
- the left side of the figure shows the certainty of the error factor converted based on the data shown in the graph on the right side.
- the present invention is not limited to the above-described examples, and includes various modifications.
- the above-mentioned examples have been described in detail in order to explain the present invention in an easy-to-understand manner, and are not necessarily limited to those having all the described configurations.
- the error factor label acquisition unit 24 and the error factor label database 25 shown in FIG. 13 of Example 3 can be combined with FIG. 2 of Example 1 and FIG. 9 of Example 2, respectively.
- the error factor associated with the combination of quantities can be shown to the user.
- 1 Semiconductor inspection device, 2, 22: Database, 3: Error factor estimation device, 4: Terminal, 5: Input data recording unit, 11: Feature amount generation unit, 12: Model database, 13, 13a, 13b: Model evaluation Unit, 14: Model selection unit, 15, 15a, 15b, 115: Model analysis unit, 16: First error prediction model generation unit, 17: Second error prediction model generation unit, 18: Data classification unit, 19: Error prediction Model generation unit, 20: Error factor clustering unit, 21: Data division unit, 23: Model input error data recording unit, 24: Error factor label acquisition unit, 25: Error factor label database, 101: Network.
Landscapes
- Engineering & Computer Science (AREA)
- Theoretical Computer Science (AREA)
- General Engineering & Computer Science (AREA)
- Physics & Mathematics (AREA)
- General Physics & Mathematics (AREA)
- Quality & Reliability (AREA)
- Software Systems (AREA)
- Biomedical Technology (AREA)
- Health & Medical Sciences (AREA)
- Computing Systems (AREA)
- Medical Informatics (AREA)
- Evolutionary Computation (AREA)
- Data Mining & Analysis (AREA)
- Mathematical Physics (AREA)
- Artificial Intelligence (AREA)
- Computer Vision & Pattern Recognition (AREA)
- Computer Hardware Design (AREA)
- Evolutionary Biology (AREA)
- Bioinformatics & Computational Biology (AREA)
- Bioinformatics & Cheminformatics (AREA)
- Life Sciences & Earth Sciences (AREA)
- Testing Or Measuring Of Semiconductors Or The Like (AREA)
- Management, Administration, Business Operations System, And Electronic Commerce (AREA)
- Detection And Prevention Of Errors In Transmission (AREA)
- Radar Systems Or Details Thereof (AREA)
- Detection And Correction Of Errors (AREA)
Priority Applications (6)
| Application Number | Priority Date | Filing Date | Title |
|---|---|---|---|
| CN202080098437.7A CN115280334B (zh) | 2020-03-31 | 错误原因的推定装置以及推定方法 | |
| PCT/JP2020/014727 WO2021199227A1 (ja) | 2020-03-31 | 2020-03-31 | エラー要因の推定装置及び推定方法 |
| JP2022512952A JP7354421B2 (ja) | 2020-03-31 | 2020-03-31 | エラー要因の推定装置及び推定方法 |
| KR1020227030371A KR20220135246A (ko) | 2020-03-31 | 2020-03-31 | 에러 요인의 추정 장치 및 추정 방법 |
| US17/908,731 US12554571B2 (en) | 2020-03-31 | 2020-03-31 | Error cause estimation device and estimation method |
| TW110108273A TWI783400B (zh) | 2020-03-31 | 2021-03-09 | 誤差因子的推定裝置及推定方法 |
Applications Claiming Priority (1)
| Application Number | Priority Date | Filing Date | Title |
|---|---|---|---|
| PCT/JP2020/014727 WO2021199227A1 (ja) | 2020-03-31 | 2020-03-31 | エラー要因の推定装置及び推定方法 |
Publications (1)
| Publication Number | Publication Date |
|---|---|
| WO2021199227A1 true WO2021199227A1 (ja) | 2021-10-07 |
Family
ID=77928214
Family Applications (1)
| Application Number | Title | Priority Date | Filing Date |
|---|---|---|---|
| PCT/JP2020/014727 Ceased WO2021199227A1 (ja) | 2020-03-31 | 2020-03-31 | エラー要因の推定装置及び推定方法 |
Country Status (5)
| Country | Link |
|---|---|
| US (1) | US12554571B2 (cg-RX-API-DMAC7.html) |
| JP (1) | JP7354421B2 (cg-RX-API-DMAC7.html) |
| KR (1) | KR20220135246A (cg-RX-API-DMAC7.html) |
| TW (1) | TWI783400B (cg-RX-API-DMAC7.html) |
| WO (1) | WO2021199227A1 (cg-RX-API-DMAC7.html) |
Cited By (2)
| Publication number | Priority date | Publication date | Assignee | Title |
|---|---|---|---|---|
| JP2024029695A (ja) * | 2022-08-22 | 2024-03-06 | 富士フイルムビジネスイノベーション株式会社 | 情報処理装置及びプログラム |
| JP2024145534A (ja) * | 2023-03-31 | 2024-10-15 | ダイキン工業株式会社 | 情報処理装置、方法、およびプログラム |
Families Citing this family (9)
| Publication number | Priority date | Publication date | Assignee | Title |
|---|---|---|---|---|
| JP7354421B2 (ja) * | 2020-03-31 | 2023-10-02 | 株式会社日立ハイテク | エラー要因の推定装置及び推定方法 |
| US11526388B2 (en) * | 2020-06-22 | 2022-12-13 | T-Mobile Usa, Inc. | Predicting and reducing hardware related outages |
| JP7430271B2 (ja) * | 2020-09-17 | 2024-02-09 | 株式会社日立ハイテク | エラー要因の推定装置及び推定方法 |
| US20220092473A1 (en) * | 2020-09-18 | 2022-03-24 | Samsung Display Co., Ltd. | System and method for performing tree-based multimodal regression |
| JP7639408B2 (ja) * | 2021-03-03 | 2025-03-05 | 富士通株式会社 | 説明情報出力プログラム,説明情報出力方法および説明情報出力装置 |
| US11899527B2 (en) * | 2021-11-30 | 2024-02-13 | Caterpillar Inc. | Systems and methods for identifying machine anomaly root cause based on a selected reduced order model and a selected fault model |
| TWI800351B (zh) * | 2022-04-13 | 2023-04-21 | 友達光電股份有限公司 | 場域環境參數的分析與提示的伺服器、處理系統與方法 |
| US12292785B2 (en) * | 2022-12-12 | 2025-05-06 | Jpmorgan Chase Bank, N.A. | Method and system for automatically selecting and executing solutions on the target application |
| US20240362106A1 (en) * | 2023-04-29 | 2024-10-31 | Pdf Solutions, Inc. | Predicting Equipment Fail Mode from Process Trace |
Citations (3)
| Publication number | Priority date | Publication date | Assignee | Title |
|---|---|---|---|---|
| WO2018173121A1 (ja) * | 2017-03-21 | 2018-09-27 | 株式会社Preferred Networks | サーバ装置、学習済モデル提供プログラム、学習済モデル提供方法及び学習済モデル提供システム |
| JP6530779B2 (ja) * | 2017-04-20 | 2019-06-12 | ファナック株式会社 | 加工不良要因推定装置 |
| JP2019537839A (ja) * | 2016-10-14 | 2019-12-26 | ケーエルエー コーポレイション | 半導体用途向けに構成された深層学習モデルのための診断システムおよび方法 |
Family Cites Families (12)
| Publication number | Priority date | Publication date | Assignee | Title |
|---|---|---|---|---|
| US7065425B1 (en) | 2005-06-22 | 2006-06-20 | Internaitonal Business Machines Corporation | Metrology tool error log analysis methodology and system |
| JP6608344B2 (ja) | 2016-09-21 | 2019-11-20 | 株式会社日立製作所 | 探索装置および探索方法 |
| DE112017006733T5 (de) | 2017-02-09 | 2019-10-31 | Mitsubishi Electric Corporation | Fehlerfaktor-Schätzvorrichtung und Fehlerfaktor-Schätzverfahren |
| KR102045415B1 (ko) | 2017-10-31 | 2019-11-15 | 삼성에스디에스 주식회사 | 자동으로 최적의 통계 모델을 결정하는 방법 및 그 장치 |
| US11380594B2 (en) | 2017-11-15 | 2022-07-05 | Kla-Tencor Corporation | Automatic optimization of measurement accuracy through advanced machine learning techniques |
| US10928309B2 (en) | 2018-06-29 | 2021-02-23 | Viavi Solutions Inc. | Cross-validation based calibration of a spectroscopic model |
| JP7654649B2 (ja) * | 2019-10-19 | 2025-04-01 | キナクシス インコーポレイテッド | 機械学習解釈可能性のためのシステム及び方法 |
| WO2021084286A1 (en) * | 2019-10-30 | 2021-05-06 | Citrix Systems, Inc. | Root cause analysis in multivariate unsupervised anomaly detection |
| US11995574B2 (en) * | 2019-11-19 | 2024-05-28 | Sap Se | Explainable machine learning predictions |
| JP7354421B2 (ja) * | 2020-03-31 | 2023-10-02 | 株式会社日立ハイテク | エラー要因の推定装置及び推定方法 |
| JP7430271B2 (ja) * | 2020-09-17 | 2024-02-09 | 株式会社日立ハイテク | エラー要因の推定装置及び推定方法 |
| JP7829415B2 (ja) * | 2022-06-13 | 2026-03-13 | 株式会社日立ハイテク | 欠陥検査装置 |
-
2020
- 2020-03-31 JP JP2022512952A patent/JP7354421B2/ja active Active
- 2020-03-31 WO PCT/JP2020/014727 patent/WO2021199227A1/ja not_active Ceased
- 2020-03-31 US US17/908,731 patent/US12554571B2/en active Active
- 2020-03-31 KR KR1020227030371A patent/KR20220135246A/ko active Pending
-
2021
- 2021-03-09 TW TW110108273A patent/TWI783400B/zh active
Patent Citations (3)
| Publication number | Priority date | Publication date | Assignee | Title |
|---|---|---|---|---|
| JP2019537839A (ja) * | 2016-10-14 | 2019-12-26 | ケーエルエー コーポレイション | 半導体用途向けに構成された深層学習モデルのための診断システムおよび方法 |
| WO2018173121A1 (ja) * | 2017-03-21 | 2018-09-27 | 株式会社Preferred Networks | サーバ装置、学習済モデル提供プログラム、学習済モデル提供方法及び学習済モデル提供システム |
| JP6530779B2 (ja) * | 2017-04-20 | 2019-06-12 | ファナック株式会社 | 加工不良要因推定装置 |
Cited By (2)
| Publication number | Priority date | Publication date | Assignee | Title |
|---|---|---|---|---|
| JP2024029695A (ja) * | 2022-08-22 | 2024-03-06 | 富士フイルムビジネスイノベーション株式会社 | 情報処理装置及びプログラム |
| JP2024145534A (ja) * | 2023-03-31 | 2024-10-15 | ダイキン工業株式会社 | 情報処理装置、方法、およびプログラム |
Also Published As
| Publication number | Publication date |
|---|---|
| JP7354421B2 (ja) | 2023-10-02 |
| JPWO2021199227A1 (cg-RX-API-DMAC7.html) | 2021-10-07 |
| US12554571B2 (en) | 2026-02-17 |
| US20230122653A1 (en) | 2023-04-20 |
| KR20220135246A (ko) | 2022-10-06 |
| TWI783400B (zh) | 2022-11-11 |
| CN115280334A (zh) | 2022-11-01 |
| TW202138791A (zh) | 2021-10-16 |
Similar Documents
| Publication | Publication Date | Title |
|---|---|---|
| JP7354421B2 (ja) | エラー要因の推定装置及び推定方法 | |
| JP4394728B2 (ja) | 影響要因特定装置 | |
| TWI801973B (zh) | 錯誤因素之推定裝置及推定方法 | |
| JP7610028B2 (ja) | エラー要因推定装置、エラー要因推定方法及びコンピュータ可読媒体 | |
| CN112805719B (zh) | 分类半导体样本中的缺陷 | |
| KR102889716B1 (ko) | 레시피 정보 제시 시스템, 레시피 에러 추정 시스템 | |
| WO2020166236A1 (ja) | 作業効率評価方法、作業効率評価装置、及びプログラム | |
| CN109285791B (zh) | 设计布局为主的快速在线缺陷诊断、分类及取样方法及系统 | |
| JP4355193B2 (ja) | 半導体デバイスの製造方法及び半導体デバイス製造システム | |
| JP2025539375A (ja) | インデックス作成と半導体欠陥画像検索のためのモデリング | |
| US11151710B1 (en) | Automatic selection of algorithmic modules for examination of a specimen | |
| WO2010110365A1 (ja) | 要因分析装置および要因分析方法 | |
| JP2006318263A (ja) | 情報分析システム、情報分析方法及びプログラム | |
| JP2011058926A (ja) | 画像検査方法及び画像検査装置 | |
| US6828776B2 (en) | Method for analyzing defect inspection parameters | |
| CN120142605A (zh) | 一种镀锡铜线缺陷检测方法、系统及设备 | |
| JP2004186374A (ja) | 製造データ解析方法及びそれをコンピュータに実行させるプログラム | |
| JP2008117380A (ja) | 診断プロセス支援方法とそのためのプログラム | |
| JP7821323B2 (ja) | エラー要因解析装置、および、エラー要因解析方法 | |
| CN117529803A (zh) | 用于主动良率管理的制造指纹 | |
| CN120296566A (zh) | 一种基于电感特性对数据线进行智能检测的方法与系统 | |
| CN119807887A (zh) | 基于电力系统的异常数据评估与修复方法 |
Legal Events
| Date | Code | Title | Description |
|---|---|---|---|
| 121 | Ep: the epo has been informed by wipo that ep was designated in this application |
Ref document number: 20928040 Country of ref document: EP Kind code of ref document: A1 |
|
| ENP | Entry into the national phase |
Ref document number: 2022512952 Country of ref document: JP Kind code of ref document: A |
|
| ENP | Entry into the national phase |
Ref document number: 20227030371 Country of ref document: KR Kind code of ref document: A |
|
| NENP | Non-entry into the national phase |
Ref country code: DE |
|
| 122 | Ep: pct application non-entry in european phase |
Ref document number: 20928040 Country of ref document: EP Kind code of ref document: A1 |
|
| WWG | Wipo information: grant in national office |
Ref document number: 17908731 Country of ref document: US |