WO2021182204A1 - 異常検知システム - Google Patents
異常検知システム Download PDFInfo
- Publication number
- WO2021182204A1 WO2021182204A1 PCT/JP2021/008052 JP2021008052W WO2021182204A1 WO 2021182204 A1 WO2021182204 A1 WO 2021182204A1 JP 2021008052 W JP2021008052 W JP 2021008052W WO 2021182204 A1 WO2021182204 A1 WO 2021182204A1
- Authority
- WO
- WIPO (PCT)
- Prior art keywords
- unit
- state
- transition probability
- data
- monitored
- Prior art date
- Legal status (The legal status is an assumption and is not a legal conclusion. Google has not performed a legal analysis and makes no representation as to the accuracy of the status listed.)
- Ceased
Links
Images





Classifications
-
- A—HUMAN NECESSITIES
- A01—AGRICULTURE; FORESTRY; ANIMAL HUSBANDRY; HUNTING; TRAPPING; FISHING
- A01K—ANIMAL HUSBANDRY; AVICULTURE; APICULTURE; PISCICULTURE; FISHING; REARING OR BREEDING ANIMALS, NOT OTHERWISE PROVIDED FOR; NEW BREEDS OF ANIMALS
- A01K29/00—Other apparatus for animal husbandry
- A01K29/005—Monitoring or measuring activity
-
- A—HUMAN NECESSITIES
- A01—AGRICULTURE; FORESTRY; ANIMAL HUSBANDRY; HUNTING; TRAPPING; FISHING
- A01K—ANIMAL HUSBANDRY; AVICULTURE; APICULTURE; PISCICULTURE; FISHING; REARING OR BREEDING ANIMALS, NOT OTHERWISE PROVIDED FOR; NEW BREEDS OF ANIMALS
- A01K11/00—Marking of animals
- A01K11/006—Automatic identification systems for animals, e.g. electronic devices, transponders for animals
-
- A—HUMAN NECESSITIES
- A61—MEDICAL OR VETERINARY SCIENCE; HYGIENE
- A61B—DIAGNOSIS; SURGERY; IDENTIFICATION
- A61B5/00—Measuring for diagnostic purposes; Identification of persons
- A61B5/103—Measuring devices for testing the shape, pattern, colour, size or movement of the body or parts thereof, for diagnostic purposes
- A61B5/11—Measuring movement of the entire body or parts thereof, e.g. head or hand tremor or mobility of a limb
- A61B5/1118—Determining activity level
-
- A—HUMAN NECESSITIES
- A61—MEDICAL OR VETERINARY SCIENCE; HYGIENE
- A61B—DIAGNOSIS; SURGERY; IDENTIFICATION
- A61B5/00—Measuring for diagnostic purposes; Identification of persons
- A61B5/72—Signal processing specially adapted for physiological signals or for diagnostic purposes
- A61B5/7271—Specific aspects of physiological measurement analysis
- A61B5/7282—Event detection, e.g. detecting unique waveforms indicative of a medical condition
-
- A—HUMAN NECESSITIES
- A61—MEDICAL OR VETERINARY SCIENCE; HYGIENE
- A61B—DIAGNOSIS; SURGERY; IDENTIFICATION
- A61B5/00—Measuring for diagnostic purposes; Identification of persons
- A61B5/74—Details of notification to user or communication with user or patient; User input means
- A61B5/746—Alarms related to a physiological condition, e.g. details of setting alarm thresholds or avoiding false alarms
-
- G—PHYSICS
- G16—INFORMATION AND COMMUNICATION TECHNOLOGY [ICT] SPECIALLY ADAPTED FOR SPECIFIC APPLICATION FIELDS
- G16H—HEALTHCARE INFORMATICS, i.e. INFORMATION AND COMMUNICATION TECHNOLOGY [ICT] SPECIALLY ADAPTED FOR THE HANDLING OR PROCESSING OF MEDICAL OR HEALTHCARE DATA
- G16H40/00—ICT specially adapted for the management or administration of healthcare resources or facilities; ICT specially adapted for the management or operation of medical equipment or devices
- G16H40/60—ICT specially adapted for the management or administration of healthcare resources or facilities; ICT specially adapted for the management or operation of medical equipment or devices for the operation of medical equipment or devices
- G16H40/63—ICT specially adapted for the management or administration of healthcare resources or facilities; ICT specially adapted for the management or operation of medical equipment or devices for the operation of medical equipment or devices for local operation
-
- G—PHYSICS
- G16—INFORMATION AND COMMUNICATION TECHNOLOGY [ICT] SPECIALLY ADAPTED FOR SPECIFIC APPLICATION FIELDS
- G16H—HEALTHCARE INFORMATICS, i.e. INFORMATION AND COMMUNICATION TECHNOLOGY [ICT] SPECIALLY ADAPTED FOR THE HANDLING OR PROCESSING OF MEDICAL OR HEALTHCARE DATA
- G16H40/00—ICT specially adapted for the management or administration of healthcare resources or facilities; ICT specially adapted for the management or operation of medical equipment or devices
- G16H40/60—ICT specially adapted for the management or administration of healthcare resources or facilities; ICT specially adapted for the management or operation of medical equipment or devices for the operation of medical equipment or devices
- G16H40/67—ICT specially adapted for the management or administration of healthcare resources or facilities; ICT specially adapted for the management or operation of medical equipment or devices for the operation of medical equipment or devices for remote operation
-
- G—PHYSICS
- G16—INFORMATION AND COMMUNICATION TECHNOLOGY [ICT] SPECIALLY ADAPTED FOR SPECIFIC APPLICATION FIELDS
- G16H—HEALTHCARE INFORMATICS, i.e. INFORMATION AND COMMUNICATION TECHNOLOGY [ICT] SPECIALLY ADAPTED FOR THE HANDLING OR PROCESSING OF MEDICAL OR HEALTHCARE DATA
- G16H50/00—ICT specially adapted for medical diagnosis, medical simulation or medical data mining; ICT specially adapted for detecting, monitoring or modelling epidemics or pandemics
- G16H50/70—ICT specially adapted for medical diagnosis, medical simulation or medical data mining; ICT specially adapted for detecting, monitoring or modelling epidemics or pandemics for mining of medical data, e.g. analysing previous cases of other patients
-
- A—HUMAN NECESSITIES
- A01—AGRICULTURE; FORESTRY; ANIMAL HUSBANDRY; HUNTING; TRAPPING; FISHING
- A01K—ANIMAL HUSBANDRY; AVICULTURE; APICULTURE; PISCICULTURE; FISHING; REARING OR BREEDING ANIMALS, NOT OTHERWISE PROVIDED FOR; NEW BREEDS OF ANIMALS
- A01K2227/00—Animals characterised by species
- A01K2227/10—Mammal
- A01K2227/101—Bovine
-
- A—HUMAN NECESSITIES
- A01—AGRICULTURE; FORESTRY; ANIMAL HUSBANDRY; HUNTING; TRAPPING; FISHING
- A01K—ANIMAL HUSBANDRY; AVICULTURE; APICULTURE; PISCICULTURE; FISHING; REARING OR BREEDING ANIMALS, NOT OTHERWISE PROVIDED FOR; NEW BREEDS OF ANIMALS
- A01K2267/00—Animals characterised by purpose
- A01K2267/03—Animal model, e.g. for test or diseases
- A01K2267/0337—Animal models for infectious diseases
-
- A—HUMAN NECESSITIES
- A61—MEDICAL OR VETERINARY SCIENCE; HYGIENE
- A61B—DIAGNOSIS; SURGERY; IDENTIFICATION
- A61B2503/00—Evaluating a particular growth phase or type of persons or animals
- A61B2503/40—Animals
Definitions
- the present invention relates to an abnormality detection system.
- Non-Patent Document 1 proposes a system that automatically detects cattle that have actually developed BRD (or BRDC) among cattle infected with BRD (or BRDC). According to the system, cattle that develop BRD (or BRDC) can be quickly identified.
- Cargill "Cargill Brings facial recognition capability to farmers through strategic equity investment in Cainthus", [online], January 31, 2018, [Search February 28, 2020], Internet (URL: https://www.cargill) .com / 2018 / cargill-brings-facial-recognition-capability-to-farmers)
- One aspect is to provide an anomaly detection system that detects anomalies in monitored animals.
- the anomaly detection system Based on the time series data from the motion sensor attached to the predetermined part of the animal to be monitored, the first specific part that specifies the state of the animal to be monitored in each time range, and A first calculation unit that calculates a transition probability from a state at a predetermined timing in each time range specified by the first specific unit to the next state, and a first calculation unit. It has a determination unit that determines that an abnormality in the animal to be monitored has been detected when the score calculated based on the transition probability to the next state satisfies a predetermined condition.
- FIG. 1 is a first diagram showing an example of a system configuration of an abnormality detection system and a functional configuration of a server device.
- FIG. 2 is a diagram showing an example of the hardware configuration of the server device.
- FIG. 3 is a diagram showing a specific example of processing of the data acquisition unit.
- FIG. 4 is a diagram showing details of the functional configuration of the reference data calculation unit.
- FIG. 5 is a diagram showing a specific example of processing of the reference data calculation unit.
- FIG. 6 is a first diagram showing details of the functional configuration of the analysis unit.
- FIG. 7 is a first diagram showing a specific example of the processing of the analysis unit.
- FIG. 8 is a diagram showing a specific example of processing of the sign detection unit.
- FIG. 9 is a flowchart showing the flow of the reference data calculation process.
- FIG. 10 is a first flowchart showing the flow of analysis processing.
- FIG. 11 is a flowchart showing the flow of the sign detection process.
- FIG. 12 is a second diagram showing an example of the system configuration of the abnormality detection system and the functional configuration of the server device.
- FIG. 13 is a second diagram showing details of the functional configuration of the analysis unit.
- FIG. 14 is a second diagram showing a specific example of the processing of the analysis unit.
- FIG. 15 is a second flowchart showing the flow of analysis processing.
- FIG. 1 is a first diagram showing an example of a system configuration of an abnormality detection system and a functional configuration of a server device.
- the abnormality detection system 100 is a system that detects a sign (some abnormality) of each cow in the fattening farm before developing BRD (or BRDC) in the fattening process.
- the abnormality detection system 100 includes a measuring device 110, a gateway device 120, and a server device 130.
- the measuring device 110 and the gateway device 120 are connected via wireless communication
- the gateway device 120 and the server device 130 are communicably connected via a network (not shown).
- the measuring device 110 is a three-dimensional (X-axis direction, Y-axis direction, Z-axis direction) motion sensor (acceleration sensor in the present embodiment) mounted on a predetermined portion (neck in the example of FIG. 1) of the cow 10.
- the X-axis direction is, for example, a direction along the body surface of the neck of the cow 10, and refers to a direction along the circumference of the neck
- the Y-axis direction is, for example, the body surface of the neck of the cow 10. It shall be a direction along the direction from the head to the body.
- the Z-axis direction is defined as, for example, a direction perpendicular to the body surface of the neck of the cow 10.
- the measuring device 110 measures time-series data indicating three-dimensional acceleration at a predetermined sampling frequency and transmits it to the gateway device 120.
- the gateway device 120 transmits the time-series data indicating the three-dimensional acceleration transmitted from the measuring device 110 to the server device 130.
- the server device 130 is a device that detects a sign (some abnormality) of each cow in the fattening farm before it develops BRD (or BRDC).
- An abnormality detection program is installed in the server device 130, and when the program is executed, the server device 130 functions as a data acquisition unit 131, a reference data calculation unit 132, an analysis unit 133, and a sign detection unit 134. do.
- the data acquisition unit 131 stores the time-series data of healthy cows in the acceleration data storage unit 135 among the time-series data indicating the three-dimensional acceleration transmitted from the gateway device 120.
- the reference data calculation unit 132 reads out the time-series data indicating the three-dimensional acceleration of the healthy cow stored in the acceleration data storage unit 135, and calculates the state transition probability data of the healthy cow (details will be described later). Further, the reference data calculation unit 132 stores the state transition probability data of a healthy cow as the reference data in the reference data storage unit 136.
- the analysis unit 133 calculates the state transition probability data of the monitored cow based on the time series data of the monitored cow among the time series data indicating the three-dimensional acceleration acquired by the data acquisition unit 131. In addition, the analysis unit 133 calculates a score indicating how much the state transition probability data of the monitored cow deviates from the state transition probability data of the healthy cow (that is, the degree of abnormality of the state transition). ..
- the sign detection unit 134 (judgment unit) acquires the score calculated by the analysis unit 133 as data indicating the degree of abnormality of the monitored cow, and predicts the monitored cow before the onset of BRD (or BRDC). Determine whether or not (some abnormality) is detected. Further, the sign detection unit 134 notifies the user when it is determined that the sign (some abnormality) has been detected.
- the sign detection unit 134 for example, when the data indicating the degree of abnormality of the cow to be monitored exceeds a predetermined threshold value for a plurality of days (for example, 2 days) in a row, a sign (some abnormality) ) Is detected.
- FIG. 2 is a diagram showing an example of the hardware configuration of the server device.
- the server device 130 includes a processor 201, a memory 202, an auxiliary storage device 203, an I / F (Interface) device 204, a communication device 205, and a drive device 206.
- the hardware of the server device 130 is connected to each other via the bus 207.
- the processor 201 has various arithmetic devices such as a CPU (Central Processing Unit) and a GPU (Graphics Processing Unit).
- the processor 201 reads various programs (for example, an abnormality detection program, etc.) onto the memory 202 and executes them.
- the memory 202 has a main storage device such as a ROM (Read Only Memory) and a RAM (Random Access Memory).
- the processor 201 and the memory 202 form a so-called computer, and the processor 201 realizes the above-mentioned functions by executing various programs read on the memory 202.
- the auxiliary storage device 203 stores various programs and various data used when various programs are executed by the processor 201.
- the acceleration data storage unit 135 and the reference data storage unit 136 are realized in the auxiliary storage device 203.
- the I / F device 204 is a connection device that connects the operation device 210 and the display device 211, which are examples of external devices, and the server device 130.
- the I / F device 204 receives an operation on the server device 130 via the operating device 210. Further, the I / F device 204 outputs the result of processing by the server device 130 and displays it via the display device 211.
- the communication device 205 is a communication device for communicating with another device.
- the server device 130 communicates with the gateway device 120, which is another device, via the communication device 205.
- the drive device 206 is a device for setting the recording medium 212.
- the recording medium 212 referred to here includes a medium such as a CD-ROM, a flexible disk, a magneto-optical disk, or the like that optically, electrically, or magnetically records information. Further, the recording medium 212 may include a semiconductor memory or the like for electrically recording information such as a ROM or a flash memory.
- the various programs installed in the auxiliary storage device 203 are installed, for example, by setting the distributed recording medium 212 in the drive device 206 and reading the various programs recorded in the recording medium 212 by the drive device 206. Will be done.
- the various programs installed in the auxiliary storage device 203 may be installed by being downloaded from the network via the communication device 205.
- FIG. 3 is a diagram showing a specific example of processing of the data acquisition unit.
- the data acquisition unit 131 sets the time series data for various cows transmitted from the gateway device 120 (time series data indicating acceleration in the X-axis direction, when indicating acceleration in the Y-axis direction). Series data, time series data showing acceleration in the Z-axis direction) are acquired.
- the data acquisition unit 131 stores a set of time-series data for healthy cows in the acceleration data storage unit 135.
- FIG. 4 is a diagram showing details of the functional configuration of the reference data calculation unit.
- the reference data calculation unit 132 includes a standardization processing unit 401 (second standardization processing unit), a labeling unit 402 (second labeling unit), and a state specifying unit 403 (second specifying unit). It has a state transition probability calculation unit 404 (second calculation unit).
- the standardization processing unit 401 reads out a set of time series data for healthy cows from the acceleration data storage unit 135, performs standardization processing on the time series data of each axis, and notifies the labeling unit 402 of the standardized data.
- the standardization process refers to a process of dividing the time series data of each axis into predetermined time ranges (for example, 1 [SEC]) and calculating the variation of the time series data of each axis in each time range. That is, the standardized data is composed of the calculation result of the variation of the time series data of each axis in each time range.
- the labeling unit 402 performs a labeling process on the standardized data.
- the calculation result of the variation of the time series data of each axis in each time range included in the standardized data is obtained. ⁇ If it is -4 ⁇ or less, enter “1". ⁇ If it is larger than -4 ⁇ and less than -3 ⁇ , enter "2". ⁇ If it is larger than -3 ⁇ and less than -2 ⁇ , enter "3". ⁇ If it is larger than -2 ⁇ and less than -1 ⁇ , enter "4". ⁇ If it is larger than -1 ⁇ and less than + 1 ⁇ , enter "5". ⁇ If it is + 1 ⁇ or more and less than + 2 ⁇ , enter "6".
- the state specifying unit 403 identifies the state of a healthy cow in each time range based on the labeling data generated by performing the labeling process on the time series data of each axis in each time range. For example, the processing result of the labeling process for the time-series data of the X-axis direction at each time range (L X), the processing result of the labeling process for the time-series data of the Y-axis direction (L Y), for time-series data in the Z-axis direction
- the state transition probability calculation unit 404 calculates a transition probability indicating which state the state of a healthy cow at a predetermined timing in each time range has transitioned to in the next time range. For example, if the state of the cow 10 in the current time range is "state I", the state of the cow 10 in the next time range is any one of 729 of "state I" to "state DCCXXIX". Transition to the state.
- the state transition probability calculation unit 404 counts which state has transitioned from "state I" in the next time range for each transition destination state for a certain period of time. Then, the state transition probability calculation unit 404 divides each of the number of transitions to each state by using the total number of transitions to any state. As a result, the state transition probability calculation unit 404 calculates, for example, the transition probability from the current state to the next state for the cow 10.
- the state transition probability calculation unit 404 for example, the state transition probability data generated by calculating the transition probability with all the states of the cow 10 as the transition source is stored in the reference data storage unit 136 as the reference data. do.
- the state transition probability data generated by the state transition probability calculation unit 404 can be said to be data showing a tendency of healthy cow movement.
- FIG. 5 is a diagram showing a specific example of processing of the reference data calculation unit.
- the standardization processing unit 401 performs standardization processing and generates standardized data 520.
- the example of FIG. 5 shows that the interval of the broken lines of the set 510 of the time series data is in the time range of 1 [SEC].
- each value included in the standardized data 520 indicates that it is a variation of the time series data calculated for each 1 [SEC] for each of the X-axis, the Y-axis, and the Z-axis.
- the standardized data 520 is labeled by the labeling unit 402, and the labeling data 530 is generated. Then, the state specifying unit 403 specifies the state of a healthy cow in each time range based on the processing result of the labeling process of each axis in each time range constituting the labeling data 530 (states I, V, IV). ..
- the state transition probability calculation unit 404 determines the predetermined timing of each time range for healthy cows. Calculate the transition probability from one state to the next. As a result, the state transition probability calculation unit 404 generates state transition probability data 540 for healthy cattle.
- the state transition probability data 540 of FIG. 5 arranges the current state of a healthy cow (729 states) in the vertical direction and the next state (729 states) of a healthy cow in the horizontal direction. , It is generated by storing the transition probability to the next state in each column.
- column 541 contains data for a period of time indicating the condition of healthy cattle in each time range. -The number of transitions (individual transitions) in which the state in the current time range is “state I” and the state remains “state I” in the next time range is counted. -The total number of transitions in which the state in the current time range is “state I” and the state is in any of "state I” to "state DCCXXIX” in the next time range is counted. ⁇ Divide each transition probability by the total number of transitions, The transition probability from "state I" to "state I” calculated by this is stored.
- column 542 contains data for a period of time indicating the condition of healthy cattle over each time range. -The number of transitions (individual transitions) in which the state in the current time range is “state I” and the state in the next time range is “state II” is counted. -The total number of transitions in which the state in the current time range is “state I” and the state is in any of "state I” to "state DCCXXIX” in the next time range is counted. ⁇ Divide each transition probability by the total number of transitions, The transition probability from "state I” to "state II” calculated by this is stored.
- the state transition probability data 540 generated for a healthy cow is stored in the reference data storage unit 136 as reference data.
- FIG. 6 is a diagram showing details of the functional configuration of the analysis unit.
- the analysis unit 133 has a standardization processing unit 601 (first standardization processing unit) and a labeling unit 602 (first labeling unit). Further, the analysis unit 133 includes a state identification unit 603 (first specific unit), a state transition probability calculation unit 604 (first calculation unit), and a score calculation unit 605 (first score calculation unit).
- the functions of the standardization processing units 601 to the state transition probability calculation unit 604 are the same as the functions of the standardization processing unit 401 to the state transition probability calculation unit 404 of the reference data calculation unit 132 described with reference to FIG. be. Therefore, here, the score calculation unit 605 will be described.
- the score calculation unit 605 acquires the state transition probability data of the cow to be monitored, which is generated by the state transition probability calculation unit 604. In addition, the score calculation unit 605 reads out the state transition probability data of a healthy cow from the reference data storage unit 136. Further, the score calculation unit 605 calculates the score by the following equation (1) based on the state transition probability data of the cow to be monitored and the state transition probability data of the healthy cow.
- Score -log (P ⁇ X)
- P represents the state transition probability data of a healthy cow
- X represents the state transition probability data of the cow to be monitored.
- ⁇ represents the Amadal product.
- the score calculation unit 605 how much the state transition probability data of the monitored cow deviates from the state transition probability data of healthy cows (that is, the degree of abnormality of the state transition). ) Is calculated for each transition probability.
- the score calculation unit 605 extracts the maximum score from the scores calculated for each transition probability and outputs it as data indicating the degree of abnormality of the cow to be monitored on the relevant date.
- the state probability data generated by the state transition probability calculation unit 604 can be said to be data showing the tendency of the movement of the cow to be monitored.
- the change is detected by comparison with the movement tendency of a healthy cow. Therefore, the above score is calculated.
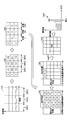
- FIG. 7 is a diagram showing a specific example of the processing of the analysis unit.
- the cattle to be monitored are acquired or generated by the standardization processing unit 601, the labeling unit 602, the state identification unit 603, and the state transition probability calculation unit 604.
- ⁇ Time series data set 510, -Standardized data 520, ⁇ Labeling data 530 Since it is the same as the above, detailed description thereof will be omitted here.
- one day's worth of data is accumulated for the initial state transition probability data 740 of the monitored cow, so that the state transition probability calculation unit 604 can perform one day of the monitored cow.
- the initial state transition probability data 740 refers to state transition probability data in which the transition probability of each state is "0". Further, in the example of FIG. 7, due to space limitations, only five current states and five next states are shown as state transition probability data 740 and 740'.
- the score calculation unit 605 By generating the state transition probability data 740'for one day of the cow to be monitored, the score calculation unit 605 reads out the state transition probability data 540 of the healthy cow as shown in FIG. 7, and the above equation ( Calculate the score for each transition probability using 1). As a result, score data 750 is generated.
- the score calculation unit 605 extracts the maximum score from the scores for each transition probability included in the score data 750, and extracts the extracted maximum score of the cow to be monitored. It is output as data showing the degree of abnormality on the date.
- graph 760 is a graph of data indicating the degree of abnormality of the cow to be monitored on each date, with the horizontal axis representing the date and the vertical axis representing the data indicating the degree of abnormality. The graph 760 shows that the data indicating the current degree of abnormality is "410".
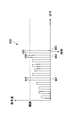
- FIG. 8 is a diagram showing a specific example of processing of the sign detection unit.
- the horizontal axis represents the date and the vertical axis represents the data indicating the degree of abnormality in the graph 800.
- the graph 800 shows that the data indicating the degree of abnormality is equal to or more than the threshold value on the dates indicated by reference numerals 801 and 802 and reference numeral 803.
- the sign detection unit 134 indicates a sign (some abnormality). It indicates that it was not determined that the detection was detected.
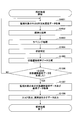
- FIG. 9 is a flowchart showing the flow of the reference data calculation process.
- step S901 the data acquisition unit 131 acquires time-series data indicating the three-dimensional acceleration of a healthy cow.
- step S902 the standardization processing unit 401 of the reference data calculation unit 132 performs standardization processing on the time series data indicating the three-dimensional acceleration of a healthy cow, and generates standardized data.
- step S903 the labeling unit 402 of the reference data calculation unit 132 performs labeling processing on the standardized data and generates labeling data.
- step S904 the state specifying unit 403 of the reference data calculation unit 132 specifies the state of each time range of a healthy cow based on the labeling data.
- step S905 the state transition probability calculation unit 404 of the reference data calculation unit 132 generates the state transition probability data of the healthy cow based on the data indicating the state of each time range of the healthy cow.
- step S906 the state transition probability calculation unit 404 of the reference data calculation unit 132 stores the generated state transition probability data of a healthy cow as reference data in the reference data storage unit 136.
- step S907 the state transition probability calculation unit 404 of the reference data calculation unit 132 determines whether or not the state transition probability data for a certain period of time of a healthy cow has been generated. If it is determined in step S907 that it has not been generated (NO in step S907), the process returns to step S901.
- step S907 if it is determined in step S907 that the data has been generated (YES in step S907), the reference data calculation process is terminated.
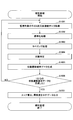
- FIG. 10 is a first flowchart showing the flow of analysis processing, and shows analysis processing for one day.
- step S1001 the data acquisition unit 131 acquires time-series data indicating the three-dimensional acceleration of the cow to be monitored.
- step S1002 the standardization processing unit 601 of the analysis unit 133 performs standardization processing on the time series data indicating the three-dimensional acceleration of the cow to be monitored, and generates standardized data.
- step S1003 the labeling unit 602 of the analysis unit 133 performs labeling processing on the standardized data and generates labeling data.
- step S1004 the state specifying unit 603 of the analysis unit 133 identifies the state of each time range of a healthy cow based on the labeling data.
- step S1005 the state transition probability calculation unit 604 of the analysis unit 133 generates the state transition probability data of the cow to be monitored based on the data indicating the state of each time range of the cow to be monitored.
- step S1006 the state transition probability calculation unit 604 of the analysis unit 133 determines whether or not the state transition probability data for one day of the cow to be monitored has been generated. If it is determined in step S1006 that the state transition probability data for one day has not been generated (NO in step S1006), the process returns to step S1001.
- step S1006 determines whether the state transition probability data for one day has been generated (if YES in step S1006). If it is determined in step S1006 that the state transition probability data for one day has been generated (if YES in step S1006), the process proceeds to step S1007.
- step S1007 the score calculation unit 605 of the analysis unit 133 acquires the state transition probability data for one day of the monitored cow, and from the reference data storage unit 136, the state transition probability of a healthy cow is used as the reference data. Read the data.
- step S1008 the score calculation unit 605 of the analysis unit 133 scores based on the acquired state transition probability data of the monitored cow for one day and the state transition probability data of the healthy cow read out as the reference data. Is calculated for each transition probability. Further, the score calculation unit 605 of the analysis unit 133 extracts the maximum score from the scores calculated for each transition probability and outputs it as data indicating the degree of abnormality of the cow to be monitored on the relevant date.
- FIG. 11 is a flowchart showing the flow of the sign detection process.
- step S1101 the sign detection unit 134 acquires data indicating the degree of abnormality of the cow to be monitored, which is output every day from the score calculation unit 605 of the analysis unit 133.
- step S1102 the sign detection unit 134 determines whether or not the acquired data indicating the degree of abnormality is equal to or higher than a predetermined threshold value. If it is determined in step S1102 that the threshold value is equal to or higher than the predetermined threshold value (YES in step S1102), the process proceeds to step S1103.
- step S1103 the sign detection unit 134 increments the counter i that counts the number of consecutive days. It is assumed that "0" is input to the counter i as an initial value.
- step S1104 the sign detection unit 134 determines whether or not the counter i is a predetermined number or more (for example, two days or more). If it is determined in step S1104 that the number is equal to or greater than a predetermined number (YES in step S1104), the process proceeds to step S1105.
- step S1105 the sign detection unit 134 determines that a sign (some abnormality) has been detected and notifies the user.
- step S1104 determines whether the number of counters i is less than a predetermined number (NO in step S1104). If it is determined in step S1104 that the number of counters i is less than a predetermined number (NO in step S1104), the process proceeds to step S1007.
- step S1102 If it is determined in step S1102 that the value is less than the threshold value (NO in step S1102), the process proceeds to step S1106, inputting "0" to the counter i, and then proceeding to step S1107.
- step S1107 the sign detection unit 134 determines that the sign (some abnormality) has not been detected.
- step S1108 the sign detection unit 134 determines whether or not to end the sign detection process, and if it is determined to continue (in the case of NO in step S1108), returns to step S1101. On the other hand, if it is determined in step S1108 that the process is completed (YES in step S1108), the sign detection process is terminated.
- the abnormality detection system is -Identify the state of a healthy cow in each time range based on time-series data showing three-dimensional acceleration measured by an accelerometer mounted on the neck of a healthy cow.
- state transition probability data is generated by calculating the transition probability to the next state from the state at a predetermined timing in each specified time range.
- the state of the cow to be monitored in each time range is specified.
- state transition probability data is generated by calculating the transition probability from the state at a predetermined timing in the specified time range to the next state.
- a score indicating the degree of abnormality of the state transition is calculated for each transition probability.
- the maximum score is extracted from the scores calculated for each transition probability and output as data indicating the degree of abnormality.
- the monitoring target is to detect the change in the movement tendency that occurs before the onset of BRD (or BRDC) in comparison with the movement tendency of healthy cows.
- the score is calculated based on the state transition probability data of cows and healthy cows.
- an abnormality detection system that detects an abnormality in a cow to be monitored.
- the score is calculated based on the state transition probability data of the cow to be monitored and the state transition probability data of the healthy cow.
- the score calculation method is not limited to this, and the score may be calculated based on, for example, the state transition probability data of the cow to be monitored. That is, instead of detecting the change in the movement tendency based on the comparison with the state transition probability data of the healthy cow, the change in the movement tendency is detected based on the state transition probability data itself of the monitored cow. May be good.
- the second embodiment will be described focusing on the differences from the first embodiment.
- FIG. 12 is a second diagram showing an example of the system configuration of the abnormality detection system and the functional configuration of the server device.
- the server device 1210 functions as a data acquisition unit 131, an analysis unit 1211, and a sign detection unit 134 by executing an abnormality detection program.
- the data acquisition unit 131 and the sign detection unit 134 are the same as the data acquisition unit 131 and the sign detection unit 134 shown in FIG. 1, so description thereof will be omitted here.
- the analysis unit 1211 generates state transition probability data of the cow to be monitored based on the time series data of the cow to be monitored among the time series data indicating the three-dimensional acceleration acquired by the data acquisition unit 131. In addition, the analysis unit 1211 is based on the state transition probability data of the cow to be monitored. -The degree to which each transition probability of the monitored cow has increased, or ⁇ The degree to which each transition probability of the monitored cow has decreased, (That is, the score indicating the degree of abnormality of the state transition) is calculated.
- FIG. 13 is a diagram showing details of the functional configuration of the analysis unit.
- the analysis unit 1211 has a standardization processing unit 601, a labeling unit 602, a state identification unit 603, a state transition probability calculation unit 604, and a score calculation unit 1301 (second score calculation unit).
- the functions of the standardization processing units 601 to the state transition probability calculation unit 604 are the same as the functions of the standardization processing unit 401 to the state transition probability calculation unit 404 of the reference data calculation unit 132 described with reference to FIG. be. Therefore, here, the score calculation unit 1301 will be described.
- the score calculation unit 1301 acquires the state transition probability data of the cow to be monitored, which is generated by the state transition probability calculation unit 604. Further, the score calculation unit 605 calculates the score by the following equation (2) based on the state transition probability data of the cow to be monitored.
- the score calculation unit 1301 calculates a score indicating the degree of increase or decrease of each transition probability included in the state transition probability data of the cow to be monitored for each transition probability.
- the score calculation unit 1301 extracts the maximum score from the scores calculated for each transition probability and outputs it as data indicating the degree of abnormality of the cow to be monitored on the relevant date.
- FIG. 14 is a diagram showing a specific example of the processing of the analysis unit.
- the standardization processing unit 601, the labeling unit 602, the state identification unit 603, and the state transition probability calculation unit 604 acquire or generate the cow to be monitored.
- ⁇ Time series data set 710, -Standardized data 720, ⁇ Labeling data 730, -Initial state transition probability data 740, ⁇ One day's state transition probability data 740' Is acquired or generated for healthy cows by the standardization processing unit 401, the labeling unit 402, the state identification unit 403, and the state transition probability calculation unit 404.
- the state transition probability calculation unit 604 acquires or generates the cow to be monitored.
- -Initial state transition probability data 740, ⁇ One day's state transition probability data 740' Since it is the same as the above, detailed description thereof will be omitted here.
- state transition probability data 740 and 740' are shown as state transition probability data 740 and 740'.
- the score calculation unit 1301 calculates the score for each transition probability using the above equation (2) as shown in FIG. do. As a result, score data 1410 is generated.
- the score calculation unit 1301 extracts the maximum score from the scores for each transition probability included in the score data 1410, and sets the extracted maximum score as the date of the cow to be monitored. It is output as data showing the degree of abnormality in.
- graph 1420 is a graph of data indicating the degree of abnormality of the cow to be monitored on each date, with the horizontal axis representing the date and the vertical axis representing the data indicating the degree of abnormality. The graph 1420 shows that the data indicating the current degree of abnormality is "390".
- FIG. 15 is a second flowchart showing the flow of analysis processing.
- each step of steps S1001 to S1006 executes the same process as each step of steps S1001 to S1006 shown in FIG. 10, and thus description thereof will be omitted here. ..
- step S1501 the score calculation unit 1301 of the analysis unit 1211 calculates a score for each transition probability based on the state transition probability data for one day of the monitored cow. Further, the score calculation unit 1301 of the analysis unit 1211 extracts the maximum score from the scores calculated for each transition probability and outputs it as data indicating the degree of abnormality of the cow to be monitored on the relevant date.
- the abnormality detection system is -Based on the time-series data showing the three-dimensional acceleration measured by the acceleration sensor attached to the neck of the cow to be monitored, the state of the cow to be monitored in each time range is specified.
- state transition probability data is generated by calculating the transition probability from the state at a predetermined timing in the specified time range to the next state.
- a score indicating the degree of abnormality of the state transition is calculated for each transition probability.
- the maximum score is extracted from the scores calculated for each transition probability and output as data indicating the degree of abnormality.
- the data indicating the degree of abnormality satisfies the predetermined condition, it is determined that the abnormality of the cow to be monitored is detected.
- the score is based on the state transition probability data of the cow to be monitored. Is calculated.
- the sign is detected before the cow to be monitored develops BRD (or BRDC). Will be possible.
- an abnormality detection system that detects an abnormality in a cow to be monitored.
- the acceleration sensor has been described as being attached to the neck portion, but the attachment portion of the acceleration sensor is not limited to the neck portion and may be attached to another portion.
- the acceleration sensor is attached as the motion sensor, but a motion sensor other than the acceleration sensor (for example, an angular velocity sensor) may be attached.
- the state transition probability data for a certain period of time is generated as the state transition probability data for a healthy cow, but the fixed period is a plurality of days even if it is one day. It may be.
- the state transition probability data for healthy cows even if the state transition probability data for one healthy cow is generated, the state transition probability data for multiple healthy cows is generated and the average value. May be calculated.
- data indicating the degree of abnormality is output for the cow to be monitored every day, and it is determined whether or not a sign (some abnormality) is detected every day.
- the output frequency for outputting data indicating the degree of abnormality and the determination frequency for determining whether or not a sign (some abnormality) is detected are not limited to one day, and even if it is less than one day, it is one day or more. There may be.
- time series data showing the three-dimensional acceleration has been described, but the number of axial directions using the time series data is not limited to three axes.
- time series data showing acceleration on any two axes may be used.
- time series data showing acceleration on one axis may be used.
- the time range during the standardization process is set to "1 [SEC]", but the time range during the standardization process is not limited to "1 [SEC]”.
- the determination condition as to whether or not a sign (some abnormality) is detected is not limited to this, and the determination may be made using other predetermined conditions. That is, it may be determined depending on whether or not the condition defined in advance is satisfied.
- the animal to be monitored is a cow, but an animal other than a cow may be a monitoring target.
- Anomaly detection system 110 Measuring device 130: Server device 131: Data acquisition unit 132: Reference data calculation unit 133: Analysis unit 134: Predictive detection unit 150, 160: Terminal equipment 401: Standardization processing unit 402: Labeling unit 403: State identification unit 404: State transition probability calculation unit 601: Standardization processing unit 602: Labeling unit 603: State identification unit 604: State transition probability calculation unit 605: Score calculation unit 1211: Analysis unit 1301: Score calculation unit
Landscapes
- Health & Medical Sciences (AREA)
- Life Sciences & Earth Sciences (AREA)
- Engineering & Computer Science (AREA)
- Biomedical Technology (AREA)
- Medical Informatics (AREA)
- Public Health (AREA)
- Environmental Sciences (AREA)
- General Health & Medical Sciences (AREA)
- Biophysics (AREA)
- Pathology (AREA)
- Biodiversity & Conservation Biology (AREA)
- Animal Husbandry (AREA)
- Primary Health Care (AREA)
- Veterinary Medicine (AREA)
- Physics & Mathematics (AREA)
- Epidemiology (AREA)
- Physiology (AREA)
- Heart & Thoracic Surgery (AREA)
- Molecular Biology (AREA)
- Surgery (AREA)
- Animal Behavior & Ethology (AREA)
- Business, Economics & Management (AREA)
- Data Mining & Analysis (AREA)
- General Business, Economics & Management (AREA)
- Zoology (AREA)
- Birds (AREA)
- Oral & Maxillofacial Surgery (AREA)
- Dentistry (AREA)
- Signal Processing (AREA)
- Databases & Information Systems (AREA)
- Psychiatry (AREA)
- Computer Vision & Pattern Recognition (AREA)
- Artificial Intelligence (AREA)
- Eye Examination Apparatus (AREA)
- Paper (AREA)
- Alarm Systems (AREA)
- Catching Or Destruction (AREA)
- Management, Administration, Business Operations System, And Electronic Commerce (AREA)
- Testing And Monitoring For Control Systems (AREA)
- Testing Or Calibration Of Command Recording Devices (AREA)
Priority Applications (6)
| Application Number | Priority Date | Filing Date | Title |
|---|---|---|---|
| US17/909,121 US20230102979A1 (en) | 2020-03-09 | 2021-03-03 | Abnormality detecting system |
| CN202180019100.7A CN115279182A (zh) | 2020-03-09 | 2021-03-03 | 异常检测系统 |
| EP21767132.0A EP4118960A1 (en) | 2020-03-09 | 2021-03-03 | Anomaly sensing system |
| BR112022017261A BR112022017261A2 (pt) | 2020-03-09 | 2021-03-03 | Sistema de detecção de anormalidade |
| JP2022505953A JPWO2021182204A1 (https=) | 2020-03-09 | 2021-03-03 | |
| AU2021233628A AU2021233628A1 (en) | 2020-03-09 | 2021-03-03 | Anomaly sensing system |
Applications Claiming Priority (2)
| Application Number | Priority Date | Filing Date | Title |
|---|---|---|---|
| JP2020040117 | 2020-03-09 | ||
| JP2020-040117 | 2020-03-09 |
Publications (1)
| Publication Number | Publication Date |
|---|---|
| WO2021182204A1 true WO2021182204A1 (ja) | 2021-09-16 |
Family
ID=77671595
Family Applications (1)
| Application Number | Title | Priority Date | Filing Date |
|---|---|---|---|
| PCT/JP2021/008052 Ceased WO2021182204A1 (ja) | 2020-03-09 | 2021-03-03 | 異常検知システム |
Country Status (7)
| Country | Link |
|---|---|
| US (1) | US20230102979A1 (https=) |
| EP (1) | EP4118960A1 (https=) |
| JP (1) | JPWO2021182204A1 (https=) |
| CN (1) | CN115279182A (https=) |
| AU (1) | AU2021233628A1 (https=) |
| BR (1) | BR112022017261A2 (https=) |
| WO (1) | WO2021182204A1 (https=) |
Families Citing this family (1)
| Publication number | Priority date | Publication date | Assignee | Title |
|---|---|---|---|---|
| CN116680595B (zh) * | 2023-05-05 | 2025-11-18 | 北京市农林科学院信息技术研究中心 | 异常奶牛检测方法、装置、电子设备及介质 |
Citations (5)
| Publication number | Priority date | Publication date | Assignee | Title |
|---|---|---|---|---|
| WO2011120529A1 (en) * | 2010-03-31 | 2011-10-06 | Københavns Universitet | Model for classifying an activity of an animal |
| JP5156030B2 (ja) * | 2007-02-09 | 2013-03-06 | ヘイレックス リミテッド | 活動の監視および表示 |
| WO2018012005A1 (ja) * | 2016-07-13 | 2018-01-18 | 浩二 清家 | 牛の活動状態管理システム |
| JP2019122368A (ja) * | 2018-01-12 | 2019-07-25 | デザミス株式会社 | 牛の健康状態管理システム及び管理方法並びに健康状態管理プログラム |
| JP2020040117A (ja) | 2018-09-12 | 2020-03-19 | 青山 省司 | プロジェクションナットの供給ロッドおよび供給方法 |
Family Cites Families (1)
| Publication number | Priority date | Publication date | Assignee | Title |
|---|---|---|---|---|
| JP7016302B2 (ja) * | 2018-08-01 | 2022-02-04 | ルネサスエレクトロニクス株式会社 | 情報処理装置、情報処理システム、及びプログラム |
-
2021
- 2021-03-03 EP EP21767132.0A patent/EP4118960A1/en not_active Withdrawn
- 2021-03-03 US US17/909,121 patent/US20230102979A1/en not_active Abandoned
- 2021-03-03 WO PCT/JP2021/008052 patent/WO2021182204A1/ja not_active Ceased
- 2021-03-03 BR BR112022017261A patent/BR112022017261A2/pt not_active Application Discontinuation
- 2021-03-03 JP JP2022505953A patent/JPWO2021182204A1/ja active Pending
- 2021-03-03 CN CN202180019100.7A patent/CN115279182A/zh active Pending
- 2021-03-03 AU AU2021233628A patent/AU2021233628A1/en not_active Abandoned
Patent Citations (5)
| Publication number | Priority date | Publication date | Assignee | Title |
|---|---|---|---|---|
| JP5156030B2 (ja) * | 2007-02-09 | 2013-03-06 | ヘイレックス リミテッド | 活動の監視および表示 |
| WO2011120529A1 (en) * | 2010-03-31 | 2011-10-06 | Københavns Universitet | Model for classifying an activity of an animal |
| WO2018012005A1 (ja) * | 2016-07-13 | 2018-01-18 | 浩二 清家 | 牛の活動状態管理システム |
| JP2019122368A (ja) * | 2018-01-12 | 2019-07-25 | デザミス株式会社 | 牛の健康状態管理システム及び管理方法並びに健康状態管理プログラム |
| JP2020040117A (ja) | 2018-09-12 | 2020-03-19 | 青山 省司 | プロジェクションナットの供給ロッドおよび供給方法 |
Non-Patent Citations (1)
| Title |
|---|
| CARGILL, CARGILL BRINGS FACIAL RECOGNITION CAPABILITY TO FARMERS THROUGH STRATEGIC EQUITY INVESTMENT IN CAINTHUS, 31 January 2018 (2018-01-31) |
Also Published As
| Publication number | Publication date |
|---|---|
| EP4118960A1 (en) | 2023-01-18 |
| CN115279182A (zh) | 2022-11-01 |
| AU2021233628A1 (en) | 2022-09-22 |
| BR112022017261A2 (pt) | 2022-10-18 |
| US20230102979A1 (en) | 2023-03-30 |
| JPWO2021182204A1 (https=) | 2021-09-16 |
Similar Documents
| Publication | Publication Date | Title |
|---|---|---|
| Kleen et al. | Precision livestock farming: What does it contain and what are the perspectives? | |
| CN112385569B (zh) | 使用健康图网络检测和管理牲畜中的疾病爆发 | |
| US10445563B2 (en) | Time-in-store estimation using facial recognition | |
| US20130282295A1 (en) | System and method for classifying respiratory and overall health status of an animal | |
| CN110287330A (zh) | 词向量的在线字典扩展 | |
| US12205046B2 (en) | Device for ensembling data received from prediction devices and operating method thereof | |
| KR102043687B1 (ko) | 음성 인식 기반의 열화상 카메라를 이용하는 스마트 미러 장치 및 그 방법 | |
| WO2021182204A1 (ja) | 異常検知システム | |
| EP4501104A1 (en) | Animal behavior recording device, animal behavior recording method, and program | |
| JP7222344B2 (ja) | 判定装置、判定方法、判定プログラム、学習装置、学習方法、および、学習プログラム | |
| Behmann et al. | Support Vector machine and duration-aware conditional random field for identification of spatio-temporal activity patterns by combined indoor positioning and heart rate sensors | |
| JP7005463B2 (ja) | 学習装置、学習方法及びプログラム | |
| EP4118961A1 (en) | Anomaly sensing system | |
| US20190156530A1 (en) | Visualization method, visualization device, and recording medium | |
| KR102828362B1 (ko) | 영상 기반 가축의 재고 관리 장치 및 방법 | |
| US20250184230A1 (en) | Traffic prediction device, traffic prediction method, and program | |
| KR102915607B1 (ko) | 행동 정보를 기반으로 요약한 영상을 활용한 애견의 건강 모니터링 방법 및 시스템 | |
| JP7534279B2 (ja) | 計算機システム及び監視オブジェクトのトラッキング方法 | |
| KR102880842B1 (ko) | 동물의 사회성을 정량적으로 측정하는 방법, 이를 위한 프로그램 및 장치 | |
| WO2021255898A1 (ja) | 情報処理装置、情報処理方法、情報処理システム、及びコンピュータ読み取り可能な記憶媒体 | |
| EP4276847A1 (en) | Defining a timestamp for a target medical event | |
| US20260033462A1 (en) | Systems and methods for deep learning-based pet health predictions | |
| JP2026038234A (ja) | システム | |
| JP2025109296A (ja) | 豚の活動量測定方法、豚の活動量測定プログラムが記憶された非一時的コンピュータ可読記憶媒体、および豚の活動量測定システム | |
| Agrusti | Big Data approaches as a support for precision livestock farming techniques |
Legal Events
| Date | Code | Title | Description |
|---|---|---|---|
| 121 | Ep: the epo has been informed by wipo that ep was designated in this application |
Ref document number: 21767132 Country of ref document: EP Kind code of ref document: A1 |
|
| ENP | Entry into the national phase |
Ref document number: 2022505953 Country of ref document: JP Kind code of ref document: A |
|
| REG | Reference to national code |
Ref country code: BR Ref legal event code: B01A Ref document number: 112022017261 Country of ref document: BR |
|
| ENP | Entry into the national phase |
Ref document number: 2021233628 Country of ref document: AU Date of ref document: 20210303 Kind code of ref document: A |
|
| NENP | Non-entry into the national phase |
Ref country code: DE |
|
| ENP | Entry into the national phase |
Ref document number: 2021767132 Country of ref document: EP Effective date: 20221010 |
|
| ENP | Entry into the national phase |
Ref document number: 112022017261 Country of ref document: BR Kind code of ref document: A2 Effective date: 20220829 |