EP4118960A1 - Anomaly sensing system - Google Patents
Anomaly sensing system Download PDFInfo
- Publication number
- EP4118960A1 EP4118960A1 EP21767132.0A EP21767132A EP4118960A1 EP 4118960 A1 EP4118960 A1 EP 4118960A1 EP 21767132 A EP21767132 A EP 21767132A EP 4118960 A1 EP4118960 A1 EP 4118960A1
- Authority
- EP
- European Patent Office
- Prior art keywords
- data
- state
- transition probability
- unit
- cow
- Prior art date
- Legal status (The legal status is an assumption and is not a legal conclusion. Google has not performed a legal analysis and makes no representation as to the accuracy of the status listed.)
- Withdrawn
Links
Images








Classifications
-
- A—HUMAN NECESSITIES
- A01—AGRICULTURE; FORESTRY; ANIMAL HUSBANDRY; HUNTING; TRAPPING; FISHING
- A01K—ANIMAL HUSBANDRY; AVICULTURE; APICULTURE; PISCICULTURE; FISHING; REARING OR BREEDING ANIMALS, NOT OTHERWISE PROVIDED FOR; NEW BREEDS OF ANIMALS
- A01K29/00—Other apparatus for animal husbandry
- A01K29/005—Monitoring or measuring activity
-
- A—HUMAN NECESSITIES
- A01—AGRICULTURE; FORESTRY; ANIMAL HUSBANDRY; HUNTING; TRAPPING; FISHING
- A01K—ANIMAL HUSBANDRY; AVICULTURE; APICULTURE; PISCICULTURE; FISHING; REARING OR BREEDING ANIMALS, NOT OTHERWISE PROVIDED FOR; NEW BREEDS OF ANIMALS
- A01K11/00—Marking of animals
- A01K11/006—Automatic identification systems for animals, e.g. electronic devices, transponders for animals
-
- A—HUMAN NECESSITIES
- A61—MEDICAL OR VETERINARY SCIENCE; HYGIENE
- A61B—DIAGNOSIS; SURGERY; IDENTIFICATION
- A61B5/00—Measuring for diagnostic purposes; Identification of persons
- A61B5/103—Measuring devices for testing the shape, pattern, colour, size or movement of the body or parts thereof, for diagnostic purposes
- A61B5/11—Measuring movement of the entire body or parts thereof, e.g. head or hand tremor or mobility of a limb
- A61B5/1118—Determining activity level
-
- A—HUMAN NECESSITIES
- A61—MEDICAL OR VETERINARY SCIENCE; HYGIENE
- A61B—DIAGNOSIS; SURGERY; IDENTIFICATION
- A61B5/00—Measuring for diagnostic purposes; Identification of persons
- A61B5/72—Signal processing specially adapted for physiological signals or for diagnostic purposes
- A61B5/7271—Specific aspects of physiological measurement analysis
- A61B5/7282—Event detection, e.g. detecting unique waveforms indicative of a medical condition
-
- A—HUMAN NECESSITIES
- A61—MEDICAL OR VETERINARY SCIENCE; HYGIENE
- A61B—DIAGNOSIS; SURGERY; IDENTIFICATION
- A61B5/00—Measuring for diagnostic purposes; Identification of persons
- A61B5/74—Details of notification to user or communication with user or patient; User input means
- A61B5/746—Alarms related to a physiological condition, e.g. details of setting alarm thresholds or avoiding false alarms
-
- G—PHYSICS
- G16—INFORMATION AND COMMUNICATION TECHNOLOGY [ICT] SPECIALLY ADAPTED FOR SPECIFIC APPLICATION FIELDS
- G16H—HEALTHCARE INFORMATICS, i.e. INFORMATION AND COMMUNICATION TECHNOLOGY [ICT] SPECIALLY ADAPTED FOR THE HANDLING OR PROCESSING OF MEDICAL OR HEALTHCARE DATA
- G16H40/00—ICT specially adapted for the management or administration of healthcare resources or facilities; ICT specially adapted for the management or operation of medical equipment or devices
- G16H40/60—ICT specially adapted for the management or administration of healthcare resources or facilities; ICT specially adapted for the management or operation of medical equipment or devices for the operation of medical equipment or devices
- G16H40/63—ICT specially adapted for the management or administration of healthcare resources or facilities; ICT specially adapted for the management or operation of medical equipment or devices for the operation of medical equipment or devices for local operation
-
- G—PHYSICS
- G16—INFORMATION AND COMMUNICATION TECHNOLOGY [ICT] SPECIALLY ADAPTED FOR SPECIFIC APPLICATION FIELDS
- G16H—HEALTHCARE INFORMATICS, i.e. INFORMATION AND COMMUNICATION TECHNOLOGY [ICT] SPECIALLY ADAPTED FOR THE HANDLING OR PROCESSING OF MEDICAL OR HEALTHCARE DATA
- G16H40/00—ICT specially adapted for the management or administration of healthcare resources or facilities; ICT specially adapted for the management or operation of medical equipment or devices
- G16H40/60—ICT specially adapted for the management or administration of healthcare resources or facilities; ICT specially adapted for the management or operation of medical equipment or devices for the operation of medical equipment or devices
- G16H40/67—ICT specially adapted for the management or administration of healthcare resources or facilities; ICT specially adapted for the management or operation of medical equipment or devices for the operation of medical equipment or devices for remote operation
-
- G—PHYSICS
- G16—INFORMATION AND COMMUNICATION TECHNOLOGY [ICT] SPECIALLY ADAPTED FOR SPECIFIC APPLICATION FIELDS
- G16H—HEALTHCARE INFORMATICS, i.e. INFORMATION AND COMMUNICATION TECHNOLOGY [ICT] SPECIALLY ADAPTED FOR THE HANDLING OR PROCESSING OF MEDICAL OR HEALTHCARE DATA
- G16H50/00—ICT specially adapted for medical diagnosis, medical simulation or medical data mining; ICT specially adapted for detecting, monitoring or modelling epidemics or pandemics
- G16H50/70—ICT specially adapted for medical diagnosis, medical simulation or medical data mining; ICT specially adapted for detecting, monitoring or modelling epidemics or pandemics for mining of medical data, e.g. analysing previous cases of other patients
-
- A—HUMAN NECESSITIES
- A01—AGRICULTURE; FORESTRY; ANIMAL HUSBANDRY; HUNTING; TRAPPING; FISHING
- A01K—ANIMAL HUSBANDRY; AVICULTURE; APICULTURE; PISCICULTURE; FISHING; REARING OR BREEDING ANIMALS, NOT OTHERWISE PROVIDED FOR; NEW BREEDS OF ANIMALS
- A01K2227/00—Animals characterised by species
- A01K2227/10—Mammal
- A01K2227/101—Bovine
-
- A—HUMAN NECESSITIES
- A01—AGRICULTURE; FORESTRY; ANIMAL HUSBANDRY; HUNTING; TRAPPING; FISHING
- A01K—ANIMAL HUSBANDRY; AVICULTURE; APICULTURE; PISCICULTURE; FISHING; REARING OR BREEDING ANIMALS, NOT OTHERWISE PROVIDED FOR; NEW BREEDS OF ANIMALS
- A01K2267/00—Animals characterised by purpose
- A01K2267/03—Animal model, e.g. for test or diseases
- A01K2267/0337—Animal models for infectious diseases
-
- A—HUMAN NECESSITIES
- A61—MEDICAL OR VETERINARY SCIENCE; HYGIENE
- A61B—DIAGNOSIS; SURGERY; IDENTIFICATION
- A61B2503/00—Evaluating a particular growth phase or type of persons or animals
- A61B2503/40—Animals
Definitions
- the present invention relates to an abnormality detecting system.
- a workflow from breeding through marketing of a cow is broadly divided into multiple steps (for example, grass-feeding, fattening, meat-processing, and so forth).
- steps for example, grass-feeding, fattening, meat-processing, and so forth.
- the fattening process is carried out in a certain area called a feedlot, and therefore, a cow is susceptible to a bovine respiratory disease (BRD) or a bovine respiratory disease complex (BRDC).
- BTD bovine respiratory disease
- BRDC bovine respiratory disease complex
- Non-Patent Document 1 proposes a system for automatically detecting a cow that has actually developed a BRD (or BRDC) among cows infected with the BRD (or BRDC).
- the system allows earliest identification of the cow that has actually developed the BRD (or BRDC).
- Non-Patent Document 1 Cargill, "Cargill brings facial recognition capability to farmers through strategic equity investment in Cainthus", [online], January 31, 2018 [retrieved February 28, 2020], Internet [URL: https://www.cargill.com/2018/cargrill-brings-facial-recognition-capability-to-farmers]
- detecting an early warning of (or some abnormality concerning) a BRD (or BRDC) prior to an onset of the BRD (or BRDC) in a cow that is a monitoring target may reduce various costs required due to the onset of the BRD (or BRDC) or an increase in severity of the BRD (or BRDC).
- an object is to provide an abnormality detecting system for detecting an abnormality in an animal that is a monitoring target.
- an abnormality detecting system includes
- An abnormality detecting system for detecting an abnormality in an animal that is a monitoring target can be provided.
- Fig. 1 is a first diagram illustrating an example of the system configuration of the abnormality detecting system and the functional configuration of the server apparatus.
- the abnormality detecting system 100 is a system for detecting an early warning of (or some abnormality concerning) a BRD (or BRDC) in any cow in a feedlot before the cow develops the BRD (or BRDC) during a fattening process.
- the abnormality detecting system 100 includes a measuring device 110, a gateway device 120, and the server apparatus 130.
- the measuring device 110 and the gateway device 120 are interconnected via wireless communication
- the gateway device 120 and the server apparatus 130 are interconnected via a network (not depicted).
- the measuring device 110 is a motion sensor (in the present embodiment, an acceleration sensor) of three dimensions (an X-axis direction, a Y-axis direction, and a Z-axis direction) attached to a predetermined portion of a cow 10 (in the example of Fig. 1 , the neck of the cow 10).
- the X-axis direction is, for example, a direction along a body surface of the neck of the cow 10, which is a direction along a circumference of the neck
- the Y-axis direction is, for example, a direction along the body surface of the neck of the cow 10, which is a direction to the body relative to the head.
- the Z-axis direction is, for example, a direction perpendicular to the body surface of the neck of the cow 10.
- the measuring device 110 measures time-series three-dimensional acceleration data at a predetermined sampling frequency and transmits the data to the gateway device 120.
- the gateway device 120 transmits the time-series three-dimensional acceleration data transmitted from the measuring device 110 to the server apparatus 130.
- the server apparatus 130 detects an early warning of (or some abnormality concerning) a BRD (or BRDC) in any cow in a feedlot before the cow develops the BRD (or BRDC).
- An abnormality detecting program is installed in the server apparatus 130, and when the program is executed, the server apparatus 130 functions as a data obtaining unit 131, a reference data calculation unit 132, an analysis unit 133, and an early warning detecting unit 134.
- the data obtaining unit 131 stores time-series data of healthy cow among the time-series data representing the three-dimensional acceleration transmitted from the gateway device 120 in the acceleration data storing unit 135.
- the reference data calculation unit 132 reads out the time-series data representing the three-dimensional acceleration of healthy cow stored in the acceleration data storing unit 135 and calculates state transition probability data of healthy cow (will be described in detail below).
- the reference data calculation unit 132 stores the state transition probability data of healthy cow in the reference data storing unit 136 as reference data.
- the analysis unit 133 calculates state transition probability data of the cow that is a monitoring target based on time-series data of the cow that is a monitoring target among the time-series data representing the three-dimensional acceleration acquired by the data obtaining unit 131.
- the analysis unit 133 calculates a score indicating how far the state transition probability data of the cow that is a monitoring target deviated from the state transition probability data of healthy cow (that is, an abnormality of the state transition).
- the early warning detecting unit 134 (determining unit) acquires the score calculated by the analysis unit 133 as data indicating the abnormality of the cow that is a monitoring target and determines whether an early warning (or some abnormality) is detected before development of BRD (or BRDC) in the cow that is a monitoring target. When it is determined that an early warning (or some abnormality) has been detected, the early warning detecting unit 134 notifies a user.
- the early warning detecting unit 134 determines that an early warning (or some abnormality) has been detected.
- Fig. 2 is a diagram illustrating an example of a hardware configuration of the server apparatus.
- the server apparatus 130 includes a processor 201, a memory 202, an auxiliary storage device 203, an interface (I/F) device 204, a communication device 205, and a drive device 206. These hardware elements of the server apparatus 130 are interconnected via a bus 207.
- the processor 201 includes various arithmetic and logic operation units such as a central processing unit (CPU), a graphics processing unit (GPU), and so forth.
- the processor 201 reads various programs (for example, an abnormality detecting program, and so forth), writes the programs into the memory 202, and executes the programs.
- programs for example, an abnormality detecting program, and so forth
- the memory 202 includes main storage devices such as a read-only memory (ROM), a random access memory (RAM), and the like.
- the processor 201 and the memory 202 form what is known as a computer, and when the processor 201 executes the various programs read and written onto the memory 202, the computer implements the above-described functions.
- the auxiliary storage device 203 stores the various programs and various data used when the various programs are executed by the processor 201.
- the acceleration data storing unit 135 and the reference data storing unit 136 are implemented in the auxiliary storage device 203.
- the I/F device 204 is a connection device that connects a manually-operating device 210, a display device 211, and the server apparatus 130, which are examples of an external apparatus/device.
- the I/F device 204 receives a manual operation performed on the server apparatus 130 through the manually-operating device 210.
- the I/F device 204 outputs the result of a process performed by the server apparatus 130 and displays the result through the display device 211.
- the communication device 205 is a communication device for communicating with other apparatuses/devices. In the server apparatus 130, the communication device 205 is used to communicate with the gateway device 120 that is another device.
- the drive device 206 is a device for setting a recording medium 212.
- the recording medium 212 is a medium for optically, electrically, or magnetically recording information, such as a CD-ROM, a flexible disk, a magneto-optical disk, or the like.
- the recording medium 212 may be a semiconductor memory or the like that electrically records information, such as a ROM, a flash memory, or the like.
- the various programs installed in the auxiliary storage device 203 are installed, for example, as a result of a distributed recording medium 212 being set in the drive device 206 and the various programs recorded in the recording medium 212 being read out by the drive device 206.
- the various programs installed in the auxiliary storage device 203 may have been installed by downloading the various programs from a network via the communication device 205.
- Fig. 3 is a diagram illustrating a specific example of process of the data obtaining unit.
- the data obtaining unit 131 acquires a set of time-series data (time-series X-axis-directional acceleration data, time-series Y-axis-directional acceleration data, and time-series Z-axis-directional acceleration data) for various cows transmitted from the gateway device 120.
- the data obtaining unit 131 stores a set of time-series data for healthy cow in the acceleration data storing unit 135.
- Fig. 4 is a diagram illustrating a detailed functional configuration of the reference data calculation unit.
- the reference data calculation unit 132 includes a standardization processing unit 401 (the second standardization processing unit), a labeling unit 402 (the second labeling unit), a state identification unit 403 (the second identification unit), and a state transition probability calculation unit 404 (the second calculation unit).
- the standardization processing unit 401 reads out the set of time-series data for healthy cow from the acceleration data storing unit 135, performs the standardization process for the time-series data in each axis, and notifies the labeling unit 402 of the standardized data.
- the standardization process refers to a process of dividing the time-series data of each axis by a predetermined time range (for example, 1 [SEC]) and calculating a variation of the time-series data of each axis in each time range. That is, the standardized data is composed of calculation results of the variation of the time-series data of each axis in each time range.
- the labeling unit 402 performs a labeling process on the standardized data.
- the labeling process is performed, i.e.,
- the state identification unit 403 identifies a state of healthy cow in each time range based on the labeling data generated by performing the labeling process on the time-series data of each axis in each time range. For example, in each time range, when the result of the labeling process for the time-series data in the X-axis direction (L x ), the result of the labeling process for the time-series data in the Y-axis direction (L Y ), and the result of the labeling process for the time-series data in the Z-axis direction (L Z ),
- the state transition probability calculation unit 404 calculates a transition probability indicating to which state a state of healthy cow at a predetermined timing of each time range is changed in the next time range. For example, when the state of the cow 10 in the current time range is "state I", the state of the cow 10, in the next time range, transitions to one of 729 states of "state I" to "state DCCXXIX".
- the state transition probability calculation unit 404 counts states transitioned from "state I" in the next time range for each state of the transition destination for a certain period of time.
- the state transition probability calculation unit 404 divides a number of transitions to each state by the total number of transitions to any state. Accordingly, the state transition probability calculation unit 404 calculates the transition probability from the current state to the next state, for example, for the cow 10.
- the state transition probability calculation unit 404 stores the state transition probability data generated by calculating the transition probabilities for, for example, all states of the cow 10 as the transition source in the reference data storing unit 136 as reference data.
- the state transition probability data generated by the state transition probability calculation unit 404 is data indicating a tendency of movement of healthy cow.
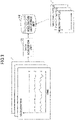
- Fig. 5 is a diagram illustrating a specific example of process of the reference data calculation unit.
- the standardization processing unit 401 performs the standardization process to generate the standardized data 520.
- the example of Fig. 5 shows that spacing between dashed lines of the set of time-series data 510 is a time range of 1 [SEC].
- the value included in the standardized data 520 indicates the variation of the time-series data calculated for each of the X-axis, Y-axis, and Z-axis for every 1 [SEC].
- the labeling process is performed for the standardized data 520 by the labeling unit 402, and the labeling data 530 is generated.
- the state identification unit 403 identifies the state in each time range of healthy cow based on the result of the labeling process of each axis in each time range constituting the labeling data 530 (states I, V, and IV).
- the state transition probability calculation unit 404 calculates the transition probability from a state at the predetermined timing of each time range to the next state for healthy cow based on the data (data for a certain period of time) indicating a state in each time range of healthy cow.
- the state transition probability calculation unit 404 generates state transition probability data 540 of healthy cow.
- the state transition probability data 540 of Fig. 5 is generated by arranging the current state (729 states) of healthy cow vertically, and the next state (729 states) of healthy cow horizontally, and storing the transition probabilities to the next state in each column.
- the same process is performed for the transition destination states of from “state III” to “state DCCXXIX”, and for the transition source states of from “state II” to “state DCCXXIX”, so that the state transition probability data 540 of healthy cow is generated.
- the state transition probability data 540 generated for healthy cow is stored in the reference data storing unit 136 as reference data.
- Fig. 6 is a diagram illustrating a detailed functional configuration of the analysis unit.
- the analysis unit 133 includes a standardization processing unit 601 (first standardization processing unit) and a labeling unit 602 (first labeling unit).
- the analysis unit 133 includes a state identification unit 603 (first identification unit), a state transition probability calculation unit 604 (first calculation unit), and a score calculation unit 605 (first score calculation unit).
- the score calculation unit 605 acquires the state transition probability data of the cow that is a monitoring target generated by the state transition probability calculation unit 604.
- the score calculation unit 605 reads out the state transition probability data of healthy cow from the reference data storing unit 136.
- the score calculation unit 605 calculates for each transition probability a score indicating how far the state transition probability data of the cow that is a monitoring target deviates from the state transition probability data of healthy cow (that is, an abnormality of the state transition).
- the score calculation unit 605 extracts the maximum score from among all of the scores calculated for each of the transition probabilities, and outputs it as data indicating the abnormality of the cow that is a monitoring target at the relevant date.
- the state probability data generated by the state transition probability calculation unit 604 can be said to be data indicating a tendency of movement of the cow that is a monitoring target.
- the above score is calculated to detect the change, in contrast to the tendency of movement of healthy cow.
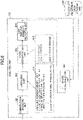
- Fig. 7 is a diagram illustrating a specific example of process of the analysis unit.
- the state transition probability calculation unit 604 generates the one-day state transition probability data 740' of the cow that is a monitoring target by accumulating data of one day for initial state transition probability data 740 of the cow that is a monitoring target.
- the initial state transition probability data 740 refers to state transition probability data in which the transition probability of each state is "0".
- only five current states and five subsequent states are shown as the state transition probability data 740 and 740' due to the limited space in the figure.
- the score calculation unit 605 reads out the state transition probability data 540 for healthy cow and uses the above equation (1) to calculate the score for each transition probability, as shown in Fig. 7 , by generating the one-day state transition probability data 740' of the cow that is a monitoring target. Thus, score data 750 is generated.
- the score calculation unit 605 extracts the maximum score from among the scores for each of the transition probabilities included in the score data 750, and outputs the extracted maximum score as data indicating the abnormality of the cow that is a monitoring target at the relevant date.
- a graph 760 is a graphical representation of the data representing the abnormality at each date of the cow that is a monitoring target, with the horizontal axis representing the date and the vertical axis representing the abnormality. The graph 760 shows that the data indicating the current abnormality is "410".
- Fig. 8 is a diagram illustrating a specific example of process of the early warning detecting unit.
- a graph 800 in the same manner as the graph 760, has a horizontal axis indicating date and a vertical axis indicating abnormality.
- the graph 800 also shows that the data representing the abnormality is greater than or equal to the threshold value at the date represented by the reference numeral 801, the reference numeral 802, and the reference numeral 803.
- the graph 800 shows that, in the case of the date indicated by the reference numeral 801, since the data indicating the abnormality is greater than or equal to the threshold only in one day and is not consecutive, the early warning detecting unit 134 does not determine that an early warning (or some abnormality) has been detected.
- the graph 800 shows that, in the case of the date indicated by the reference numeral 803, since the data indicating the abnormality is greater than or equal to the threshold value for consecutive two days, the early warning detecting unit 134 determines that an early warning (or some abnormality) has been detected.
- Fig. 9 is a flowchart illustrating the flow of the reference data calculation process.
- step S901 the data obtaining unit 131 acquires time-series data indicating the three-dimensional acceleration of healthy cow.
- step S902 the standardization processing unit 401 of the reference data calculation unit 132 performs the standardization process for the time-series data representing the three-dimensional acceleration of healthy cow and generates the standardized data.
- step S903 the labeling unit 402 of the reference data calculation unit 132 performs the labeling process for the standardized data, and generates labeling data.
- step S904 the state identification unit 403 of the reference data calculation unit 132 identifies the state of each time range of healthy cow based on the labeling data.
- step S905 the state transition probability calculation unit 404 of the reference data calculation unit 132 generates state transition probability data of healthy cow based on data indicating the state of each time range of healthy cow.
- step S906 the state transition probability calculation unit 404 of the reference data calculation unit 132 stores the generated state transition probability data of healthy cow in the reference data storing unit 136 as the reference data.
- step S907 the state transition probability calculation unit 404 of the reference data calculation unit 132 determines whether the state transition probability data for a certain period of time of healthy cow has been generated. When it is determined in step S907 that the data is not generated (in the case of NO in step S907), the process returns to step S901.
- step S907 when it is determined in step S907 that the data is generated (in the case of YES in step S907), the reference data calculation process ends.
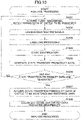
- Fig. 10 is a first flowchart showing the flow of the analysis process and shows the one-day analysis process.
- step S1001 the data obtaining unit 131 acquires time-series data representing the three-dimensional acceleration of the cow that is a monitoring target.
- step S1002 the standardization processing unit 601 of the analysis unit 133 performs the standardization process for the time-series data representing the three-dimensional acceleration of the cow that is a monitoring target, and generates the standardized data.
- step S1003 the labeling unit 602 of the analysis unit 133 performs the labeling process for the standardized data and generates the labeling data.
- step S1004 the state identification unit 603 of the analysis unit 133 identify the state of each time range of healthy cow based on the labeling data.
- step S1005 the state transition probability calculation unit 604 of the analysis unit 133 generates the state transition probability data of the cow that is a monitoring target based on data indicating the state of the cow that is a monitoring target in each time range.
- step S1006 the state transition probability calculation unit 604 of the analysis unit 133 determines whether one-day state transition probability data of the cow that is a monitoring target has been generated. When it is determined in step S1006 that the one-day state transition probability data has not been generated (in the case of NO in step S1006), the process returns to step S1001.
- step S1006 when it is determined in step S1006 that the one-day state transition probability data has been generated (in the case of YES in step S1006), the process proceeds to step S1007.
- step S1007 the score calculation unit 605 of the analysis unit 133 acquires the one-day state transition probability data of the cow that is a monitoring target, and reads out the state transition probability data of healthy cow as reference data from the reference data storing unit 136.
- Step S1008 the score calculation unit 605 of the analysis unit 133 calculates a score for each transition probability based on the one-day state transition probability data of the cow that is a monitoring target and the state transition probability data of healthy cow read as reference data. Further, the score calculation unit 605 of the analysis unit 133 extracts the maximum score from among the scores calculated for each of the transition probabilities, and outputs it as data indicating the abnormality of the cow that is a monitoring target at the relevant date.
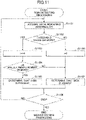
- Fig. 11 is a flowchart illustrating the flow of the early warning detecting process.
- step S1101 the early warning detecting unit 134 acquires data representing the abnormality of the cow that is a monitoring target, which is output every day from the score calculation unit 605 of the analysis unit 133.
- step S1102 the early warning detecting unit 134 determines whether the acquired data representing abnormality is greater than or equal to a predetermined threshold value. If it is determined in step S1102 that the acquired data representing abnormality is greater than or equal to the predetermined threshold value (in the case of YES in step S1102), the process proceeds to step S1103.
- step S1103 the early warning detecting unit 134 increments a counter i which counts the number of consecutive days. It is assumed that "0" is input as the initial value in counter i.
- step S1104 the early warning detecting unit 134 determines whether the counter i is greater than or equal to a predetermined number (for example, two days or more). When it is determined in step S1104 that the counter i is greater than or equal to the predetermined number (in the case of YES in step S1104), the process proceeds to step S1105.
- a predetermined number for example, two days or more.
- step S1105 the early warning detecting unit 134 determines that an early warning (or some abnormality) has been detected, and notifies the user thereof.
- step S1104 when it is determined in step S1104 that the counter i is less than the predetermined number (in the case of NO in step S1104), the process proceeds to step S1007.
- step S1102 When it is determined in step S1102 that the acquired data is less than the threshold value (in the case of NO in step S1102), the process proceeds to step S1106, "0" is input into the counter i, and the process proceeds to step S1107.
- step S1107 it is determined that the early warning detecting unit 134 does not detect an early warning (or some abnormality).
- step S1108 the early warning detecting unit 134 determines whether the early warning detecting process ends, and returns to step S1101 when it is determined that the early warning detecting process is to be continued (in the case of NO in step S1108). On the other hand, in Step S1108, when it is determined that the early warning detecting process is to be ended (in the case of YES in Step S1108), the early warning detecting process ends.
- the abnormality detecting system performs the following process.
- States of healthy cow in each time range are identified on the basis of time-series data representing a three-dimensional acceleration as measured by an acceleration sensor placed on a neck of healthy cow.
- State transition probability data is generated by calculating a transition probability from a state at a predetermined timing of each identified time range to a next state.
- States of cow that is a monitoring target in each time range are identified based on time-series data representing a three-dimensional acceleration as measured by an acceleration sensor placed on a neck of the cow that is a monitoring target.
- State transition probability data is generated by calculating the transition probability from a state at a predetermined timing of the identified time range to the next state.
- a score representing an abnormality of a state transition is calculated for each transition probability.
- the maximum score is extracted from the score calculated for each transition probability, and is output as data representing the abnormality.
- a score is calculated based on the state transition probability data of the cow that is a monitoring target and healthy cow to detect a change in a tendency of movement occurring prior to development of BRD (or BRDC) in contrast to the tendency of movement of healthy cow. Therefore, by the abnormality detecting system according to the first embodiment, it is possible to detect an early warning (or some abnormality) before the cow that is a monitoring target develops BRD (or BRDC).
- an abnormality detecting system for detecting an abnormality of cow that is a monitoring target can be provided.
- the score was calculated based on the state transition probability data of the cow that is a monitoring target and the state transition probability data of healthy cow.
- the method for calculating the score is not limited, and, for example, the score may be calculated based on the state transition probability data of the cow that is a monitoring target. In other words, rather than detecting a change in the tendency of movement based on the contrast to the state transition probability data of healthy cow, a change in the tendency of movement may be detected based on the state transition probability data of only the cow that is a monitoring target.
- the second embodiment will be described focusing on the differences from the first embodiment described above.
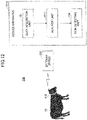
- Fig. 12 is a second diagram illustrating an example of the system configuration of the abnormality detecting system and the functional configuration of the server apparatus.
- the server apparatus 1210 functions as a data obtaining unit 131, an analysis unit 1211, and an early warning detecting unit 134 when an abnormality detecting program is executed.
- the data obtaining unit 131 and the early warning detecting unit 134 are the same as the data obtaining unit 131 and the early warning detecting unit 134 illustrated in Fig. 1 , and therefore the description thereof will be omitted here.
- the analysis unit 1211 generates state transition probability data of the cow that is a monitoring target based on the time-series data of the cow that is a monitoring target among the time-series data representing the three-dimensional acceleration acquired by the data obtaining unit 131.
- the analysis unit 1211 calculates the score indicating
- Fig. 13 is a diagram illustrating a detailed functional configuration of the analysis unit.
- the analysis unit 1211 includes a standardization processing unit 601, a labeling unit 602, a state identification unit 603, a state transition probability calculation unit 604, and a score calculation unit 1301 (a second score calculation unit).
- the functions of the respective units of from the standardization processing unit 601 to the state transition probability calculation unit 604 are the same as the functions of the units of from the standardization processing unit 401 to the state transition probability calculation unit 404 of the reference data calculation unit 132 described with reference to Fig. 4 . Accordingly, the score calculation unit 1301 will be described here.
- the score calculation unit 1301 acquires the state transition probability data of the cow that is a monitoring target generated by the state transition probability calculation unit 604.
- X represents the state transition probability data of the cow that is a monitoring target.
- the score calculation unit 1301 calculates a score indicating the degree of increase or decrease in each transition probability included in the state transition probability data of the cow that is a monitoring target for each transition probability.
- the score calculation unit 1301 extracts the maximum score from among the scores calculated for each of the transition probabilities, and outputs the maximum score as data indicating the abnormality of the cow that is a monitoring target at the relevant date.
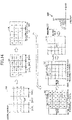
- Fig. 14 is a diagram illustrating a specific example of the process of the analysis unit.
- the score calculation unit 1301 calculates the score for each transition probability using the above equation (2) as shown in Fig. 14 .
- the score data 1410 is generated.
- the score calculation unit 1301 extracts the maximum score from among the scores for each of the transition probabilities included in the score data 1410 and outputs the extracted maximum score as data indicating the abnormality of the cow that is a monitoring target at the relevant date.
- a graph 1420 is a graphical representation of the data representing the abnormality at each date of the cow that is a monitoring target, with the horizontal axis representing the date and the vertical axis representing the abnormality. The graph 1420 shows that the data indicating the current abnormality is "390".
- Fig. 15 is a second flowchart showing the flow of the analysis process.
- step S1001 to step S1006 the same process as in each process of step S1001 to step S1006 illustrated in Fig. 10 is performed. Therefore, the description thereof will be omitted here.
- step S1501 the score calculation unit 1301 of the analysis unit 1211 calculates the score for each transition probability based on the one-day state transition probability data of the cow that is a monitoring target.
- the score calculation unit 1301 of the analysis unit 1211 extracts the maximum score from among the scores calculated for each of the transition probabilities, and outputs it as data representing the abnormality of the cow that is a monitoring target at the relevant date.
- the abnormality detecting system performs the following process.
- States in each time range of cow that is a monitoring target is identified based on time-series data representing a three-dimensional acceleration as measured by an acceleration sensor placed on a neck of the cow that is a monitoring target.
- State transition probability data is generated by calculating a transition probability from a state at a predetermined timing of an identified time range to a next state.
- a score representing an abnormality of a state transition is calculated for each stage transition probability.
- the maximum score is extracted from the score calculated for each transition probability, and is output as data indicating the abnormality.
- a score is calculated based on the state transition probability data of the cow that is a monitoring target to detect a change in a tendency of movement occurring prior to development of BRD (or BRDC). Therefore, by the abnormality detecting system according to the second embodiment, it is possible to detect an early warning (or some abnormality) of BRD (or BRDC) before the cow that is a monitoring target develops BRD (or BRDC) as in the first embodiment.
- an abnormality detecting system for detecting an abnormality of cow that is a monitoring target can be provided.
- an acceleration sensor is placed on the neck portion, but the attachment part of the acceleration sensor is not limited to the neck portion.
- the acceleration sensor may be placed on other parts.
- an acceleration sensor is attached as a motion sensor
- a motion sensor other than the acceleration sensor e.g., an angular velocity sensor
- the state transition probability data for healthy cow was described as generating state transition probability data for a certain period of time.
- the period may be one day or a plurality of days.
- the state transition probability data for healthy cow may be obtained by generating state transition probability data for one healthy cow, or by generating state transition probability data for a plurality of cows and calculating an average of the data.
- the output frequency for outputting data indicating abnormality and the decision frequency for determining whether an early warning (or some abnormality) is detected are not limited to one day, but may be less than one day or greater than or equal to one day.
- time-series data representing a three-dimensional acceleration was used was described.
- the number of axial directions using time-series data is not limited to three axes.
- time-series data representing an acceleration of any two axes may be used.
- time-series data representing only a single-axis acceleration may be used.
- the time range at the time of the standardization process is set to "1 [SEC]", but the time range at the time of the standardization process is not limited to "1 [SEC]".
- the conditions for determining whether an early warning (or some abnormality) is detected are not limited thereto, and other predetermined conditions may be used to perform the determination. In other words, it may be determined based on whether pre-defined conditions are satisfied or not.
- the animals that is a monitoring target were cow, but animals other than cow may be monitored.
- the present invention is not limited to the above-described embodiments.
- An embodiment where another element is used in a combination, for example, may be covered by the present invention.
Landscapes
- Health & Medical Sciences (AREA)
- Life Sciences & Earth Sciences (AREA)
- Engineering & Computer Science (AREA)
- Biomedical Technology (AREA)
- Medical Informatics (AREA)
- Public Health (AREA)
- Environmental Sciences (AREA)
- General Health & Medical Sciences (AREA)
- Biophysics (AREA)
- Pathology (AREA)
- Biodiversity & Conservation Biology (AREA)
- Animal Husbandry (AREA)
- Primary Health Care (AREA)
- Veterinary Medicine (AREA)
- Physics & Mathematics (AREA)
- Epidemiology (AREA)
- Physiology (AREA)
- Heart & Thoracic Surgery (AREA)
- Molecular Biology (AREA)
- Surgery (AREA)
- Animal Behavior & Ethology (AREA)
- Business, Economics & Management (AREA)
- Data Mining & Analysis (AREA)
- General Business, Economics & Management (AREA)
- Zoology (AREA)
- Birds (AREA)
- Oral & Maxillofacial Surgery (AREA)
- Dentistry (AREA)
- Signal Processing (AREA)
- Databases & Information Systems (AREA)
- Psychiatry (AREA)
- Computer Vision & Pattern Recognition (AREA)
- Artificial Intelligence (AREA)
- Eye Examination Apparatus (AREA)
- Paper (AREA)
- Alarm Systems (AREA)
- Catching Or Destruction (AREA)
- Management, Administration, Business Operations System, And Electronic Commerce (AREA)
- Testing And Monitoring For Control Systems (AREA)
- Testing Or Calibration Of Command Recording Devices (AREA)
Applications Claiming Priority (2)
| Application Number | Priority Date | Filing Date | Title |
|---|---|---|---|
| JP2020040117 | 2020-03-09 | ||
| PCT/JP2021/008052 WO2021182204A1 (ja) | 2020-03-09 | 2021-03-03 | 異常検知システム |
Publications (1)
| Publication Number | Publication Date |
|---|---|
| EP4118960A1 true EP4118960A1 (en) | 2023-01-18 |
Family
ID=77671595
Family Applications (1)
| Application Number | Title | Priority Date | Filing Date |
|---|---|---|---|
| EP21767132.0A Withdrawn EP4118960A1 (en) | 2020-03-09 | 2021-03-03 | Anomaly sensing system |
Country Status (7)
| Country | Link |
|---|---|
| US (1) | US20230102979A1 (https=) |
| EP (1) | EP4118960A1 (https=) |
| JP (1) | JPWO2021182204A1 (https=) |
| CN (1) | CN115279182A (https=) |
| AU (1) | AU2021233628A1 (https=) |
| BR (1) | BR112022017261A2 (https=) |
| WO (1) | WO2021182204A1 (https=) |
Families Citing this family (1)
| Publication number | Priority date | Publication date | Assignee | Title |
|---|---|---|---|---|
| CN116680595B (zh) * | 2023-05-05 | 2025-11-18 | 北京市农林科学院信息技术研究中心 | 异常奶牛检测方法、装置、电子设备及介质 |
Family Cites Families (6)
| Publication number | Priority date | Publication date | Assignee | Title |
|---|---|---|---|---|
| NZ553146A (en) * | 2007-02-09 | 2011-05-27 | Say Systems Ltd | Improvements relating to monitoring and displaying activities |
| WO2011120529A1 (en) * | 2010-03-31 | 2011-10-06 | Københavns Universitet | Model for classifying an activity of an animal |
| JP6409028B2 (ja) * | 2016-07-13 | 2018-10-17 | デザミス株式会社 | 牛の活動状態管理システム |
| JP6925638B2 (ja) * | 2018-01-12 | 2021-08-25 | デザミス株式会社 | 牛の健康状態管理システム及び管理方法並びに健康状態管理プログラム |
| JP7016302B2 (ja) * | 2018-08-01 | 2022-02-04 | ルネサスエレクトロニクス株式会社 | 情報処理装置、情報処理システム、及びプログラム |
| JP2020040117A (ja) | 2018-09-12 | 2020-03-19 | 青山 省司 | プロジェクションナットの供給ロッドおよび供給方法 |
-
2021
- 2021-03-03 EP EP21767132.0A patent/EP4118960A1/en not_active Withdrawn
- 2021-03-03 US US17/909,121 patent/US20230102979A1/en not_active Abandoned
- 2021-03-03 WO PCT/JP2021/008052 patent/WO2021182204A1/ja not_active Ceased
- 2021-03-03 BR BR112022017261A patent/BR112022017261A2/pt not_active Application Discontinuation
- 2021-03-03 JP JP2022505953A patent/JPWO2021182204A1/ja active Pending
- 2021-03-03 CN CN202180019100.7A patent/CN115279182A/zh active Pending
- 2021-03-03 AU AU2021233628A patent/AU2021233628A1/en not_active Abandoned
Also Published As
| Publication number | Publication date |
|---|---|
| WO2021182204A1 (ja) | 2021-09-16 |
| CN115279182A (zh) | 2022-11-01 |
| AU2021233628A1 (en) | 2022-09-22 |
| BR112022017261A2 (pt) | 2022-10-18 |
| US20230102979A1 (en) | 2023-03-30 |
| JPWO2021182204A1 (https=) | 2021-09-16 |
Similar Documents
| Publication | Publication Date | Title |
|---|---|---|
| JP6833642B2 (ja) | 要因分析装置、要因分析方法、およびプログラム | |
| US11100642B2 (en) | Computer system, and method and program for diagnosing animals | |
| JP7131351B2 (ja) | 学習方法、学習プログラムおよび学習装置 | |
| EP4118960A1 (en) | Anomaly sensing system | |
| EP3832557B1 (en) | Determination apparatus, determination method, determination program, and related system, method, program and computer readable recording medium | |
| US20250224718A1 (en) | Abnormality diagnosis method, abnormality diagnosis apparatus, non-transitory computer-readable medium storing abnormality diagnosis program, and abnormality diagnosis system | |
| JPWO2008111349A1 (ja) | 生存分析システム、生存分析方法および生存分析用プログラム | |
| JP2019105871A (ja) | 異常候補抽出プログラム、異常候補抽出方法および異常候補抽出装置 | |
| JP6727478B1 (ja) | 学習装置、学習方法及びプログラム | |
| EP4501104A1 (en) | Animal behavior recording device, animal behavior recording method, and program | |
| EP4118961A1 (en) | Anomaly sensing system | |
| JP6771705B2 (ja) | 情報処理装置、プログラム及び情報処理方法 | |
| US12190273B2 (en) | Work content analyzing apparatus, work content analyzing method, program, and sensor | |
| US10692256B2 (en) | Visualization method, visualization device, and recording medium | |
| US10866163B2 (en) | Anomaly monitoring device and method for producing anomaly signs according to combinations of sensors based on relationship of sensor fluctuations | |
| JP6564756B2 (ja) | 流動状況計測装置、方法、及びプログラム | |
| KR20220128105A (ko) | 미세 먼지 농도 모니터링 방법 및 그 장치 | |
| CN115392329A (zh) | 业务维度预测模型的训练方法及相关装置 | |
| US20250184230A1 (en) | Traffic prediction device, traffic prediction method, and program | |
| CN118937991A (zh) | 一种基于CNN-Transformer的电机故障诊断方案及系统 | |
| EP3425561B1 (en) | State classifying program, state classifying method, and state classifying device | |
| TW202311879A (zh) | 裝置管理系統、裝置的障礙原因推測方法以及非暫時性地記憶程式的記憶媒體 | |
| JP7227772B2 (ja) | データアセット分析支援システムおよびデータ分析方法 | |
| CN121148131B (zh) | 基于相关性网络图的桥梁结构风险状态预警判别方法、系统及设备 | |
| CN121767035A (zh) | 信息处理方法 |
Legal Events
| Date | Code | Title | Description |
|---|---|---|---|
| STAA | Information on the status of an ep patent application or granted ep patent |
Free format text: STATUS: THE INTERNATIONAL PUBLICATION HAS BEEN MADE |
|
| PUAI | Public reference made under article 153(3) epc to a published international application that has entered the european phase |
Free format text: ORIGINAL CODE: 0009012 |
|
| STAA | Information on the status of an ep patent application or granted ep patent |
Free format text: STATUS: REQUEST FOR EXAMINATION WAS MADE |
|
| 17P | Request for examination filed |
Effective date: 20220901 |
|
| AK | Designated contracting states |
Kind code of ref document: A1 Designated state(s): AL AT BE BG CH CY CZ DE DK EE ES FI FR GB GR HR HU IE IS IT LI LT LU LV MC MK MT NL NO PL PT RO RS SE SI SK SM TR |
|
| STAA | Information on the status of an ep patent application or granted ep patent |
Free format text: STATUS: THE APPLICATION HAS BEEN WITHDRAWN |
|
| 18W | Application withdrawn |
Effective date: 20230201 |