WO2021172041A1 - 制御装置 - Google Patents
制御装置 Download PDFInfo
- Publication number
- WO2021172041A1 WO2021172041A1 PCT/JP2021/005170 JP2021005170W WO2021172041A1 WO 2021172041 A1 WO2021172041 A1 WO 2021172041A1 JP 2021005170 W JP2021005170 W JP 2021005170W WO 2021172041 A1 WO2021172041 A1 WO 2021172041A1
- Authority
- WO
- WIPO (PCT)
- Prior art keywords
- cell
- slope
- value
- exhaust gas
- deterioration rate
- Prior art date
- Legal status (The legal status is an assumption and is not a legal conclusion. Google has not performed a legal analysis and makes no representation as to the accuracy of the status listed.)
- Ceased
Links
Images


Classifications
-
- G—PHYSICS
- G01—MEASURING; TESTING
- G01N—INVESTIGATING OR ANALYSING MATERIALS BY DETERMINING THEIR CHEMICAL OR PHYSICAL PROPERTIES
- G01N33/00—Investigating or analysing materials by specific methods not covered by groups G01N1/00 - G01N31/00
- G01N33/0004—Gaseous mixtures, e.g. polluted air
- G01N33/0009—General constructional details of gas analysers, e.g. portable test equipment
- G01N33/007—Arrangements to check the analyser
-
- F—MECHANICAL ENGINEERING; LIGHTING; HEATING; WEAPONS; BLASTING
- F02—COMBUSTION ENGINES; HOT-GAS OR COMBUSTION-PRODUCT ENGINE PLANTS
- F02D—CONTROLLING COMBUSTION ENGINES
- F02D41/00—Electrical control of supply of combustible mixture or its constituents
- F02D41/02—Circuit arrangements for generating control signals
- F02D41/14—Introducing closed-loop corrections
- F02D41/1438—Introducing closed-loop corrections using means for determining characteristics of the combustion gases; Sensors therefor
- F02D41/1444—Introducing closed-loop corrections using means for determining characteristics of the combustion gases; Sensors therefor characterised by the characteristics of the combustion gases
- F02D41/1454—Introducing closed-loop corrections using means for determining characteristics of the combustion gases; Sensors therefor characterised by the characteristics of the combustion gases the characteristics being an oxygen content or concentration or the air-fuel ratio
- F02D41/1456—Introducing closed-loop corrections using means for determining characteristics of the combustion gases; Sensors therefor characterised by the characteristics of the combustion gases the characteristics being an oxygen content or concentration or the air-fuel ratio with sensor output signal being linear or quasi-linear with the concentration of oxygen
-
- F—MECHANICAL ENGINEERING; LIGHTING; HEATING; WEAPONS; BLASTING
- F02—COMBUSTION ENGINES; HOT-GAS OR COMBUSTION-PRODUCT ENGINE PLANTS
- F02D—CONTROLLING COMBUSTION ENGINES
- F02D41/00—Electrical control of supply of combustible mixture or its constituents
- F02D41/22—Safety or indicating devices for abnormal conditions
- F02D41/222—Safety or indicating devices for abnormal conditions relating to the failure of sensors or parameter detection devices
-
- G—PHYSICS
- G01—MEASURING; TESTING
- G01N—INVESTIGATING OR ANALYSING MATERIALS BY DETERMINING THEIR CHEMICAL OR PHYSICAL PROPERTIES
- G01N27/00—Investigating or analysing materials by the use of electric, electrochemical, or magnetic means
- G01N27/26—Investigating or analysing materials by the use of electric, electrochemical, or magnetic means by investigating electrochemical variables; by using electrolysis or electrophoresis
- G01N27/416—Systems
- G01N27/417—Systems using cells, i.e. more than one cell and probes with solid electrolytes
- G01N27/4175—Calibrating or checking the analyser
Definitions
- This disclosure relates to a control device for an exhaust gas sensor.
- An exhaust gas sensor for measuring the concentration of a specific gas contained in the exhaust gas is provided in the exhaust pipe of a vehicle having an internal combustion engine.
- the "specific gas” is, for example, a nitrogen oxide.
- an exhaust gas sensor one having a plurality of cells in which electrodes are formed on both sides of a solid electrolyte layer is known. In the cell, a current having a magnitude corresponding to the concentration of the component to be measured flows in a state where a voltage is applied between the electrodes. The exhaust gas sensor measures the concentration of the component to be measured based on the value of the current.
- an exhaust gas sensor having a configuration having a first cell and a second cell is known.
- oxygen contained in the exhaust gas is discharged in advance by the first cell arranged on the upstream side.
- a current flows according to the concentration of residual oxygen and nitrogen oxides contained in the exhaust gas after the oxygen is discharged.
- the current is also referred to as “output current”.
- the concentration of nitrogen oxides can be measured accurately by discharging oxygen in a larger amount than the nitrogen oxides from the exhaust gas in advance.
- the relationship between the concentration of the component to be measured and the output current may change due to cell deterioration. Therefore, in the gas sensor control device described in Patent Document 1 below, it is possible to calculate the deterioration rate, which is an index indicating the degree of deterioration occurring in the exhaust gas sensor. Specifically, after reducing the voltage applied to the first cell (pump cell) and temporarily increasing the amount of oxygen reaching the second cell (sensor cell), the second cell at that time The deterioration rate is calculated based on the slope of the change in output current.
- the slope of the change in output current from the second cell tends to decrease according to the degree of deterioration of the second cell. Therefore, when the slope of the change in the output current from the second cell becomes smaller than in the normal state, it can be determined that the second cell has deteriorated, that is, the deterioration rate of the exhaust gas sensor has increased.
- the slope of the change in the output current from the second cell changes not only according to the degree of deterioration of the second cell but also according to the temperature of the second cell. For example, when the temperature of the second cell is higher than the normal temperature, the slope of the change in the output current from the second cell tends to be large. Therefore, even if the second cell is actually deteriorated, when the second cell is at a high temperature, the slope of the change in the output current from the second cell is about the same as in the normal state. Will be the slope of, and the deterioration rate will be calculated as a value smaller than the actual value. As a result, it may occur that the exhaust gas sensor is erroneously determined that no deterioration has occurred.
- An object of the present disclosure is to provide a control device capable of accurately calculating the deterioration rate of an exhaust gas sensor.
- the control device is a control device for an exhaust gas sensor.
- the exhaust gas sensor to be controlled has a size corresponding to the first cell that discharges oxygen from the exhaust gas generated by the internal combustion engine and the concentration of residual oxygen contained in the exhaust gas after the oxygen is discharged by the first cell. It has a second cell that outputs a gas current.
- This control device includes a first cell control unit that controls oxygen discharge by the first cell, a current value acquisition unit that acquires a cell current value that is a value of the current output from the second cell, and a cell current value. Based on the above, the deterioration rate calculation unit for calculating the deterioration rate, which is an index indicating the degree of deterioration occurring in the exhaust gas sensor, is provided.
- the deterioration rate calculation unit has a first slope, which is the slope of the change in the cell current value at a predetermined timing or period after the oxygen discharge by the first cell is suppressed by the first cell control unit, and the first slope, rather than the first slope. It is configured to calculate the deterioration rate based on both the second slope, which is the slope of the change in the cell current value in the later timing or period.
- the present inventors have found that the slope immediately after the oxygen discharge by the first cell is suppressed fluctuates under the influence of only the temperature and is hardly affected by deterioration. It has been found that the subsequent inclination fluctuates under the influence of both deterioration and temperature. Therefore, in the control device having the above configuration, the first slope, which is the slope of the change in the cell current value at a predetermined timing or period, and the second slope, which is the slope of the change in the cell current value at the timing or period after the first slope.
- the deterioration rate of the exhaust gas sensor is calculated based on both the two inclinations. This makes it possible to accurately calculate the deterioration rate while eliminating the influence of the change in inclination due to the temperature of the second cell.
- a control device capable of accurately calculating the deterioration rate of the exhaust gas sensor is provided.
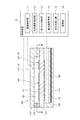
- FIG. 1 is a diagram schematically showing a configuration of a vehicle exhaust system provided with a control device and an exhaust gas sensor according to the first embodiment.
- FIG. 2 is a diagram schematically showing the configuration of the control device and the exhaust gas sensor according to the first embodiment.
- FIG. 3 is a cross-sectional view showing a section III-III of FIG.
- FIG. 4 is a diagram for explaining the measurement principle of the exhaust gas sensor.
- FIG. 5 is a diagram showing an example of time change of the pump cell voltage and the like.
- FIG. 6 is a graph showing the time change of the sensor cell current.
- FIG. 7 is a graph showing the time change of the sensor cell current.
- FIG. 1 is a diagram schematically showing a configuration of a vehicle exhaust system provided with a control device and an exhaust gas sensor according to the first embodiment.
- FIG. 2 is a diagram schematically showing the configuration of the control device and the exhaust gas sensor according to the first embodiment.
- FIG. 3 is a cross-sectional view showing a section
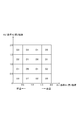
- FIG. 8 is a diagram showing an example of a map showing the correspondence relationship between the first index, the second index, and the calculated deterioration rate value.
- FIG. 9 is a flowchart showing a flow of processing executed by the control device according to the first embodiment.
- FIG. 10 is a graph showing the time change of the sensor cell current.
- FIG. 11 is a diagram showing a correspondence relationship between the second index and the deterioration rate.
- FIG. 12 is a diagram showing a correspondence relationship between the first index and the correction coefficient.
- FIG. 13 is a flowchart showing a flow of processing executed by the control device according to the second embodiment.
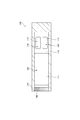
- the control device 10 is configured as a device for controlling the exhaust gas sensor 100.
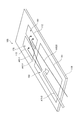
- FIG. 1 schematically shows an exhaust system of a vehicle provided with an exhaust gas sensor 100.
- an exhaust pipe 20 for guiding the exhaust gas discharged from the internal combustion engine EG to the outside is connected to the internal combustion engine EG of the vehicle.
- the exhaust gas sensor 100 is for measuring the concentration of nitrogen oxides contained in the exhaust gas, and is provided at a position in the middle of the exhaust pipe 20.
- the component to be detected by the exhaust gas sensor 100 is nitrogen oxide as described above, but a component other than nitrogen oxide may be used, for example, ammonia.
- an oxidation catalyst converter 22 is provided in the middle of the exhaust pipe 20.
- the oxidation catalyst converter 22 purifies harmful substances contained in the exhaust gas.
- An oxidation catalyst (not shown) is housed inside the oxidation catalyst converter 22.
- the oxidation catalyst is mainly composed of a ceramic carrier, an oxide mixture containing aluminum oxide, cerium dioxide and zirconium dioxide as components, and a noble metal catalyst such as platinum, palladium and rhodium.
- the oxidation catalyst oxidizes and purifies hydrocarbons, carbon monoxide, nitrogen oxides, etc. contained in the exhaust gas.
- a particulate filter for capturing fine particles may be contained inside the oxidation catalyst converter 22.
- the exhaust gas sensor 100 which is the control target of the control device 10, is provided at a position on the downstream side of the oxidation catalyst converter 22 in the exhaust pipe 20, and measures the concentration of nitrogen oxides in the exhaust gas at that position. It has become.
- the concentration of nitrogen oxides measured by the exhaust gas sensor 100 is transmitted to the control device 10.
- the control device 10 performs various controls on the internal combustion engine EG based on the measured concentration of nitrogen oxides.
- the control includes, for example, control for adjusting the ignition timing in the internal combustion engine EG.
- the control device 10 is configured as a device that controls the internal combustion engine EG in addition to the control of the exhaust gas sensor 100 described later. That is, the control device 10 also has a function as a so-called "engine ECU". Instead of such a mode, even if the control device 10 is configured as a dedicated device for controlling the exhaust gas sensor 100 and is a control device different from the engine ECU. good. In this case, the control device 10 contributes to the control of the internal combustion engine EG performed by the engine ECU by communicating with the engine ECU.
- FIG. 2 schematically shows a cross section of a portion of the exhaust gas sensor 100 that is arranged inside the exhaust pipe 20.
- the left side in FIG. 2, that is, the end on the side where the diffusion resistor 140 is arranged corresponds to the tip of the exhaust gas sensor 100 protruding inside the exhaust pipe 20.
- the exhaust gas sensor 100 includes a solid electrolyte body 110 and main bodies 120 and 130.
- the solid electrolyte body 110 is a plate-shaped member, and is made of a solid electrolyte material such as zirconia oxide.
- the solid electrolyte body 110 becomes oxygen ion conductive when it is in an active state of a predetermined temperature or higher.
- a pump cell 150, a sensor cell 160, and a monitor cell 170 are formed in the solid electrolyte body 110, respectively, and these plurality of cells will be described later.
- the main body portions 120 and 130 are both plate-shaped members, and are made of an insulator material containing alumina as a main component.
- the main bodies 120 and 130 are arranged so as to sandwich the above-mentioned solid electrolyte body 110 in between.
- a part of the surface on the solid electrolyte 110 side is recessed toward the side opposite to the solid electrolyte 110.
- the space is a space in which the exhaust gas to be measured is introduced.
- the space is also referred to as “measurement chamber 121”.
- a diffusion resistor 140 is arranged at the tip of the exhaust gas sensor 100.
- the measurement chamber 121 is open to the outside (that is, inside the exhaust pipe 20) via the diffusion resistor 140.
- the diffusion resistor 140 is made of a ceramic material such as alumina in which porous or pores are formed. By the action of the diffusion resistor 140, the flow rate of the exhaust gas drawn into the measuring chamber 121 is regulated.
- the exhaust gas that has flowed into the measurement chamber 121 through the diffusion resistor 140 is supplied to the pump cell 150, the sensor cell 160, and the monitor cell 170, which will be described later.
- the space is also referred to as "atmosphere chamber 131".
- a pump electrode 111, a sensor electrode 112, and a monitor electrode 113 are formed on the surface of the solid electrolyte body 110 that is in contact with the measurement chamber 121, respectively.
- the pump electrode 111 is formed at a position closer to the diffusion resistor 140 in the solid electrolyte 110.
- the sensor electrode 112 and the monitor electrode 113 are formed at positions of the solid electrolyte body 110 opposite to the diffusion resistor 140 with the pump electrode 111 sandwiched between them.
- the sensor electrode 112 and the monitor electrode 113 are arranged so as to be arranged along the depth direction of the paper surface in FIG. 2 (see FIG. 3).
- the pump electrode 111 and the monitor electrode 113 are formed of a Pt-Au alloy (platinum-gold alloy). All of these are electrodes that are active with respect to oxygen and inactive with respect to nitrogen oxides.
- the sensor electrode 112 is formed of a noble metal such as Pt (platinum) or Rh (rhodium), and is an electrode that is active against oxygen and also active against nitrogen oxides.
- a common electrode 114 is formed on the surface of the solid electrolyte body 110 that is in contact with the air chamber 131.
- the common electrode 114 is formed in a range that overlaps all of the pump electrode 111, the sensor electrode 112, and the monitor electrode 113 when viewed along the direction perpendicular to the solid electrolyte body 110 as shown in FIG. There is.
- the common electrode 114 is formed of a material containing Pt (platinum) as a main component.
- the portion of the pump electrode 111, the common electrode 114, and the solid electrolyte 110 sandwiched between the pump electrode 111 and the common electrode 114 is a portion that functions as a pump cell 150 for discharging oxygen from the exhaust gas. It has become.
- the pump cell 150 corresponds to the "first cell" in this embodiment.
- a current flows between the pump electrode 111 and the common electrode 114.
- the value of the current is a value proportional to the amount of oxygen discharged from the exhaust gas and a value proportional to the oxygen concentration of the exhaust gas. That is, it can be said that the pump cell 150 outputs a current having a magnitude corresponding to the oxygen concentration of the exhaust gas.
- the control device 10 can acquire the oxygen concentration of the exhaust gas existing in the measuring chamber 121 based on the value of the current.
- the voltage applied between the pump electrode 111 and the common electrode 114 is also referred to as “pump cell voltage” below.
- the current flowing between the pump electrode 111 and the common electrode 114 when the pump cell voltage is applied is also referred to as “pump cell current” below.
- the portion of the sensor electrode 112, the common electrode 114, and the solid electrolyte 110 sandwiched between the sensor electrode 112 and the common electrode 114 corresponds to the concentration of residual oxygen and nitrogen oxides contained in the exhaust gas. It is a part that functions as a sensor cell 160 that outputs a large amount of current in a state where a voltage is applied.
- the exhaust gas whose concentration of nitrogen oxides and residual oxygen is measured by the sensor cell 160 is the exhaust gas after the oxygen is discharged in the pump cell 150.
- the sensor cell 160 corresponds to the "second cell" in this embodiment.
- the voltage applied between the sensor electrode 112 and the common electrode 114 is also referred to as “sensor cell voltage” below.
- the current flowing between the sensor electrode 112 and the common electrode 114 when the sensor cell voltage is applied is also hereinafter referred to as “sensor cell current”.
- the value of the sensor cell current is also referred to as a "cell current value” below.
- the portion of the monitor electrode 113, the common electrode 114, and the solid electrolyte 110 sandwiched between the monitor electrode 113 and the common electrode 114 has a current having a magnitude corresponding to the concentration of residual oxygen contained in the exhaust gas. It is a part that functions as a monitor cell 170 that outputs.
- the exhaust gas whose residual oxygen concentration is measured by the monitor cell 170 is the exhaust gas after the oxygen is discharged in the pump cell 150.
- monitor cell voltage The voltage applied between the monitor electrode 113 and the common electrode 114 is also referred to as “monitor cell voltage” below. Further, the current flowing between the monitor electrode 113 and the common electrode 114 when the monitor cell voltage is applied is also hereinafter referred to as “monitor cell current”.
- a monitor cell 170 that outputs a current having a magnitude corresponding to the concentration of residual oxygen contained in the exhaust gas after oxygen is discharged by the pump cell 150, and a pump cell.
- a sensor cell 160 that outputs a current having a magnitude corresponding to the concentration of residual oxygen and nitrogen oxides contained in the exhaust gas after oxygen is discharged by 150 is arranged.
- the exhaust gas that has flowed into the measurement chamber 121 through the diffusion resistor 140 flows along the pump cell 150 and then is supplied to each of the sensor cell 160 and the monitor cell 170.
- FIG. 4 such an exhaust gas flow is schematically shown by a plurality of arrows.
- the arrow AR10 indicates the flow of oxygen discharged by the pump cell 150 after flowing into the measuring chamber 121 through the diffusion resistor 140.
- the arrow AR11 indicates the flow of oxygen reaching the sensor cell 160
- the arrow AR12 indicates the flow of oxygen reaching the monitor cell 170.
- the pump electrode 111 and the monitor electrode 113 are both electrodes that are inactive with respect to nitrogen oxides. Therefore, the nitrogen oxide contained in the exhaust gas flowing into the measurement chamber 121 is not discharged by the pump cell 150 or the monitor cell 170, and reaches the sensor electrode 112 of the sensor cell 160 as it is.
- the arrow AR20 indicates the flow of nitrogen oxides thus reaching the sensor cell 160.
- both the nitrogen oxide (arrow AR20) and the residual oxygen (arrow AR11) reach the sensor cell 160. Therefore, the magnitude of the sensor cell current indicates the concentration of nitrogen oxides and oxygen contained in the exhaust gas.
- the magnitude of the monitor cell current indicates the concentration of oxygen contained in the exhaust gas. Therefore, the current value obtained by subtracting the monitor cell current value from the sensor cell current value indicates the concentration of nitrogen oxides only. With such an exhaust gas sensor 100, it is possible to suppress the influence of oxygen contained in the exhaust gas and accurately measure the concentration of nitrogen oxides.
- a heater 180 is embedded in the main body 130.
- the heater 180 generates heat inside the main body 130 to heat each of the pump cell 150, the sensor cell 160, and the monitor cell 170.
- the heater 180 keeps the solid electrolyte 110 at a temperature at which it becomes active.
- the output of the heater 180 is adjusted by the control device 10.
- the configuration of the control device 10 will be described with reference to FIG.
- the control device 10 is configured as a computer system having a CPU, ROM, RAM, and the like.
- the control device 10 has a concentration detection unit 11, an internal combustion engine control unit 12, a first cell control unit 13, a current value acquisition unit 14, a deterioration rate calculation unit 15, and a storage unit as block elements representing its functions. 16 and.
- the concentration detection unit 11 is a part that detects the concentration of nitrogen oxides contained in the exhaust gas based on each of the monitor cell current and the sensor cell current. As described above, the concentration detection unit 11 detects the concentration of nitrogen oxides based on the current value obtained by subtracting the value of the monitor cell current from the value of the sensor cell current.
- the internal combustion engine control unit 12 is a part that controls the internal combustion engine EG based on the concentration of nitrogen oxides detected by the concentration detection unit 11.
- the internal combustion engine control unit 12 adjusts the fuel injection amount of the internal combustion engine EG and the like so that the concentration of nitrogen oxides detected by the exhaust gas sensor 100 approaches zero.
- the control device 10 may be configured as a dedicated device for controlling the exhaust gas sensor 100, and may be a control device different from the engine ECU. In this case, the internal combustion engine control unit 12 is configured as a part of the engine ECU.
- the first cell control unit 13 is a part that controls the discharge of oxygen by the pump cell 150, which is the first cell, by changing the pump cell voltage.
- the first cell control unit 13 maintains the pump cell voltage at a substantially constant value.
- the first cell control unit 13 temporarily lowers the pump cell voltage.
- the current value acquisition unit 14 is a part that acquires the value of the current output from each cell, specifically, the value of the pump cell current, the sensor cell current, and the monitor cell current.
- the value of the sensor cell current or the like acquired by the current value acquisition unit 14 is used for calculating the concentration of nitrogen oxides in a normal state.
- values such as sensor cell current are also used in the calculation of the deterioration rate, which will be described later.
- the deterioration rate calculation unit 15 is a part that performs a process of calculating the deterioration rate of the exhaust gas sensor 100.
- the "deterioration rate" is an index indicating the degree of deterioration occurring in the exhaust gas sensor 100, and is calculated as a value larger as the deterioration of the exhaust gas sensor 100 progresses. In this embodiment, the deterioration rate is calculated as any value in the range of 0% to 100%.
- the deterioration rate calculation unit 15 calculates the deterioration rate based on the value of the sensor cell current, that is, the cell current value. The specific calculation method will be described later.
- the deterioration rate calculated by the deterioration rate calculation unit 15 is used, for example, as an index for determining whether or not the exhaust gas sensor 100 is normal.
- the warning light provided on the vehicle can be turned on to urge the occupants to take measures such as replacement.
- the value of the concentration of nitrogen oxides acquired by the exhaust gas sensor 100 may be corrected by using the deterioration rate.
- the storage unit 16 is a non-volatile storage device provided in the control device 10, and is specifically a flash memory.
- the storage unit 16 stores in advance information necessary for calculating the deterioration rate. The specific content of the information will be described later.
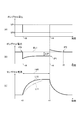
- FIG. 5A shows an example of a time change of the pump cell voltage when the deterioration rate is calculated.
- FIG. 5 (B) shows an example of the time change of the pump cell current.
- FIG. 5C shows an example of the time change of the sensor cell current.
- the normal control that is, the process for measuring the nitrogen oxide concentration is temporarily stopped at time t0, and the process for calculating the deterioration rate is started from time t0.
- the voltage applied to the pump cell 150 is changed from the initial VP1 to a lower VP0 (FIG. 5A).
- the process is performed by the first cell control unit 13.
- the oxygen discharge by the pump cell 150 is temporarily suppressed after the time t0.
- the pump cell current has decreased from the initial IP0 to an IP1 lower than this (Fig. 5 (B)).
- This decrease in the pump cell current means that the amount of oxygen passing through the pump cell 150 and reaching the sensor cell 160 has increased after time t0. Therefore, as shown by the line L10 in FIG. 5C, the sensor cell current starts to increase from time t0, and finally becomes a substantially constant value.
- IP2 may be equal to the original value of IP0, but it is often slightly different from IP0 due to changes in the state of the internal combustion engine up to that point.
- the amount of oxygen reaching the sensor cell 160 decreases. Along with this, the value of the sensor cell current decreases after time t4 (FIG. 5 (C)).
- the discharge of oxygen by the pump cell 150 is temporarily suppressed. In FIG. 5, the period during which the oxygen discharge from the pump cell 150 is temporarily suppressed is shown as “period TM0”.
- the line L10 in FIG. 5C shows the time change of the sensor cell current in the normal state in which the sensor cell 160 is not deteriorated.
- the line L11 in the figure shows the time change of the sensor cell current when the sensor cell 160 is deteriorated.
- the slope of the change in the cell current value after the time t0 is smaller when the sensor cell 160 is deteriorated than in the normal state. Further, as the degree of deterioration of the sensor cell 160 increases, the slope of the change in the cell current value tends to decrease. Therefore, the deterioration rate can be calculated based on the slope of the change in the cell current value after the time t0. For example, if the correspondence between the slope of the change in the cell current value and the deterioration rate is created as a map in advance, the deterioration rate is calculated based on the slope of the change in the cell current value by referring to the map. be able to.
- the slope of the change in the cell current value not only changes according to the degree of deterioration of the sensor cell 160, but also changes according to the temperature of the sensor cell 160.
- the slope of the change in the cell current value tends to be large.
- the inclination of the line L11 becomes large, and the line L11 approaches the line L10.
- the rate is calculated as a smaller value than it actually is. As a result, it may occur that the exhaust gas sensor 100 is erroneously determined that no deterioration has occurred.
- the influence of the temperature of the sensor cell 160 on the calculated value of the deterioration rate is reduced by devising the method of calculating the deterioration rate based on the cell current value.
- FIG. 6 is an enlarged graph showing a part of FIG. 5 (C).
- the initial range of the period TM0 is surrounded by the dotted line R1. Further, the range after the relevant range is surrounded by the dotted line R2.
- the difference between the line L10 indicating the change during normal operation and the line L11 indicating the change during deterioration is small.
- the time change of the cell current value is less susceptible to deterioration.
- the difference between the line L10 showing the change in the normal state and the line L11 showing the change in the deterioration time becomes large.
- the time change of the cell current value is easily affected by the deterioration.
- the deterioration rate calculation unit 15 of the present embodiment acquires the slope of the change in the cell current value at two timings in which the degree of influence of temperature is different. After that, by using the two acquired inclinations, the degree of deterioration is calculated while eliminating the influence of the temperature of the sensor cell 160 as much as possible.
- FIG. 7 is a graph showing an example of the change in the cell current value during the period TM0, as in FIG. 5 (C).
- the control device 10 acquires a plurality of cell current values such as “IS11” and “IS3” shown in FIG.
- IS3 shown in FIG. 7 is a convergent value of the cell current value after the oxygen emission is suppressed.
- the period TM0 is set so that the cell current value at the time t4 immediately before the end of the period TM0 becomes IS3 defined as described above.
- the length of the period TM0 is preferably set to any of 3 seconds to 10 seconds. That is, IS3 is a cell current value acquired at a timing (time t4) after a predetermined period of 3 to 10 seconds has elapsed from the time when oxygen discharge by the pump cell 150 is suppressed (time t0).
- IS11 shown in FIG. 7 is a cell current value set as a value of a predetermined ratio of IS3.
- the timing at which the cell current value reaches IS11 is shown as the time t1.
- the point P1 corresponding to the time t1 is shown.
- Both IS12 and IS21 shown in FIG. 7 are cell current values set as values of a predetermined ratio of IS3.
- the timing at which the cell current values reach IS12 and IS21 is shown as the time t2.
- a point P2 corresponding to the time t2 is shown.
- IS22 shown in FIG. 7 is a cell current value set as a value of a predetermined ratio of IS3.
- the timing at which the cell current value reaches IS22 is shown as the time t3.
- the point P3 corresponding to the time t3 is shown.
- the period TM1 from IS11 to IS12 of the cell current value is a period for calculating the first slope A1 described later.
- the above-mentioned "predetermined ratio" set for each of IS11 and IS12 is preferably set as any value from 0% to 50%. That is, it is preferable that each of IS11 and IS12 is set as any value from 0% to 50% of IS3 (however, IS11 is smaller than IS12).
- the period TM2 from IS21 to IS22 of the cell current value is a period for calculating the second slope A2 described later.
- the above-mentioned "predetermined ratio" set for each of IS21 and IS22 is preferably set as any value from 30% to 100%. That is, it is preferable that each of IS21 and IS22 is set as any value from 30% to 100% of IS3 (however, IS21 is smaller than IS22).
- the period TM1 from the time t1 to the time t2 is a period in which the slope of the change in the cell current value is not easily affected by deterioration, as in the range surrounded by the dotted line R1 in FIG.
- the slope of the change in the cell current value during this period TM1 is calculated as the "first slope A1".
- the first slope A1 is the slope of a straight line connecting the points P1 and P2.
- A1 (IS12-IS11) / (t2-t1) It is calculated by the formula of.
- the first slope A1 is the slope of the change in the cell current value in the period TM1 after the oxygen discharge by the pump cell 150 is suppressed by the first cell control unit 13.
- the period TM2 from the time t2 to the time t3 is a period in which the slope of the change in the cell current value is easily affected by deterioration, as shown in the range surrounded by the dotted line R2 in FIG.
- the slope of the change in the cell current value during this period TM2 is calculated as the "second slope A2".
- the second slope A2 is the slope of a straight line connecting the points P2 and P3.
- A2 (IS22-IS21) / (t3-t2) It is calculated by the formula of.
- the second slope A2 is the slope of the change in the cell current value in the period TM2 after the first slope A1 described above.
- the storage unit 16 included in the control device 10 stores in advance a map for calculating the deterioration rate based on the combination of the first inclination A1 and the second inclination A2.
- FIG. 8 shows an example of such a map.
- the “first index” obtained by dividing the first slope A1 by the reference value of A1.
- the “reference value of A1” is a value of the first inclination A1 acquired when the exhaust gas sensor 100 has not deteriorated and the temperature of the sensor cell 160 is at a predetermined reference temperature. That is, the reference value of A1 is a standard value of the first inclination A1 when the exhaust gas sensor 100 is normal and the temperature of the sensor cell 160 is a normal temperature.
- the value of the first slope A1 becomes large, so that the first index, which is the horizontal axis of FIG. 8, becomes larger than 1.0.
- the value of the first slope A1 becomes smaller, so that the first index becomes smaller than 1.0. Since the first index defined as described above changes its value based on the value of the first slope A1, it can be said to be an index based on the value of the first slope A1.
- the storage unit 16 included in the control device 10 also stores in advance the correspondence between ⁇ IP and the reference value of A1. In calculating the first index, the control device 10 uses the “reference value of A1” corresponding to the measured ⁇ IP. This prevents the calculated first index from fluctuating depending on the magnitude of ⁇ IP.
- the "second index” obtained by dividing the second slope A2 by the reference value of A2.
- the "reference value of A2" is a value of the second slope A2 acquired when the exhaust gas sensor 100 has not deteriorated and the temperature of the sensor cell 160 is at a predetermined reference temperature. That is, the reference value of A2 is a standard value of the second inclination A2 when the exhaust gas sensor 100 is normal and the temperature of the sensor cell 160 is a normal temperature.
- the second index which is the vertical axis of FIG. 8, is 1. Greater than 0.
- the second index defined as described above changes its value based on the value of the second slope A2, it can be said to be an index based on the value of the second slope A2.
- the storage unit 16 included in the control device 10 also stores in advance the correspondence between ⁇ IP and the reference value of A2. In calculating the above-mentioned second index, the control device 10 uses the “reference value of A2” corresponding to the measured ⁇ IP. This prevents the calculated second index from fluctuating depending on the magnitude of ⁇ IP.
- the regions showing the combination of the first index (horizontal axis) and the second index (vertical axis) are divided into a total of 16 regions of 4 ⁇ 4 as shown in FIG. 8, respectively.
- the value of the calculated deterioration rate is set for each area of. In the region described as "D0" in FIG. 8, the calculated deterioration rate value is set to 0%. In the region described as "D1”, the calculated deterioration rate value is set to 20%. In the region described as "D2”, the calculated deterioration rate value is set to 50%. In the region described as "D4", the calculated deterioration rate value is set to 80%.
- the first index becomes smaller than 1.0.
- the second index is also reduced. Therefore, for example, when both the first index and the second index are about 0.3, the region is D0, and the deterioration rate is calculated to be 0%. The same applies when the temperature of the sensor cell 160 is higher than usual and both the first index and the second index are about 1.7.
- the first index becomes larger than 1.0, while the second index is normal. Less than the value.
- the region indicated by the first index and the second index becomes a region on the lower side of the region of D0 in FIG. This is because the first index is less affected by deterioration and is affected only by temperature, whereas the second index is affected by both deterioration and temperature.
- the pump cell 150 when the pump cell 150 is deteriorated, the amount of oxygen reaching the downstream side increases in the period TM0. As a result, the second slope A2 becomes larger than in the normal state, so that the region indicated by the first index and the second index is a region on the upper side of the region of D0 in FIG. In this case as well, the deterioration rate is calculated as a value larger than 0%, as in the case where the sensor cell 160 has deteriorated.
- the division method as shown in FIG. 8 is merely an example, and the regions indicated by the first index and the second index may be further divided and the deterioration rate value may be set for each region. ..
- the region of D0 is further subdivided, and for example, a value of a deterioration rate of 0% to 10% may be set for each region.
- the region of D1 may be further subdivided, and for example, a deterioration rate value of 10% to 30% may be set for each region.
- the region of D2 is further subdivided, and for example, a deterioration rate value of 30% to 60% may be set for each region.
- the region of D3 is further subdivided, and for example, a deterioration rate value of 60% to 100% may be set for each region.
- the deterioration rate calculation unit 15 of the present embodiment determines the first slope A1 which is the slope of the change in the cell current value in the predetermined period TM1 and the cell current value in the period TM2 after the first slope A1. It is configured to calculate the deterioration rate based on both the second slope A2, which is the slope of change. This makes it possible to accurately calculate the deterioration rate of the exhaust gas sensor 100 while eliminating the influence of the temperature of the sensor cell 160.
- the period TM1 used for calculating the first slope A1 and the period TM2 used for calculating the second slope A2 may be set as periods adjacent to each other without a gap as in the present embodiment. , May be set as a period in which some overlap with each other.
- the period TM2 may start before the timing when the period TM1 ends.
- IS21 is set as a value smaller than IS12.
- the period TM2 may start after a while after the period TM1 ends.
- IS21 is set as a value larger than IS12.
- both the first slope A1 and the second slope A2 are calculated as slopes in a predetermined period.
- at least one of the first inclination A1 and the second inclination A2 may be calculated as an inclination at a predetermined timing.
- the slope at a predetermined timing is, for example, a differential coefficient at a specific time point in a graph showing a change in cell current value. That is, at least one of the first inclination A1 and the second inclination A2 may be calculated after the length of the above "predetermined period" is brought close to 0 to the limit.
- the deterioration rate calculation unit 15 of the present embodiment determines the correspondence between the first index based on the value of the first slope A1, the second index based on the value of the second slope A2, and the calculated deterioration rate value.
- the deterioration rate is calculated by referring to the map shown, that is, the map of FIG. 8 stored in the storage unit 16.
- the deterioration rate according to the temperature of the sensor cell 160 can be calculated easily and accurately. It should be noted that such a correspondence may be stored as a mathematical formula instead of a map.
- the pump electrode 111 of the pump cell 150 is formed of a Pt—Au alloy and contains gold. Since gold has a relatively low melting point, a part of gold may evaporate as the temperature of the pump cell 150 rises and adhere to the sensor electrode 112 of the sensor cell 160 on the downstream side. When such Au poisoning occurs, the sensor cell 160 deteriorates, and the slope of change of the cell electrode becomes small.
- the deterioration rate calculation unit 15 As described above, in the exhaust gas sensor 100 having a configuration in which the electrode of the sensor cell 160 contains gold, deterioration of the sensor cell 160 due to Au poisoning is particularly likely to occur. Therefore, the merit of adopting the deterioration rate calculation method by the deterioration rate calculation unit 15 as described above is particularly great.
- the metal of the sensor electrode 112 may aggregate in the sensor cell 160 due to the influence of temperature, which may deteriorate the performance. In this way, even when deterioration due to agglutination occurs, the deterioration rate calculation unit 15 can accurately calculate the deterioration rate.
- the pump electrode 111 of the pump cell 150 and the sensor electrode 112 of the sensor cell 160 are arranged in the same measurement chamber 121. That is, they are arranged in the same space.
- “Arranged in the same space” means that the space in which the pump electrode 111 is arranged and the space in which the sensor electrode 112 is arranged are partitioned by a structure such as a porous body. It means that it has not been done.
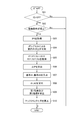
- the specific flow of processing executed by the control device 10 in order to realize the calculation of the deterioration rate as described above will be described with reference to FIG.
- the series of processes shown in FIG. 9 is repeatedly executed by the control device 10 every time a predetermined control cycle elapses.
- step S01 of the process it is determined whether or not the ignition switch of the vehicle is turned off.
- the ignition switch is ON, the series of processes shown in FIG. 9 is completed without calculating the deterioration rate.
- the ignition switch When the ignition switch is ON and the exhaust gas is discharged from the internal combustion engine EG, there is a possibility that the oxygen concentration around the exhaust gas sensor 100 is fluctuating. Under such circumstances, the slope of the change in the cell current value changes due to factors other than the deterioration rate and the temperature of the sensor cell 160. Therefore, the deterioration rate is accurately calculated based on the slope of the change in the cell current value. Difficult to do. Therefore, in the present embodiment, the calculation of the deterioration rate is prohibited when the ignition switch is ON.
- step S02 it is determined whether or not the predetermined environmental conditions are satisfied.
- the "environmental condition” is set in advance as a condition necessary for calculating the deterioration rate. In the present embodiment, it is set as an environmental condition that the value of the oxygen concentration around the exhaust gas sensor 100 is within a predetermined range and the magnitude of the fluctuation range of the oxygen concentration is not more than a predetermined value.
- the "oxygen concentration around the exhaust gas sensor 100" can be obtained based on the value of the pump cell current.
- step S03 If the environmental conditions are not met, it is difficult to accurately calculate the deterioration rate based on the slope of the change in the cell current value. Therefore, in this case, the series of processes shown in FIG. 9 is completed without calculating the deterioration rate. If the environmental conditions are satisfied, the process proceeds to step S03.
- step S03 the current value acquisition unit 14 performs a process of acquiring the value of the pump cell current.
- the value of the pump cell current acquired here is acquired as the value of the pump cell current immediately before the suppression of oxygen discharge by the pump cell 150 is started, that is, the value of IP0 in FIG. 5 (B).
- step S04 the first cell control unit 13 starts suppressing the discharge of oxygen by the pump cell 150.
- the pump cell voltage is changed from the initial VP1 to a lower VP0.
- the period TM0 is started.
- the current value acquisition unit 14 samples the waveform of the change in the sensor cell current and the waveform of the change in the pump cell current at predetermined cycles.
- This sampling is performed in the period from time t0 shown in FIG. 5 (B) to time t5.
- the time t5 is preset as a timing at which the value of the pump cell current stabilizes after the period TM0 ends and the pump cell voltage is returned to VP1.
- the length of the period TM0 from the time t0 to the time t4 is set to any of 3 seconds to 10 seconds, and the length of the period from the time t0 to the time t5 is from 15 seconds. It is set to any of up to 30 seconds. That is, in the present embodiment, sampling is executed for a period longer than the period TM0.
- step S05 the values of IP1 and IP2 shown in FIG. 5B are acquired from the sampled waveform of the change in the pump cell current.
- IP1 is the value of the pump cell current immediately before the end of the period TM0.
- step S05 the respective values of IS11, IS12, IS21, IS22, and IS3 shown in FIG. 7 are acquired from the sampled waveform of the change in the sensor cell current.
- the meaning of each value and the timing at which each value is acquired are as described above with reference to FIG. 7.
- step S06 the process of calculating ⁇ IP shown in FIG. 5 (B) is performed.
- the dotted line DL1 shown in FIG. 5B is a straight line showing the change when the value of the pump cell current changes from IP0 to IP2 with a constant slope in the period from time t0 to time t5. It can be said that the straight line indicates a change in the value of the pump cell current when the value of the pump cell voltage is kept constant at VP1.
- ⁇ IP which is the amount of change in the pump cell current, is calculated as the difference between the dotted line DL1 defined in this way and the value of the pump cell current (that is, IP1) immediately before the time t4.
- This ⁇ IP corresponds to the amount in which the discharge of oxygen by the pump cell 150 is suppressed. It can also be said that ⁇ IP corresponds to the amount of increase in oxygen reaching the sensor cell 160 with the start of the period TM0.
- step S07 processing is performed to calculate the reference value of A1 and the reference value of A2, respectively.
- the "reference value of A1" is the first acquired when the exhaust gas sensor 100 has not deteriorated and the temperature of the sensor cell 160 is at a predetermined reference temperature. It is a value of the slope A1 and is a reference value set corresponding to the measured value of ⁇ IP.
- the "reference value of A2” is the value of the second slope A2 acquired when the exhaust gas sensor 100 has not deteriorated and the temperature of the sensor cell 160 is at a predetermined reference temperature. It is a reference value set corresponding to the measured value of ⁇ IP.
- step S09 the first index and the second index are calculated.
- the first index is calculated by dividing the first slope A1 by the reference value of A1.
- the second index is calculated by dividing the second slope A2 by the reference value of A2.
- step S10 a process of calculating the deterioration rate is performed by referring to the first index, the second index, and the map shown in FIG. 8 calculated as described above. As a result, an accurate deterioration rate is calculated while eliminating the influence of the temperature of the sensor cell 160.
- the second embodiment will be described.
- the control device according to the second embodiment is different from the first embodiment only in the method of calculating the deterioration rate by the deterioration rate calculation unit 15.
- the points different from the first embodiment will be mainly described, and the points common to the first embodiment will be omitted as appropriate.
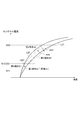
- FIG. 10 shows an example of the change in the cell current value during the period TM10.
- Shown in line L20 of FIG. 10 is a graph showing an example of a change in the cell current value actually acquired in a state where the temperature of the sensor cell 160 is relatively high.
- the line L21 in FIG. 10 shows the virtual temperature of the sensor cell 160 that would be acquired when the temperature of the sensor cell 160 is at a normal temperature when the degree of deterioration of the sensor cell 160 is the same as that of the line L20.
- It is a graph which shows the change of a typical cell current value. That is, the line L21 is a graph showing a change in the virtual cell current value that should be acquired when the influence of the temperature of the sensor cell 160 is eliminated and only the influence of the deterioration of the sensor cell 160 is applied. can.
- first slope A1 and the second slope A2 defined in the same manner as those described so far can be calculated. Further, for the line L21, the first slope A1 and the second slope A2 can be calculated in the same manner.
- the first slope A1 and the second slope A2 calculated for the case of the line L21 are hereinafter referred to as "first slope A1'" and "second slope A2'", respectively.
- the second slope A2' corresponds to the slope of the change in the cell current value when the temperature of the sensor cell 160 is excluded and only the deterioration of the sensor cell 160 is affected. Therefore, if the second slope A2'can be estimated by some method, the deterioration rate can be accurately calculated based on the second slope A2'.
- the second slope A2' is first calculated by the method described later, and then the deterioration rate is calculated based on the second slope A2' by using the map shown in FIG.
- the horizontal axis of FIG. 11 is a value obtained by dividing the second slope A2'by the "reference value of A2", that is, the second index described so far.
- the vertical axis of FIG. 11 is the deterioration rate corresponding to each value of the second index.
- the correspondence between the second index and the deterioration rate is created in advance as a map and stored in the storage unit 16 included in the control device 10. It should be noted that such a correspondence may be stored as a mathematical formula instead of a map.
- the first slope A1'on the line L21 is the slope acquired when the exhaust gas sensor 100 has not deteriorated and the temperature of the sensor cell 160 is a predetermined reference temperature, that is, "A1". It is almost equal to the "reference value of”.
- the reference value of A1 can be calculated based on the measured value of ⁇ IP in FIG. Therefore, when the actually measured value of the first slope A1 is divided by the "reference value of A1" calculated as described above, the graph of the cell current value shown on the line L21 is due to the influence of temperature. It can be said that it is an index showing how much the graph has changed to become the graph shown by the line L20. That is, it can be said that it is an index showing the degree of change as shown by the arrow AR1 in FIG.
- the correction coefficient is calculated based on the value obtained by dividing the value of the first slope A1 by the "reference value of A1", and this correction coefficient is multiplied by the second slope A2 to obtain the second slope A2. 'Is supposed to be calculated.
- the value obtained by dividing the value of the first slope A1 by the "reference value of A1" is the first index described so far, and indicates the degree to which the line L21 changes to the line L20 as shown by the arrow AR1 in FIG. It is to show. Further, the above correction coefficient is multiplied by the second slope A2 of the line L20 to change this to the second slope A2'as shown by the arrow AR2 in FIG.
- the deterioration rate calculation unit 15 calculates the first slope A1 and the second slope A2, respectively, based on the acquired graph of the cell current value. Subsequently, a value obtained by dividing the value of the first slope A1 by the "reference value of A1" is calculated, and the correction coefficient is calculated using the value and the map of FIG. Then, the calculated correction coefficient is multiplied by the second slope A2 calculated as described above to calculate the second slope A2'. Finally, the deterioration rate is calculated using the second slope A2'and the map of FIG.
- the deterioration rate calculation unit 15 calculates the correction coefficient based on the first inclination A1, corrects the second inclination A2 using the calculated correction coefficient, and corrects the second inclination A2. It is configured to calculate the deterioration rate based on the two slopes A2 (that is, the second slope A2'). Even in such an embodiment, the deterioration rate of the exhaust gas sensor 100 can be accurately calculated while eliminating the influence of the temperature of the sensor cell 160.
- step S01 to step S08 are the same as those shown in FIG.
- step S21 the correction coefficient is calculated using the map of FIG. 12 based on the first slope A1 calculated in step S08 and the “reference value of A1”.
- step S22 following step S21, the second slope A2'is calculated by multiplying the correction coefficient calculated in step S21 by the second slope A2 calculated in step S08.
- step S23 the deterioration rate is calculated using the map of FIG. 11 based on the second slope A2'calculated as described above and the "reference value of A2". As a result, an accurate deterioration rate is calculated while eliminating the influence of the temperature of the sensor cell 160.
- the controls and methods described in the present disclosure are provided by configuring a processor and memory programmed to perform one or more functions embodied by a computer program. It may be realized by a computer.
- the control device and control method described in the present disclosure may be realized by a dedicated computer provided by configuring a processor including one or more dedicated hardware logic circuits.
- the control device and control method described in the present disclosure comprises a combination of a processor and memory programmed to perform one or more functions and a processor including one or more hardware logic circuits. It may be realized by one or more dedicated computers.
- the computer program may be stored on a computer-readable non-transitional tangible recording medium as an instruction executed by the computer.
- the dedicated hardware logic circuit and the hardware logic circuit may be realized by a digital circuit including a plurality of logic circuits or an analog circuit.
Landscapes
- Engineering & Computer Science (AREA)
- Chemical & Material Sciences (AREA)
- Life Sciences & Earth Sciences (AREA)
- Health & Medical Sciences (AREA)
- Combustion & Propulsion (AREA)
- General Engineering & Computer Science (AREA)
- Mechanical Engineering (AREA)
- Physics & Mathematics (AREA)
- Biochemistry (AREA)
- General Health & Medical Sciences (AREA)
- General Physics & Mathematics (AREA)
- Immunology (AREA)
- Pathology (AREA)
- Analytical Chemistry (AREA)
- Electrochemistry (AREA)
- Food Science & Technology (AREA)
- Medicinal Chemistry (AREA)
- Chemical Kinetics & Catalysis (AREA)
- Molecular Biology (AREA)
- Measuring Oxygen Concentration In Cells (AREA)
- Combined Controls Of Internal Combustion Engines (AREA)
- Exhaust Gas After Treatment (AREA)
Priority Applications (1)
| Application Number | Priority Date | Filing Date | Title |
|---|---|---|---|
| DE112021001278.9T DE112021001278T5 (de) | 2020-02-27 | 2021-02-12 | Steuerungsvorrichtung |
Applications Claiming Priority (2)
| Application Number | Priority Date | Filing Date | Title |
|---|---|---|---|
| JP2020031804A JP7234976B2 (ja) | 2020-02-27 | 2020-02-27 | 制御装置 |
| JP2020-031804 | 2020-02-27 |
Publications (1)
| Publication Number | Publication Date |
|---|---|
| WO2021172041A1 true WO2021172041A1 (ja) | 2021-09-02 |
Family
ID=77491496
Family Applications (1)
| Application Number | Title | Priority Date | Filing Date |
|---|---|---|---|
| PCT/JP2021/005170 Ceased WO2021172041A1 (ja) | 2020-02-27 | 2021-02-12 | 制御装置 |
Country Status (3)
| Country | Link |
|---|---|
| JP (1) | JP7234976B2 (https=) |
| DE (1) | DE112021001278T5 (https=) |
| WO (1) | WO2021172041A1 (https=) |
Families Citing this family (3)
| Publication number | Priority date | Publication date | Assignee | Title |
|---|---|---|---|---|
| JP2023070336A (ja) * | 2021-11-09 | 2023-05-19 | 株式会社デンソー | 制御装置 |
| CN121420194A (zh) * | 2023-07-03 | 2026-01-27 | 日本碍子株式会社 | 气体传感器 |
| DE112024001597T5 (de) * | 2023-07-03 | 2026-02-26 | Ngk Insulators, Ltd. | Gassensor |
Citations (2)
| Publication number | Priority date | Publication date | Assignee | Title |
|---|---|---|---|---|
| WO2014207839A1 (ja) * | 2013-06-26 | 2014-12-31 | トヨタ自動車株式会社 | 内燃機関の診断装置 |
| JP2018200228A (ja) * | 2017-05-26 | 2018-12-20 | 株式会社デンソー | ガスセンサ制御装置 |
Family Cites Families (3)
| Publication number | Priority date | Publication date | Assignee | Title |
|---|---|---|---|---|
| JP4365830B2 (ja) * | 2006-01-18 | 2009-11-18 | 株式会社日立製作所 | 内燃機関の空燃比センサ診断装置 |
| JP6776533B2 (ja) | 2015-12-25 | 2020-10-28 | 株式会社デンソー | ガスセンサの制御装置 |
| JP7205867B2 (ja) | 2018-08-29 | 2023-01-17 | 株式会社サンセイアールアンドディ | 遊技機 |
-
2020
- 2020-02-27 JP JP2020031804A patent/JP7234976B2/ja active Active
-
2021
- 2021-02-12 DE DE112021001278.9T patent/DE112021001278T5/de active Pending
- 2021-02-12 WO PCT/JP2021/005170 patent/WO2021172041A1/ja not_active Ceased
Patent Citations (2)
| Publication number | Priority date | Publication date | Assignee | Title |
|---|---|---|---|---|
| WO2014207839A1 (ja) * | 2013-06-26 | 2014-12-31 | トヨタ自動車株式会社 | 内燃機関の診断装置 |
| JP2018200228A (ja) * | 2017-05-26 | 2018-12-20 | 株式会社デンソー | ガスセンサ制御装置 |
Also Published As
| Publication number | Publication date |
|---|---|
| JP2021135176A (ja) | 2021-09-13 |
| JP7234976B2 (ja) | 2023-03-08 |
| DE112021001278T5 (de) | 2022-12-15 |
Similar Documents
| Publication | Publication Date | Title |
|---|---|---|
| CN108343496B (zh) | 催化器劣化诊断方法和催化器劣化诊断系统 | |
| WO2021172041A1 (ja) | 制御装置 | |
| US11249043B2 (en) | Control device for gas sensor | |
| JP6149641B2 (ja) | ガスセンサ制御装置 | |
| WO2017222003A1 (ja) | 排ガス浄化システム及び排ガス浄化方法 | |
| US20160061771A1 (en) | Gas concentration detecting device | |
| JP6421771B2 (ja) | 硫黄酸化物検出装置 | |
| US9891188B2 (en) | Gas concentration detecting device | |
| JP6965578B2 (ja) | ガスセンサ制御装置 | |
| US11174807B2 (en) | Operation control method of vehicle engine and vehicle system | |
| JP4893652B2 (ja) | ガスセンサ制御装置 | |
| WO2021172042A1 (ja) | 制御装置 | |
| JP6344262B2 (ja) | 排気センサ | |
| WO2020145042A1 (ja) | ガス濃度検出装置 | |
| US10731588B2 (en) | Control apparatus for exhaust gas sensor | |
| JP6927174B2 (ja) | 制御装置 | |
| JP6708168B2 (ja) | ガスセンサ制御装置 | |
| JP6900937B2 (ja) | 制御装置 | |
| JP2009075012A (ja) | 空燃比センサ劣化抑制装置 | |
| WO2023085015A1 (ja) | 制御装置 | |
| WO2018221528A1 (ja) | ガスセンサ制御装置 | |
| JP2019124185A (ja) | 制御装置 | |
| JP5141576B2 (ja) | ガス濃度検出装置 | |
| JPH02310453A (ja) | 触媒の劣化検知方法 | |
| JP2017146199A (ja) | 硫黄酸化物検出装置 |
Legal Events
| Date | Code | Title | Description |
|---|---|---|---|
| 121 | Ep: the epo has been informed by wipo that ep was designated in this application |
Ref document number: 21760292 Country of ref document: EP Kind code of ref document: A1 |
|
| 122 | Ep: pct application non-entry in european phase |
Ref document number: 21760292 Country of ref document: EP Kind code of ref document: A1 |