WO2021112205A1 - Procédé, dispositif et système d'analyse d'image, programme de commande et support d'enregistrement - Google Patents
Procédé, dispositif et système d'analyse d'image, programme de commande et support d'enregistrement Download PDFInfo
- Publication number
- WO2021112205A1 WO2021112205A1 PCT/JP2020/045155 JP2020045155W WO2021112205A1 WO 2021112205 A1 WO2021112205 A1 WO 2021112205A1 JP 2020045155 W JP2020045155 W JP 2020045155W WO 2021112205 A1 WO2021112205 A1 WO 2021112205A1
- Authority
- WO
- WIPO (PCT)
- Prior art keywords
- image
- reference value
- maximum
- binarized
- features
- Prior art date
Links
Images


Classifications
-
- G—PHYSICS
- G06—COMPUTING; CALCULATING OR COUNTING
- G06T—IMAGE DATA PROCESSING OR GENERATION, IN GENERAL
- G06T7/00—Image analysis
- G06T7/0002—Inspection of images, e.g. flaw detection
- G06T7/0012—Biomedical image inspection
- G06T7/0014—Biomedical image inspection using an image reference approach
- G06T7/0016—Biomedical image inspection using an image reference approach involving temporal comparison
-
- G—PHYSICS
- G06—COMPUTING; CALCULATING OR COUNTING
- G06T—IMAGE DATA PROCESSING OR GENERATION, IN GENERAL
- G06T7/00—Image analysis
- G06T7/0002—Inspection of images, e.g. flaw detection
- G06T7/0012—Biomedical image inspection
- G06T7/0014—Biomedical image inspection using an image reference approach
-
- A—HUMAN NECESSITIES
- A61—MEDICAL OR VETERINARY SCIENCE; HYGIENE
- A61B—DIAGNOSIS; SURGERY; IDENTIFICATION
- A61B6/00—Apparatus for radiation diagnosis, e.g. combined with radiation therapy equipment
- A61B6/02—Devices for diagnosis sequentially in different planes; Stereoscopic radiation diagnosis
- A61B6/03—Computerised tomographs
-
- G—PHYSICS
- G06—COMPUTING; CALCULATING OR COUNTING
- G06T—IMAGE DATA PROCESSING OR GENERATION, IN GENERAL
- G06T1/00—General purpose image data processing
-
- G—PHYSICS
- G06—COMPUTING; CALCULATING OR COUNTING
- G06T—IMAGE DATA PROCESSING OR GENERATION, IN GENERAL
- G06T7/00—Image analysis
- G06T7/10—Segmentation; Edge detection
- G06T7/11—Region-based segmentation
-
- G—PHYSICS
- G06—COMPUTING; CALCULATING OR COUNTING
- G06T—IMAGE DATA PROCESSING OR GENERATION, IN GENERAL
- G06T7/00—Image analysis
- G06T7/10—Segmentation; Edge detection
- G06T7/136—Segmentation; Edge detection involving thresholding
-
- G—PHYSICS
- G06—COMPUTING; CALCULATING OR COUNTING
- G06V—IMAGE OR VIDEO RECOGNITION OR UNDERSTANDING
- G06V10/00—Arrangements for image or video recognition or understanding
- G06V10/20—Image preprocessing
- G06V10/25—Determination of region of interest [ROI] or a volume of interest [VOI]
-
- G—PHYSICS
- G06—COMPUTING; CALCULATING OR COUNTING
- G06V—IMAGE OR VIDEO RECOGNITION OR UNDERSTANDING
- G06V10/00—Arrangements for image or video recognition or understanding
- G06V10/40—Extraction of image or video features
- G06V10/62—Extraction of image or video features relating to a temporal dimension, e.g. time-based feature extraction; Pattern tracking
-
- G—PHYSICS
- G06—COMPUTING; CALCULATING OR COUNTING
- G06V—IMAGE OR VIDEO RECOGNITION OR UNDERSTANDING
- G06V10/00—Arrangements for image or video recognition or understanding
- G06V10/70—Arrangements for image or video recognition or understanding using pattern recognition or machine learning
- G06V10/74—Image or video pattern matching; Proximity measures in feature spaces
- G06V10/75—Organisation of the matching processes, e.g. simultaneous or sequential comparisons of image or video features; Coarse-fine approaches, e.g. multi-scale approaches; using context analysis; Selection of dictionaries
- G06V10/751—Comparing pixel values or logical combinations thereof, or feature values having positional relevance, e.g. template matching
-
- G—PHYSICS
- G06—COMPUTING; CALCULATING OR COUNTING
- G06V—IMAGE OR VIDEO RECOGNITION OR UNDERSTANDING
- G06V10/00—Arrangements for image or video recognition or understanding
- G06V10/70—Arrangements for image or video recognition or understanding using pattern recognition or machine learning
- G06V10/82—Arrangements for image or video recognition or understanding using pattern recognition or machine learning using neural networks
-
- G—PHYSICS
- G06—COMPUTING; CALCULATING OR COUNTING
- G06T—IMAGE DATA PROCESSING OR GENERATION, IN GENERAL
- G06T2207/00—Indexing scheme for image analysis or image enhancement
- G06T2207/30—Subject of image; Context of image processing
- G06T2207/30004—Biomedical image processing
- G06T2207/30024—Cell structures in vitro; Tissue sections in vitro
-
- G—PHYSICS
- G06—COMPUTING; CALCULATING OR COUNTING
- G06V—IMAGE OR VIDEO RECOGNITION OR UNDERSTANDING
- G06V2201/00—Indexing scheme relating to image or video recognition or understanding
- G06V2201/03—Recognition of patterns in medical or anatomical images
- G06V2201/031—Recognition of patterns in medical or anatomical images of internal organs
Definitions
- the present invention relates to an image analysis method, an image analysis device, and the like that analyze an image of an image of a tissue and determine changes that have occurred in the tissue.
- Patent Documents 1 and 2 disclose image analysis techniques for medical images.
- the doctor understands the structural characteristics of the lesion site that has occurred in the tissue, and also understands what kind of image each lesion site can be imaged. The doctor then determines the changes that have occurred in the tissue based on the image of the tissue.
- a doctor can infer and determine the type of lung nodule based on the nature of the nodule shadow found in the CT image of the patient's lung.
- an image analysis technique that can determine the type of lung nodule from the nodule shadow in the same way as a doctor determines the type of lung nodule.
- Such an image analysis technique can be utilized not only for interpretation of CT images of lungs but also for detection and determination of lesions in various organs and tissues.
- One aspect of the present invention has been made to solve the above problems, the purpose of which is to analyze an image of a tissue based on the structural properties of the changes that have occurred in the tissue. It is an object of the present invention to realize an image analysis method, an image analysis device, and the like that accurately determine changes in a tissue like a doctor.
- the image analysis method is a method of analyzing a tissue image obtained by imaging a tissue, and extracts a target region image to be analyzed from the tissue image.
- the binarization step of generating a plurality of binarized images having different binarization reference values for the target region image, and the first pixel value and the second pixel value for each of the plurality of the binarized images.
- the feature number calculation step for calculating the number, the first reference value indicating the binarization reference value in the identified binarized image by specifying the binarized image having the maximum number of the first features, and the said Based on the reference value specifying step for specifying the maximum number of first features indicating the number of first features in the binarized image, the first reference value, and the maximum number of first features, the change occurring in the structure is determined. Including the determination step to be performed.
- the image analysis device is an image analysis device that analyzes a tissue image obtained by imaging a tissue, and extracts a target region image to be analyzed from the tissue image. Then, for the target area image, the binarization unit that generates a plurality of binarized images having different binarization reference values, and the first pixel value and the second pixel for each of the plurality of the binarized images.
- the number of first features indicating the number of hole-shaped regions composed of the pixels of the second pixel value after being binarized to the value, surrounded by the pixels of the first pixel value after being binarized to the value.
- the feature number calculation unit to be calculated, the first reference value indicating the binarization reference value in the identified binarized image by specifying the binarized image having the maximum number of features, and the binar value.
- a determination to determine a change that has occurred in the structure based on a reference value specifying unit that specifies the maximum number of first features indicating the number of first features in the image, the first reference value, and the maximum number of first features. It has a part and.
- the image analysis device may be realized by a computer.
- the image analysis device is made into a computer by operating the computer as each part (software element) included in the image analysis device.
- the control program of the image analysis device to be realized and the computer-readable recording medium on which the control program is recorded also fall within the scope of the present invention.
- the changes that have occurred in the tissue can be accurately determined.
- FIG. 1 It is a figure which shows typically the outline of the processing flow when the image analysis apparatus which concerns on one aspect of this invention is applied to the analysis of the CT image of a lung. It is a flowchart which shows an example of the flow of processing performed by an image analysis apparatus. It is a graph which plotted the change of the one-dimensional Betti number which accompanies changing the reference value of binarization in the binarized image generated about the lung field without a nodule and the region of a pulmonary blood vessel. It is a graph which plotted the change of the one-dimensional Betti number by changing the reference value of binarization in the binarized image generated about the region of a solid nodule and the region of a frosted glass type nodule.
- the change in the ratio between the 1D Betti number and the 0D Betti number due to the change in the binarization reference value is shown. It is a plotted graph. In the binarized images generated for the solid nodule region and the frosted glass nodule region, plot the change in the ratio between the 1D Betti number and the 0D Betti number due to the change in the binarization reference value. It is a graph. It is a graph which plotted the change of the one-dimensional Betti number which accompanies changing the reference value of binarization in the binarized image generated about the lung field without a nodule and the region of a pulmonary blood vessel.
- the inventors of the present invention analyzed the region where the lung (tissue) was imaged in the CT (computed tomography) image which imaged the chest of the subject as an example of the tissue image. Specifically, the inventors of the present invention have compared and examined in detail the region in which no lung nodule has occurred and the region in which the lung nodule has occurred in the CT image (tissue image) of the lung.
- the inventors of the present invention extract a nodule shadow to be analyzed from a CT image of the lung, and create a plurality of binarized images having different reference values for binarization with respect to the nodule shadow. Generated. Then, the inventors of the present invention calculated the one-dimensional Betti number b1 (first feature number) and the zero-dimensional Betti number when the binarization reference value was changed for each of the binarized images. We investigated how b0 (the number of second features) changes.
- the inventors of the present invention have a nodule shadow of any kind of lung nodule based on the reference value of binarization when the one-dimensional Betti number b1 is maximized and the maximum value of the one-dimensional Betti number b1. We found that it is possible to accurately determine whether it is derived.
- the inventors of the present invention can further improve the accuracy of determination of lung nodules and improve the efficiency of determination processing by further utilizing the following (1) to (3). I also found it.
- the image analysis method applies the concept of homology, particularly persistent homology, to the binarized image.
- Homology is a field of mathematics that algebraically replaces the morphological properties of figures to facilitate analysis such as the combination of figures.
- the concept of homology is a mathematical concept that represents the connection and contact of components.
- an appropriate reference value for binarization also called a binarization parameter
- the 0-dimensional Betti number and the 1-dimensional Betti number b1 are calculated from the binarized image.
- the calculated 0-dimensional Betti number b0 and 1-dimensional Betti number b1 it is possible to evaluate the degree of connection between the components of the organization and the degree of contact between the components.
- the Betti number is a topological suggestion number that is irrelevant to the shape of a figure (for example, a component of an organization) and is related only to contact and separation between figures.
- this q-dimensional singular homology group is finitely generated, this q-th order singular homology group is divided into a direct sum of a free abelian group and a finite abelian group.
- the class of this free abelian group is called the Betti number.
- the zero-dimensional Betti number b0 is mathematically defined as follows. Generally, the number of connected components of a figure (also called a one-dimensional complex) K formed by connecting a finite number of line segments is called a 0-dimensional Betti number. "A figure connecting a finite number of points with a finite number of line segments is a concatenation" means that it is possible to reach any other vertex of this figure by tracing the sides of this figure. To do.
- the pixels of one pixel value after binarization (for example, the pixel value is 0 as a result of binarization) are concatenated.
- the number of connected regions is 0-dimensional Vetch number b0.
- the one-dimensional Betti number b1 is mathematically defined as follows.
- the one-dimensional Betti number b1 of the figure K is r.
- an appropriate r number of open (not including both ends) one-dimensional simplex Does not increase the number of connected components of the figure K even if is removed from the figure K.
- K is no longer connected (that is, the number of connected components of K is increased by one).
- Each of the plurality of binarized images generated using different binarization reference values is surrounded by pixels of one pixel value after binarization (for example, the pixel value is 0 as a result of binarization).
- the number of hole-shaped regions (for example, the pixel value is 255 as a result of binarization) is the one-dimensional vetch number b1.
- FIG. 2 is a schematic diagram for explaining the Betti number in the concept of homology.
- the number of black regions is one. Therefore, the 0-dimensional Betti number b0 of the figure M1 is 1.
- the number of white areas surrounded by the black areas is one. Therefore, the one-dimensional Betti number b1 of the figure M1 is 1.
- the number of black areas is two. Therefore, the 0-dimensional Betti number b0 of the figure M2 is 2. Further, in the case of the figure M2, the number of white areas surrounded by the black areas is three. Therefore, the one-dimensional Betti number b1 of the figure M2 is 3.
- the 0-dimensional Betti number b0 is the number of groups of components connected to each other, and the one-dimensional Betti number b1 is the space surrounded by the connected components as the outer edge (hereinafter, "hole-shaped area"). It may be written as).
- the number of hole-shaped regions is the total number of "holes" present in the connected component.
- tissue image to be analyzed and analysis target tissue image to be analyzed and analysis target
- an image analysis device 1 that analyzes a nodule shadow on a CT image of the lung and determines changes occurring in the lung (for example, the presence or absence of a lung nodule and the type of the lung nodule) will be described as an example.
- the tissue image to which the image analysis method according to one aspect of the present invention can be applied is not limited to the CT image of the lung.
- the image analysis method can be applied to various medical images (tissue images) such as the following (1) to (5).
- images of the brain and pancreas imaged by MRI (magnetic resonance imaging) examination (2) Images of liver and breast imaged by X-ray (including mammography) examination (3) PET (Positron emission tomography) (4) PET-CT (positron emission tomography / CT) (5) SPECT-CT (single-photon emission coupled tomography / CT).
- the image of the region to be analyzed by the image analysis method according to one aspect of the present invention is not limited to the nodule shadow.
- an image of an arbitrary lesion site found in the images (1) to (5) above can be the analysis target of the image analysis method according to one aspect of the present invention.
- FIG. 3 is a diagram showing an example of a CT image of a region of the lung field where nodules have not formed.
- FIG. 4 is a diagram showing an example of a CT image of a region of a pulmonary blood vessel.
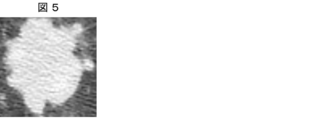
- FIG. 5 is a diagram showing an example of a CT image of a region of the lung where a solid nodule is generated.
- FIG. 6 is a diagram showing an example of a CT image of a region of the lung where ground glass type nodules are formed.
- the region where the X-ray absorption rate is lower is displayed with a higher degree of blackness than the region where the X-ray absorption rate is higher.
- the normal lung is displayed as a dark area with a pale milky white haze, as shown in FIG.
- Pulmonary vessels can be displayed as a circular or oval image whose interior is whiter than its surroundings, as shown in FIG.
- the nodule shadow is displayed as a “circular shadow” whose inside is whiter than the surroundings.
- Pulmonary nodules are detected on CT images of the lung as circular or spindle-shaped with a maximum diameter of 3 cm or less, or as nodule shadows that are visually recognized as regions with irregular absorption value increases. Lung nodules are classified into solid nodules, ground-glass nodules, and mixed nodules based on the nature of the nodule shadow.
- a solid nodule is a nodule whose inside is filled with a region of soft tissue absorption value (white region).
- Frosted glass nodules are nodules that have a lower degree of internal whiteness than solid nodules and have visible pulmonary blood vessels and bronchial margins inside.
- Mixed nodules (not shown) are also referred to as part-solid nodules.
- a mixed nodule is a nodule that has both a ground glass nodule area and a solid nodule area inside.
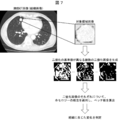
- FIG. 7 is a diagram schematically showing an outline of a processing flow when the image analysis device 1 according to one aspect of the present invention is applied to the analysis of CT images of lungs.
- the image analysis device 1 extracts an image of the region to be analyzed (hereinafter referred to as "target region image") from the chest CT image. Next, the image analysis device 1 generates a plurality of binarized images having different binarization reference values for the extracted target region image.
- the image analysis device 1 applies the concept of homology to each of the generated binarized images, calculates the Betti number, and analyzes the target area image.
- the image analysis device 1 determines the change that has occurred in the lung (tissue) as a result of analyzing the target area image.
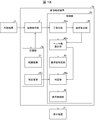
- FIG. 1 is a block diagram showing an example of the configuration of the image analysis device 1 according to one aspect of the present invention. Note that FIG. 1 also shows an external device 8 that transmits an image to the image analysis device 1.
- the image analysis device 1 includes an image acquisition unit 2, a storage unit 3, and a control unit 4. At least the tissue image 31 and the determination criterion 32 are stored in the storage unit 3.
- the image acquisition unit 2 acquires a tissue image of the tissue from the external device 8.
- the image acquisition unit 2 acquires a chest CT image (see FIG. 7) obtained by imaging the chest of the subject with an appropriate contrast from the external device 8.
- the contrast of the chest CT image may be appropriately set according to the X-ray absorption rate of the tissue to be analyzed.
- the image acquisition unit 2 stores the acquired chest CT image in the storage unit 3.
- the image acquisition unit 2 is characterized as a nodular shadow from a CT image obtained by extracting a lung region from a chest CT image from an external device 8 (hereinafter referred to as “lung CT image”) or a lung CT image.
- An image obtained by cutting out a region having the above along the contour may be acquired.
- the image acquisition unit 2 may be configured to store the acquired image in a storage unit 3 described later. Alternatively, the image acquisition unit 2 may directly output the acquired image to the control unit 4 described later.
- the external device 8 may be, for example, a CT device or a personal computer connected to the CT device, or a server device that stores and manages image data.
- FIG. 1 illustrates an example in which the image analysis device 1 acquires a tissue image from an external device 8 separate from the image analysis device 1, but the present invention is not limited to this.
- the image analysis device 1 may be configured to be built in the external device 8, or the image analysis device 1 may be configured to have the function of the external device 8.
- the storage unit 3 stores a control program, an OS program, an application program, and the like of each unit executed by the control unit 4. Further, the storage unit 3 stores various data to be read when the control unit 4 executes these programs.
- the storage unit 3 is composed of a non-volatile storage device such as a hard disk or a flash memory. In addition to the storage unit 3, it is a storage device used as a work area for temporarily holding data in the process of executing the above-mentioned various programs, and is a volatile storage device such as a RAM (Random Access Memory). It may be equipped with a device.
- the display device 5 is a display device that displays information and the like output from the control unit 4, and is, for example, a liquid crystal display.
- the display device 5 may be a dedicated display included in the image analysis device 1.
- the display device 5 may have a configuration in which a touch sensor is superimposed on the display screen and can detect a touch operation on the display surface by the user.
- FIG. 1 illustrates an example in which the image analysis device 1 is connected to a display device 5 (presentation unit) provided as a separate body, but the present invention is not limited to this.
- the image analysis device 1 may have a built-in display device 5 (presentation unit).
- the image analysis device 1 and the external device 8 and the image analysis device 1 and the display device 5 may be connected by wireless communication or by wired communication.
- the control unit 4 determines the type of lung nodule by analyzing an image of a region to be analyzed (hereinafter referred to as a target region image) such as a region having a characteristic as a nodule shadow, and outputs a determination result. ..
- the control unit 4 includes a binarization unit 41, a Betti number calculation unit 42 (feature number calculation unit), a reference value identification unit 43, a determination unit 44, and a display control unit 45.
- the binarization unit 41 extracts a target region image to be analyzed from the CT image of the lung, performs binarization processing on the target region image, and binarizes a plurality of binarizations having different reference values for binarization. Generate an image (see FIG. 7).
- the binarization unit 41 may have a known image recognition function. As a result, when the chest CT image is acquired from the external device 8, the binarization unit 41 can cut out the lung CT image from the chest CT image by the known image recognition function. Since the lung has a lower X-ray absorption rate than the surrounding tissue, it is possible to cut out a CT image of the lung from the chest CT image by using a known image processing method.
- the binarization unit 41 may further have a function of extracting a target area image from the CT image of the lung.
- the image acquisition unit 2 may store the extracted target area image in the storage unit 3 or output it to the binarization unit 41.
- the binarization unit 41 capable of extracting the target region image from the CT image of the lung can be realized by applying a known method such as deep learning.
- the binarization unit 41 has a correspondence relationship between the chest CT image and the target region image (for example, an image having a feature as a nodule shadow) to be detected (or cut out) from the chest CT image.
- the deep learning used as the training data may be performed.
- the chest CT image used as the training data may be, for example, a chest CT image including an image of a region in which a feature as a nodule shadow is recognized in advance by interpretation by a doctor.
- the binarization unit 41 can extract the target region image from the CT image of the lung extracted from the chest CT image.
- the binarization unit 41 converts a pixel having a pixel value (or CT value) larger than the binarization reference value into a white pixel, and a pixel equal to or less than the binarization reference value. Pixels with values are converted to black pixels.
- the binarization unit 41 performs a binarization process on one CT image obtained by imaging the lung each time the reference value for binarization is changed, and generates a plurality of binarized images. That is, the binarization unit 41 generates a plurality of binarized images having different reference values for binarization from the CT image of the lung.
- the binarization unit 41 describes a case where the binarization reference value is set based on the pixel value of each pixel of the target area image displayed as a grayscale image as an example. .. That is, the binarization unit 41 sets the binarization reference value in the range of 0 to 255. For example, when the reference value for binarization is set to the pixel value 100, the pixel value of a pixel having a pixel value of 100 or less becomes 0 as a result of the binarization process, and the pixel value of a pixel having a pixel value higher than 100 is two. The result of the binarization process is 255.
- the reference value for binarization may be set in the range of CT value ⁇ 1000 to ⁇ 700 HU, which is generally set in a chest CT image in which the lung is to be imaged.
- the binarization reference value is set to -900HU
- the pixel value of the pixel whose CT value is -900HU or less becomes 0 as a result of the binarization process, and the pixel value of the pixel whose CT value is higher than -900HU is binarized.
- the result of the processing is 255.
- the binarization unit 41 may limit the range of CT values in the target area image before the binarization process.
- the region where the CT value is in the range of 0HU to 1000HU is ignored. Therefore, for example, the target of the binarization process may be limited to the range where the CT value is ⁇ 1000HU to 0HU.
- the CT value in the range of ⁇ 1000HU to 0HU is associated with the pixel value in the range of 0 to 255. For example, a value obtained by rounding off the decimal point of the value of 255 ⁇ (CT value) / (range of CT value in the target area image) may be determined as the pixel value corresponding to the CT value.
- the Betch number calculation unit 42 is surrounded by pixels of one pixel value (first pixel value) after being binarized to the first pixel value and the second pixel value for each of the plurality of binarized images.
- the one-dimensional vetch number b1 indicating the number of hole-shaped regions composed of pixels of the other pixel value (second pixel value) after the binarization is calculated.
- the Betti number calculation unit 42 for each of the plurality of the binarized images, one pixel value (first pixel value) after being binarized into the first pixel value and the second pixel value is concatenated.
- the 0-dimensional Betti number b0 indicating the number of connected regions including the above may be further calculated.
- connection area is, for example, an area in which pixels having a pixel value of 0 after binarization processing are adjacent to each other.
- Each connected region is surrounded by pixels having a pixel value of 255 after the binarization process, and is an region independent of each other.
- the hole is an opening having at least a part of the outer edge of one or more components (in the case of one component, the entire outer edge of the component) as the outer edge.
- the hole surrounded by the outer edge of the component includes a hole contained therein by one component and a hole surrounded by an outer edge each of a plurality of components connected to each other.
- the values of the one-dimensional Betti number b1 and the zero-dimensional Betti number b0 calculated by the Betti number calculation unit 42 depend on the area of the region captured in the target region image. Therefore, it is desirable that the Betti number calculation unit 42 calculates the one-dimensional Betti number b1 and the zero-dimensional Betti number b0 of the target area images having the same area of the captured area.
- the Betti number calculation unit 42 may further calculate the ratio of the one-dimensional Betti number b1 and the zero-dimensional Betti number b0 for each of the plurality of the binarized images.
- the value (b1 / b0) obtained by dividing the one-dimensional Betti number b1 by the 0-dimensional Betti number b0 is calculated will be described as an example, but the one-dimensional Betti number b1 and the 0-dimensional Betti number will be described.
- the ratio to b0 may be either b1 / b0 or b0 / b1.
- CHomP can be mentioned as an example of such a program.
- CHomP is GNU (General Public License) compliant freeware and can be downloaded from the homepage (http://chomp.rutgers.edu/).
- the program is not limited to this, and any program other than ChomP may be used as long as it is a program capable of calculating the 0-dimensional Betti number b0 and the 1-dimensional Betti number b1 related to the image.
- the reference value specifying unit 43 identifies the binarized image having the maximum one-dimensional Betti number b1 among the plurality of binarized images generated by the binarized unit 41. Further, the reference value specifying unit 43 specifies the first reference value Ta and the maximum one-dimensional Betti number Va (maximum number of first features).
- the first reference value Ta is a reference value for binarization in the specified binarized image.
- the maximum one-dimensional Betti number Va is the one-dimensional Betti number b1 in the specified binarized image.
- the reference value specifying unit 43 may specify a binarized image in which b1 / b0 is the maximum value.
- the reference value specifying unit 43 has a third reference value Tc indicating a reference value for binarization in the specified binarized image, and a value R of b1 / b0 in the specified binarized image (hereinafter, "b1 / b0". (Maximum value R) (maximum number of third features) may be further specified.
- the reference value specifying unit 43 may generate a graph plotting the number of 0-dimensional Betti numbers, the number of 1-dimensional Betti numbers, and the changes accompanying changes in the reference value for binarization of b1 / b0. From the generated graph, the reference value specifying unit 43 is the maximum value of the first reference value Ta, the maximum one-dimensional Betti number Va, the second reference value Tb, the maximum 0-dimensional Betti number Vb, the third reference value Tc, and b1 / b0. R and the like can be read.
- the determination unit 44 determines the changes that have occurred in the lungs based on the following (1) and (2).
- the determination unit 44 may be configured to refer to the determination criterion 32 for determining the change that has occurred in the lungs.
- the determination criterion 32 will be described later with a specific example.
- the accuracy of the determination of the target region image by the determination unit 44 can be improved by applying a known method such as deep learning.
- a known method such as deep learning.
- the following (teacher data) and the like can be used.
- (Teacher data) Includes a combination of the above parameters (for example, (1) to (6) above) used by the determination unit 44 to determine the target area image and the result determined by the doctor for the target area image. data.
- the display control unit 45 causes the display device 5 to display information indicating the determination result output from the determination unit 44.
- the display control unit 45 may display the chest CT image (or lung CT image) used for extracting the target area image on the display device 5 together with the information indicating the determination result.
- the display control unit 45 causes the display device 5 to display information indicating the position of the target area image in the chest CT image (or lung CT image) together with the determination result and the chest CT image (or lung CT image). May be good.
- the image analysis device 1 can present the determination result while allowing the user to visually recognize the target area image in the chest CT image (or lung CT image).
- the user may include a doctor, a laboratory engineer, a researcher, and the like.
- the method of presenting the determination result to the user may be in a desired mode.
- the determination result may be displayed on the display device 5, or may be output from a printer (not shown), a speaker (not shown), or the like. Good.
- FIG. 8 is a flowchart showing an example of the flow of processing performed by the image analysis apparatus 1.
- the image acquisition unit 2 acquires a tissue image obtained by capturing the tissue from the external device 8 (step S1).
- the binarization unit 41 extracts the target area image from the tissue image, and generates a plurality of binarized images having different reference values for binarization for the target area image (step S2: binarization step). ).
- the Betti number calculation unit 42 calculates the one-dimensional Betti number b1 for each of the plurality of binarized images (step S3: feature number calculation step).
- FIG. 9 is a graph plotting the change in the one-dimensional Betti number b1 due to the change in the binarization reference value in the binarized image generated for the lung field without nodules and the region of the pulmonary blood vessel. Is. In FIG. 9, the one-dimensional Betti number b1 for the target area image of the lung field without nodules is shown by a solid line, and the one-dimensional Betti number b1 for the target area image of the pulmonary blood vessel is shown by a broken line. ..
- FIG. 10 shows the change in the one-dimensional Betti number b1 due to the change in the binarization reference value in the binarized image generated for the solid nodule region and the target region image of the frosted glass nodule. It is a plotted graph.
- the one-dimensional Betti number b1 for the target area image of the solid nodule is shown by a solid line
- the one-dimensional Betti number b1 for the target area image of the frosted glass type nodule is shown by a broken line.
- the reference value specifying unit 43 specifies the binarized image having the maximum one-dimensional Betti number b1, and specifies the first reference value Ta and the maximum one-dimensional Betti number Va (step S4: reference). Value identification step).
- the determination unit 44 determines the change occurring in the lung based on the first reference value Ta and the maximum one-dimensional Betti number Va (step S5: determination step).
- FIG. 11 is a graph in which the first reference value Ta and the maximum one-dimensional Betti number Va are plotted for each target area image.
- the combination of the first reference value Ta specified by the reference value specifying unit 43 and the maximum one-dimensional Betti number Va is clearly divided into four groups A to D.
- the group A is a point obtained by plotting the first reference value Ta and the maximum one-dimensional Betti number Va in the target region image of the solid nodule.
- Group B is a point obtained by plotting the first reference value Ta and the maximum one-dimensional Betti number Va in the target area image of the pulmonary blood vessel.
- Group C is a plot of the first reference value Ta and the maximum one-dimensional Betti number Va in the target area image of the lung field where no nodules are formed.
- Group D is a plot of the first reference value Ta and the maximum one-dimensional Betti number Va in the target area image of the ground glass type nodule. In this way, based on the first reference value Ta and the maximum one-dimensional Betti number Va, it is determined whether the target area image is a nodule-free lung field, a pulmonary blood vessel, a solid nodule, or a frosted glass nodule. can do.
- FIG. 12 is a diagram showing an example of the determination criterion 32.
- the determination unit 44 compares the first reference value Ta and the maximum one-dimensional Betti number Va specified for the target area image with the first reference value Ta and the maximum one-dimensional Betti number Va defined in the determination reference 32. Then, the changes occurring in the lungs are determined as described below.
- the determination unit 44 determines that the target area image is a lung without nodules. Judged as a field image.
- the target area image is an image of a frosted glass type nodule.
- the target area image is an image of a pulmonary blood vessel. Is determined.
- the target area image is an image of a solid nodule. Judge that there is.
- the display control unit 45 outputs the determination result to the display device 5 (step S6).
- the binarization unit 41 has two CT values in the range of ⁇ 1000HU to 0HU with respect to the target area image in which the CT values in the range of ⁇ 1000HU to 0HU are associated with the pixel values in the range of 0 to 255. It is drawn using a binarized image that has been binarized.
- the value of the first reference value Ta in the determination standard 32 changes depending on how the binarization unit 41 limits the range of the CT value in the target area image before the binarization process. Therefore, when limiting the range of CT values in the target area image before the binarization unit 41 performs the binarization process, it is important to align the range of CT values in the target area image.
- the image analysis device 1 generates a plurality of binarized images having different binarization reference values for the target area image such as a nodule shadow, and one-dimensional vetch for each of the binarized images. Calculate the number. Then, the image analysis device 1 specifies the binarized image having the maximum one-dimensional Betti number, and specifies the first reference value Ta and the maximum one-dimensional Betti number Va from the specified binarized image. The image analysis apparatus 1 determines whether or not the lung nodule is a lung nodule and what kind of lung nodule it is, based on the specified first reference value Ta and the maximum one-dimensional Betti number Va. With this configuration, the presence or absence of changes in the target region image in the lungs and the types of changes can be accurately determined based on the structural characteristics of the changes in the lungs.
- the lesion site in the lung can be visually recognized as an image different from the surrounding image.
- the image analysis device 1 mathematically analyzes the properties of the image of the region to be analyzed using the concept of homology, and determines the changes that have occurred in the lungs based on the analysis results. That is, the determination result by the image analysis device 1 is based on the properties of the target area image, similar to the diagnosis result by the doctor in the image diagnosis. Therefore, the image analysis device 1 can output a determination result that can be easily understood by the user. It is well known that many lesions that occur in tissues other than the lung can be visually recognized as images different from those around them.
- the image analysis apparatus 1 can determine with high accuracy the presence or absence and type of any lesion site that can be detected by image diagnosis.
- the reference value specifying unit 43 may further specify the binarized image having the maximum 0-dimensional Betti number b0 among the plurality of binarized images generated by the binarized unit 41. Then, the reference value specifying unit 43 specifies the second reference value Tb and the maximum 0-dimensional Betti number Vb (maximum number of second features).
- the second reference value Tb is the reference value for binarization in the specified binarized image.
- the maximum 0-dimensional Betti number Vb is the 0-dimensional Betti number b0 in the specified binarized image.
- the reference value specifying unit 43 may generate a graph plotting the changes in the number of 0-dimensional Betti numbers and the number of 1-dimensional Betti numbers accompanying the change in the reference value for binarization.
- the reference value specifying unit 43 can read the first reference value Ta, the maximum one-dimensional Betti number Va, the second reference value Tb, the maximum 0-dimensional Betti number Vb, and the like from the generated graph.
- the determination unit 44 determines the changes that have occurred in the lungs based on the following (1) to (4).
- FIG. 13 is a flowchart showing an example of a processing flow in the image analysis apparatus according to another aspect of the present invention.
- the image acquisition unit 2 acquires a tissue image obtained by capturing the tissue from the external device 8 (step S11).
- the binarization unit 41 extracts the target area image from the tissue image, and generates a plurality of binarized images having different reference values for binarization for the target area image (step S12: binarization step). ).
- the binarization unit 41 has two CT values in the range of ⁇ 1000HU to 0HU with respect to the target area image in which the CT values in the range of ⁇ 1000HU to 0HU are associated with the pixel values in the range of 0 to 255. It is drawn using a binarized image that has been binarized.
- the Betti number calculation unit 42 calculates the one-dimensional Betti number b1 and the zero-dimensional Betti number b0 for each of the plurality of binarized images (step S13: feature number calculation step).
- FIG. 14 is a graph plotting the change in the 0-dimensional Betti number b0 due to the change in the binarization reference value in the binarized image generated for the lung field without nodules and the region of the pulmonary blood vessel. Is. In FIG. 14, the 0-dimensional Betti number b0 for the target area image of the lung field without nodules is shown by a solid line, and the 0-dimensional Betti number b0 for the target area image of the pulmonary blood vessel is shown by a broken line. ..
- FIG. 15 shows the change in the 0-dimensional Betti number b0 due to the change of the binarization reference value in the binarized image generated for the solid nodule region and the target region image of the frosted glass nodule. It is a plotted graph.
- the 0-dimensional Betti number b0 for the target area image of the solid nodule is shown by a solid line
- the 0-dimensional Betti number b0 for the target area image of the frosted glass type nodule is shown by a broken line.
- the reference value specifying unit 43 identifies the binarized image in which the one-dimensional Betti number b1 is the maximum and the binarized image in which the zero-dimensional Betti number b0 is the maximum. Then, the reference value specifying unit 43 specifies the first reference value Ta, the maximum one-dimensional Betti number Va, the second reference value Tb, and the maximum 0-dimensional Betti number Vb for the specified binarized image (step S14: Reference value identification step).
- the determination unit 44 determines the change occurring in the lung based on the first reference value Ta, the maximum one-dimensional Betti number Va, the second reference value Tb, and the maximum 0-dimensional Betti number Vb (step S15: Judgment step).
- FIG. 16 is a graph in which the second reference value Tb and the maximum 0-dimensional Betti number Vb are plotted for each target area image.
- the combination of the second reference value Tb specified by the reference value specifying unit 43 and the maximum 0-dimensional Betti number Vb is clearly divided into four groups of groups E to H.
- the group E is a point obtained by plotting the second reference value Tb and the maximum 0-dimensional Betti number Vb in the target region image of the solid nodule.
- Group F is a plot of the second reference value Tb and the maximum 0-dimensional Betti number Vb in the target region image of the pulmonary blood vessel.
- Group G is a plot of the second reference value Tb and the maximum 0-dimensional Betti number Vb in the target area image of the lung field where no nodules have formed.
- Group H is a point obtained by plotting the second reference value Tb and the maximum 0-dimensional Betti number Vb in the target region image of the ground glass type nodule. In this way, based on the second reference value Tb and the maximum 0-dimensional Vetch number Vb, the target region image imaged any region of the lung field without nodules, pulmonary blood vessels, solid nodules, and frosted glass nodules. It is also possible to determine whether it is an image.
- the groups E to H are closer to each other than the graph shown in FIG.
- the determination unit 44 utilize the second reference value Tb and the maximum 0-dimensional Betti number Vb in addition to the first reference value Ta and the maximum one-dimensional Betti number Va specified for the target region image. With this configuration, the image analysis device 1 can further improve the accuracy of determining the change that has occurred in the lungs.
- FIG. 17 is a diagram showing another example of the determination criterion 32.
- the determination unit 44 refers to the first reference value Ta, the maximum one-dimensional Betti number Va, the second reference value Tb, and the maximum 0-dimensional Betti number Vb defined in the determination standard 32, and determines the change that has occurred in the lungs. Judgment is made for each target area image.
- the ratio of the one-dimensional Betti number b1 calculated by the Betti number calculation unit 42 to the zero-dimensional Betti number b0 may also be used to determine the change that has occurred in the lungs.
- the ratio of the one-dimensional Betti number b1 and the zero-dimensional Betti number b0 is a value (b1 / b0) obtained by dividing the one-dimensional Betti number b1 by the 0-dimensional Betti number b0 will be described as an example.
- the Betti number calculation unit 42 calculates b1 / b0 using the one-dimensional Betti number b1 and the zero-dimensional Betti number b0 calculated for each of the plurality of binarized images.
- the reference value specifying unit 43 identifies the binarized image having the maximum b1 / b0 among the plurality of binarized images generated by the binarized unit 41. Then, the reference value specifying unit 43 specifies the maximum value R of the third reference value Tc and b1 / b0.
- the third reference value is the reference value for binarization in the specified binarized image.
- the reference value specifying unit 43 may generate a graph plotting the change in the value of b1 / b0 accompanying the change in the reference value for binarization.
- the reference value specifying unit 43 can read the third reference value Tc, the maximum value R of b1 / b0, and the like from the generated graph.
- the determination unit 44 determines the changes that have occurred in the lungs based on at least two of the following (1) to (6).
- the maximum values R of the third reference values Tc and b1 / b0 in the target area images of the lung field and pulmonary blood vessels without nodules are the maximum values of the third reference values Tc and b1 / b0 in the target area images of various lung nodules. It is very different from R. Therefore, the determination unit 44 may use the maximum values R of the third reference value Tc and b1 / b0 in the target region image to determine the presence or absence of changes occurring in the lungs. Specifically, the determination unit 44 corresponds to the lung field and pulmonary blood vessels in which nodules have not occurred from the target region image based on the third reference value Tc and the maximum value R of b1 / b0 in the target region image. It is possible to remove the image to be used.
- the values of the one-dimensional Betti number b1 and the zero-dimensional Betti number b0 calculated for each target area image depend on the area of the area captured in each target area image. When the area of the captured area is different for each target area image, it is desirable that the one-dimensional Betti number b1 and the zero-dimensional Betti number b0 are calculated as values per unit area.
- the area of the region captured in the target region image may be referred to as W.
- the number of one-dimensional vetches per unit area may be described as b1 / W
- the number of zero-dimensional vetches per unit area may be described as b0 / W.
- FIG. 18 is a block diagram showing an example of the configuration of the image analysis device 1a according to one aspect of the present invention. Note that FIG. 18 also shows an external device 8 that transmits an image to the image analysis device 1a, as in FIG.
- the image analysis device 1a includes an image acquisition unit 2, a storage unit 3a, and a control unit 4a. At least the tissue image 31 and the determination criterion 32a are stored in the storage unit 3a.
- the image analysis device 1a is different from the image analysis device 1 of FIG. 1 in that it has a function of calculating the area of the area captured in the target area image.
- the binarization unit 41a extracts a target region image to be analyzed from the CT image of the lung, performs binarization processing on the target region image, and binarizes a plurality of binarizations having different reference values for binarization. Generate an image (see FIG. 7).
- the area calculation unit 46 acquires the target area image from the binarization unit 41a and calculates the area W of the area captured in the target area image.
- the area calculation unit 46 compares each target with the one-dimensional Betti number b1 and the zero-dimensional Betti number b0 calculated for the target area images having different widths of the captured area as values per unit area.
- the area W of the area image is calculated.
- the value calculated by the area calculation unit 46 is for calculating a value representing the one-dimensional vetch number b1 / W per unit area in each target area image and a value representing the zero-dimensional vetch number b0 / W per unit area. It is not limited to the area W as long as it is a value that can be used for. For example, if the area captured in the target area image is a square or a rectangle, the area calculation unit 46 may calculate, for example, the length of the diagonal line of the area instead of the area W. For example, if the area captured in the target area image is circular, the area calculation unit 46 may calculate the radius or the length of the diameter of the area instead of the area W.
- the area calculation unit 46 constitutes the target area image instead of the area of the target area image.
- the number of pixels may be calculated.
- the Betti number calculation unit 42a per unit area based on the one-dimensional Betti number b1 and the zero-dimensional Betti number b0 calculated for each target area image and the area W of the target area image acquired from the area calculation unit 46.
- the one-dimensional Betti number b1 / W and the zero-dimensional Betti number b0 / W are calculated.
- the Betti number calculation unit 42a has a one-dimensional Betti number b1 / W per unit area and a zero-dimensional Betti number b0 / W per unit area in a target area image obtained by capturing an area of an arbitrary size. Can be calculated.
- the determination unit 44a determines the change that has occurred in the lungs based on at least two of the following (1) to (6).
- first reference value Ta the reference value for binarization in the binarized image in which the number of one-dimensional Betti numbers b1 / W per unit area is maximized.
- second reference value Tb the reference value for binarization in the binarized image in which the number of 0-dimensional Betti numbers b0 / W per unit area is maximized.
- the determination unit 44a may determine the presence or absence of changes occurring in the lungs based only on the third reference value Tc calculated by the Betti number calculation unit 42a and the maximum value R of b1 / b0.
- FIG. 19 is a flowchart showing an example of the flow of processing performed by the image analysis apparatus 1a.
- the image acquisition unit 2 acquires a tissue image obtained by imaging the tissue from the external device 8 (step S21).
- the binarization unit 41a extracts the target area image from the tissue image (step S22).
- the area calculation unit 46 calculates the area W of the imaging range of the target area image extracted by the binarization unit 41a (step S23: area calculation step).
- the binarization unit 41a generates a plurality of binarized images having different reference values for binarization with respect to the target area image extracted in step S22 (step S24: binarization step).
- the binarization unit 41 has two CT values in the range of ⁇ 1000HU to 1000HU with respect to the target area image in which the CT values in the range of ⁇ 1000HU to 1000HU are associated with the pixel values in the range of 0 to 255. It is drawn using a binarized image that has been binarized. Therefore, the values of the first reference value and the second reference value are different between the graphs shown in FIGS. 20 to 25 and FIGS. 9 to 11 and 14 to 16.
- the Betti number calculation unit 42a calculates the one-dimensional Betti number b1 / W per unit area, b0 / W per unit area, and b1 / b0 for each of the plurality of binarized images (step S25). : Feature number calculation step).
- the determination unit 44a determines whether or not there is a change in the lungs based on the third reference value Tc and the maximum value R of b1 / b0 (step S26: determination step).
- the determination unit 44a does not use the first reference value Ta, the second reference value Tb, or the like. Therefore, as shown in FIG. 19, the determination unit 44a may be configured to first determine the presence or absence of changes occurring in the lungs. If such a configuration is adopted, the reference value specifying unit 43 uses the first reference value Ta and the second reference value Tb only for the target region image determined to have a change in the lung in the next step S27. And so on. As a result, the image analysis device 1a can more efficiently execute the determination process of the change occurring in the lungs.
- FIG. 20 is a graph plotting changes in b1 / b0 associated with changing the reference value for binarization in binarized images generated for the lung field without nodules and the region of pulmonary blood vessels. ..
- b1 / b0 for the target area image of the lung field without nodules is shown by a solid line
- b1 / b0 for the target area image of the pulmonary blood vessel is shown by a broken line.
- the maximum value R1 of the third reference value Tc1 and b1 / b0 of the target area image of the lung field where nodule is not generated and the third reference value Tc2 and b1 / of the target area image of the pulmonary blood vessel.
- the maximum value R2 of b0 is shown.
- FIG. 21 is a graph plotting the change in b1 / b0 accompanying the change in the reference value for binarization in the binarized image generated for the target region image in which the lung nodule is generated.
- b1 / b0 for the target region image of the solid nodule is indicated by a dash-dotted line
- b1 / b0 for the target region image of the ground glass type nodule is indicated by a broken line.
- b1 / b0 for the target region image of the mixed nodule is shown by a solid line.
- the maximum values R3 of the third reference values Tc3 and b1 / b0 of the target area image of the mixed type nodule, the maximum values R4 of the third reference values Tc4 and b1 / b0 of the target area image of the frosted glass type nodule, and The maximum values R5 of the third reference value Tc5 and b1 / b0 of the target area image of the solid nodule are shown.
- the third reference value Tc1 of the target region image of the lung field without nodules is smaller than the third reference values Tc2 to Tc5 of the other target region images. Further, the maximum value R2 of b1 / b0 of the target area image of the lung blood vessel is smaller than the maximum value R3 to R5 of b1 / b0 of the target area image of the lung nodule shown in FIG. Therefore, the determination unit 44a can determine the target area image of the lung field where no nodule is formed, the target area image of the pulmonary blood vessel, and the target area image of the lung nodule.
- the reference value specifying unit 43 has a first reference value Ta, a maximum one-dimensional Betti number Va, a second reference value Tb, a maximum 0-dimensional Betti number Vb, and a third reference value Tc for each target area image. And the maximum value R of b1 / b0 are specified (step S27: reference value specifying step).
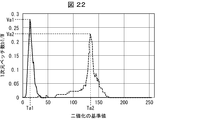
- FIG. 22 shows the one-dimensional Betti number b1 / W per unit area due to the change of the binarization reference value in the binarized image generated for the lung field without nodules and the region of the pulmonary blood vessel. It is a graph plotting the change of.
- the one-dimensional Betti number b1 / W per unit area for the target area image of the lung field without nodules is shown by a solid line, and one-dimensional per unit area for the target area image of the lung blood vessel.
- the Betti number b1 / W is indicated by a broken line.
- FIG. 22 shows the one-dimensional Betti number b1 / W per unit area due to the change of the binarization reference value in the binarized image generated for the lung field without nodules and the region of the pulmonary blood vessel. It is a graph plotting the change of.
- the one-dimensional Betti number b1 / W per unit area for the target area image of the lung field without nodules is shown by a solid line, and one
- FIG 22 shows the first reference value Ta1 and the maximum one-dimensional Betti number Va1 of the target area image of the lung field without nodules, and the first reference value Ta2 and the maximum one-dimensional Betti number of the target area image of the lung blood vessel. The number Va2 is shown.
- FIG. 23 shows a change in the one-dimensional Betti number b1 / W per unit area due to a change in the binarization reference value in the binarized image generated for the target region image in which the lung nodule is generated. It is a graph plotting.
- the one-dimensional Betti number b1 / W per unit area for the target area image of the solid knot is indicated by a alternate long and short dash line
- b1 / W is indicated by a broken line.
- the one-dimensional Betti number b1 / W per unit area for the target area image of the mixed type nodule is shown by a solid line.
- the first reference value Ta5 and the maximum one-dimensional Betti number Va5 of the target area image of the nodule are shown.
- FIG. 24 shows the number of 0-dimensional Betti numbers b0 / W per unit area due to the change of the binarization reference value in the binarized images generated for the lung field without nodules and the region of the pulmonary blood vessels. It is a graph plotting the change of.
- the 0-dimensional Betti number b0 / W per unit area for the target area image of the lung field without nodules is shown by a solid line
- the 0-dimensional Betti number per unit area for the target area image of the lung blood vessel is shown by a solid line.
- the Betti number b0 / W is indicated by a broken line.
- the second reference value Tb1 and the maximum 0-dimensional Betti number Vb1 of the target area image of the lung field without nodules, and the second reference value Tb2 and the maximum 0-dimensional Betti number of the target area image of the lung blood vessel are shown.
- Vb2 is shown.
- FIG. 25 plots the change in the 0-dimensional Betti number b0 / W per unit area due to the change in the binarization reference value in the binarized image generated for the target area image in which the lung nodule is generated. It is a graph.
- the number of 0-dimensional Betti numbers b0 / W per unit area for the target area image of the solid knot is indicated by a dash-dotted line
- b0 / W is indicated by a broken line.
- the 0-dimensional Betti number b0 / W per unit area for the target area image of the mixed type nodule is shown by a solid line.
- the second reference value Tb5 and the maximum 0-dimensional Betti number Vb5 of the target area image of the nodule are shown.
- the determination unit 44 determines the change occurring in the lungs based on at least two of the following (1) to (6) (step S28: determination step).
- FIG. 26 is a diagram showing an example of the determination criterion 32a.
- the determination unit 44 compares at least two of the above (1) to (6) specified for the target area image with the values specified in the determination criterion 32a, and determines the change that has occurred in the lungs. ..
- the determination unit 44 can determine in more detail the changes that have occurred in the lungs. For example, the determination unit 44 can discriminate between a solid nodule and a mixed nodule based on the maximum value R of b1 / b0 and the maximum one-dimensional Betti number Va / W per unit area. Further, for example, based on the maximum value R of b1 / b0 and the first reference value Ta, the determination unit 44 can discriminate between the glass type nodule and the mixed type nodule.
- the display control unit 45 outputs the determination result to the display device 5 (step S29).
- FIG. 27 is a block diagram showing an example of the configuration of the image analysis device 1b according to the fourth embodiment of the present invention.
- the image analysis device 1b is different from the image analysis device 1 shown in FIG. 1 in that the image analysis device 1b includes a communication unit 6.
- the communication unit 6 acquires display data from the display control unit 45 and displays the display data for displaying the determination result determined based on the analysis result of the tissue image indicated by the image data received from the external device 8 on the display device 5. It is transmitted to the device 5.
- the number of the external device 8 and the presentation device 5 is not limited to one, and may be a plurality.
- the image analysis device 1b is not limited to the configuration shown in FIG. 27.
- the image analysis device 1a shown in FIG. 18 may be configured by adding the communication unit 6.
- FIG. 28 is a schematic view showing a configuration example of an image analysis system 100 including an image analysis device 1b according to the present invention.
- FIG. 28 shows an example in which the external device 8 and the presenting device 7 are installed at separate locations.
- FIG. 29 is a schematic view showing a configuration example of another image analysis system 100a including the image analysis device 1b according to the present invention.
- FIG. 29 shows an example in which the presentation device 7 is connected to the external device 8a.
- the image analysis system 100 includes an external device 8, an image analysis device 1b, and a presentation device 7.
- the external device 8, the image analysis device 1b, and the presentation device 7 are connected to an information communication network 50 such as the Internet, and can transmit and receive data to and from each other.
- the external device 8 may be, for example, a personal computer connected to a CT device, or a server (electronic medical record server, CT image data server, etc.) that aggregates and manages images of tissues. ..
- the presenting device 7 may be any device having a function of presenting the result of image analysis to the user.
- the presenting device 7 is a display device including a display.
- the presentation device 7 may be a communication terminal device such as a tablet terminal carried by a medical person or the like.
- the image data of the tissue image obtained by capturing the tissue is transmitted from the external device 8 to the image analysis device 1b.
- the image analysis device 1b that has received the image data analyzes the image and transmits the determination result by the determination unit 44 to the presentation device 7 via the communication unit 6.
- the image analysis system 100a includes an external device 8a, an image analysis device 1b, and a presentation device 7.
- the external device 8a and the image analysis device 1b are connected to an information communication network 50 such as the Internet, and can transmit and receive data to and from each other.
- the presentation device 7 is connected to the external device 8a.
- the image analysis device 1b can receive the image captured at a remote location from the external device 8 or 8a, perform image analysis, and transmit the determination result by the determination unit 44 to the presentation device 7.
- the determination result may be transmitted to the presentation device 7 in association with the tissue image used for analysis.
- the presentation device 7 may be a device connected to the external device 8a, or may be a device independent of the image analysis device 1b and the external device 8.
- the image analysis systems 100 and 100a can receive the tissue image from the external devices 8 and 8a at a remote location and analyze the image, and the tissue image and the determined information can be analyzed. Can be presented to users in remote areas. Therefore, it is possible to provide highly accurate diagnostic imaging results even to users in remote areas where doctors are absent or in short supply.
- control blocks (particularly the control units 4 and 4a) of the image analysis devices 1, 1a and 1b may be realized by a logic circuit (hardware) formed in an integrated circuit (IC chip) or the like, or by software. You may.
- the image analysis devices 1, 1a, and 1b include a computer that executes a program instruction, which is software that realizes each function.
- the computer includes, for example, one or more processors and a computer-readable recording medium that stores the program. Then, in the computer, the processor reads the program from the recording medium and executes it, thereby achieving the object of the present invention.
- the processor for example, a CPU (Central Processing Unit) can be used.
- the recording medium in addition to a “non-temporary tangible medium” such as a ROM (Read Only Memory), a tape, a disk, a card, a semiconductor memory, a programmable logic circuit, or the like can be used.
- a RAM RandomAccessMemory
- the program may be supplied to the computer via an arbitrary transmission medium (communication network, broadcast wave, etc.) capable of transmitting the program.
- a transmission medium communication network, broadcast wave, etc.
- one aspect of the present invention can also be realized in the form of a data signal embedded in a carrier wave, in which the above program is embodied by electronic transmission.
Abstract
La présente invention détermine, avec une précision élevée, un changement ayant eu lieu dans un tissu. La présente invention comprend : une unité de conversion binaire (41) qui génère, à partir d'une image d'une cible d'analyse, une pluralité d'images converties en images binaires ayant différentes valeurs de référence de conversion en image binaire ; une unité de calcul de nombre de Betti (42) qui calcule, pour chacune de la pluralité d'images converties en images binaires, un nombre de Betti unidimensionnel indiquant le nombre de régions en forme de trou comprenant des pixels d'une seconde valeur de pixel entourées par des pixels d'une première valeur de pixel après avoir été rendues binaires dans la première valeur de pixel et la seconde valeur de pixel ; une unité de détermination (44) qui détermine un changement ayant eu lieu dans un tissu sur la base d'une valeur de référence de conversion en image binaire dans l'image rendue binaire dans laquelle le nombre de Betti unidimensionnel devient maximal et sur la base du nombre de nombres de Betti unidimensionnels dans l'image rendue binaire.
Priority Applications (2)
| Application Number | Priority Date | Filing Date | Title |
|---|---|---|---|
| US17/782,080 US20230005148A1 (en) | 2019-12-05 | 2020-12-04 | Image analysis method, image analysis device, image analysis system, control program, and recording medium |
| JP2021562735A JP7265805B2 (ja) | 2019-12-05 | 2020-12-04 | 画像解析方法、画像解析装置、画像解析システム、制御プログラム、記録媒体 |
Applications Claiming Priority (2)
| Application Number | Priority Date | Filing Date | Title |
|---|---|---|---|
| JP2019-220455 | 2019-12-05 | ||
| JP2019220455 | 2019-12-05 |
Publications (1)
| Publication Number | Publication Date |
|---|---|
| WO2021112205A1 true WO2021112205A1 (fr) | 2021-06-10 |
Family
ID=76221990
Family Applications (1)
| Application Number | Title | Priority Date | Filing Date |
|---|---|---|---|
| PCT/JP2020/045155 WO2021112205A1 (fr) | 2019-12-05 | 2020-12-04 | Procédé, dispositif et système d'analyse d'image, programme de commande et support d'enregistrement |
Country Status (3)
| Country | Link |
|---|---|
| US (1) | US20230005148A1 (fr) |
| JP (1) | JP7265805B2 (fr) |
| WO (1) | WO2021112205A1 (fr) |
Families Citing this family (1)
| Publication number | Priority date | Publication date | Assignee | Title |
|---|---|---|---|---|
| CN116664413B (zh) * | 2023-03-27 | 2024-02-02 | 北京拙河科技有限公司 | 一种基于阿贝尔收敛算子的图像体积雾消除方法及装置 |
Citations (7)
| Publication number | Priority date | Publication date | Assignee | Title |
|---|---|---|---|---|
| JP2004041617A (ja) * | 2001-08-06 | 2004-02-12 | Aloka Co Ltd | 超音波診断装置 |
| WO2010087112A1 (fr) * | 2009-01-27 | 2010-08-05 | 国立大学法人大阪大学 | Appareil d'analyse d'image, procédé d'analyse d'image, programme d'analyse d'image et support d'enregistrement |
| WO2017010397A1 (fr) * | 2015-07-15 | 2017-01-19 | 国立大学法人大阪大学 | Dispositif d'analyse d'image, procédé d'analyse d'image, système d'analyse d'image, programme d'analyse d'image et support d'enregistrement |
| WO2019102829A1 (fr) * | 2017-11-24 | 2019-05-31 | 国立大学法人大阪大学 | Procédé d'analyse d'image, dispositif d'analyse d'image, système d'analyse d'image, programme d'analyse d'image et support d'enregistrement |
| WO2020067481A1 (fr) * | 2018-09-28 | 2020-04-02 | 国立大学法人東北大学 | Dispositif d'analyse d'image, système d'analyse d'image, procédé d'analyse d'image, programme informatique et support d'enregistrement non transitoire |
| WO2020195258A1 (fr) * | 2019-03-26 | 2020-10-01 | 国立大学法人大阪大学 | Procédé d'analyse d'image, programme d'analyse d'image, support d'enregistrement, dispositif d'analyse d'image et système d'analyse d'image |
| WO2020241178A1 (fr) * | 2019-05-29 | 2020-12-03 | 国立大学法人九州大学 | Dispositif d'évaluation du cancer du poumon et procédé d'évaluation du cancer du poumon |
-
2020
- 2020-12-04 JP JP2021562735A patent/JP7265805B2/ja active Active
- 2020-12-04 US US17/782,080 patent/US20230005148A1/en active Pending
- 2020-12-04 WO PCT/JP2020/045155 patent/WO2021112205A1/fr active Application Filing
Patent Citations (7)
| Publication number | Priority date | Publication date | Assignee | Title |
|---|---|---|---|---|
| JP2004041617A (ja) * | 2001-08-06 | 2004-02-12 | Aloka Co Ltd | 超音波診断装置 |
| WO2010087112A1 (fr) * | 2009-01-27 | 2010-08-05 | 国立大学法人大阪大学 | Appareil d'analyse d'image, procédé d'analyse d'image, programme d'analyse d'image et support d'enregistrement |
| WO2017010397A1 (fr) * | 2015-07-15 | 2017-01-19 | 国立大学法人大阪大学 | Dispositif d'analyse d'image, procédé d'analyse d'image, système d'analyse d'image, programme d'analyse d'image et support d'enregistrement |
| WO2019102829A1 (fr) * | 2017-11-24 | 2019-05-31 | 国立大学法人大阪大学 | Procédé d'analyse d'image, dispositif d'analyse d'image, système d'analyse d'image, programme d'analyse d'image et support d'enregistrement |
| WO2020067481A1 (fr) * | 2018-09-28 | 2020-04-02 | 国立大学法人東北大学 | Dispositif d'analyse d'image, système d'analyse d'image, procédé d'analyse d'image, programme informatique et support d'enregistrement non transitoire |
| WO2020195258A1 (fr) * | 2019-03-26 | 2020-10-01 | 国立大学法人大阪大学 | Procédé d'analyse d'image, programme d'analyse d'image, support d'enregistrement, dispositif d'analyse d'image et système d'analyse d'image |
| WO2020241178A1 (fr) * | 2019-05-29 | 2020-12-03 | 国立大学法人九州大学 | Dispositif d'évaluation du cancer du poumon et procédé d'évaluation du cancer du poumon |
Also Published As
| Publication number | Publication date |
|---|---|
| JPWO2021112205A1 (fr) | 2021-06-10 |
| US20230005148A1 (en) | 2023-01-05 |
| JP7265805B2 (ja) | 2023-04-27 |
Similar Documents
| Publication | Publication Date | Title |
|---|---|---|
| Elyan et al. | Computer vision and machine learning for medical image analysis: recent advances, challenges, and way forward. | |
| US9532762B2 (en) | Apparatus and method for lesion detection | |
| CN105701331B (zh) | 计算机辅助诊断设备和计算机辅助诊断方法 | |
| US10198668B2 (en) | Apparatus and method for supporting computer aided diagnosis (CAD) based on probe speed | |
| US8270688B2 (en) | Method for intelligent qualitative and quantitative analysis assisting digital or digitized radiography softcopy reading | |
| KR101968144B1 (ko) | 척추 및 경추의 경사각 자동 진단 장치 및 방법 | |
| US10872408B2 (en) | Method and system for imaging and analysis of anatomical features | |
| US11321841B2 (en) | Image analysis method, image analysis device, image analysis system, and storage medium | |
| WO2012073769A1 (fr) | Dispositif de traitement d'image et procédé de traitement d'image | |
| US20190125306A1 (en) | Method of transmitting a medical image, and a medical imaging apparatus performing the method | |
| CN111080583B (zh) | 医学图像检测方法、计算机设备和可读存储介质 | |
| Wallis et al. | Clever Hans effect found in a widely used brain tumour MRI dataset | |
| KR20200120311A (ko) | 의료 영상을 이용한 암의 병기 결정 방법 및 의료 영상 분석 장치 | |
| WO2021112205A1 (fr) | Procédé, dispositif et système d'analyse d'image, programme de commande et support d'enregistrement | |
| JP6564075B2 (ja) | 医用画像を表示するための伝達関数の選択 | |
| KR20150141831A (ko) | 의료 영상 분석 장치 및 이의 폐결절과 폐혈관 구분 방법 | |
| WO2019146358A1 (fr) | Système, procédé et programme d'apprentissage | |
| JP2006325640A (ja) | 異常陰影候補の表示方法及び医用画像処理システム | |
| CN112862752A (zh) | 一种图像处理显示方法、系统电子设备及存储介质 | |
| KR20160115269A (ko) | 건강검진 정보 제공 애플리케이션 및 시스템 | |
| KR102564437B1 (ko) | 딥러닝 모델을 이용한 안면골 골절 검출 시스템 | |
| KR102632864B1 (ko) | 의미론적 분할을 이용한 3차원 골절 골편 분할 시스템 및 그 방법 | |
| KR102517232B1 (ko) | 머신러닝 기반의 의료 영상에 대한 반사광 제거 방법 및 이를 이용한 장치 | |
| EP4343780A1 (fr) | Appareil, procédé et programme de traitement d'informations | |
| US20240081728A1 (en) | Image-based approach to evaluate connective tissue structure, remodeling, and risk of injury |
Legal Events
| Date | Code | Title | Description |
|---|---|---|---|
| 121 | Ep: the epo has been informed by wipo that ep was designated in this application |
Ref document number: 20897574 Country of ref document: EP Kind code of ref document: A1 |
|
| ENP | Entry into the national phase |
Ref document number: 2021562735 Country of ref document: JP Kind code of ref document: A |
|
| NENP | Non-entry into the national phase |
Ref country code: DE |
|
| 122 | Ep: pct application non-entry in european phase |
Ref document number: 20897574 Country of ref document: EP Kind code of ref document: A1 |