WO2020195258A1 - Procédé d'analyse d'image, programme d'analyse d'image, support d'enregistrement, dispositif d'analyse d'image et système d'analyse d'image - Google Patents
Procédé d'analyse d'image, programme d'analyse d'image, support d'enregistrement, dispositif d'analyse d'image et système d'analyse d'image Download PDFInfo
- Publication number
- WO2020195258A1 WO2020195258A1 PCT/JP2020/005213 JP2020005213W WO2020195258A1 WO 2020195258 A1 WO2020195258 A1 WO 2020195258A1 JP 2020005213 W JP2020005213 W JP 2020005213W WO 2020195258 A1 WO2020195258 A1 WO 2020195258A1
- Authority
- WO
- WIPO (PCT)
- Prior art keywords
- image
- image analysis
- binarization
- cancer
- cell
- Prior art date
Links
- 238000010191 image analysis Methods 0.000 title claims abstract description 78
- 238000003703 image analysis method Methods 0.000 title claims description 15
- 206010028980 Neoplasm Diseases 0.000 claims abstract description 130
- 201000011510 cancer Diseases 0.000 claims abstract description 130
- 238000000034 method Methods 0.000 claims abstract description 47
- 230000008569 process Effects 0.000 claims abstract description 35
- 238000004364 calculation method Methods 0.000 claims abstract description 32
- 210000003855 cell nucleus Anatomy 0.000 claims description 162
- 210000004027 cell Anatomy 0.000 claims description 137
- 210000001519 tissue Anatomy 0.000 claims description 76
- 238000000605 extraction Methods 0.000 claims description 6
- 108010077544 Chromatin Proteins 0.000 description 68
- 210000003483 chromatin Anatomy 0.000 description 68
- 208000000649 small cell carcinoma Diseases 0.000 description 16
- 238000003384 imaging method Methods 0.000 description 14
- 238000004458 analytical method Methods 0.000 description 13
- 238000003860 storage Methods 0.000 description 13
- 238000010586 diagram Methods 0.000 description 12
- 206010041823 squamous cell carcinoma Diseases 0.000 description 10
- 239000008187 granular material Substances 0.000 description 9
- 208000009956 adenocarcinoma Diseases 0.000 description 8
- 238000012545 processing Methods 0.000 description 8
- 238000007447 staining method Methods 0.000 description 8
- 230000006870 function Effects 0.000 description 7
- WZUVPPKBWHMQCE-UHFFFAOYSA-N Haematoxylin Chemical compound C12=CC(O)=C(O)C=C2CC2(O)C1C1=CC=C(O)C(O)=C1OC2 WZUVPPKBWHMQCE-UHFFFAOYSA-N 0.000 description 6
- 206010058467 Lung neoplasm malignant Diseases 0.000 description 6
- 230000005540 biological transmission Effects 0.000 description 6
- 201000005202 lung cancer Diseases 0.000 description 6
- 208000020816 lung neoplasm Diseases 0.000 description 6
- 210000000805 cytoplasm Anatomy 0.000 description 5
- 238000009826 distribution Methods 0.000 description 5
- 239000000284 extract Substances 0.000 description 5
- 230000000877 morphologic effect Effects 0.000 description 5
- 238000010186 staining Methods 0.000 description 5
- 238000004891 communication Methods 0.000 description 4
- 230000000052 comparative effect Effects 0.000 description 4
- 238000012937 correction Methods 0.000 description 4
- 206010036790 Productive cough Diseases 0.000 description 3
- 230000002776 aggregation Effects 0.000 description 3
- 238000003745 diagnosis Methods 0.000 description 3
- 230000003902 lesion Effects 0.000 description 3
- 210000004072 lung Anatomy 0.000 description 3
- 230000003287 optical effect Effects 0.000 description 3
- 210000003802 sputum Anatomy 0.000 description 3
- 208000024794 sputum Diseases 0.000 description 3
- 238000011282 treatment Methods 0.000 description 3
- 238000004220 aggregation Methods 0.000 description 2
- 230000008859 change Effects 0.000 description 2
- 238000001514 detection method Methods 0.000 description 2
- 239000011521 glass Substances 0.000 description 2
- 230000003993 interaction Effects 0.000 description 2
- 210000004185 liver Anatomy 0.000 description 2
- 238000010827 pathological analysis Methods 0.000 description 2
- 230000001575 pathological effect Effects 0.000 description 2
- 230000002085 persistent effect Effects 0.000 description 2
- MPVDXIMFBOLMNW-ISLYRVAYSA-N 7-hydroxy-8-[(E)-phenyldiazenyl]naphthalene-1,3-disulfonic acid Chemical compound OC1=CC=C2C=C(S(O)(=O)=O)C=C(S(O)(=O)=O)C2=C1\N=N\C1=CC=CC=C1 MPVDXIMFBOLMNW-ISLYRVAYSA-N 0.000 description 1
- 206010005003 Bladder cancer Diseases 0.000 description 1
- 206010006187 Breast cancer Diseases 0.000 description 1
- 208000026310 Breast neoplasm Diseases 0.000 description 1
- 206010008342 Cervix carcinoma Diseases 0.000 description 1
- LFQSCWFLJHTTHZ-UHFFFAOYSA-N Ethanol Chemical compound CCO LFQSCWFLJHTTHZ-UHFFFAOYSA-N 0.000 description 1
- 241000206602 Eukaryota Species 0.000 description 1
- 206010061998 Hepatic lesion Diseases 0.000 description 1
- 108010033040 Histones Proteins 0.000 description 1
- 102000006947 Histones Human genes 0.000 description 1
- 235000000177 Indigofera tinctoria Nutrition 0.000 description 1
- 206010025323 Lymphomas Diseases 0.000 description 1
- 206010033128 Ovarian cancer Diseases 0.000 description 1
- 206010061535 Ovarian neoplasm Diseases 0.000 description 1
- 206010061902 Pancreatic neoplasm Diseases 0.000 description 1
- 206010060862 Prostate cancer Diseases 0.000 description 1
- 208000000236 Prostatic Neoplasms Diseases 0.000 description 1
- 208000005718 Stomach Neoplasms Diseases 0.000 description 1
- 208000024770 Thyroid neoplasm Diseases 0.000 description 1
- 208000007097 Urinary Bladder Neoplasms Diseases 0.000 description 1
- 208000006105 Uterine Cervical Neoplasms Diseases 0.000 description 1
- 238000005054 agglomeration Methods 0.000 description 1
- 238000001574 biopsy Methods 0.000 description 1
- 230000015572 biosynthetic process Effects 0.000 description 1
- 230000015556 catabolic process Effects 0.000 description 1
- 230000022131 cell cycle Effects 0.000 description 1
- 201000010881 cervical cancer Diseases 0.000 description 1
- 238000006243 chemical reaction Methods 0.000 description 1
- 208000006990 cholangiocarcinoma Diseases 0.000 description 1
- 239000003086 colorant Substances 0.000 description 1
- 230000001086 cytosolic effect Effects 0.000 description 1
- 230000007423 decrease Effects 0.000 description 1
- 238000002059 diagnostic imaging Methods 0.000 description 1
- 230000000694 effects Effects 0.000 description 1
- 238000005516 engineering process Methods 0.000 description 1
- YQGOJNYOYNNSMM-UHFFFAOYSA-N eosin Chemical compound [Na+].OC(=O)C1=CC=CC=C1C1=C2C=C(Br)C(=O)C(Br)=C2OC2=C(Br)C(O)=C(Br)C=C21 YQGOJNYOYNNSMM-UHFFFAOYSA-N 0.000 description 1
- 239000012530 fluid Substances 0.000 description 1
- 206010017758 gastric cancer Diseases 0.000 description 1
- 229940097275 indigo Drugs 0.000 description 1
- COHYTHOBJLSHDF-UHFFFAOYSA-N indigo powder Natural products N1C2=CC=CC=C2C(=O)C1=C1C(=O)C2=CC=CC=C2N1 COHYTHOBJLSHDF-UHFFFAOYSA-N 0.000 description 1
- 238000007689 inspection Methods 0.000 description 1
- 230000016507 interphase Effects 0.000 description 1
- 239000004973 liquid crystal related substance Substances 0.000 description 1
- 208000015486 malignant pancreatic neoplasm Diseases 0.000 description 1
- 238000001000 micrograph Methods 0.000 description 1
- 239000003595 mist Substances 0.000 description 1
- 238000012986 modification Methods 0.000 description 1
- 230000004048 modification Effects 0.000 description 1
- 230000008520 organization Effects 0.000 description 1
- 201000002528 pancreatic cancer Diseases 0.000 description 1
- 208000008443 pancreatic carcinoma Diseases 0.000 description 1
- 239000000049 pigment Substances 0.000 description 1
- 238000002360 preparation method Methods 0.000 description 1
- 108090000623 proteins and genes Proteins 0.000 description 1
- 238000007790 scraping Methods 0.000 description 1
- 239000004065 semiconductor Substances 0.000 description 1
- 238000000926 separation method Methods 0.000 description 1
- 208000017572 squamous cell neoplasm Diseases 0.000 description 1
- 201000011549 stomach cancer Diseases 0.000 description 1
- 239000000126 substance Substances 0.000 description 1
- 201000002510 thyroid cancer Diseases 0.000 description 1
- 201000005112 urinary bladder cancer Diseases 0.000 description 1
Images


Classifications
-
- G—PHYSICS
- G06—COMPUTING; CALCULATING OR COUNTING
- G06T—IMAGE DATA PROCESSING OR GENERATION, IN GENERAL
- G06T7/00—Image analysis
- G06T7/0002—Inspection of images, e.g. flaw detection
- G06T7/0012—Biomedical image inspection
-
- G—PHYSICS
- G06—COMPUTING; CALCULATING OR COUNTING
- G06T—IMAGE DATA PROCESSING OR GENERATION, IN GENERAL
- G06T7/00—Image analysis
- G06T7/10—Segmentation; Edge detection
- G06T7/11—Region-based segmentation
-
- G—PHYSICS
- G06—COMPUTING; CALCULATING OR COUNTING
- G06T—IMAGE DATA PROCESSING OR GENERATION, IN GENERAL
- G06T7/00—Image analysis
- G06T7/10—Segmentation; Edge detection
- G06T7/136—Segmentation; Edge detection involving thresholding
-
- G—PHYSICS
- G06—COMPUTING; CALCULATING OR COUNTING
- G06T—IMAGE DATA PROCESSING OR GENERATION, IN GENERAL
- G06T7/00—Image analysis
- G06T7/10—Segmentation; Edge detection
- G06T7/194—Segmentation; Edge detection involving foreground-background segmentation
-
- G—PHYSICS
- G16—INFORMATION AND COMMUNICATION TECHNOLOGY [ICT] SPECIALLY ADAPTED FOR SPECIFIC APPLICATION FIELDS
- G16H—HEALTHCARE INFORMATICS, i.e. INFORMATION AND COMMUNICATION TECHNOLOGY [ICT] SPECIALLY ADAPTED FOR THE HANDLING OR PROCESSING OF MEDICAL OR HEALTHCARE DATA
- G16H30/00—ICT specially adapted for the handling or processing of medical images
- G16H30/40—ICT specially adapted for the handling or processing of medical images for processing medical images, e.g. editing
-
- G—PHYSICS
- G16—INFORMATION AND COMMUNICATION TECHNOLOGY [ICT] SPECIALLY ADAPTED FOR SPECIFIC APPLICATION FIELDS
- G16H—HEALTHCARE INFORMATICS, i.e. INFORMATION AND COMMUNICATION TECHNOLOGY [ICT] SPECIALLY ADAPTED FOR THE HANDLING OR PROCESSING OF MEDICAL OR HEALTHCARE DATA
- G16H50/00—ICT specially adapted for medical diagnosis, medical simulation or medical data mining; ICT specially adapted for detecting, monitoring or modelling epidemics or pandemics
- G16H50/80—ICT specially adapted for medical diagnosis, medical simulation or medical data mining; ICT specially adapted for detecting, monitoring or modelling epidemics or pandemics for detecting, monitoring or modelling epidemics or pandemics, e.g. flu
-
- G—PHYSICS
- G06—COMPUTING; CALCULATING OR COUNTING
- G06T—IMAGE DATA PROCESSING OR GENERATION, IN GENERAL
- G06T2207/00—Indexing scheme for image analysis or image enhancement
- G06T2207/10—Image acquisition modality
- G06T2207/10056—Microscopic image
-
- G—PHYSICS
- G06—COMPUTING; CALCULATING OR COUNTING
- G06T—IMAGE DATA PROCESSING OR GENERATION, IN GENERAL
- G06T2207/00—Indexing scheme for image analysis or image enhancement
- G06T2207/30—Subject of image; Context of image processing
- G06T2207/30004—Biomedical image processing
- G06T2207/30024—Cell structures in vitro; Tissue sections in vitro
-
- G—PHYSICS
- G06—COMPUTING; CALCULATING OR COUNTING
- G06T—IMAGE DATA PROCESSING OR GENERATION, IN GENERAL
- G06T2207/00—Indexing scheme for image analysis or image enhancement
- G06T2207/30—Subject of image; Context of image processing
- G06T2207/30004—Biomedical image processing
- G06T2207/30096—Tumor; Lesion
Definitions
- the present invention relates to an image analysis method, an image analysis device, an image analysis system, and the like for discriminating cancerous cells by analyzing an image obtained by imaging a tissue.
- Patent Document 1 discloses an image analysis device that extracts a cancerous lesion based on a pathological image.
- the image analysis apparatus described in Patent Document 1 determines whether or not each region is a region of interest (for example, a region including a cancer lesion) by calculating homology per unit area in a pathological image for each region. To do.
- Non-Patent Document 1 describes a method of classifying liver lesions by analyzing an image of a liver by applying the concept of persistent homology.
- cancer cells classified as small cell carcinoma progress rapidly and require prompt diagnosis and treatment.
- cancer cells show an increase in the amount of chromatin in the cell nucleus, so in conventional cancer diagnosis, the increase in the amount of chromatin in the cell nucleus is one of the indicators of cancer.
- chromatin is distributed three-dimensionally in the cell nucleus, in order to detect the increase in the amount of chromatin in the cell as a three-dimensional image, a plurality of captured images taken by changing the focus are acquired. I needed it. However, it has been troublesome for a laboratory technician, a pathologist, and the like to acquire a plurality of captured images with different focal points.
- One aspect of the present invention is to analyze an image of a cell sample to more easily determine whether or not the cells shown in the image are cancerous, the type of cancer, and the like.
- the image analysis method is a method of analyzing an image captured by imaging a tissue, and is a reference value for binarization of one image captured. For each of the binarization step of generating a plurality of binarized images and the plurality of binarized images generated in the above binarization step by performing the binarization process a plurality of times while differentiating the above.
- the structure is based on the area number calculation process for calculating the number of regions, which is the number of hole-shaped regions, and the reference value for binarization of the binarized image when the number of regions matches a predetermined value. Includes a determination step of determining the type of cancer of the cells contained in.
- the image analysis device is an image analysis device that analyzes an image captured by imaging a tissue, and binarizes one image captured.
- a hole-shaped region for each of the binarization unit that generates a plurality of binarized images and the generated plurality of binarized images by performing the binarization process a plurality of times while making the reference values different.
- the cells contained in the tissue based on the region number calculation unit for calculating the number of regions, which is the number of regions, and the reference value for binarization of the binarized image when the number of regions matches a predetermined value. It is provided with a cancer determination unit for determining the type of cancer.
- the present invention by analyzing an image of a cell sample, it is possible to more easily determine whether or not the cells shown in the image are cancerous, the type of cancer, and the like.
- An object of the present invention is to determine the type of cancer of the tissue shown in the captured image by analyzing the captured image of the tissue.
- the inventor of the present invention examined the captured images of the sample of the cell sample stained by the predetermined staining method, and compared and examined the following (1) to (3) in detail.
- the "cell sample” may be a sample containing cells collected from the tissue of the subject, or may be a sample containing cells released or detached from the tissue of the subject.
- the inventor of the present invention performed a plurality of binarization treatments on the captured image of the cell nucleus while making the reference value for binarization different. Then, the inventor of the present invention describes the changed reference value of binarization and the zero-dimensional Betti number 0 and the one-dimensional Betti number indicated by the image of the tissue contained in the image binarized using the reference value. The relationship with b1 was investigated. As a result, the inventor of the present invention determines whether or not the cell is cancerous and the type of cancer as 0-dimensional Betti number 0 and 1-dimensional Betti number b1 indicated by the image of the tissue contained in the binarized image. It was found that it is possible to make a judgment based on the relationship of.
- cancerous cells include an increase in the size of the cell nucleus and an increase in the amount of chromatin.
- the increase in the amount of chromatin is intended to be a state in which the amount of chromatin is higher than that in the interphase of normal cells (that is, the G1-S phase-G2 phase).
- Chromatin is a substance that exists in the cell nucleus of eukaryotes and stains well with basic pigments. Chromatin is a complex mainly composed of DNA and histones. Further, it is known that chromatin undergoes major structural changes such as aggregation and deaggregation depending on the cell cycle and the active state of genes.
- the Papanicolaou staining method is a method of staining the cell nucleus and cytoplasm.
- the Papanicolaou staining method first, cells smeared on a glass surface (for example, a slide glass) are moistened with alcohol before they are dried, and the cell nuclei are stained with hematoxylin. The cytoplasm is then stained with eosin, orange G, or light green. Chromatin is stained more intensely indigo with hematoxylin than other molecules in the cell nucleus.
- the image of chromatin is confirmed as a state in which dark-colored fine granules, coarse granules, or a large number of granules are aggregated.
- nucleoli are also heavily stained with hematoxylin.
- the increase in the amount of chromatin is the size and number of each granule (image of chromatin) in the captured image showing the cell nucleus, and the degree of aggregation in the state where many granules are aggregated (image of chromatin). Can be evaluated by. For example, it is determined that the amount of chromatin is increased when (1) the diameter of the granules is large, (2) the number of granules in the cell nucleus is large, and (3) the agglomeration of the granules is large. ..
- the captured image obtained by capturing the specimen of the cell sample is represented as a two-dimensional light-dark pattern, it is not possible to accurately grasp the three-dimensional existence state of chromatin in the cell nucleus from the captured image.
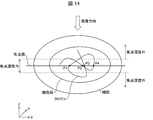
- FIG. 14 is a conceptual diagram illustrating the relationship between the state of chromatin in the cell nucleus and the captured image. Note that FIG. 14 is a cross-sectional view showing a cross section of a cell imaged from the positive side of the Z axis cut along a plane including the Z axis.
- chromatin in the cell nucleus is considered to be linear and is three-dimensionally distributed in the cell nucleus.
- the images corresponding to the positions P1 to P4 on the focal plane of chromatin are captured as high-contrast and clear images in the captured image.
- the focal plane is intended to be a plane that passes through the focal point of the optical system used for imaging and is perpendicular to the optical axis of the optical system. Further, the contrast of the chromatin images existing in the front side and the back side of the focal plane in the depth of focus is lower than that of the images corresponding to the positions P1 to P4.
- the chromatin image that exists further away from the focal plane becomes blurry and looks like a thin mist, making it difficult to distinguish it from a cytoplasmic image or the like.
- high contrast is intended to mean that the difference in brightness between the chromatin image and the surrounding image in which chromatin does not exist is large.
- a stained chromatin image becomes clearer and darker as the contrast increases, compared to a background image such as the cytoplasm.
- the stained chromatin image loses its brightness difference from the background image such as cytoplasm.
- the inventors focused on the above relationship between depth of focus and contrast.
- the inventors can read information on the existence state of chromatin three-dimensionally distributed in the cell nucleus by mathematically analyzing a binarized image obtained by binarizing the pixel value related to the brightness of the captured image. Found that is possible.
- FIG. 14 if the chromatin is linearly dispersed three-dimensionally, it is considered that the chromatin in the cell nucleus exists in an interlaced and entangled state like entangled yarn.
- the degree of chromatin density and the degree of interlacing increase. Since the degree of chromatin density and the degree of crossover within the depth of focus can be evaluated by mathematically analyzing the binarized images, it is necessary to acquire a plurality of captured images taken by changing the focus. There is no.
- ⁇ Mathematical expression for evaluating the amount of chromatin in the cell nucleus In order to evaluate the increase in the amount of chromatin in the cell nucleus based on the degree of chromatin crossing, the inventors of the present invention attempted to apply the concept of homology, particularly persistent homology. Homology is a field of mathematics that algebraically replaces the morphological properties of figures to facilitate analysis such as the combination of figures. The inventors of the present invention paid attention to the use of the 0-dimensional Betti number b0 and the 1-dimensional Betti number b1 in the concept of homology.
- the concept of homology is a mathematical concept that represents the contact of components.
- the Betti number is a topological feature quantity that is irrelevant to the shape of a figure (component) and is related only to the contact and separation of the figure.
- this q-th order singular homology group is divided into the direct sum of the free abelian group and the finite abelian group.
- the class of this free abelian group is called the Betti number.
- the 0-dimensional Betti number b0 is the number of connected components
- the one-dimensional Betti number b1 is the number of spaces (hole-shaped regions) surrounded by the connected components as the outer edge, that is, connected. The number of "holes" present in the component.
- the zero-dimensional Betti number b0 is mathematically defined as follows. Generally, the number of connected components of a figure (also called a one-dimensional complex) K formed by connecting a finite number of line segments is called a 0-dimensional Betti number b0. "A figure connecting a finite number of points with a finite number of line segments is a concatenation" means that it is possible to reach any other vertex of this figure by tracing the sides of this figure. To do.
- the 0-dimensional Betti number b0 counted per cell nucleus in the binarized image reflects the number of granules showing the distribution of chromatin in the cell nucleus. Therefore, it is considered that the 0-dimensional Betti number b0 counted per cell nucleus in the binarized image increases as the amount of chromatin three-dimensionally dispersed in the cell nucleus increases.
- the one-dimensional Betti number b1 is mathematically defined as follows. In general, for a figure (one-dimensional complex) K formed by connecting a finite number of line segments, when both ends of the side e of K have different vertices, the operation of removing the side e and making the points at both ends one is performed. Called retraction. Let K'be the figure obtained by manipulating each side of the figure K where this retraction is possible. The number of sides of this K'is b1.
- FIG. 2 is a diagram illustrating a Betti number applicable to the image analysis apparatus 1 according to the present invention.
- the ring C1 and the ring C2 intersect each other.
- the number of "holes" that this figure has is three.
- the one-dimensional Betti number b1 of this figure is calculated to be 3. That is, calculating the one-dimensional Betti number b1 for a certain figure is equivalent to counting the number of "holes" that the figure has.
- the one-dimensional Betti number b1 counted per cell nucleus in the binarized image reflects the number of closed spaces created when the three-dimensional chromatin crossing state in the cell nucleus is projected onto a plane. Therefore, the one-dimensional Betti number b1 counted per cell nucleus in the binarized image increases as the amount of chromatin three-dimensionally dispersed in the cell nucleus increases and the degree of crossing with each other increases. ,it is conceivable that.
- an image analyzer 1 for determining whether or not a cell is a lung cancer cell and a type of lung cancer will be described as an example, but the analysis target of the present invention is that the amount of chromatin in the cell nucleus is increased due to canceration. It is applicable to the determination of cancer of the tissue and cells found and is not limited to lung cancer.
- the image analyzer 1 is applied to determine various types of cancer such as lung cancer, prostate cancer, bladder cancer, breast cancer, thyroid cancer, ovarian cancer, cervical cancer, gastric cancer, pancreatic cancer, cholangiocarcinoma, and malignant lymphoma. Can be done.
- the cell sample need not depend on the collection method as long as the cell nucleus can be observed.
- images of sputum specimens, intratracheal sputum specimens, transtracheal suction sputum specimens, bronchial scraping specimens, bronchial biopsy forceps lavage fluid, mass stamping specimens, and mass puncture specimens are imaged. It is possible to apply an image.
- a configuration may be used in which only one of them is calculated and used.
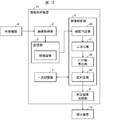
- FIG. 1 is a block diagram showing an example of the configuration of the image analysis device 1 according to the first embodiment of the present invention.
- the image analysis device 1 includes an image acquisition unit 2, a storage unit 3, an image analysis unit 4, a display control unit 5, and a primary storage unit 7.
- An example in which the image analysis device 1 is connected to a display device 6 provided as a separate body is shown, but the present invention is not limited to this.
- the image analysis device 1 may have a built-in display device 6, or may be wirelessly / wiredly connected to a plurality of display devices 6.
- the image acquisition unit 2 acquires an captured image (hereinafter referred to as a tissue image) obtained by imaging the tissue from the external device 8, and stores the acquired tissue image in the storage unit 3.
- the external device 8 may be, for example, an image pickup device connected to a microscope, a server that stores and manages image data, and the like.
- the tissue image is an image obtained by capturing the tissue at an appropriate magnification.
- the imaging magnification of the tissue image is preferably 1000 times. However, the imaging magnification of the tissue image may be appropriately set by a person skilled in the art according to the tissue to be analyzed, the number of pixels of the tissue image, and the like.
- the method for staining the tissue may be any staining method to which any staining method capable of staining chromatin is applied.
- any staining method capable of staining chromatin for example, the above-mentioned Papanicolaou staining method, HE (Hematoxylin-Eosin) staining method, and the like can be used.
- HE Hematoxylin-Eosin staining method
- these staining methods are used, the cell nucleus and cytoplasm are stained with different colors, and the chromatin is deeply stained, so that it is suitable for observing the chromatin in the cell nucleus.
- the storage unit 3 is executed by the image analysis unit 4 together with the tissue image acquired by the image acquisition unit 2 (1) a control program of each unit, (2) an OS program, (3) an application program, and (4) these programs. It records various data to be read when executing.
- the storage unit 3 is composed of a non-volatile storage device such as a hard disk or a flash memory.
- the primary storage unit 7 is used as a work area for temporarily holding data in the process of executing the above-mentioned various programs, and is composed of a volatile storage device such as a RAM (Random Access Memory). To.
- the display control unit 5 displays information including the analysis result output from the image analysis unit 4 on the display device 6.
- the display device 6 is a display device that displays information including analysis results output from the image analysis unit 4, and is, for example, a liquid crystal display.
- the image analysis device 1 may be configured to include a dedicated display device 6.
- the touch sensor may be superimposed on the display screen of the display device 6, and the display device 6 may detect a touch operation on the display surface by the user.
- the image analysis unit 4 analyzes the tissue image acquired by the image acquisition unit 2 to determine whether or not the cells contained in the tissue image are cancerous and the type of cancer.
- the image analysis unit 4 includes an image quality determination unit 40, a binarization unit 41, a Betti number calculation unit 42 (region number calculation unit), and a cancer determination unit 43.
- the image quality determination unit 40 determines whether or not the tissue image is suitable as an analysis target. Specifically, the image quality determination unit 40 reads a tissue image from the storage unit 3 and analyzes the frequency distribution of pixel values related to the brightness of all the pixels included in the tissue image. The image quality determination unit 40 determines that the tissue image is appropriate when a plurality of maximum pixel values do not exist in the frequency distribution of pixel values related to lightness and the values are within a predetermined range. The tissue image determined to be appropriate by the image quality determination unit 40 is the analysis target of the image analysis unit 4.
- FIG. 1 illustrates a configuration in which the image quality determination unit 40 extracts a tissue image from the storage unit 3, but the present invention is not limited to this.
- the structure may be such that the tissue image to be analyzed acquired by the image acquisition unit 2 is output to the image quality determination unit 40 without being stored in the storage unit 3.
- the binarization unit 41 performs a binarization process on the standardized cell nucleus image.
- the binarization process is, for example, converting a pixel having a pixel value larger than the binarization reference value into a white pixel, and converting a pixel having a pixel value equal to or less than the binarization reference value into a black pixel. This is a process of converting to pixels.
- the binarization unit 41 generates a plurality of binarized images by performing the binarization process a plurality of times while changing the binarization reference value for the image of one cell nucleus.
- the binarization unit 41 may have a known image recognition function (or image detection function), and may be configured to automatically extract an image of a cell nucleus based on a pixel value indicating the brightness of a tissue image. ..
- the present invention is not limited to this, and an inspection engineer or a medical person who uses the image analysis apparatus 1 may be allowed to select an image of the cell nucleus.
- the tissue image may be displayed on the display screen of the display unit provided in the computer used by the examination technician and the medical personnel, and the selection of the cell nucleus image by the examination engineer and the medical personnel may be accepted.
- the Betch number calculation unit 42 connects a plurality of binarized images generated by the binarization unit 41 with pixels (1) having a pixel value of 0 after binarization included in the binarized image. Number of connected regions (2) The number of hole-shaped regions (number of regions) surrounded by pixels whose binary pixel value is 0 is calculated. That is, the Betti number calculation unit 42 calculates the 0-dimensional Betti number b0 and the 1-dimensional Betti number b1 for the image of the tissue included in each of the plurality of binarized images.
- the above-mentioned connected area is an area in which black pixels are gathered adjacent to each other in a binarized image.
- Each connecting region is surrounded by white pixels and is visually recognized as a granular image independent of each other.
- the hole shape is intended as a region in which white pixels are surrounded by black pixels in a binary image.
- the hole shape can be a hole surrounded by black lines.
- CHomP can be mentioned as an example of such a program.
- CHomP is a freeware that complies with the GNU (General Public License) and can be downloaded from the homepage (http://chomp.rutgers.edu/).
- a program other than ChomP may be used as long as it is a program that can calculate the number of 0-dimensional Betti numbers and the number of 1-dimensional Betti numbers related to an image.
- the Betti number calculation unit 42 analyzes the correspondence between the 0-dimensional Betti number b0 and the 1-dimensional Betti number b1 and the reference value for binarization from the image of each cell nucleus, and the 0-dimensional Betti number b0
- the binarization reference value Th1 that gives the maximum value b0max, the binarization reference value Th2 when the one-dimensional Betti number b1 becomes the first predetermined value, and the maximum value b1max of the one-dimensional Betti number b1 are calculated.
- the binarization reference value Th2 is binarization when the one-dimensional Betti number b1 first reaches the first predetermined value when the binarization reference value is gradually increased from 0. It is a reference value of. That is, the binarization reference value Th2 is the smallest value among the binarization reference values in which the one-dimensional Betti number b1 is the first predetermined value.
- the Betti number calculation unit 42 When calculating the binarization reference values Th1 and Th2, it is desirable that the Betti number calculation unit 42 performs pixel value standardization processing.
- the standardization process is a process for correcting the reference value Th1 and the reference value Th2 for binarization according to the staining condition of each cell sample and the brightness of the image of each cell nucleus to be analyzed.
- the Betti number calculation unit 42 corrects the binarization reference values Th1 and Th2 so that the pixel value giving the mode value is 127 among the pixel values related to the brightness for each image of the cell nucleus. .. Note that 127 is an intermediate value between the minimum value 0 and the maximum value 255 of the pixel value.
- the Betti number calculation unit 42 sets the reference values Th1 and Th2 for binarization even if the brightness of each tissue image varies due to the difference in the staining condition of each cell sample. It can be calculated appropriately. Appropriate calculation of the reference values Th1 and Th2 for binarization is important for analyzing the image of each cell nucleus and correctly evaluating the amount of chromatin in the cell nucleus.
- the Betti number calculation unit 42 calculates the reference value Th1 and the reference value Th2 by the following formula. To do.
- the cancer determination unit 43 is based on the reference value Th2 for binarization when the one-dimensional Betti number b1 becomes the first predetermined value calculated by the Betti number calculation unit, and the maximum value b1max of the one-dimensional Betti number b1. , Determine whether the cells contained in the tissue are cancer cells.
- the cancer determination unit 43 may determine whether or not the cells contained in the tissue are cancer cells and the type of the cancer cells based on the following (1) to (4).
- Reference value Th1 for binarization that gives the maximum value b0max of the 0-dimensional Betti number b0
- Reference value Th2 for binarization when the one-dimensional Betti number b1 becomes the first predetermined value.
- Maximum value b1max of one-dimensional Betti number b1 Morphological characteristics of cell nuclei
- the cancer determination unit 43 may calculate the size of the cell nucleus by any method. For example, when the image of the cell nucleus is a quadrangle, the actual dimension represented by the diagonal line or the length of the side of the quadrangle may be calculated using the imaging magnification, and this value may be used as a value indicating the size of the cell nucleus. ..
- the cancer determination unit 43 calculates the actual area of the region corresponding to the cell nucleus included in the image of the cell nucleus using the imaging magnification, and calculates the diameter of a circle having the same area as the area as the size of the cell nucleus. You may.
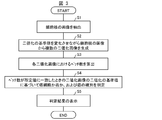
- FIG. 3 is a flowchart showing an example of the processing flow in the image analysis apparatus 1.
- the binarization unit 41 has a function of extracting an image of a cell nucleus from a tissue image will be described as an example.
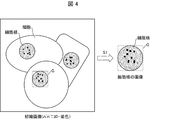
- FIG. 4 is a diagram schematically showing a process of extracting an image of a cell nucleus.
- the image G of the cell nucleus may be an image containing only one cell nucleus.
- the image G of the cell nucleus is preferably an image in which the region corresponding to the cell nucleus occupies a predetermined ratio (for example, 85%) or more with respect to the entire image of the cell nucleus.
- the region in which one cell nucleus is shown is extracted as a region surrounded by a quadrangle G as the image G of the cell nucleus, but it can be any polygon, circle, or ellipse that surrounds the entire cell nucleus. It may be extracted as an enclosed area.
- the binarization unit 41 performs the binarization process while changing the reference value for binarization, and generates a plurality of binarization images from the image of the cell nucleus extracted in step S1 (step S2: binarization step). ).
- FIG. 5 is a diagram for explaining the characteristics of the binarized image generated when the reference value for binarization is changed in the image of the cell nucleus.
- Image of cell nucleus G1 is an image of the cell nucleus of a normal cell.
- the image G2 of the cell nucleus is an image of the cell nucleus of a cancer cell.
- the image of the cell nucleus is pure white.
- the reference value for binarization is gradually increased, first, images such as nucleoli existing on the focal plane appear in the form of grains or dots. Furthermore, when the reference value for binarization is increased, an image of chromatin on the focal plane appears. The image of chromatin that appears at this time is granular. Further, when the reference value for binarization is increased, an image of chromatin within the depth of focus appears next. The chromatin image that appears at this stage is granular or linear. Furthermore, when the reference value for binarization is increased, the chromatin image in the cell nucleus is buried in noise due to the influence outside the depth of focus. When the reference value for binarization is sufficiently large (for example, 255), the image of the cell nucleus is black.
- the binarized image in the image G2 of the cell nucleus of the cancer cell has a lower binarization reference value than the binarized image in the image G1 of the cell nucleus of the normal cell. , Granular and linear images of chromatin become apparent. Further, the binarized image in the image G2 of the cell nucleus of the cancer cell has a denser image of chromatin than the binarized image in the image G1 of the cell nucleus of the normal cell. This is because the amount of chromatin in the cell nucleus of cancer cells is increased as compared with normal cells.
- the Betti number calculation unit 42 then calculates the 0-dimensional Betti number b0 and the 1-dimensional Betti number b1 in each binarized image generated by the binarization unit 41 (step S3: Area number calculation process).
- FIG. 6 is an example of a graph showing the relationship between the number of 0-dimensional Betti numbers in the image of the cell nucleus and the reference value for binarization.
- the number of zero-dimensional Betti numbers in the image of each cell nucleus is a bell-shaped graph having one maximum value b0max.
- the Betti number calculation unit 42 calculates a binarization reference value Th1 that gives the maximum value b0max of the zero-dimensional Betti number (see FIG. 6).
- FIG. 7 is an example of a graph showing the relationship between the one-dimensional Betti number in the image of the cell nucleus and the reference value for binarization.
- the one-dimensional Betti number in the image of each cell nucleus becomes a bell-shaped graph having one maximum value b1max.
- the cancer determination unit 43 sets the binarization reference value of the binarized image when the one-dimensional Betti number b1 calculated by the Betti number calculation unit 42 matches the first predetermined value. Based on this, the presence or absence of canceration of cells and the type of cancer are determined (step S4: determination step). The process performed by the cancer determination unit 43 will be described later with a specific example.
- the display control unit 5 causes the display device 6 to display the determination result by the cancer determination unit 43 (step S6).
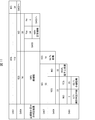
- FIG. 8 is a flowchart showing an example of the flow of the cancer cell determination process. The order of each determination can be appropriately changed according to the morphological characteristics of the cells applied to the cancer cell determination process, the type of cells to be determined, the type of cancer to be determined, and the like, and is shown in FIG. Not limited to examples.
- the image quality determination unit 40 determines whether or not the tissue image is suitable as an analysis target (step S401).
- the image quality determination unit 40 selects another tissue image (step S403), returns to step S401, and analyzes the tissue image. Determine whether it is suitable as a target.
- the image analysis unit 4 ends the process.
- FIG. 8 exemplifies a case where the image quality determination unit 40 determines whether or not the tissue image is suitable for analysis immediately before extracting the image of the cell nucleus, but the present invention is not limited to this.
- the image quality determination unit 40 may determine whether or not the tissue image is suitable for analysis at an arbitrary timing before extracting the image of the cell nucleus.
- the binarization unit 41 extracts an image of the cell nucleus (step S402).
- the Betti number calculation unit 42 analyzes the image of the extracted cell nucleus, and the binarization reference value Th1 that gives the maximum value b0max of the 0-dimensional Betti number, and the one-dimensional Betti number b1 is the first predetermined value (for example, b1).
- the cancer determination unit 43 calculates the size of the cell nucleus based on the extracted image of the cell nucleus and the imaging magnification.
- the calculated reference values for binarization Th1 and Th2, the maximum value b1max of the one-dimensional Betti number b1, and the size of the cell nucleus are used in the following determination in the cancer determination unit 43.
- the cancer determination unit 43 determines whether or not the binarization reference value Th2 is equal to or less than the first threshold value (step S404).
- the first threshold value may be, for example, 50.
- the cancer determination unit 43 determines whether or not the cell nucleus size is equal to or less than the second threshold value (step S405). ..
- the cancer determination unit 43 determines that the size of the cell nucleus is equal to or less than the second threshold value (YES in step S405), it determines that the cell having the cell nucleus is a normal cell (or is not a cancer cell) (step). S406).
- the cancer determination unit 43 determines that the size of the cell nucleus is larger than the second threshold value (NO in step S405), the process returns to step S403.
- the second threshold value may be any threshold value capable of distinguishing between normal cells and cancer cells.
- the second threshold value may be 48 ⁇ m.
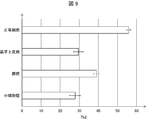
- FIG. 9 is a diagram showing a comparative example of values of the binarization reference value Th2 in normal cells and various types of cancer cells in the lung.
- the number of cells used for comparison was 40 for normal cells, 29 for squamous cell carcinoma, 35 for adenocarcinoma, and 37 for small cell carcinoma.
- the standard value Th2 for binarization of normal cells is 55.9 ⁇ 1.10, and the standard value Th2 for cells classified as squamous cell carcinoma is 29.5 ⁇ 2.51, classified as adenocarcinoma.
- the reference value Th2 value of the cells to be treated was 39.0 ⁇ 1.64, and the reference value Th2 value of the cells classified into small cell carcinoma was 27.9 ⁇ 2.85.
- Each value of these binarization reference values Th2 is described as an average value ⁇ standard error.
- the cancer determination unit 43 is highly likely to be a normal cell when the value of the binarization reference value Th2 is larger than 50, and the binarization reference value. If the Th2 value is 50 or less, it can be determined that the cells are likely to be cancer cells.
- the cancer determination unit 43 determines whether or not the size of the cell nucleus is equal to or less than the third threshold value. (Step S407). When the size of the cell nucleus is equal to or less than the third threshold value (YES in step S407), the cancer determination unit 43 determines that the type of cancer of the cell having the cell nucleus is adenocarcinoma (step S408).
- the third threshold value may be any threshold value capable of distinguishing between cancer cells classified into adenocarcinoma and cancer cells classified into other types. For example, the third threshold value is set to 60 ⁇ m. Just do it.
- the cancer determination unit 43 determines whether or not the binarization reference value Th1 is equal to or less than the fourth threshold value (step S409). ..
- the cancer determination unit 43 determines that the type of cancer of the cell having the cell nucleus is squamous cell carcinoma (step S410). ..
- the fourth threshold value may be any threshold value capable of distinguishing between cancer cells classified into squamous cell carcinoma and cancer cells classified into small cell carcinoma. For example, the fourth threshold value is set to 30. do it.
- the cancer determination unit 43 determines in step 409 as follows. -If the value of the binarization reference value Th1 is larger than 30, there is a high possibility that the cancer is squamous cell carcinoma. -If the value of the binarization reference value Th1 is 30 or less, there is a high possibility of small cell carcinoma.
- the cancer determination unit 43 determines whether or not the maximum value b1max of the one-dimensional Betti number is equal to or less than the fifth threshold value. (Step S411). When the maximum value b1max of the one-dimensional Betti number is equal to or less than the fifth threshold value (YES in step S411), the cancer determination unit 43 determines that the type of cancer of the cell having the cell nucleus is small cell carcinoma (step). S412).
- the fifth threshold may be any threshold that can distinguish between cancer cells classified as small cell carcinoma and cancer cells not classified as small cell carcinoma. For example, the fifth threshold may be 25. Just do it.
- FIG. 10 is a diagram showing a comparative example of the maximum value b1max of the one-dimensional Betti number in normal cells and various types of cancer cells.
- the number of cells used for comparison was 40 for normal cells, 29 for squamous cell carcinoma, 35 for adenocarcinoma, and 37 for small cell carcinoma.
- the maximum value b1max of the one-dimensional Betti number in each cell was as follows. Normal cells: 23.5 ⁇ 1.68 Cells classified as squamous cell carcinoma: 28.0 ⁇ 3.11 Cells classified as adenocarcinoma: 38.7 ⁇ 2.27 Cells classified as small cell carcinoma: 14.8 ⁇ 1.08 Each value of the maximum value b1max of these one-dimensional Betti numbers is described as an average value ⁇ standard error.
- b1max 25 is adopted as the fifth threshold value, it is possible to determine that there is a high possibility of normal cell or small cell carcinoma when the value of the maximum value b1max of the one-dimensional Betti number is 25 or less. Is. On the other hand, when the value of the maximum value b1max of the one-dimensional Betti number is larger than 25, it can be determined that the possibility of small cell carcinoma is low. Since the cells determined to be YES in step S404 of FIG. 8 do not contain normal cells, it is highly possible that the cells determined to be YES in step S411 are small cell carcinoma.
- the cancer determination unit 43 determines that the type of cancer of the cell having the cell nucleus cannot be determined. Is output (step S412).
- steps S404 to S413 may be performed for each of the images of each cell nucleus. This makes it possible to more accurately determine the type of cancer based on the result of determining the type of cancer for each cell shown in the tissue image.
- FIG. 11 is a diagram showing an example of a determination result when a process for determining whether or not the cells are cancer cells and the type of cancer is performed according to the flowchart shown in FIG.
- 147 histological images in which whether or not the cells were normal cells and what kind of cancer cells were classified in advance by a pathologist or the like were used. An image of one cell nucleus was extracted from each tissue image.
- 113 was determined by the image quality determination unit 40 to be suitable as an analysis target (see step S401 in FIG. 8). Images of cell nuclei extracted from each of these 113 images were used for subsequent processing. The remaining 34 tissue images were not analyzed (see step S403 in FIG. 8).
- step S404 of FIG. 8 all the images of the 74 cell nuclei determined to be YES by the cancer determination unit 43 were images of the cell nuclei derived from the tissue image previously determined to be cancer cells by the pathologist. (100% accuracy of judgment).
- step S404 of FIG. 8 among the images of 38 cell nuclei determined to be NO by the cancer determination unit 43, all of the images of 34 cell nuclei were preliminarily determined to be normal cells by the pathologist. It was an image of a cell nucleus derived from a tissue image (determination accuracy 100%). The images of the remaining 4 cell nuclei were determined to be NO in step 405 and were not analyzed (see step S403 in FIG. 8).
- the 74 cell nucleus images were images of cell nuclei determined to be NO by the cancer determination unit 43, and 19 were images of cell nuclei determined to be YES in step S407 of FIG.
- 18 are derived from histological images previously determined to be cancer cells classified as adenocarcinoma by a pathologist. It was an image of the cell nucleus of (determination accuracy 94.7%).
- 33 were images of cell nuclei determined to be YES by the cancer determination unit 43 and 22 were images of cell nuclei determined to be NO in step S409 of FIG.
- Twenty of the images of 22 cell nuclei determined to be NO by the cancer determination unit 43 in step S409 of FIG. 8 are histological images previously determined to be cancer cells classified as squamous cell carcinoma by a pathologist. It was an image of the cell nucleus of origin (judgment accuracy 90.9%).
- step S411 of FIG. 8 Twenty-three of the images of 28 cell nuclei determined to be YES by the cancer determination unit 43 in step S411 of FIG. 8 are histological images previously determined to be cancer cells classified as small cell carcinoma by a pathologist. It was an image of the cell nucleus of origin (judgment accuracy 82.1%). The images of the remaining 5 cell nuclei, which were determined to be NO, were determined to be unclassifiable (see step S413 in FIG. 8).
- the breakdown is one image of a cell nucleus derived from a tissue image previously determined to be small cell carcinoma by a pathologist, one image of a cell nucleus derived from a tissue image determined to be adenocarcinoma, and squamous cell carcinoma. There were three images of cell nuclei derived from tissue images that were determined to be.
- the image analysis apparatus 1 can determine whether or not a cancer cell is a cancer cell and the type of the cancer cell with high accuracy.
- FIG. 12 is a block diagram showing an example of the configuration of the image analysis device 1a according to the second embodiment of the present invention.
- the image analysis device 1a is different from the image analysis device 1 in that the determination result transmission unit 9 is provided instead of the display control unit 5.
- the determination result transmission unit 9 acquires the result of analyzing the captured image indicated by the image data received from the external device 8 from the cancer determination unit 43 and transmits it to the presentation device 10.
- the number of external devices 8 and presentation devices 10 may be plural.
- FIG. 13 is a schematic view showing a configuration example of an image analysis system 100 and 100a including the image analysis device 1a according to the present invention.
- FIG. 13A shows an example in which the external device 8 and the presenting device 10 are installed at a distance from each other
- FIG. 13B shows an example in which the presenting device 10 is connected to the external device 8a. Shown.
- the image analysis system 100 includes an external device 8, an image analysis device 1a, and a presentation device 10.
- the external device 8, the image analysis device 1a, and the presentation device 10 are connected to an information communication network 50 such as the Internet, and can transmit and receive data to and from each other.
- the external device 8 may be, for example, a device such as a microscope having a function of imaging a tissue, or a server that aggregates and manages images of the tissue, such as an electronic medical record server or a microscope image data server. There may be.
- the presentation device 10 may be any device having a function of presenting the result of image analysis to the user.
- the presentation device 10 is a display device including a display.
- it may be a communication terminal device such as a tablet terminal carried by a medical person.
- the image data of the captured image obtained by capturing the tissue is transmitted from the external device 8 to the image analysis device 1a.
- the image analysis unit 4 analyzes the image and determines whether or not it is a cancer cell and the type of cancer.
- the determination result transmission unit 9 transmits the determination result to the presenting device 10 or the external device 8.
- the image analysis system 100a includes an external device 8a, an image analysis device 1a, and a presentation device 10.
- the external device 8a and the image analysis device 1a are connected to an information communication network 50 such as the Internet, and can transmit and receive data to and from each other.
- the presentation device 10 is connected to the external device 8a.
- the image analysis device 1a can receive an image captured at a remote location from the external device 8, perform image analysis, and transmit the determination result to the presentation devices 10 and 10a.
- the presentation devices 10 and 10a may be devices connected to the external device 8 or may be devices independent of the image analysis device 1a and the external device 8.
- control blocks (particularly the image quality determination unit 40, the binarization unit 41, the Betti number calculation unit 42, and the cancer determination unit 43) of the image analysis devices 1 and 1a are logic circuits (especially, an integrated circuit (IC chip)) or the like. It may be realized by hardware) or by software.
- the image analysis devices 1 and 1a include a computer that executes a program instruction, which is software that realizes each function.
- the computer includes, for example, one or more processors and a computer-readable recording medium that stores the program. Then, in the computer, the processor reads the program from the recording medium and executes it, thereby achieving the object of the present invention.
- the processor for example, a CPU (Central Processing Unit) can be used.
- the recording medium in addition to a “non-temporary tangible medium” such as a ROM (Read Only Memory), a tape, a disk, a card, a semiconductor memory, a programmable logic circuit, or the like can be used.
- a RAM RandomAccessMemory
- the program may be supplied to the computer via an arbitrary transmission medium (communication network, broadcast wave, etc.) capable of transmitting the program.
- a transmission medium communication network, broadcast wave, etc.
- one aspect of the present invention can also be realized in the form of a data signal embedded in a carrier wave, in which the above program is embodied by electronic transmission.
- the image analysis method is a method of analyzing an captured image obtained by imaging a tissue, and the binarization is performed a plurality of times with different reference values for binarization for one of the above captured images.
- the hole-shaped region Based on the area number calculation step (step S3) for calculating the number of regions, which is a number, and the reference value for binarization of the binarized image when the number of regions matches a predetermined value, the organization is subjected to. It includes a determination step (step S4) of determining the type of cancer of the contained cells.
- the "tissue” is a living tissue containing the cells of the subject.
- the "hole-shaped region” is a space (hole) in the captured image which is a two-dimensional plane.
- a process for calculating the number of hole-shaped regions a process for obtaining a one-dimensional Betti number for each of the plurality of binarized images may be performed.
- a known program for calculating the Betti number from the image may be used.
- Chromatin in the cell nucleus When a cell becomes cancerous, the amount of chromatin in the cell nucleus of the cell increases. Chromatin in the cell nucleus is considered to be linear and is distributed three-dimensionally. Focusing on the relationship between depth of focus and contrast, the inventors focused on the relationship between the depth of focus and contrast, and by using the binarized image obtained by imaging the tissue, the inventors of chromatin distributed three-dimensionally in the cell nucleus. We found that it was possible to read information about the state of existence. For example, as the amount of chromatin in the cell nucleus increases, the degree of chromatin density and degree of interplay increases. That is, the degree of chromatin density and degree of interplay in the cell nucleus can be evaluated by the number of hole-shaped regions in the binarized image.
- a plurality of binarized images having different reference values for binarization are first generated for the captured image of the tissue, and each of the plurality of binarized images has a hole-shaped region.
- the number of regions, which is the number of, is calculated.
- the type of cancer of the cells contained in the tissue is determined based on the reference value for binarization of the binarized image when the number of regions matches a predetermined value.
- the image analysis method further includes an extraction step (step S1) for extracting an image of the cell nuclei contained in the captured image in the first aspect, and the cell nuclei extracted in the extraction step.
- the above binarization step (step S2) may be performed on the image.
- chromatin is present in the cell nucleus.
- an image of a cell nucleus is extracted from an image of an image of a tissue and binarized. This makes it possible to appropriately determine the type of cancer of the cells contained in the tissue without being affected by parts other than the cell nucleus.
- the type of the cancer is further determined based on the size of the cell nucleus possessed by the cells. You may.
- the size of the cell nucleus is also taken into consideration to determine the type of cancer. Thereby, the type of cancer can be determined in more detail.
- the plurality of said regions calculated from the plurality of binarized images in the determination step (step S4) may be determined based on whether or not the maximum value of the numbers is equal to or less than a predetermined value.
- the inventors have found that in some types of cancer, the maximum number of regions calculated from multiple binarized images is clearly different from that of other types of cancer. It was. According to the above configuration, the type of cancer can be determined in more detail.
- An image analysis program for causing a computer to execute each step included in the image analysis method according to any one of the above aspects 1 to 4, and a computer-readable recording medium on which the program is recorded are also included in the scope of the present invention.
- the image analysis device (1, 1a) is an image analysis device that analyzes an image captured by imaging a tissue, and is used for one image captured.
- the binarization unit (41) that generates a plurality of binarized images by performing the binarization process a plurality of times while differently differentizing the binarization reference values, and the generated plurality of binarized images.
- the area number calculation unit (betch number calculation unit 42) for calculating the number of regions, which is the number of hole-shaped regions, and the binarized image when the number of regions matches a predetermined value.
- a cancer determination unit (43) for determining the type of cancer of cells contained in the tissue based on a reference value for digitization is provided. According to the above configuration, the same effect as the image analysis method according to the first aspect of the present invention can be obtained.
- the image analysis system (100, 100a) uses the image analysis apparatus (1, 1a) according to the seventh aspect and the image data of the captured image. It includes an external device (8) for transmitting to the image analysis device, and a presentation device (10) for acquiring the result of determination by the image analysis device (1, 1a) and presenting the determination result.
- the user may be a medical person such as a doctor.
Landscapes
- Engineering & Computer Science (AREA)
- Health & Medical Sciences (AREA)
- Medical Informatics (AREA)
- General Physics & Mathematics (AREA)
- Theoretical Computer Science (AREA)
- Computer Vision & Pattern Recognition (AREA)
- Physics & Mathematics (AREA)
- Public Health (AREA)
- General Health & Medical Sciences (AREA)
- Radiology & Medical Imaging (AREA)
- Nuclear Medicine, Radiotherapy & Molecular Imaging (AREA)
- Epidemiology (AREA)
- Primary Health Care (AREA)
- Quality & Reliability (AREA)
- Biomedical Technology (AREA)
- Data Mining & Analysis (AREA)
- Databases & Information Systems (AREA)
- Pathology (AREA)
- Investigating Or Analysing Biological Materials (AREA)
- Image Analysis (AREA)
Abstract
La présente invention concerne une évaluation effectuée de manière objective et appropriée afin de déterminer si une cancérisation s'est produite dans des cellules réfléchies dans une image, de déterminer le type de cancer et autres par analyse d'une image d'un échantillon cellulaire. Le dispositif d'analyse d'image (1) de la présente invention comprend : une unité de binarisation (41) qui effectue à plusieurs reprises un traitement de binarisation sur une image capturée tout en faisant varier une valeur de référence de binarisation, générant ainsi une pluralité d'images binarisées ; une unité de calcul de nombre de Betti (42) qui calcule, pour chacune des images de la pluralité générée d'images binarisées, un nombre de régions qui est le nombre de régions en forme de trou ; et une unité d'évaluation de cancer (43) qui évalue le type de cancer présent dans des cellules incluses dans un tissu, l'évaluation étant effectuée sur la base de la valeur de référence de binarisation de l'image binarisée lorsque le nombre de régions correspond à une valeur prescrite.
Priority Applications (4)
| Application Number | Priority Date | Filing Date | Title |
|---|---|---|---|
| EP20776986.0A EP3951386B1 (fr) | 2019-03-26 | 2020-02-12 | Détection du cancer dans des tissus biologiques basée sur l'homologie |
| US17/442,499 US12039722B2 (en) | 2019-03-26 | 2020-02-12 | Image analysis method, storage medium, image analysis device, and image analysis system |
| JP2021508213A JP7450942B2 (ja) | 2019-03-26 | 2020-02-12 | 画像解析方法、画像解析プログラム、記録媒体、画像解析装置、画像解析システム |
| CN202080023436.6A CN113614529A (zh) | 2019-03-26 | 2020-02-12 | 图像解析方法、图像解析程序、记录媒体、图像解析装置、图像解析系统 |
Applications Claiming Priority (2)
| Application Number | Priority Date | Filing Date | Title |
|---|---|---|---|
| JP2019059164 | 2019-03-26 | ||
| JP2019-059164 | 2019-03-26 |
Publications (1)
| Publication Number | Publication Date |
|---|---|
| WO2020195258A1 true WO2020195258A1 (fr) | 2020-10-01 |
Family
ID=72611808
Family Applications (1)
| Application Number | Title | Priority Date | Filing Date |
|---|---|---|---|
| PCT/JP2020/005213 WO2020195258A1 (fr) | 2019-03-26 | 2020-02-12 | Procédé d'analyse d'image, programme d'analyse d'image, support d'enregistrement, dispositif d'analyse d'image et système d'analyse d'image |
Country Status (5)
| Country | Link |
|---|---|
| US (1) | US12039722B2 (fr) |
| EP (1) | EP3951386B1 (fr) |
| JP (1) | JP7450942B2 (fr) |
| CN (1) | CN113614529A (fr) |
| WO (1) | WO2020195258A1 (fr) |
Cited By (3)
| Publication number | Priority date | Publication date | Assignee | Title |
|---|---|---|---|---|
| WO2021112205A1 (fr) * | 2019-12-05 | 2021-06-10 | 国立大学法人大阪大学 | Procédé, dispositif et système d'analyse d'image, programme de commande et support d'enregistrement |
| JP2022104405A (ja) * | 2020-12-28 | 2022-07-08 | 株式会社APSAM Imaging | 画像解析方法、推定装置、推定システム、制御プログラム、記録媒体 |
| WO2022176665A1 (fr) * | 2021-02-18 | 2022-08-25 | 株式会社APSAM Imaging | Procédé d'analyse d'image, dispositif d'analyse d'image, dispositif de classification, système de classification, programme de commande et support d'enregistrement |
Families Citing this family (1)
| Publication number | Priority date | Publication date | Assignee | Title |
|---|---|---|---|---|
| CN116664413B (zh) * | 2023-03-27 | 2024-02-02 | 北京拙河科技有限公司 | 一种基于阿贝尔收敛算子的图像体积雾消除方法及装置 |
Citations (4)
| Publication number | Priority date | Publication date | Assignee | Title |
|---|---|---|---|---|
| US20050260583A1 (en) * | 2001-07-19 | 2005-11-24 | Paul Jackway | Chromatin segmentation |
| WO2005121784A1 (fr) * | 2004-06-10 | 2005-12-22 | Kurume University | Systeme de traitement d’images medicales |
| WO2010087112A1 (fr) | 2009-01-27 | 2010-08-05 | 国立大学法人大阪大学 | Appareil d'analyse d'image, procédé d'analyse d'image, programme d'analyse d'image et support d'enregistrement |
| JP2010193883A (ja) * | 2009-02-19 | 2010-09-09 | Chiba Univ | 成長因子に誘発されるユークロマチン化(euchromatinization)に必要な、SRC−ファミリーチロシンキナーゼの核局在 |
Family Cites Families (12)
| Publication number | Priority date | Publication date | Assignee | Title |
|---|---|---|---|---|
| US5257182B1 (en) * | 1991-01-29 | 1996-05-07 | Neuromedical Systems Inc | Morphological classification system and method |
| US7991221B1 (en) * | 2006-03-06 | 2011-08-02 | Kling Daniel H | Data processing system utilizing topological methods to manipulate and categorize n-dimensional datasets |
| US8103115B2 (en) * | 2007-02-26 | 2012-01-24 | Sony Corporation | Information processing apparatus, method, and program |
| JP2010042065A (ja) * | 2008-08-08 | 2010-02-25 | Toshiba Corp | 医用画像処理装置、処理方法 |
| JP5273734B2 (ja) | 2009-09-15 | 2013-08-28 | 国立大学法人宇都宮大学 | ボケの抽出方法、位置決め方法及びマイクロマニピュレーションシステム |
| WO2012016242A2 (fr) | 2010-07-30 | 2012-02-02 | Aureon Biosciences, Inc. | Systèmes et procédés pour la segmentation et le traitement d'images tissulaires et d'extraction de caractéristiques à partir de celles-ci pour le traitement, le diagnostic, ou la prédiction de conditions médicales |
| WO2012098842A1 (fr) | 2011-01-20 | 2012-07-26 | パナソニック株式会社 | Unité d'extraction de traits caractéristiques, procédé d'extraction de traits caractéristiques, programme d'extraction de traits caractéristiques et dispositif de traitement d'image |
| EP3324183B1 (fr) * | 2015-07-15 | 2019-03-13 | Osaka University | Dispositif d'analyse d'image, procédé d'analyse d'image, système d'analyse d'image, programme d'analyse d'image et support d'enregistrement |
| JP7030423B2 (ja) * | 2017-04-27 | 2022-03-07 | シスメックス株式会社 | 画像解析方法、装置、プログラムおよび深層学習アルゴリズムの製造方法 |
| JP7069581B2 (ja) * | 2017-07-07 | 2022-05-18 | 富士通株式会社 | 分析方法、分析装置及び分析プログラム |
| JP6950504B2 (ja) | 2017-12-08 | 2021-10-13 | 富士通株式会社 | 異常候補抽出プログラム、異常候補抽出方法および異常候補抽出装置 |
| CN108629761B (zh) * | 2018-03-12 | 2020-11-03 | 中山大学 | 一种乳腺癌图像识别方法、装置和用户终端 |
-
2020
- 2020-02-12 US US17/442,499 patent/US12039722B2/en active Active
- 2020-02-12 JP JP2021508213A patent/JP7450942B2/ja active Active
- 2020-02-12 WO PCT/JP2020/005213 patent/WO2020195258A1/fr unknown
- 2020-02-12 EP EP20776986.0A patent/EP3951386B1/fr active Active
- 2020-02-12 CN CN202080023436.6A patent/CN113614529A/zh active Pending
Patent Citations (4)
| Publication number | Priority date | Publication date | Assignee | Title |
|---|---|---|---|---|
| US20050260583A1 (en) * | 2001-07-19 | 2005-11-24 | Paul Jackway | Chromatin segmentation |
| WO2005121784A1 (fr) * | 2004-06-10 | 2005-12-22 | Kurume University | Systeme de traitement d’images medicales |
| WO2010087112A1 (fr) | 2009-01-27 | 2010-08-05 | 国立大学法人大阪大学 | Appareil d'analyse d'image, procédé d'analyse d'image, programme d'analyse d'image et support d'enregistrement |
| JP2010193883A (ja) * | 2009-02-19 | 2010-09-09 | Chiba Univ | 成長因子に誘発されるユークロマチン化(euchromatinization)に必要な、SRC−ファミリーチロシンキナーゼの核局在 |
Non-Patent Citations (3)
| Title |
|---|
| AARON ADCOCK ET AL.: "Classification of Hepatic Lesions using the Matching Metric", COMPUTER VISION AND IMAGE UNDERSTANDING, vol. 121, 2014, pages 36 - 42, XP028633963, DOI: 10.1016/j.cviu.2013.10.014 |
| NAKANE KAZUAKI: "Cancerous Lesion Site Extraction Technology Using Topological Indicators", PATHOLOGY AND CLINIC , vol. 35, no. 1, 1 January 2017 (2017-01-01), pages 48 - 54, XP009530885, ISSN: 0287-3745 * |
| See also references of EP3951386A4 |
Cited By (7)
| Publication number | Priority date | Publication date | Assignee | Title |
|---|---|---|---|---|
| WO2021112205A1 (fr) * | 2019-12-05 | 2021-06-10 | 国立大学法人大阪大学 | Procédé, dispositif et système d'analyse d'image, programme de commande et support d'enregistrement |
| JPWO2021112205A1 (fr) * | 2019-12-05 | 2021-06-10 | ||
| JP7265805B2 (ja) | 2019-12-05 | 2023-04-27 | 国立大学法人大阪大学 | 画像解析方法、画像解析装置、画像解析システム、制御プログラム、記録媒体 |
| JP2022104405A (ja) * | 2020-12-28 | 2022-07-08 | 株式会社APSAM Imaging | 画像解析方法、推定装置、推定システム、制御プログラム、記録媒体 |
| JP7122017B2 (ja) | 2020-12-28 | 2022-08-19 | 株式会社APSAM Imaging | 画像解析方法、推定装置、推定システム、制御プログラム、記録媒体 |
| US11861836B2 (en) | 2020-12-28 | 2024-01-02 | APSAM Imaging Corp. | Image analysis method, estimating device, estimating system, and storage medium |
| WO2022176665A1 (fr) * | 2021-02-18 | 2022-08-25 | 株式会社APSAM Imaging | Procédé d'analyse d'image, dispositif d'analyse d'image, dispositif de classification, système de classification, programme de commande et support d'enregistrement |
Also Published As
| Publication number | Publication date |
|---|---|
| US20220156927A1 (en) | 2022-05-19 |
| CN113614529A (zh) | 2021-11-05 |
| EP3951386A4 (fr) | 2022-12-28 |
| JP7450942B2 (ja) | 2024-03-18 |
| EP3951386A1 (fr) | 2022-02-09 |
| EP3951386B1 (fr) | 2024-04-03 |
| JPWO2020195258A1 (fr) | 2020-10-01 |
| US12039722B2 (en) | 2024-07-16 |
Similar Documents
| Publication | Publication Date | Title |
|---|---|---|
| WO2020195258A1 (fr) | Procédé d'analyse d'image, programme d'analyse d'image, support d'enregistrement, dispositif d'analyse d'image et système d'analyse d'image | |
| JP6483826B2 (ja) | 画像解析装置、画像解析方法、画像解析システム、画像解析プログラム、および記録媒体 | |
| Cosatto et al. | Grading nuclear pleomorphism on histological micrographs | |
| EP2472473B1 (fr) | Dispositif d'analyse d'images | |
| Tsai et al. | Nucleus and cytoplast contour detector of cervical smear image | |
| JP2021506003A (ja) | デジタル病理学分析結果の格納および読み出し方法 | |
| MX2014002843A (es) | Sistema y metodo para la deteccion de anormalidades en una muestra biologica. | |
| JP6506700B2 (ja) | 細胞レベルfishドットカウントのための方法及びシステム | |
| CN102834846A (zh) | 用于分割图像中的对象的方法 | |
| JP6745874B2 (ja) | 組織認識のための方法および装置 | |
| US10671832B2 (en) | Method and apparatus for tissue recognition | |
| JP2021524575A (ja) | ステイン集合体における信号の定量 | |
| Deepak et al. | Computer assisted pap smear analyser for cervical cancer screening using quantitative microscopy | |
| WO2017051195A1 (fr) | Appareil et procédé de traitement d'image entraîné par motif pour la reconnaissance de tissu | |
| Manikandan et al. | A cluster based segmentation of magnetic resonance images for brain tumor detection | |
| WO2018186789A1 (fr) | Segmentation d'images de tissu histologique en structures glandulaires destinée à une classification de tissus cancéreux de la prostate | |
| Uchqun o‘g‘li et al. | Pre-processing of digital images to improve the efficiency of liver fat analysis | |
| JP5924406B2 (ja) | 画像計測装置、画像計測方法、および、画像計測用プログラム | |
| Vandana et al. | Automated segmentation using histopathology images as a diagnostic confirmatory tool in detection of bone cancer | |
| Rezaeilouyeh et al. | Prostate cancer detection and gleason grading of histological images using shearlet transform | |
| US20240242344A1 (en) | Automated analysis of computerized morphological features of cell clusters associated with malignancy on bile duct brushing images | |
| Chakraborty et al. | Preprocessing and discrimination of cytopathological images | |
| Alomari et al. | Adaptive Localization of Focus Point Regions via Random Patch Probabilistic Density from Whole‐Slide, Ki‐67‐Stained Brain Tumor Tissue | |
| WO2016029208A1 (fr) | Système et procédé de stéréologie automatisée du cancer | |
| Dai et al. | The histological grading of HCC using fusion images |
Legal Events
| Date | Code | Title | Description |
|---|---|---|---|
| 121 | Ep: the epo has been informed by wipo that ep was designated in this application |
Ref document number: 20776986 Country of ref document: EP Kind code of ref document: A1 |
|
| ENP | Entry into the national phase |
Ref document number: 2021508213 Country of ref document: JP Kind code of ref document: A |
|
| NENP | Non-entry into the national phase |
Ref country code: DE |
|
| ENP | Entry into the national phase |
Ref document number: 2020776986 Country of ref document: EP Effective date: 20211026 |