WO2021112205A1 - Image analysis method, image analysis device, image analysis system, control program, and recording medium - Google Patents
Image analysis method, image analysis device, image analysis system, control program, and recording medium Download PDFInfo
- Publication number
- WO2021112205A1 WO2021112205A1 PCT/JP2020/045155 JP2020045155W WO2021112205A1 WO 2021112205 A1 WO2021112205 A1 WO 2021112205A1 JP 2020045155 W JP2020045155 W JP 2020045155W WO 2021112205 A1 WO2021112205 A1 WO 2021112205A1
- Authority
- WO
- WIPO (PCT)
- Prior art keywords
- image
- reference value
- maximum
- binarized
- features
- Prior art date
Links
Images


Classifications
-
- G—PHYSICS
- G06—COMPUTING; CALCULATING OR COUNTING
- G06T—IMAGE DATA PROCESSING OR GENERATION, IN GENERAL
- G06T7/00—Image analysis
- G06T7/0002—Inspection of images, e.g. flaw detection
- G06T7/0012—Biomedical image inspection
- G06T7/0014—Biomedical image inspection using an image reference approach
- G06T7/0016—Biomedical image inspection using an image reference approach involving temporal comparison
-
- G—PHYSICS
- G06—COMPUTING; CALCULATING OR COUNTING
- G06T—IMAGE DATA PROCESSING OR GENERATION, IN GENERAL
- G06T7/00—Image analysis
- G06T7/0002—Inspection of images, e.g. flaw detection
- G06T7/0012—Biomedical image inspection
- G06T7/0014—Biomedical image inspection using an image reference approach
-
- A—HUMAN NECESSITIES
- A61—MEDICAL OR VETERINARY SCIENCE; HYGIENE
- A61B—DIAGNOSIS; SURGERY; IDENTIFICATION
- A61B6/00—Apparatus for radiation diagnosis, e.g. combined with radiation therapy equipment
- A61B6/02—Devices for diagnosis sequentially in different planes; Stereoscopic radiation diagnosis
- A61B6/03—Computerised tomographs
-
- G—PHYSICS
- G06—COMPUTING; CALCULATING OR COUNTING
- G06T—IMAGE DATA PROCESSING OR GENERATION, IN GENERAL
- G06T1/00—General purpose image data processing
-
- G—PHYSICS
- G06—COMPUTING; CALCULATING OR COUNTING
- G06T—IMAGE DATA PROCESSING OR GENERATION, IN GENERAL
- G06T7/00—Image analysis
- G06T7/10—Segmentation; Edge detection
- G06T7/11—Region-based segmentation
-
- G—PHYSICS
- G06—COMPUTING; CALCULATING OR COUNTING
- G06T—IMAGE DATA PROCESSING OR GENERATION, IN GENERAL
- G06T7/00—Image analysis
- G06T7/10—Segmentation; Edge detection
- G06T7/136—Segmentation; Edge detection involving thresholding
-
- G—PHYSICS
- G06—COMPUTING; CALCULATING OR COUNTING
- G06V—IMAGE OR VIDEO RECOGNITION OR UNDERSTANDING
- G06V10/00—Arrangements for image or video recognition or understanding
- G06V10/20—Image preprocessing
- G06V10/25—Determination of region of interest [ROI] or a volume of interest [VOI]
-
- G—PHYSICS
- G06—COMPUTING; CALCULATING OR COUNTING
- G06V—IMAGE OR VIDEO RECOGNITION OR UNDERSTANDING
- G06V10/00—Arrangements for image or video recognition or understanding
- G06V10/40—Extraction of image or video features
- G06V10/62—Extraction of image or video features relating to a temporal dimension, e.g. time-based feature extraction; Pattern tracking
-
- G—PHYSICS
- G06—COMPUTING; CALCULATING OR COUNTING
- G06V—IMAGE OR VIDEO RECOGNITION OR UNDERSTANDING
- G06V10/00—Arrangements for image or video recognition or understanding
- G06V10/70—Arrangements for image or video recognition or understanding using pattern recognition or machine learning
- G06V10/74—Image or video pattern matching; Proximity measures in feature spaces
- G06V10/75—Organisation of the matching processes, e.g. simultaneous or sequential comparisons of image or video features; Coarse-fine approaches, e.g. multi-scale approaches; using context analysis; Selection of dictionaries
- G06V10/751—Comparing pixel values or logical combinations thereof, or feature values having positional relevance, e.g. template matching
-
- G—PHYSICS
- G06—COMPUTING; CALCULATING OR COUNTING
- G06V—IMAGE OR VIDEO RECOGNITION OR UNDERSTANDING
- G06V10/00—Arrangements for image or video recognition or understanding
- G06V10/70—Arrangements for image or video recognition or understanding using pattern recognition or machine learning
- G06V10/82—Arrangements for image or video recognition or understanding using pattern recognition or machine learning using neural networks
-
- G—PHYSICS
- G06—COMPUTING; CALCULATING OR COUNTING
- G06T—IMAGE DATA PROCESSING OR GENERATION, IN GENERAL
- G06T2207/00—Indexing scheme for image analysis or image enhancement
- G06T2207/30—Subject of image; Context of image processing
- G06T2207/30004—Biomedical image processing
- G06T2207/30024—Cell structures in vitro; Tissue sections in vitro
-
- G—PHYSICS
- G06—COMPUTING; CALCULATING OR COUNTING
- G06V—IMAGE OR VIDEO RECOGNITION OR UNDERSTANDING
- G06V2201/00—Indexing scheme relating to image or video recognition or understanding
- G06V2201/03—Recognition of patterns in medical or anatomical images
- G06V2201/031—Recognition of patterns in medical or anatomical images of internal organs
Abstract
The present invention determines, with high accuracy, a change having occurred in tissue. The present invention is provided with: a binarization unit (41) that generates, from an image of an analysis target, a plurality of binarized images having different binarization reference values; a Betti number calculation unit (42) that calculates, for each of the plurality of binarized images, a one-dimensional Betti number indicating the number of hole-shaped regions comprising pixels of a second pixel value surrounded by pixels of a first pixel value after being binarized into the first pixel value and the second pixel value; and a determination unit (44) that determines change having occurred in tissue on the basis of a binarization reference value in the binarized image in which the one-dimensional Betti number becomes maximum and on the basis of the number of one-dimensional Betti numbers in the binarized image.
Description
本発明は組織を撮像した画像を解析して、組織に生じた変化を判定する画像解析方法および画像解析装置等に関する。
The present invention relates to an image analysis method, an image analysis device, and the like that analyze an image of an image of a tissue and determine changes that have occurred in the tissue.
胸部検診の受診者は年々増加しており、胸部CT画像などの医用画像を読影する医師の負担も年々増加している。医師の負担を軽減するためには、計算機による画像解析技術が必要不可欠である。
The number of people undergoing chest examinations is increasing year by year, and the burden on doctors who interpret medical images such as chest CT images is also increasing year by year. In order to reduce the burden on doctors, computer-based image analysis technology is indispensable.
近年では、深層学習(deep learning)などの人工知能による画像解析(画像認識)技術が多く試みられており、中には医師と同様の判定結果を出力することが可能なものも報告されている。例えば、特許文献1および2には、医用画像についての画像解析技術が開示されている。
In recent years, many attempts have been made to image analysis (image recognition) technology using artificial intelligence such as deep learning, and some have been reported to be able to output judgment results similar to those of doctors. .. For example, Patent Documents 1 and 2 disclose image analysis techniques for medical images.
医師は、組織に生じた病変部位における構造上の特性を把握しており、各病変部位がどのような画像として撮像され得るのかについても理解している。その上で、医師は、組織を撮像した画像に基づいて組織に生じた変化を判定する。
The doctor understands the structural characteristics of the lesion site that has occurred in the tissue, and also understands what kind of image each lesion site can be imaged. The doctor then determines the changes that have occurred in the tissue based on the image of the tissue.
例えば、患者の肺のCT画像から発見された結節影の性状に基づいて、医師は、肺結節の種類を類推し、判定することができる。結節影から肺結節の種類を、医師による肺結節の種類の判定と同じように行うことが可能な画像解析技術が求められている。このような画像解析技術は、肺のCT画像の読影に限らず、さまざまな臓器および組織における病変の発見および判定に活用され得る。
For example, a doctor can infer and determine the type of lung nodule based on the nature of the nodule shadow found in the CT image of the patient's lung. There is a need for an image analysis technique that can determine the type of lung nodule from the nodule shadow in the same way as a doctor determines the type of lung nodule. Such an image analysis technique can be utilized not only for interpretation of CT images of lungs but also for detection and determination of lesions in various organs and tissues.
近年、コンピュータ(人工知能)が自ら膨大な画像データを学習して自律的に推論結果を出力するさまざまな技術が考案されている。例えば、医師による判定済の組織画像と判定結果との対応関係を学習させた人工知能を作成し、該人工知能に解析対象となる組織画像を入力することによって推論結果を出力させることも可能である。しかし、人工知能を用いて得た推論は、出力された推論結果を医師などのユーザが理解できないという問題点がある。なぜなら、人工知能がその推論結果を出力するに至った根拠は、解析対象の画像を見ても分からない場合が多いからである。推論結果を出力するに至った根拠が不明である場合、その推論結果をそのまま現在の医療に活用することは困難である。
In recent years, various technologies have been devised in which a computer (artificial intelligence) learns a huge amount of image data by itself and autonomously outputs inference results. For example, it is also possible to create an artificial intelligence in which the correspondence between the tissue image judged by the doctor and the judgment result is learned, and output the inference result by inputting the tissue image to be analyzed into the artificial intelligence. is there. However, the inference obtained by using artificial intelligence has a problem that the output inference result cannot be understood by a user such as a doctor. This is because the reason why artificial intelligence has come to output the inference result is that it is often not clear even by looking at the image to be analyzed. If the basis for outputting the inference result is unknown, it is difficult to utilize the inference result as it is in the current medical treatment.
本発明の一態様は、上記の問題点を解決するためになされたものであり、その目的は、組織の画像を、該組織に生じた変化の構造上の特性に基づいて解析することにより、組織に生じた変化について、医師のように精度良く判定する画像解析方法および画像解析装置等を実現することを目的とする。
One aspect of the present invention has been made to solve the above problems, the purpose of which is to analyze an image of a tissue based on the structural properties of the changes that have occurred in the tissue. It is an object of the present invention to realize an image analysis method, an image analysis device, and the like that accurately determine changes in a tissue like a doctor.
上記の課題を解決するために、本発明の一態様に係る画像解析方法は、組織を撮像した組織画像を解析する方法であって、前記組織画像から解析対象となる対象領域画像を抽出し、該対象領域画像について、二値化の基準値が異なる複数の二値化画像を生成する二値化ステップと、複数の前記二値化画像のそれぞれについて、第1画素値と第2画素値とに二値化された後における前記第1画素値の画素に囲まれた、該二値化後における前記第2画素値の画素からなる穴形状の領域の数を示す第1特徴数を含む特徴数を算出する特徴数算出ステップと、前記第1特徴数が最大となる二値化画像を特定し、特定した該二値化画像における二値化の基準値を示す第1基準値、および該二値化画像における前記第1特徴数を示す最大第1特徴数を特定する基準値特定ステップと、前記第1基準値および前記最大第1特徴数に基づいて、前記組織に生じた変化を判定する判定ステップと、を含む。
In order to solve the above problem, the image analysis method according to one aspect of the present invention is a method of analyzing a tissue image obtained by imaging a tissue, and extracts a target region image to be analyzed from the tissue image. The binarization step of generating a plurality of binarized images having different binarization reference values for the target region image, and the first pixel value and the second pixel value for each of the plurality of the binarized images. Features including the number of first features indicating the number of hole-shaped regions composed of the pixels of the second pixel value after being binarized, surrounded by the pixels of the first pixel value after being binarized to The feature number calculation step for calculating the number, the first reference value indicating the binarization reference value in the identified binarized image by specifying the binarized image having the maximum number of the first features, and the said Based on the reference value specifying step for specifying the maximum number of first features indicating the number of first features in the binarized image, the first reference value, and the maximum number of first features, the change occurring in the structure is determined. Including the determination step to be performed.
上記の課題を解決するために、本発明の一態様に係る画像解析装置は、組織を撮像した組織画像を解析する画像解析装置であって、前記組織画像から解析対象となる対象領域画像を抽出し、該対象領域画像について、二値化の基準値が異なる複数の二値化画像を生成する二値化部と、複数の前記二値化画像のそれぞれについて、第1画素値と第2画素値とに二値化された後における前記第1画素値の画素に囲まれた、該二値化後における前記第2画素値の画素からなる穴形状の領域の数を示す第1特徴数を算出する特徴数算出部と、前記第1特徴数が最大となる二値化画像を特定し、特定した該二値化画像における二値化の基準値を示す第1基準値、および該二値化画像における前記第1特徴数を示す最大第1特徴数を特定する基準値特定部と、前記第1基準値および前記最大第1特徴数に基づいて、前記組織に生じた変化を判定する判定部と、を備える。
In order to solve the above problems, the image analysis device according to one aspect of the present invention is an image analysis device that analyzes a tissue image obtained by imaging a tissue, and extracts a target region image to be analyzed from the tissue image. Then, for the target area image, the binarization unit that generates a plurality of binarized images having different binarization reference values, and the first pixel value and the second pixel for each of the plurality of the binarized images. The number of first features indicating the number of hole-shaped regions composed of the pixels of the second pixel value after being binarized to the value, surrounded by the pixels of the first pixel value after being binarized to the value. The feature number calculation unit to be calculated, the first reference value indicating the binarization reference value in the identified binarized image by specifying the binarized image having the maximum number of features, and the binar value. A determination to determine a change that has occurred in the structure based on a reference value specifying unit that specifies the maximum number of first features indicating the number of first features in the image, the first reference value, and the maximum number of first features. It has a part and.
本発明の各態様に係る画像解析装置は、コンピュータによって実現してもよく、この場合には、コンピュータを前記画像解析装置が備える各部(ソフトウェア要素)として動作させることにより前記画像解析装置をコンピュータにて実現させる画像解析装置の制御プログラム、およびそれを記録したコンピュータ読み取り可能な記録媒体も、本発明の範疇に入る。
The image analysis device according to each aspect of the present invention may be realized by a computer. In this case, the image analysis device is made into a computer by operating the computer as each part (software element) included in the image analysis device. The control program of the image analysis device to be realized and the computer-readable recording medium on which the control program is recorded also fall within the scope of the present invention.
本発明の一態様によれば、組織の画像を、該組織に生じた変化の構造上の特性に基づいて解析することにより、組織に生じた変化を精度良く判定することができる。
According to one aspect of the present invention, by analyzing the image of the tissue based on the structural characteristics of the changes that have occurred in the tissue, the changes that have occurred in the tissue can be accurately determined.
〔実施形態1〕
以下、本発明の一実施形態について、詳細に説明する。 [Embodiment 1]
Hereinafter, one embodiment of the present invention will be described in detail.
以下、本発明の一実施形態について、詳細に説明する。 [Embodiment 1]
Hereinafter, one embodiment of the present invention will be described in detail.
(本発明の技術思想)
まず、本発明の技術思想について以下に説明する。 (Technical Idea of the Present Invention)
First, the technical idea of the present invention will be described below.
まず、本発明の技術思想について以下に説明する。 (Technical Idea of the Present Invention)
First, the technical idea of the present invention will be described below.
本発明の発明者らは、組織画像の一例として、被検体の胸部を撮像したCT(computed tomography)画像における肺(組織)を撮像した領域を解析した。具体的には、本発明の発明者らは、肺のCT画像(組織画像)における肺結節が生じていない領域と、肺結節が生じている領域とを詳細に比較・検討した。
The inventors of the present invention analyzed the region where the lung (tissue) was imaged in the CT (computed tomography) image which imaged the chest of the subject as an example of the tissue image. Specifically, the inventors of the present invention have compared and examined in detail the region in which no lung nodule has occurred and the region in which the lung nodule has occurred in the CT image (tissue image) of the lung.
具体的には、本発明の発明者らは、肺のCT画像から、解析対象となる結節影を抽出し、該結節影に対して二値化の基準値が異なる複数の二値化画像を生成した。そして、本発明の発明者らは、二値化画像のそれぞれについて、二値化の基準値を変化させたときに、算出された1次元ベッチ数b1(第1特徴数)および0次元ベッチ数b0(第2特徴数)がどのように変化するかを調べた。
Specifically, the inventors of the present invention extract a nodule shadow to be analyzed from a CT image of the lung, and create a plurality of binarized images having different reference values for binarization with respect to the nodule shadow. Generated. Then, the inventors of the present invention calculated the one-dimensional Betti number b1 (first feature number) and the zero-dimensional Betti number when the binarization reference value was changed for each of the binarized images. We investigated how b0 (the number of second features) changes.
その結果、本発明の発明者らは、1次元ベッチ数b1が最大となるときの二値化の基準値および1次元ベッチ数b1の最大値に基づいて、結節影が如何なる種類の肺結節に由来しているかを精度良く判定できることを見いだした。
As a result, the inventors of the present invention have a nodule shadow of any kind of lung nodule based on the reference value of binarization when the one-dimensional Betti number b1 is maximized and the maximum value of the one-dimensional Betti number b1. We found that it is possible to accurately determine whether it is derived.
さらに、本発明の発明者らは、下記の(1)~(3)をさらに利用することによって、肺結節の判定の精度を向上させたり、判定処理を効率化したりすることが可能であることも見いだした。
Furthermore, the inventors of the present invention can further improve the accuracy of determination of lung nodules and improve the efficiency of determination processing by further utilizing the following (1) to (3). I also found it.
(1)0次元ベッチ数b0が最大となるときの二値化の基準値および0次元ベッチ数b0の最大値。
(1) The reference value for binarization when the 0-dimensional Betti number b0 is the maximum and the maximum value of the 0-dimensional Betti number b0.
(2)1次元ベッチ数b1と0次元ベッチ数b0との比。
(2) Ratio of 1-dimensional Betti number b1 and 0-dimensional Betti number b0.
(3)結節影の単位面積当たりの1次元ベッチ数b1および0次元ベッチ数b0。
(3) The number of one-dimensional Betti numbers b1 and the number of zero-dimensional Betti numbers b0 per unit area of the nodule shadow.
(組織画像を解析するための数学的表現)
次に、本発明の一態様に係る画像解析方法において、組織画像を解析するために適用される数学的表現について説明する。 (Mathematical representation for analyzing tissue images)
Next, in the image analysis method according to one aspect of the present invention, a mathematical expression applied for analyzing a tissue image will be described.
次に、本発明の一態様に係る画像解析方法において、組織画像を解析するために適用される数学的表現について説明する。 (Mathematical representation for analyzing tissue images)
Next, in the image analysis method according to one aspect of the present invention, a mathematical expression applied for analyzing a tissue image will be described.
組織に生じた変化を定量化して解析するために、本発明の一態様に係る画像解析方法では、二値化画像に対して、ホモロジーの概念、特にパーシステントホモロジーを適用する。ホモロジーとは、図形の形態上の性質を代数的に置き換えて、図形の結合などの解析を容易にする数学の一分野である。
In order to quantify and analyze the changes that occur in the tissue, the image analysis method according to one aspect of the present invention applies the concept of homology, particularly persistent homology, to the binarized image. Homology is a field of mathematics that algebraically replaces the morphological properties of figures to facilitate analysis such as the combination of figures.
ホモロジーの概念は、構成要素の連結および接触を表す数学的な概念である。組織画像において、適切な二値化の基準値(二値化パラメータともいう)を設定して二値化する。そして、二値化された画像から0次元ベッチ数および1次元ベッチ数b1を算出する。算出された0次元ベッチ数b0および1次元ベッチ数b1を用いて、その組織の構成要素同士の連結の程度、および構成要素同士の接触の程度の評価が可能である。
The concept of homology is a mathematical concept that represents the connection and contact of components. In the tissue image, an appropriate reference value for binarization (also called a binarization parameter) is set and binarized. Then, the 0-dimensional Betti number and the 1-dimensional Betti number b1 are calculated from the binarized image. Using the calculated 0-dimensional Betti number b0 and 1-dimensional Betti number b1, it is possible to evaluate the degree of connection between the components of the organization and the degree of contact between the components.
ベッチ数とは、図形(例えば、組織の構成要素に該当)の形状には無関係であり、図形同士の接触と分離とにのみ関係するトポロジカルな示唆数である。q次元特異ホモロジー群が有限生成のとき、このq次特異ホモロジー群は、自由アーベル群と有限アーベル群との直和に分けられる。この自由アーベル群の階級をベッチ数という。
The Betti number is a topological suggestion number that is irrelevant to the shape of a figure (for example, a component of an organization) and is related only to contact and separation between figures. When the q-dimensional singular homology group is finitely generated, this q-th order singular homology group is divided into a direct sum of a free abelian group and a finite abelian group. The class of this free abelian group is called the Betti number.
<0次元ベッチ数b0>
0次元ベッチ数b0は、数学的には以下のように定義される。一般に有限個の線分を繋ぎ合わせて成る図形(1次元複体とも呼称される)Kの連結成分の個数を0次元ベッチ数という。「有限個の点を有限個の線分で結んだ図形が連結である」とは、この図形の任意の頂点から他の任意の頂点に、この図形の辺を辿って到達し得ることを意図する。 <0-dimensional Betti number b0>
The zero-dimensional Betti number b0 is mathematically defined as follows. Generally, the number of connected components of a figure (also called a one-dimensional complex) K formed by connecting a finite number of line segments is called a 0-dimensional Betti number. "A figure connecting a finite number of points with a finite number of line segments is a concatenation" means that it is possible to reach any other vertex of this figure by tracing the sides of this figure. To do.
異なる二値化の基準値を用いて生成した複数の二値化画像のそれぞれにおいて、二値化後の一方の画素値(例えば、二値化の結果、画素値が0)の画素が連結して成る連結領域の数が、0次元ベッチ数b0である。
In each of the plurality of binarized images generated using different binarization reference values, the pixels of one pixel value after binarization (for example, the pixel value is 0 as a result of binarization) are concatenated. The number of connected regions is 0-dimensional Vetch number b0.
<1次元ベッチ数b1>
1次元ベッチ数b1は、数学的には以下のように定義される。以下の(1)および(2)の条件が満たされる場合、図形Kの1次元ベッチ数b1はrである。
(1)有限個の線分を繋ぎ合わせて成る図形(連結な1次元複体)Kに対して、適当なr個の、開いた(両端を含まない)1次元単体(例えば、線分)を図形Kから取り去っても図形Kの連結成分の個数は増加しない。
(2)任意の(r+1)個の、開いた1次元単体をKから取り去った場合にはKは連結でなくなる(すなわち、Kの連結成分の個数が1つ増加する)。 <One-dimensional Betti number b1>
The one-dimensional Betti number b1 is mathematically defined as follows. When the following conditions (1) and (2) are satisfied, the one-dimensional Betti number b1 of the figure K is r.
(1) For a figure (connected one-dimensional complex) K formed by connecting a finite number of line segments, an appropriate r number of open (not including both ends) one-dimensional simplex (for example, a line segment) Does not increase the number of connected components of the figure K even if is removed from the figure K.
(2) When any (r + 1) number of open one-dimensional simple substances are removed from K, K is no longer connected (that is, the number of connected components of K is increased by one).
異なる二値化の基準値を用いて生成した複数の二値化画像のそれぞれにおいて、二値化後の一方の画素値(例えば、二値化の結果、画素値が0)の画素に囲まれた穴形状の領域(例えば、二値化の結果、画素値が255)の数が、1次元ベッチ数b1である。
Each of the plurality of binarized images generated using different binarization reference values is surrounded by pixels of one pixel value after binarization (for example, the pixel value is 0 as a result of binarization). The number of hole-shaped regions (for example, the pixel value is 255 as a result of binarization) is the one-dimensional vetch number b1.
<例示的な図形の0次元ベッチ数b0および1次元ベッチ数b1>
ここで、図2に示す例示的な図形を用いて、二値化画像における0次元ベッチ数b0および1次元ベッチ数b1について説明する。図2は、ホモロジーの概念におけるベッチ数を説明するための模式図である。図2に示す図形M1の場合、黒い領域の数は1つである。したがって、図形M1の0次元ベッチ数b0は1である。また、図形M1の場合、黒い領域によって囲まれた白い領域の数は1つである。したがって、図形M1の1次元ベッチ数b1は1である。 <0-dimensional Betti number b0 and 1-dimensional Betti number b1 of an exemplary figure>
Here, the 0-dimensional Betti number b0 and the 1-dimensional Betti number b1 in the binarized image will be described with reference to the exemplary figures shown in FIG. FIG. 2 is a schematic diagram for explaining the Betti number in the concept of homology. In the case of the figure M1 shown in FIG. 2, the number of black regions is one. Therefore, the 0-dimensional Betti number b0 of the figure M1 is 1. Further, in the case of the figure M1, the number of white areas surrounded by the black areas is one. Therefore, the one-dimensional Betti number b1 of the figure M1 is 1.
図2に示す図形M2の場合、黒い領域の数は2つである。したがって、図形M2の0次元ベッチ数b0は2である。また、図形M2の場合、黒い領域によって囲まれた白い領域の数は3つである。したがって、図形M2の1次元ベッチ数b1は3である。
In the case of the figure M2 shown in FIG. 2, the number of black areas is two. Therefore, the 0-dimensional Betti number b0 of the figure M2 is 2. Further, in the case of the figure M2, the number of white areas surrounded by the black areas is three. Therefore, the one-dimensional Betti number b1 of the figure M2 is 3.
2次元画像の場合、0次元ベッチ数b0は互いに連結した成分の纏まりの数であり、1次元ベッチ数b1は当該連結した成分が外縁となって囲んだ空間(以下、「穴形状の領域」と記す場合がある)の数である。穴形状の領域の数は、連結成分中に存在する「穴」の総数である。
In the case of a two-dimensional image, the 0-dimensional Betti number b0 is the number of groups of components connected to each other, and the one-dimensional Betti number b1 is the space surrounded by the connected components as the outer edge (hereinafter, "hole-shaped area"). It may be written as). The number of hole-shaped regions is the total number of "holes" present in the connected component.
(解析対象となる組織画像および解析対象)
以下では、肺のCT画像の結節影を解析して、肺に生じた変化(例えば、肺結節の有無および肺結節の種類)を判定する画像解析装置1を例に挙げて説明する。しかし、本発明の一態様に係る画像解析方法を適用可能な組織画像は、肺のCT画像に限定されない。 (Tissue image to be analyzed and analysis target)
In the following, animage analysis device 1 that analyzes a nodule shadow on a CT image of the lung and determines changes occurring in the lung (for example, the presence or absence of a lung nodule and the type of the lung nodule) will be described as an example. However, the tissue image to which the image analysis method according to one aspect of the present invention can be applied is not limited to the CT image of the lung.
以下では、肺のCT画像の結節影を解析して、肺に生じた変化(例えば、肺結節の有無および肺結節の種類)を判定する画像解析装置1を例に挙げて説明する。しかし、本発明の一態様に係る画像解析方法を適用可能な組織画像は、肺のCT画像に限定されない。 (Tissue image to be analyzed and analysis target)
In the following, an
本発明の一態様に係る画像解析方法は、下記の(1)~(5)などのような、さまざまな医用画像(組織画像)に対して適用可能である。
(1)MRI(磁気共鳴像、magnetic resonance imaging)検査にて撮像される脳および膵臓などの画像
(2)レントゲン(マンモグラフィーを含む)検査にて撮像される肝臓および乳房などの画像
(3)PET(陽電子放射断層撮影、positron emission tomography)
(4)PET-CT(positron emission tomography/CT)
(5)SPECT-CT(single-photon emission coupled tomography/CT)。 The image analysis method according to one aspect of the present invention can be applied to various medical images (tissue images) such as the following (1) to (5).
(1) Images of the brain and pancreas imaged by MRI (magnetic resonance imaging) examination (2) Images of liver and breast imaged by X-ray (including mammography) examination (3) PET (Positron emission tomography)
(4) PET-CT (positron emission tomography / CT)
(5) SPECT-CT (single-photon emission coupled tomography / CT).
また、本発明の一態様にかかる画像解析方法の解析対象となる領域の画像は、結節影に限定されない。例えば、上記(1)~(5)の画像中に見出される任意の病変部位の画像が本発明の一態様にかかる画像解析方法の解析対象となり得る。
Further, the image of the region to be analyzed by the image analysis method according to one aspect of the present invention is not limited to the nodule shadow. For example, an image of an arbitrary lesion site found in the images (1) to (5) above can be the analysis target of the image analysis method according to one aspect of the present invention.
(肺のCT画像における結節影の特徴と肺結節の種類)
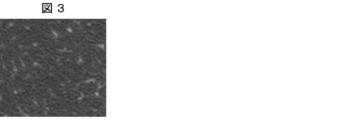
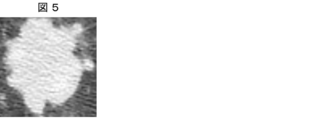
まず、肺のCT画像に基づいて判断される肺結節の種類について、図3~図6を用いて説明する。図3は、結節が生じていない肺野の領域のCT画像の例を示す図である。図4は、肺血管の領域のCT画像の例を示す図である。図5は、充実型結節が生じている肺の領域のCT画像の例を示す図である。図6は、すりガラス型結節が生じている肺の領域のCT画像の例を示す図である。 (Characteristics of nodule shadows on CT images of lungs and types of lung nodules)
First, the types of lung nodules determined based on CT images of the lung will be described with reference to FIGS. 3 to 6. FIG. 3 is a diagram showing an example of a CT image of a region of the lung field where nodules have not formed. FIG. 4 is a diagram showing an example of a CT image of a region of a pulmonary blood vessel. FIG. 5 is a diagram showing an example of a CT image of a region of the lung where a solid nodule is generated. FIG. 6 is a diagram showing an example of a CT image of a region of the lung where ground glass type nodules are formed.
肺のCT画像において、X線の吸収率がより低い領域は、X線の吸収率がより高い領域に比べて黒さの度合いが高く表示される。肺のCT画像において正常な肺は、図3に示すように、淡い乳白色の靄がかかった黒っぽい領域として表示される。肺血管は、図4に示すように、内部が周囲よりも白い円形または楕円形の像として表示され得る。結節影は、図5および図6に示すように、内部が周囲よりも白い「類円形の影」として表示される。
In the CT image of the lung, the region where the X-ray absorption rate is lower is displayed with a higher degree of blackness than the region where the X-ray absorption rate is higher. In the CT image of the lung, the normal lung is displayed as a dark area with a pale milky white haze, as shown in FIG. Pulmonary vessels can be displayed as a circular or oval image whose interior is whiter than its surroundings, as shown in FIG. As shown in FIGS. 5 and 6, the nodule shadow is displayed as a “circular shadow” whose inside is whiter than the surroundings.
肺結節は、肺のCT画像において、最大径3cm以下の円形または紡錘形、あるいは、辺縁が不整な吸収値上昇領域として視認される結節影として検出される。肺結節は、結節影の性状に基づいて、充実型結節(solid nodule)、すりガラス型結節(ground-glass nodule)、および混合型結節などに分類される。
Pulmonary nodules are detected on CT images of the lung as circular or spindle-shaped with a maximum diameter of 3 cm or less, or as nodule shadows that are visually recognized as regions with irregular absorption value increases. Lung nodules are classified into solid nodules, ground-glass nodules, and mixed nodules based on the nature of the nodule shadow.
充実型結節(図5参照)は、内部が軟部組織吸収値の領域(白い領域)で満たされている結節である。すりガラス型結節(図6参照)は、充実型結節に比べて内部の白さの程度が低く、内部に肺血管や気管支の辺縁が視認可能な結節である。混合型結節(図示せず)は、一部部分充実型(part-solid nodule)とも呼称される。混合型結節は、内部にすりガラス型結節の領域と充実型結節の領域との両方を有する結節である。
A solid nodule (see FIG. 5) is a nodule whose inside is filled with a region of soft tissue absorption value (white region). Frosted glass nodules (see FIG. 6) are nodules that have a lower degree of internal whiteness than solid nodules and have visible pulmonary blood vessels and bronchial margins inside. Mixed nodules (not shown) are also referred to as part-solid nodules. A mixed nodule is a nodule that has both a ground glass nodule area and a solid nodule area inside.
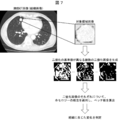
(画像解析方法の概要)
続いて、本発明の一態様に係る画像解析の流れの概要について、図7を用いて説明する。図7は、本発明の一態様に係る画像解析装置1を肺のCT画像の解析に適用した場合の処理の流れの概要を模式的に示す図である。 (Outline of image analysis method)
Subsequently, an outline of the flow of image analysis according to one aspect of the present invention will be described with reference to FIG. 7. FIG. 7 is a diagram schematically showing an outline of a processing flow when theimage analysis device 1 according to one aspect of the present invention is applied to the analysis of CT images of lungs.
続いて、本発明の一態様に係る画像解析の流れの概要について、図7を用いて説明する。図7は、本発明の一態様に係る画像解析装置1を肺のCT画像の解析に適用した場合の処理の流れの概要を模式的に示す図である。 (Outline of image analysis method)
Subsequently, an outline of the flow of image analysis according to one aspect of the present invention will be described with reference to FIG. 7. FIG. 7 is a diagram schematically showing an outline of a processing flow when the
まず、画像解析装置1は、胸部CT画像から、解析対象となる領域の画像(以後、「対象領域画像」と記す)を抽出する。次に、画像解析装置1は、抽出した対象領域画像について、二値化の基準値が異なる複数の二値化画像を生成する。
First, the image analysis device 1 extracts an image of the region to be analyzed (hereinafter referred to as "target region image") from the chest CT image. Next, the image analysis device 1 generates a plurality of binarized images having different binarization reference values for the extracted target region image.
次に、画像解析装置1は、生成した二値化画像のそれぞれについて、ホモロジーの概念を適用してベッチ数を算出し、対象領域画像を解析する。
Next, the image analysis device 1 applies the concept of homology to each of the generated binarized images, calculates the Betti number, and analyzes the target area image.
画像解析装置1は、対象領域画像を解析した結果として、肺(組織)に生じた変化を判定する。
The image analysis device 1 determines the change that has occurred in the lung (tissue) as a result of analyzing the target area image.
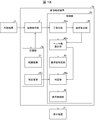
(画像解析装置1の構成)
次に、本発明の一態様に係る画像解析方法の各処理を実行する画像解析装置1の構成について、図1を用いて説明する。図1は、本発明の一態様に係る画像解析装置1の構成の一例を示すブロック図である。なお、図1では、画像解析装置1に画像を送信する外部機器8も示している。 (Configuration of image analysis device 1)
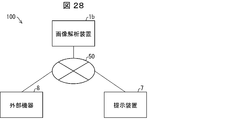
Next, the configuration of theimage analysis device 1 that executes each process of the image analysis method according to one aspect of the present invention will be described with reference to FIG. FIG. 1 is a block diagram showing an example of the configuration of the image analysis device 1 according to one aspect of the present invention. Note that FIG. 1 also shows an external device 8 that transmits an image to the image analysis device 1.
次に、本発明の一態様に係る画像解析方法の各処理を実行する画像解析装置1の構成について、図1を用いて説明する。図1は、本発明の一態様に係る画像解析装置1の構成の一例を示すブロック図である。なお、図1では、画像解析装置1に画像を送信する外部機器8も示している。 (Configuration of image analysis device 1)
Next, the configuration of the
図1に示すように、画像解析装置1は、画像取得部2、記憶部3、および制御部4を備えている。記憶部3には少なくとも、組織画像31および判定基準32が記憶されている。
As shown in FIG. 1, the image analysis device 1 includes an image acquisition unit 2, a storage unit 3, and a control unit 4. At least the tissue image 31 and the determination criterion 32 are stored in the storage unit 3.
画像取得部2は、外部機器8から、組織を撮像した組織画像を取得する。解析対象の組織が肺である場合、画像取得部2は、被検体の胸部を適当なコントラストで撮像して得られた胸部CT画像(図7参照)を外部機器8から取得する。なお、胸部CT画像のコントラストなどは、解析の対象となる組織のX線吸収率に応じて適宜設定されればよい。
The image acquisition unit 2 acquires a tissue image of the tissue from the external device 8. When the tissue to be analyzed is the lung, the image acquisition unit 2 acquires a chest CT image (see FIG. 7) obtained by imaging the chest of the subject with an appropriate contrast from the external device 8. The contrast of the chest CT image may be appropriately set according to the X-ray absorption rate of the tissue to be analyzed.
画像取得部2は、取得した胸部CT画像を記憶部3に格納する。なお、画像取得部2は、外部機器8から、胸部CT画像から肺の領域を抽出したCT画像(以下、「肺のCT画像」と記す)、または、肺のCT画像から結節影としての特徴を有する領域を輪郭に沿って切り出した画像を取得してもよい。画像取得部2は、取得した画像を後述する記憶部3に格納する構成であってもよい。あるいは画像取得部2は、取得した画像を後述する制御部4に直接出力してもよい。
The image acquisition unit 2 stores the acquired chest CT image in the storage unit 3. The image acquisition unit 2 is characterized as a nodular shadow from a CT image obtained by extracting a lung region from a chest CT image from an external device 8 (hereinafter referred to as “lung CT image”) or a lung CT image. An image obtained by cutting out a region having the above along the contour may be acquired. The image acquisition unit 2 may be configured to store the acquired image in a storage unit 3 described later. Alternatively, the image acquisition unit 2 may directly output the acquired image to the control unit 4 described later.
外部機器8は、例えば、CT装置、またはCT装置に接続されたパーソナルコンピュータであってもよいし、画像データを保存・管理しているサーバ装置であってもよい。図1では、画像解析装置1が、画像解析装置1とは別体の外部機器8から組織画像を取得する例を図示しているが、これに限定されない。例えば、画像解析装置1が外部機器8に内蔵された構成であってもよいし、画像解析装置1が外部機器8の機能を備える構成であってもよい。
The external device 8 may be, for example, a CT device or a personal computer connected to the CT device, or a server device that stores and manages image data. FIG. 1 illustrates an example in which the image analysis device 1 acquires a tissue image from an external device 8 separate from the image analysis device 1, but the present invention is not limited to this. For example, the image analysis device 1 may be configured to be built in the external device 8, or the image analysis device 1 may be configured to have the function of the external device 8.
記憶部3には、組織画像31および判定基準32に加え、制御部4が実行する各部の制御プログラム、OSプログラム、アプリケーションプログラムなどが格納されている。また、記憶部3には、これらプログラムを制御部4が実行するときに読み出す各種データが格納されている。記憶部3は、ハードディスク、フラッシュメモリなどの不揮発性の記憶装置によって構成される。なお、記憶部3の他に、上述の各種プログラムを実行する過程でデータを一時的に保持するための作業領域として使用される記憶装置であり、RAM(Random Access Memory)などの揮発性の記憶装置を備えていてもよい。
In addition to the tissue image 31 and the determination criterion 32, the storage unit 3 stores a control program, an OS program, an application program, and the like of each unit executed by the control unit 4. Further, the storage unit 3 stores various data to be read when the control unit 4 executes these programs. The storage unit 3 is composed of a non-volatile storage device such as a hard disk or a flash memory. In addition to the storage unit 3, it is a storage device used as a work area for temporarily holding data in the process of executing the above-mentioned various programs, and is a volatile storage device such as a RAM (Random Access Memory). It may be equipped with a device.
表示装置5は、制御部4から出力される情報などを表示する表示装置であり、例えば液晶ディスプレイである。表示装置5は、画像解析装置1が備える専用のディスプレイであってもよい。なお、表示装置5は、表示画面にタッチセンサが重畳されており、ユーザによる表示面へのタッチ操作を検出できる構成であってもよい。
The display device 5 is a display device that displays information and the like output from the control unit 4, and is, for example, a liquid crystal display. The display device 5 may be a dedicated display included in the image analysis device 1. The display device 5 may have a configuration in which a touch sensor is superimposed on the display screen and can detect a touch operation on the display surface by the user.
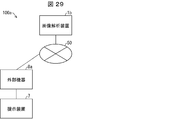
なお、図1では、画像解析装置1が別体として設けられた表示装置5(提示部)と接続されている例を図示しているが、これに限定されない。例えば、画像解析装置1が表示装置5(提示部)を内蔵する構成であってもよい。
Note that FIG. 1 illustrates an example in which the image analysis device 1 is connected to a display device 5 (presentation unit) provided as a separate body, but the present invention is not limited to this. For example, the image analysis device 1 may have a built-in display device 5 (presentation unit).
ここで、画像解析装置1と外部機器8、および、画像解析装置1と表示装置5は無線通信で接続されていてもよいし、有線通信で接続されていてもよい。
Here, the image analysis device 1 and the external device 8 and the image analysis device 1 and the display device 5 may be connected by wireless communication or by wired communication.
<制御部4の構成>
制御部4は、結節影としての特徴を有する領域など、解析対象となる領域の画像(以後、対象領域画像と記す)を解析することにより、肺結節の種類を判定し、判定結果を出力する。この制御部4は、二値化部41、ベッチ数算出部42(特徴数算出部)、基準値特定部43、判定部44、および表示制御部45を備えている。 <Structure ofcontrol unit 4>
Thecontrol unit 4 determines the type of lung nodule by analyzing an image of a region to be analyzed (hereinafter referred to as a target region image) such as a region having a characteristic as a nodule shadow, and outputs a determination result. .. The control unit 4 includes a binarization unit 41, a Betti number calculation unit 42 (feature number calculation unit), a reference value identification unit 43, a determination unit 44, and a display control unit 45.
制御部4は、結節影としての特徴を有する領域など、解析対象となる領域の画像(以後、対象領域画像と記す)を解析することにより、肺結節の種類を判定し、判定結果を出力する。この制御部4は、二値化部41、ベッチ数算出部42(特徴数算出部)、基準値特定部43、判定部44、および表示制御部45を備えている。 <Structure of
The
[二値化部41]
二値化部41は、肺のCT画像から解析対象となる対象領域画像を抽出し、該対象領域画像に対して二値化処理を行い、二値化の基準値が異なる複数の二値化画像を生成する(図7参照)。 [Binarization unit 41]
Thebinarization unit 41 extracts a target region image to be analyzed from the CT image of the lung, performs binarization processing on the target region image, and binarizes a plurality of binarizations having different reference values for binarization. Generate an image (see FIG. 7).
二値化部41は、肺のCT画像から解析対象となる対象領域画像を抽出し、該対象領域画像に対して二値化処理を行い、二値化の基準値が異なる複数の二値化画像を生成する(図7参照)。 [Binarization unit 41]
The
二値化部41は、公知の画像認識機能を備えていてもよい。これにより、外部機器8から胸部CT画像を取得した場合、二値化部41は、公知の画像認識機能によって、胸部CT画像から肺のCT画像を切り出すことが可能である。肺は周囲の組織に比べてX線吸収率が低いため、公知の画像処理の手法を用いれば、胸部CT画像から肺のCT画像を切り出すことが可能である。
The binarization unit 41 may have a known image recognition function. As a result, when the chest CT image is acquired from the external device 8, the binarization unit 41 can cut out the lung CT image from the chest CT image by the known image recognition function. Since the lung has a lower X-ray absorption rate than the surrounding tissue, it is possible to cut out a CT image of the lung from the chest CT image by using a known image processing method.
また、二値化部41は、肺のCT画像から、対象領域画像を抽出する機能をさらに備えていてもよい。画像取得部2は、抽出した対象領域画像を記憶部3に格納してもよいし、二値化部41に出力してもよい。
Further, the binarization unit 41 may further have a function of extracting a target area image from the CT image of the lung. The image acquisition unit 2 may store the extracted target area image in the storage unit 3 or output it to the binarization unit 41.
肺のCT画像から対象領域画像を抽出することが可能な二値化部41は、公知の深層学習(ディープラーニング)などの手法を適用することによって実現され得る。例えば、二値化部41は、胸部CT画像と、当該胸部CT画像から検出されるべき(または、切り出されるべき)対象領域画像(例えば、結節影としての特徴を有する画像)との対応関係を学習データとして用いた深層学習を施されていてもよい。ここで、学習データとして用いる胸部CT画像は、例えば、予め医師による読影によって結節影としての特徴が認められた領域の画像が含まれる胸部CT画像であればよい。このような深層学習を二値化部41に適用することによって、二値化部41は、胸部CT画像から抽出された肺のCT画像から対象領域画像を抽出することが可能となる。
The binarization unit 41 capable of extracting the target region image from the CT image of the lung can be realized by applying a known method such as deep learning. For example, the binarization unit 41 has a correspondence relationship between the chest CT image and the target region image (for example, an image having a feature as a nodule shadow) to be detected (or cut out) from the chest CT image. The deep learning used as the training data may be performed. Here, the chest CT image used as the training data may be, for example, a chest CT image including an image of a region in which a feature as a nodule shadow is recognized in advance by interpretation by a doctor. By applying such deep learning to the binarization unit 41, the binarization unit 41 can extract the target region image from the CT image of the lung extracted from the chest CT image.
二値化部41は、二値化処理において、二値化の基準値よりも大きい画素値(あるいは、CT値)を有する画素を白色の画素に変換し、二値化の基準値以下の画素値を有する画素を黒色の画素に変換する。このとき二値化部41は、肺を撮像した1つのCT画像に対して、二値化の基準値を変更する度に二値化処理を行い、複数の二値化画像を生成する。すなわち、二値化部41は、肺のCT画像について、二値化の基準値が異なる複数の二値化画像を複数生成する。
In the binarization process, the binarization unit 41 converts a pixel having a pixel value (or CT value) larger than the binarization reference value into a white pixel, and a pixel equal to or less than the binarization reference value. Pixels with values are converted to black pixels. At this time, the binarization unit 41 performs a binarization process on one CT image obtained by imaging the lung each time the reference value for binarization is changed, and generates a plurality of binarized images. That is, the binarization unit 41 generates a plurality of binarized images having different reference values for binarization from the CT image of the lung.
なお、本明細書では、二値化部41は、二値化の基準値を、グレースケール画像として表示した対象領域画像の各画素の画素値に基づいて設定する場合を例に挙げて説明する。すなわち、二値化部41は、二値化の基準値を0~255の範囲において設定する。例えば、二値化の基準値が画素値100に設定された場合、画素値が100以下の画素の画素値は二値化処理の結果0となり、画素値が100より高い画素の画素値は二値化処理の結果255となる。
In this specification, the binarization unit 41 describes a case where the binarization reference value is set based on the pixel value of each pixel of the target area image displayed as a grayscale image as an example. .. That is, the binarization unit 41 sets the binarization reference value in the range of 0 to 255. For example, when the reference value for binarization is set to the pixel value 100, the pixel value of a pixel having a pixel value of 100 or less becomes 0 as a result of the binarization process, and the pixel value of a pixel having a pixel value higher than 100 is two. The result of the binarization process is 255.
二値化の基準値の設定方法は、これに限定されない。例えば、二値化の基準値は、肺を撮像対象とする胸部CT画像において一般的に設定されるCT値-1000~-700HUの範囲において設定されてもよい。二値化の基準値を-900HUに設定した場合、CT値が-900HU以下の画素の画素値は二値化処理の結果0となり、CT値が-900HUより高い画素の画素値は二値化処理の結果255となる。
The method of setting the reference value for binarization is not limited to this. For example, the reference value for binarization may be set in the range of CT value −1000 to −700 HU, which is generally set in a chest CT image in which the lung is to be imaged. When the binarization reference value is set to -900HU, the pixel value of the pixel whose CT value is -900HU or less becomes 0 as a result of the binarization process, and the pixel value of the pixel whose CT value is higher than -900HU is binarized. The result of the processing is 255.
二値化部41は、二値化処理の前に、対象領域画像におけるCT値の範囲を限定してもよい。肺のCT画像では、CT値が0HU~1000HUの範囲である領域は無視されるため、例えば、二値化処理の対象を、CT値が-1000HU~0HUの範囲に限定してもよい。この場合、-1000HU~0HUの範囲のCT値が、0~255の範囲の画素値に対応付けられる。例えば、255×(CT値)/(対象領域画像におけるCT値の範囲)の値の小数点以下を四捨五入して得られる値を、CT値に対応する画素値として決定すればよい。
The binarization unit 41 may limit the range of CT values in the target area image before the binarization process. In the CT image of the lung, the region where the CT value is in the range of 0HU to 1000HU is ignored. Therefore, for example, the target of the binarization process may be limited to the range where the CT value is −1000HU to 0HU. In this case, the CT value in the range of −1000HU to 0HU is associated with the pixel value in the range of 0 to 255. For example, a value obtained by rounding off the decimal point of the value of 255 × (CT value) / (range of CT value in the target area image) may be determined as the pixel value corresponding to the CT value.
[ベッチ数算出部42]
ベッチ数算出部42は、複数の二値化画像のそれぞれについて、第1画素値と第2画素値とに二値化された後における一方の画素値(第1画素値)の画素に囲まれた、該二値化後における他方の画素値(第2画素値)の画素からなる穴形状の領域の数を示す1次元ベッチ数b1を算出する。 [Betti number calculation unit 42]
The Betchnumber calculation unit 42 is surrounded by pixels of one pixel value (first pixel value) after being binarized to the first pixel value and the second pixel value for each of the plurality of binarized images. In addition, the one-dimensional vetch number b1 indicating the number of hole-shaped regions composed of pixels of the other pixel value (second pixel value) after the binarization is calculated.
ベッチ数算出部42は、複数の二値化画像のそれぞれについて、第1画素値と第2画素値とに二値化された後における一方の画素値(第1画素値)の画素に囲まれた、該二値化後における他方の画素値(第2画素値)の画素からなる穴形状の領域の数を示す1次元ベッチ数b1を算出する。 [Betti number calculation unit 42]
The Betch
ベッチ数算出部42は、複数の前記二値化画像のそれぞれについて、第1画素値と第2画素値とに二値化された後における一方の画素値(第1画素値)が連結して成る連結領域の数を示す0次元ベッチ数b0をさらに算出してもよい。
In the Betti number calculation unit 42, for each of the plurality of the binarized images, one pixel value (first pixel value) after being binarized into the first pixel value and the second pixel value is concatenated. The 0-dimensional Betti number b0 indicating the number of connected regions including the above may be further calculated.
上記連結領域は、例えば、二値化処理後の画素値が0である画素が隣接しつつ集まった領域である。それぞれの連結領域は、二値化処理後の画素値が255である画素によって囲まれており、互いに独立している領域である。
The connection area is, for example, an area in which pixels having a pixel value of 0 after binarization processing are adjacent to each other. Each connected region is surrounded by pixels having a pixel value of 255 after the binarization process, and is an region independent of each other.
上記穴は、1つ以上の構成成分の外縁の少なくとも一部(構成成分が1つの場合には、その構成成分の外縁の全部)をその外縁として有している開口部である。換言すれば、構成成分の外縁によって囲まれた穴には、1つの構成成分がその内部に有する穴と、互いに連結した複数の構成成分がそれぞれ有する外縁によって囲まれた穴とが含まれる。
The hole is an opening having at least a part of the outer edge of one or more components (in the case of one component, the entire outer edge of the component) as the outer edge. In other words, the hole surrounded by the outer edge of the component includes a hole contained therein by one component and a hole surrounded by an outer edge each of a plurality of components connected to each other.
なお、ベッチ数算出部42によって算出される1次元ベッチ数b1および0次元ベッチ数b0の値は、対象領域画像に撮像されている領域の面積に依存する。それゆえ、ベッチ数算出部42は、撮像されている領域の面積が等しい対象領域画像の1次元ベッチ数b1および0次元ベッチ数b0を算出することが望ましい。
The values of the one-dimensional Betti number b1 and the zero-dimensional Betti number b0 calculated by the Betti number calculation unit 42 depend on the area of the region captured in the target region image. Therefore, it is desirable that the Betti number calculation unit 42 calculates the one-dimensional Betti number b1 and the zero-dimensional Betti number b0 of the target area images having the same area of the captured area.
また、ベッチ数算出部42は、複数の前記二値化画像のそれぞれについての、1次元ベッチ数b1と0次元ベッチ数b0との比をさらに算出してもよい。なお、本明細書では、1次元ベッチ数b1を0次元ベッチ数b0で除した値(b1/b0)を算出した場合を例に挙げて説明するが、1次元ベッチ数b1と0次元ベッチ数b0との比は、b1/b0およびb0/b1のいずれであってもよい。
Further, the Betti number calculation unit 42 may further calculate the ratio of the one-dimensional Betti number b1 and the zero-dimensional Betti number b0 for each of the plurality of the binarized images. In this specification, the case where the value (b1 / b0) obtained by dividing the one-dimensional Betti number b1 by the 0-dimensional Betti number b0 is calculated will be described as an example, but the one-dimensional Betti number b1 and the 0-dimensional Betti number will be described. The ratio to b0 may be either b1 / b0 or b0 / b1.
ベッチ数算出部42として、既存のプログラムを用いてもよい。このようなプログラムの一例としてCHomPを挙げることができる。CHomPは、GNU(General PublicLicense)に準拠したフリーウェアであり、ホームページ(http://chomp.rutgers.edu/)からダウンロードできる。なお、これに限定されるものではなく、画像に関する0次元ベッチ数b0および1次元ベッチ数b1を算出できるプログラムであれば、CHomP以外のプログラムを用いてもよい。
An existing program may be used as the Betti number calculation unit 42. CHomP can be mentioned as an example of such a program. CHomP is GNU (General Public License) compliant freeware and can be downloaded from the homepage (http://chomp.rutgers.edu/). The program is not limited to this, and any program other than ChomP may be used as long as it is a program capable of calculating the 0-dimensional Betti number b0 and the 1-dimensional Betti number b1 related to the image.
[基準値特定部43]
基準値特定部43は、二値化部41によって生成された複数の二値化画像のうち、1次元ベッチ数b1が最大となる二値化画像を特定する。さらに、基準値特定部43は、第1基準値Taおよび最大1次元ベッチ数Va(最大第1特徴数)を特定する。ここで、第1基準値Taは、特定した二値化画像における二値化の基準値である。また、最大1次元ベッチ数Vaは、特定した二値化画像における1次元ベッチ数b1である。 [Reference value specifying unit 43]
The referencevalue specifying unit 43 identifies the binarized image having the maximum one-dimensional Betti number b1 among the plurality of binarized images generated by the binarized unit 41. Further, the reference value specifying unit 43 specifies the first reference value Ta and the maximum one-dimensional Betti number Va (maximum number of first features). Here, the first reference value Ta is a reference value for binarization in the specified binarized image. Further, the maximum one-dimensional Betti number Va is the one-dimensional Betti number b1 in the specified binarized image.
基準値特定部43は、二値化部41によって生成された複数の二値化画像のうち、1次元ベッチ数b1が最大となる二値化画像を特定する。さらに、基準値特定部43は、第1基準値Taおよび最大1次元ベッチ数Va(最大第1特徴数)を特定する。ここで、第1基準値Taは、特定した二値化画像における二値化の基準値である。また、最大1次元ベッチ数Vaは、特定した二値化画像における1次元ベッチ数b1である。 [Reference value specifying unit 43]
The reference
また、基準値特定部43は、b1/b0が最大値となる二値化画像を特定してもよい。基準値特定部43は、特定した二値化画像における二値化の基準値を示す第3基準値Tc、および特定した二値化画像におけるb1/b0の値R(以後、「b1/b0の最大値R」と記す)(最大第3特徴数)をさらに特定してもよい。
Further, the reference value specifying unit 43 may specify a binarized image in which b1 / b0 is the maximum value. The reference value specifying unit 43 has a third reference value Tc indicating a reference value for binarization in the specified binarized image, and a value R of b1 / b0 in the specified binarized image (hereinafter, "b1 / b0". (Maximum value R) (maximum number of third features) may be further specified.
なお、基準値特定部43は、0次元ベッチ数、1次元ベッチ数、およびb1/b0の二値化の基準値の変化に伴う変化をプロットしたグラフを生成してもよい。基準値特定部43は、生成したグラフから、第1基準値Ta、最大1次元ベッチ数Va、第2基準値Tb、最大0次元ベッチ数Vb、第3基準値Tc、b1/b0の最大値Rなどを読取ることができる。
Note that the reference value specifying unit 43 may generate a graph plotting the number of 0-dimensional Betti numbers, the number of 1-dimensional Betti numbers, and the changes accompanying changes in the reference value for binarization of b1 / b0. From the generated graph, the reference value specifying unit 43 is the maximum value of the first reference value Ta, the maximum one-dimensional Betti number Va, the second reference value Tb, the maximum 0-dimensional Betti number Vb, the third reference value Tc, and b1 / b0. R and the like can be read.
[判定部44]
判定部44は、下記(1)および(2)に基づいて、肺に生じた変化を判定する。 [Judgment unit 44]
Thedetermination unit 44 determines the changes that have occurred in the lungs based on the following (1) and (2).
判定部44は、下記(1)および(2)に基づいて、肺に生じた変化を判定する。 [Judgment unit 44]
The
(1)第1基準値Ta
(2)最大1次元ベッチ数Va
なお、判定部44は、肺に生じた変化を判定するための判定基準32を参照する構成であってもよい。判定基準32については後に具体例を挙げて説明する。 (1) First reference value Ta
(2) Maximum one-dimensional Betti number Va
Thedetermination unit 44 may be configured to refer to the determination criterion 32 for determining the change that has occurred in the lungs. The determination criterion 32 will be described later with a specific example.
(2)最大1次元ベッチ数Va
なお、判定部44は、肺に生じた変化を判定するための判定基準32を参照する構成であってもよい。判定基準32については後に具体例を挙げて説明する。 (1) First reference value Ta
(2) Maximum one-dimensional Betti number Va
The
判定部44による、対象領域画像に対する判定の精度は、公知の深層学習(ディープラーニング)などの手法を適用することによって向上させることが可能である。例えば、深層学習において、下記の(教師データ)などが使用され得る。
(教師データ)判定部44が対象領域画像についての判定に用いた上記パラメータ(例えば、上記(1)~(6)など)と、該対象領域画像について医師によって判断された結果との組み合わせを含むデータ。 The accuracy of the determination of the target region image by thedetermination unit 44 can be improved by applying a known method such as deep learning. For example, in deep learning, the following (teacher data) and the like can be used.
(Teacher data) Includes a combination of the above parameters (for example, (1) to (6) above) used by thedetermination unit 44 to determine the target area image and the result determined by the doctor for the target area image. data.
(教師データ)判定部44が対象領域画像についての判定に用いた上記パラメータ(例えば、上記(1)~(6)など)と、該対象領域画像について医師によって判断された結果との組み合わせを含むデータ。 The accuracy of the determination of the target region image by the
(Teacher data) Includes a combination of the above parameters (for example, (1) to (6) above) used by the
[表示制御部45]
表示制御部45は、判定部44から出力される判定結果を示す情報を、表示装置5に表示させる。なお、表示制御部45は、判定結果を示す情報と共に、対象領域画像を抽出するために用いた胸部CT画像(または、肺のCT画像)を表示装置5に表示させてもよい。 [Display control unit 45]
Thedisplay control unit 45 causes the display device 5 to display information indicating the determination result output from the determination unit 44. The display control unit 45 may display the chest CT image (or lung CT image) used for extracting the target area image on the display device 5 together with the information indicating the determination result.
表示制御部45は、判定部44から出力される判定結果を示す情報を、表示装置5に表示させる。なお、表示制御部45は、判定結果を示す情報と共に、対象領域画像を抽出するために用いた胸部CT画像(または、肺のCT画像)を表示装置5に表示させてもよい。 [Display control unit 45]
The
また、表示制御部45は、対象領域画像の胸部CT画像(または肺のCT画像)における位置を示す情報を、判定結果および胸部CT画像(または肺のCT画像)と共に表示装置5に表示させてもよい。
Further, the display control unit 45 causes the display device 5 to display information indicating the position of the target area image in the chest CT image (or lung CT image) together with the determination result and the chest CT image (or lung CT image). May be good.
このように構成すれば、画像解析装置1は、胸部CT画像(または肺のCT画像)における対象領域画像をユーザに視認させつつ、判定結果を提示することができる。ここで、ユーザには、医師、検査技師、研究者などが含まれ得る。
With this configuration, the image analysis device 1 can present the determination result while allowing the user to visually recognize the target area image in the chest CT image (or lung CT image). Here, the user may include a doctor, a laboratory engineer, a researcher, and the like.
なお、判定結果をユーザに提示する方法は所望の態様であってもよい。例えば、図1に示すように、表示装置5に判定結果が表示される構成であってもよいし、プリンター(図示せず)およびスピーカー(図示せず)などから出力される構成であってもよい。
The method of presenting the determination result to the user may be in a desired mode. For example, as shown in FIG. 1, the determination result may be displayed on the display device 5, or may be output from a printer (not shown), a speaker (not shown), or the like. Good.
(画像解析装置1が行う処理の流れ)
画像解析装置1が行う処理の流れについて、適宜、図9~図12を参照しながら、図8を用いて説明する。図8は、画像解析装置1が行う処理の流れの一例を示すフローチャートである。 (Flow of processing performed by the image analysis device 1)
The flow of processing performed by theimage analysis apparatus 1 will be described with reference to FIGS. 9 to 12 as appropriate. FIG. 8 is a flowchart showing an example of the flow of processing performed by the image analysis apparatus 1.
画像解析装置1が行う処理の流れについて、適宜、図9~図12を参照しながら、図8を用いて説明する。図8は、画像解析装置1が行う処理の流れの一例を示すフローチャートである。 (Flow of processing performed by the image analysis device 1)
The flow of processing performed by the
まず、画像取得部2は、外部機器8から組織を撮像した組織画像を取得する(ステップS1)。
First, the image acquisition unit 2 acquires a tissue image obtained by capturing the tissue from the external device 8 (step S1).
次に、二値化部41は、組織画像から対象領域画像を抽出し、対象領域画像について、二値化の基準値が異なる複数の二値化画像を生成する(ステップS2:二値化ステップ)。
Next, the binarization unit 41 extracts the target area image from the tissue image, and generates a plurality of binarized images having different reference values for binarization for the target area image (step S2: binarization step). ).
次に、ベッチ数算出部42は、複数の二値化画像のそれぞれについて、1次元ベッチ数b1を算出する(ステップS3:特徴数算出ステップ)。
Next, the Betti number calculation unit 42 calculates the one-dimensional Betti number b1 for each of the plurality of binarized images (step S3: feature number calculation step).
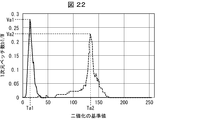
図9は、結節が生じていない肺野、および肺血管の領域について生成した二値化画像において、二値化の基準値を変化させたことに伴う1次元ベッチ数b1の変化をプロットしたグラフである。図9において、結節が生じていない肺野の対象領域画像についての1次元ベッチ数b1は実線で示されており、肺血管の対象領域画像についての1次元ベッチ数b1は破線で示されている。
FIG. 9 is a graph plotting the change in the one-dimensional Betti number b1 due to the change in the binarization reference value in the binarized image generated for the lung field without nodules and the region of the pulmonary blood vessel. Is. In FIG. 9, the one-dimensional Betti number b1 for the target area image of the lung field without nodules is shown by a solid line, and the one-dimensional Betti number b1 for the target area image of the pulmonary blood vessel is shown by a broken line. ..
一方、図10は、充実型結節の領域、およびすりガラス型結節の対象領域画像について生成した二値化画像において、二値化の基準値を変化させたことに伴う1次元ベッチ数b1の変化をプロットしたグラフである。図10において、充実型結節の対象領域画像についての1次元ベッチ数b1は実線で示されており、すりガラス型結節の対象領域画像についての1次元ベッチ数b1は破線で示されている。
On the other hand, FIG. 10 shows the change in the one-dimensional Betti number b1 due to the change in the binarization reference value in the binarized image generated for the solid nodule region and the target region image of the frosted glass nodule. It is a plotted graph. In FIG. 10, the one-dimensional Betti number b1 for the target area image of the solid nodule is shown by a solid line, and the one-dimensional Betti number b1 for the target area image of the frosted glass type nodule is shown by a broken line.
図8に戻り、基準値特定部43は、1次元ベッチ数b1が最大となる二値化画像を特定し、第1基準値Ta、および最大1次元ベッチ数Vaを特定する(ステップS4:基準値特定ステップ)。
Returning to FIG. 8, the reference value specifying unit 43 specifies the binarized image having the maximum one-dimensional Betti number b1, and specifies the first reference value Ta and the maximum one-dimensional Betti number Va (step S4: reference). Value identification step).
続いて、判定部44は、第1基準値Taおよび最大1次元ベッチ数Vaに基づいて、肺に生じた変化を判定する(ステップS5:判定ステップ)。
Subsequently, the determination unit 44 determines the change occurring in the lung based on the first reference value Ta and the maximum one-dimensional Betti number Va (step S5: determination step).
図11は、対象領域画像毎の、第1基準値Taと、最大1次元ベッチ数Vaとをプロットしたグラフである。図11に示すように、基準値特定部43によって特定された第1基準値Taと、最大1次元ベッチ数Vaとの組み合わせは、群A~群Dの4つの群に明確に分かれる。具体的には、群Aは、充実型結節の対象領域画像における第1基準値Taと最大1次元ベッチ数Vaとをプロットした点である。群Bは、肺血管の対象領域画像における第1基準値Taと最大1次元ベッチ数Vaとをプロットした点である。群Cは、結節が生じていない肺野の対象領域画像における第1基準値Taと最大1次元ベッチ数Vaとをプロットした点である。群Dは、すりガラス型結節の対象領域画像における第1基準値Taと最大1次元ベッチ数Vaとをプロットした点である。このように、第1基準値Taおよび最大1次元ベッチ数Vaに基づいて、対象領域画像が、結節が生じていない肺野、肺血管、充実型結節、すりガラス型結節のいずれであるかを判定することができる。
FIG. 11 is a graph in which the first reference value Ta and the maximum one-dimensional Betti number Va are plotted for each target area image. As shown in FIG. 11, the combination of the first reference value Ta specified by the reference value specifying unit 43 and the maximum one-dimensional Betti number Va is clearly divided into four groups A to D. Specifically, the group A is a point obtained by plotting the first reference value Ta and the maximum one-dimensional Betti number Va in the target region image of the solid nodule. Group B is a point obtained by plotting the first reference value Ta and the maximum one-dimensional Betti number Va in the target area image of the pulmonary blood vessel. Group C is a plot of the first reference value Ta and the maximum one-dimensional Betti number Va in the target area image of the lung field where no nodules are formed. Group D is a plot of the first reference value Ta and the maximum one-dimensional Betti number Va in the target area image of the ground glass type nodule. In this way, based on the first reference value Ta and the maximum one-dimensional Betti number Va, it is determined whether the target area image is a nodule-free lung field, a pulmonary blood vessel, a solid nodule, or a frosted glass nodule. can do.
図12は、判定基準32の一例を示す図である。判定部44は、対象領域画像について特定された第1基準値Taおよび最大1次元ベッチ数Vaと、判定基準32に規定されている第1基準値Taおよび最大1次元ベッチ数Vaとを比較して、下記に記すように肺に生じた変化を判定する。
・判定部44は、対象領域画像について特定された第1基準値Taが70~100であり、最大1次元ベッチ数Vaが10~25である場合、該対象領域画像は結節が生じていない肺野の画像であると判定する。
・判定部44は、対象領域画像について特定された第1基準値Taが120~180であり、最大1次元ベッチ数Vaが2~10である場合、該対象領域画像はすりガラス型結節の画像であると判定する。
・判定部44は、対象領域画像について特定された第1基準値Taが180~255であり、最大1次元ベッチ数Vaが2~10である場合、該対象領域画像は肺血管の画像であると判定する。
・判定部44は、対象領域画像について特定された第1基準値Taが180~255であり、最大1次元ベッチ数Vaが10~50である場合、該対象領域画像は充実型結節の画像であると判定する。 FIG. 12 is a diagram showing an example of thedetermination criterion 32. The determination unit 44 compares the first reference value Ta and the maximum one-dimensional Betti number Va specified for the target area image with the first reference value Ta and the maximum one-dimensional Betti number Va defined in the determination reference 32. Then, the changes occurring in the lungs are determined as described below.
When the first reference value Ta specified for the target area image is 70 to 100 and the maximum one-dimensional Betti number Va is 10 to 25, thedetermination unit 44 determines that the target area image is a lung without nodules. Judged as a field image.
When the first reference value Ta specified for the target area image is 120 to 180 and the maximum one-dimensional Betti number Va is 2 to 10, the target area image is an image of a frosted glass type nodule. Judge that there is.
When the first reference value Ta specified for the target area image is 180 to 255 and the maximum one-dimensional Betti number Va is 2 to 10, the target area image is an image of a pulmonary blood vessel. Is determined.
When the first reference value Ta specified for the target area image is 180 to 255 and the maximum one-dimensional Betti number Va is 10 to 50, the target area image is an image of a solid nodule. Judge that there is.
・判定部44は、対象領域画像について特定された第1基準値Taが70~100であり、最大1次元ベッチ数Vaが10~25である場合、該対象領域画像は結節が生じていない肺野の画像であると判定する。
・判定部44は、対象領域画像について特定された第1基準値Taが120~180であり、最大1次元ベッチ数Vaが2~10である場合、該対象領域画像はすりガラス型結節の画像であると判定する。
・判定部44は、対象領域画像について特定された第1基準値Taが180~255であり、最大1次元ベッチ数Vaが2~10である場合、該対象領域画像は肺血管の画像であると判定する。
・判定部44は、対象領域画像について特定された第1基準値Taが180~255であり、最大1次元ベッチ数Vaが10~50である場合、該対象領域画像は充実型結節の画像であると判定する。 FIG. 12 is a diagram showing an example of the
When the first reference value Ta specified for the target area image is 70 to 100 and the maximum one-dimensional Betti number Va is 10 to 25, the
When the first reference value Ta specified for the target area image is 120 to 180 and the maximum one-dimensional Betti number Va is 2 to 10, the target area image is an image of a frosted glass type nodule. Judge that there is.
When the first reference value Ta specified for the target area image is 180 to 255 and the maximum one-dimensional Betti number Va is 2 to 10, the target area image is an image of a pulmonary blood vessel. Is determined.
When the first reference value Ta specified for the target area image is 180 to 255 and the maximum one-dimensional Betti number Va is 10 to 50, the target area image is an image of a solid nodule. Judge that there is.
表示制御部45は、判定結果を表示装置5に出力する(ステップS6)。
The display control unit 45 outputs the determination result to the display device 5 (step S6).
なお、図9~図11に示すグラフは、-1000HU~0HUの範囲のCT値を、0~255の範囲の画素値に対応付けられた対象領域画像に対して、二値化部41が二値化処理を行った二値化画像を用いて描画されている。判定基準32における第1基準値Taの値は、二値化部41が二値化処理の前に、対象領域画像におけるCT値の範囲をどのように限定したかに応じて変化する。それゆえ、二値化部41が二値化処理を行う前に、対象領域画像におけるCT値の範囲を限定する場合、対象領域画像のCT値の範囲を揃えておくことが重要である。
In the graphs shown in FIGS. 9 to 11, the binarization unit 41 has two CT values in the range of −1000HU to 0HU with respect to the target area image in which the CT values in the range of −1000HU to 0HU are associated with the pixel values in the range of 0 to 255. It is drawn using a binarized image that has been binarized. The value of the first reference value Ta in the determination standard 32 changes depending on how the binarization unit 41 limits the range of the CT value in the target area image before the binarization process. Therefore, when limiting the range of CT values in the target area image before the binarization unit 41 performs the binarization process, it is important to align the range of CT values in the target area image.
上記の構成によれば、画像解析装置1は、結節影などの対象領域画像について二値化の基準値が異なる複数の二値化画像を生成し、二値化画像のそれぞれについて、1次元ベッチ数を算出する。そして、画像解析装置1は、1次元ベッチ数が最大となる二値化画像を特定し、特定した二値化画像から第1基準値Taと最大1次元ベッチ数Vaを特定する。画像解析装置1は、特定した第1基準値Taと最大1次元ベッチ数Vaに基づいて、肺結節か否か、および如何なる種類の肺結節であるかを判定する。このように構成すれば、対象領域画像が肺に生じている変化の有無および変化の種類を、肺に生じた変化の構造上の特性に基づいて精度良く判定することができる。
According to the above configuration, the image analysis device 1 generates a plurality of binarized images having different binarization reference values for the target area image such as a nodule shadow, and one-dimensional vetch for each of the binarized images. Calculate the number. Then, the image analysis device 1 specifies the binarized image having the maximum one-dimensional Betti number, and specifies the first reference value Ta and the maximum one-dimensional Betti number Va from the specified binarized image. The image analysis apparatus 1 determines whether or not the lung nodule is a lung nodule and what kind of lung nodule it is, based on the specified first reference value Ta and the maximum one-dimensional Betti number Va. With this configuration, the presence or absence of changes in the target region image in the lungs and the types of changes can be accurately determined based on the structural characteristics of the changes in the lungs.
肺に生じた病変部位は、周囲とは異なる画像として視認され得る。画像解析装置1は、解析対象となる領域の画像が有する性状をホモロジーの概念を用いて数学的に解析し、該解析結果に基づいて肺に生じた変化を判定する。すなわち、画像解析装置1による判定結果は、画像診断における医師による診断結果と同様、対象領域画像の性状に根拠がある。それゆえ、画像解析装置1は、ユーザが容易に理解可能な判定結果を出力することが可能である。肺以外の組織に生じた病変部位にも、周囲とは異なる画像として視認され得るものが多く知られている。画像解析装置1は、画像診断によって発見され得る任意の病変部位の有無および種類を高精度で判定することが可能である。
The lesion site in the lung can be visually recognized as an image different from the surrounding image. The image analysis device 1 mathematically analyzes the properties of the image of the region to be analyzed using the concept of homology, and determines the changes that have occurred in the lungs based on the analysis results. That is, the determination result by the image analysis device 1 is based on the properties of the target area image, similar to the diagnosis result by the doctor in the image diagnosis. Therefore, the image analysis device 1 can output a determination result that can be easily understood by the user. It is well known that many lesions that occur in tissues other than the lung can be visually recognized as images different from those around them. The image analysis apparatus 1 can determine with high accuracy the presence or absence and type of any lesion site that can be detected by image diagnosis.
〔実施形態2〕
本発明の他の実施形態について、以下に説明する。なお、説明の便宜上、上記実施形態にて説明した部材と同じ機能を有する部材については、同じ符号を付記し、その説明を繰り返さない。本実施形態では、ベッチ数算出部42が算出した0次元ベッチ数b0も利用して、肺に生じた変化を判定する構成である。 [Embodiment 2]
Other embodiments of the present invention will be described below. For convenience of explanation, the same reference numerals will be added to the members having the same functions as the members described in the above embodiment, and the description will not be repeated. In the present embodiment, the 0-dimensional Betti number b0 calculated by the Bettinumber calculation unit 42 is also used to determine the change that has occurred in the lungs.
本発明の他の実施形態について、以下に説明する。なお、説明の便宜上、上記実施形態にて説明した部材と同じ機能を有する部材については、同じ符号を付記し、その説明を繰り返さない。本実施形態では、ベッチ数算出部42が算出した0次元ベッチ数b0も利用して、肺に生じた変化を判定する構成である。 [Embodiment 2]
Other embodiments of the present invention will be described below. For convenience of explanation, the same reference numerals will be added to the members having the same functions as the members described in the above embodiment, and the description will not be repeated. In the present embodiment, the 0-dimensional Betti number b0 calculated by the Betti
[基準値特定部43]
基準値特定部43は、二値化部41によって生成された複数の二値化画像のうち、0次元ベッチ数b0が最大となる二値化画像をさらに特定してもよい。そして、基準値特定部43は、第2基準値Tbおよび最大0次元ベッチ数Vb(最大第2特徴数)を特定する。ここで、第2基準値Tbは、特定した二値化画像における二値化の基準値である。また、最大0次元ベッチ数Vbは、特定した二値化画像における0次元ベッチ数b0である。 [Reference value specifying unit 43]
The referencevalue specifying unit 43 may further specify the binarized image having the maximum 0-dimensional Betti number b0 among the plurality of binarized images generated by the binarized unit 41. Then, the reference value specifying unit 43 specifies the second reference value Tb and the maximum 0-dimensional Betti number Vb (maximum number of second features). Here, the second reference value Tb is the reference value for binarization in the specified binarized image. Further, the maximum 0-dimensional Betti number Vb is the 0-dimensional Betti number b0 in the specified binarized image.
基準値特定部43は、二値化部41によって生成された複数の二値化画像のうち、0次元ベッチ数b0が最大となる二値化画像をさらに特定してもよい。そして、基準値特定部43は、第2基準値Tbおよび最大0次元ベッチ数Vb(最大第2特徴数)を特定する。ここで、第2基準値Tbは、特定した二値化画像における二値化の基準値である。また、最大0次元ベッチ数Vbは、特定した二値化画像における0次元ベッチ数b0である。 [Reference value specifying unit 43]
The reference
なお、基準値特定部43は、二値化の基準値の変化に伴う0次元ベッチ数および1次元ベッチ数の変化をプロットしたグラフを生成してもよい。基準値特定部43は、生成したグラフから、第1基準値Ta、最大1次元ベッチ数Va、第2基準値Tb、および最大0次元ベッチ数Vbなどを読取ることができる。
The reference value specifying unit 43 may generate a graph plotting the changes in the number of 0-dimensional Betti numbers and the number of 1-dimensional Betti numbers accompanying the change in the reference value for binarization. The reference value specifying unit 43 can read the first reference value Ta, the maximum one-dimensional Betti number Va, the second reference value Tb, the maximum 0-dimensional Betti number Vb, and the like from the generated graph.
[判定部44]
判定部44は、下記の(1)~(4)に基づいて、肺に生じた変化を判定する。 [Judgment unit 44]
Thedetermination unit 44 determines the changes that have occurred in the lungs based on the following (1) to (4).
判定部44は、下記の(1)~(4)に基づいて、肺に生じた変化を判定する。 [Judgment unit 44]
The
(1)第1基準値Ta
(2)最大1次元ベッチ数Va
(3)第2基準値Tb
(4)最大0次元ベッチ数Vb。 (1) First reference value Ta
(2) Maximum one-dimensional Betti number Va
(3) Second reference value Tb
(4) Maximum 0-dimensional Betti number Vb.
(2)最大1次元ベッチ数Va
(3)第2基準値Tb
(4)最大0次元ベッチ数Vb。 (1) First reference value Ta
(2) Maximum one-dimensional Betti number Va
(3) Second reference value Tb
(4) Maximum 0-dimensional Betti number Vb.
(画像解析装置1が行う処理の流れ)
本実施形態に係る画像解析装置1が行う処理の流れについて、適宜、図14~図17を参照しながら、図13を用いて説明する。図13は、本発明の別の態様に係る画像解析装置における処理の流れの一例を示すフローチャートである。 (Flow of processing performed by the image analysis device 1)
The flow of processing performed by theimage analysis apparatus 1 according to the present embodiment will be described with reference to FIGS. 14 to 17 as appropriate. FIG. 13 is a flowchart showing an example of a processing flow in the image analysis apparatus according to another aspect of the present invention.
本実施形態に係る画像解析装置1が行う処理の流れについて、適宜、図14~図17を参照しながら、図13を用いて説明する。図13は、本発明の別の態様に係る画像解析装置における処理の流れの一例を示すフローチャートである。 (Flow of processing performed by the image analysis device 1)
The flow of processing performed by the
まず、画像取得部2は、外部機器8から組織を撮像した組織画像を取得する(ステップS11)。
First, the image acquisition unit 2 acquires a tissue image obtained by capturing the tissue from the external device 8 (step S11).
次に、二値化部41は、組織画像から対象領域画像を抽出し、対象領域画像について、二値化の基準値が異なる複数の二値化画像を生成する(ステップS12:二値化ステップ)。なお、図14~図16に示すグラフは、-1000HU~0HUの範囲のCT値を、0~255の範囲の画素値に対応付けられた対象領域画像に対して、二値化部41が二値化処理を行った二値化画像を用いて描画されている。
Next, the binarization unit 41 extracts the target area image from the tissue image, and generates a plurality of binarized images having different reference values for binarization for the target area image (step S12: binarization step). ). In the graphs shown in FIGS. 14 to 16, the binarization unit 41 has two CT values in the range of −1000HU to 0HU with respect to the target area image in which the CT values in the range of −1000HU to 0HU are associated with the pixel values in the range of 0 to 255. It is drawn using a binarized image that has been binarized.
次に、ベッチ数算出部42は、複数の二値化画像のそれぞれについて、1次元ベッチ数b1および0次元ベッチ数b0を算出する(ステップS13:特徴数算出ステップ)。
Next, the Betti number calculation unit 42 calculates the one-dimensional Betti number b1 and the zero-dimensional Betti number b0 for each of the plurality of binarized images (step S13: feature number calculation step).
図14は、結節が生じていない肺野、および肺血管の領域について生成した二値化画像において、二値化の基準値を変化させたことに伴う0次元ベッチ数b0の変化をプロットしたグラフである。図14において、結節が生じていない肺野の対象領域画像についての0次元ベッチ数b0は実線で示されており、肺血管の対象領域画像についての0次元ベッチ数b0は破線で示されている。
FIG. 14 is a graph plotting the change in the 0-dimensional Betti number b0 due to the change in the binarization reference value in the binarized image generated for the lung field without nodules and the region of the pulmonary blood vessel. Is. In FIG. 14, the 0-dimensional Betti number b0 for the target area image of the lung field without nodules is shown by a solid line, and the 0-dimensional Betti number b0 for the target area image of the pulmonary blood vessel is shown by a broken line. ..
一方、図15は、充実型結節の領域、およびすりガラス型結節の対象領域画像について生成した二値化画像において、二値化の基準値を変化させたことに伴う0次元ベッチ数b0の変化をプロットしたグラフである。図10において、充実型結節の対象領域画像についての0次元ベッチ数b0は実線で示されており、すりガラス型結節の対象領域画像についての0次元ベッチ数b0は破線で示されている。
On the other hand, FIG. 15 shows the change in the 0-dimensional Betti number b0 due to the change of the binarization reference value in the binarized image generated for the solid nodule region and the target region image of the frosted glass nodule. It is a plotted graph. In FIG. 10, the 0-dimensional Betti number b0 for the target area image of the solid nodule is shown by a solid line, and the 0-dimensional Betti number b0 for the target area image of the frosted glass type nodule is shown by a broken line.
図13に戻り、基準値特定部43は、1次元ベッチ数b1が最大となる二値化画像、および、0次元ベッチ数b0が最大となる二値化画像をそれぞれ特定する。そして、基準値特定部43は、特定した二値化画像について、第1基準値Ta、最大1次元ベッチ数Va、第2基準値Tb、および最大0次元ベッチ数Vbを特定する(ステップS14:基準値特定ステップ)。
Returning to FIG. 13, the reference value specifying unit 43 identifies the binarized image in which the one-dimensional Betti number b1 is the maximum and the binarized image in which the zero-dimensional Betti number b0 is the maximum. Then, the reference value specifying unit 43 specifies the first reference value Ta, the maximum one-dimensional Betti number Va, the second reference value Tb, and the maximum 0-dimensional Betti number Vb for the specified binarized image (step S14: Reference value identification step).
続いて、判定部44は、第1基準値Ta、最大1次元ベッチ数Va、第2基準値Tb、および最大0次元ベッチ数Vbに基づいて、肺に生じた変化を判定する(ステップS15:判定ステップ)。
Subsequently, the determination unit 44 determines the change occurring in the lung based on the first reference value Ta, the maximum one-dimensional Betti number Va, the second reference value Tb, and the maximum 0-dimensional Betti number Vb (step S15: Judgment step).
図16は、対象領域画像毎の、第2基準値Tbと、最大0次元ベッチ数Vbとをプロットしたグラフである。図16に示すように、基準値特定部43によって特定された第2基準値Tbと、最大0次元ベッチ数Vbとの組み合わせは、群E~群Hの4つの群に明確に分かれる。具体的には、群Eは、充実型結節の対象領域画像における第2基準値Tbと最大0次元ベッチ数Vbとをプロットした点である。群Fは、肺血管の対象領域画像における第2基準値Tbと最大0次元ベッチ数Vbとをプロットした点である。群Gは、結節が生じていない肺野の対象領域画像における第2基準値Tbと最大0次元ベッチ数Vbとをプロットした点である。群Hは、すりガラス型結節の対象領域画像における第2基準値Tbと最大0次元ベッチ数Vbとをプロットした点である。このように、第2基準値Tbおよび最大0次元ベッチ数Vbに基づいて、対象領域画像が、結節が生じていない肺野、肺血管、充実型結節、すりガラス型結節のいずれの領域を撮像した画像であるかを判定することも可能である。なお、図11に示す、対象領域画像毎の、第1基準値Taと、最大1次元ベッチ数Vaとをプロットしたグラフに比して、群E~群Hは互いに近接している。それゆえ、判定部44は、対象領域画像について特定された第1基準値Taおよび最大1次元ベッチ数Vaに加えて、第2基準値Tbおよび最大0次元ベッチ数Vbを利用することが望ましい。このように構成すれば、画像解析装置1は、肺に生じた変化を判定する精度をより向上させることができる。
FIG. 16 is a graph in which the second reference value Tb and the maximum 0-dimensional Betti number Vb are plotted for each target area image. As shown in FIG. 16, the combination of the second reference value Tb specified by the reference value specifying unit 43 and the maximum 0-dimensional Betti number Vb is clearly divided into four groups of groups E to H. Specifically, the group E is a point obtained by plotting the second reference value Tb and the maximum 0-dimensional Betti number Vb in the target region image of the solid nodule. Group F is a plot of the second reference value Tb and the maximum 0-dimensional Betti number Vb in the target region image of the pulmonary blood vessel. Group G is a plot of the second reference value Tb and the maximum 0-dimensional Betti number Vb in the target area image of the lung field where no nodules have formed. Group H is a point obtained by plotting the second reference value Tb and the maximum 0-dimensional Betti number Vb in the target region image of the ground glass type nodule. In this way, based on the second reference value Tb and the maximum 0-dimensional Vetch number Vb, the target region image imaged any region of the lung field without nodules, pulmonary blood vessels, solid nodules, and frosted glass nodules. It is also possible to determine whether it is an image. The groups E to H are closer to each other than the graph shown in FIG. 11 in which the first reference value Ta and the maximum one-dimensional Betti number Va are plotted for each target area image. Therefore, it is desirable that the determination unit 44 utilize the second reference value Tb and the maximum 0-dimensional Betti number Vb in addition to the first reference value Ta and the maximum one-dimensional Betti number Va specified for the target region image. With this configuration, the image analysis device 1 can further improve the accuracy of determining the change that has occurred in the lungs.
図17は、判定基準32の別の一例を示す図である。判定部44は、判定基準32に規定されている第1基準値Ta、最大1次元ベッチ数Va、第2基準値Tb、および最大0次元ベッチ数Vbを参照して、肺に生じた変化を対象領域画像毎に判定する。
FIG. 17 is a diagram showing another example of the determination criterion 32. The determination unit 44 refers to the first reference value Ta, the maximum one-dimensional Betti number Va, the second reference value Tb, and the maximum 0-dimensional Betti number Vb defined in the determination standard 32, and determines the change that has occurred in the lungs. Judgment is made for each target area image.
(変形例)
ベッチ数算出部42が算出した1次元ベッチ数b1と0次元ベッチ数b0との比も利用して、肺に生じた変化を判定してもよい。以下では、1次元ベッチ数b1と0次元ベッチ数b0との比が、1次元ベッチ数b1を0次元ベッチ数b0で除した値(b1/b0)である場合を例にあげて説明する。 (Modification example)
The ratio of the one-dimensional Betti number b1 calculated by the Bettinumber calculation unit 42 to the zero-dimensional Betti number b0 may also be used to determine the change that has occurred in the lungs. In the following, a case where the ratio of the one-dimensional Betti number b1 and the zero-dimensional Betti number b0 is a value (b1 / b0) obtained by dividing the one-dimensional Betti number b1 by the 0-dimensional Betti number b0 will be described as an example.
ベッチ数算出部42が算出した1次元ベッチ数b1と0次元ベッチ数b0との比も利用して、肺に生じた変化を判定してもよい。以下では、1次元ベッチ数b1と0次元ベッチ数b0との比が、1次元ベッチ数b1を0次元ベッチ数b0で除した値(b1/b0)である場合を例にあげて説明する。 (Modification example)
The ratio of the one-dimensional Betti number b1 calculated by the Betti
[ベッチ数算出部42]
ベッチ数算出部42は、複数の二値化画像のそれぞれについて算出した、1次元ベッチ数b1と0次元ベッチ数b0とを用いて、b1/b0を算出する。 [Betti number calculation unit 42]
The Bettinumber calculation unit 42 calculates b1 / b0 using the one-dimensional Betti number b1 and the zero-dimensional Betti number b0 calculated for each of the plurality of binarized images.
ベッチ数算出部42は、複数の二値化画像のそれぞれについて算出した、1次元ベッチ数b1と0次元ベッチ数b0とを用いて、b1/b0を算出する。 [Betti number calculation unit 42]
The Betti
[基準値特定部43]
基準値特定部43は、二値化部41によって生成された複数の二値化画像のうち、b1/b0が最大となる二値化画像を特定する。そして、基準値特定部43は、第3基準値Tcおよびb1/b0の最大値Rを特定する。ここで、第3基準値は、特定した二値化画像における二値化の基準値である。 [Reference value specifying unit 43]
The referencevalue specifying unit 43 identifies the binarized image having the maximum b1 / b0 among the plurality of binarized images generated by the binarized unit 41. Then, the reference value specifying unit 43 specifies the maximum value R of the third reference value Tc and b1 / b0. Here, the third reference value is the reference value for binarization in the specified binarized image.
基準値特定部43は、二値化部41によって生成された複数の二値化画像のうち、b1/b0が最大となる二値化画像を特定する。そして、基準値特定部43は、第3基準値Tcおよびb1/b0の最大値Rを特定する。ここで、第3基準値は、特定した二値化画像における二値化の基準値である。 [Reference value specifying unit 43]
The reference
なお、基準値特定部43は、二値化の基準値の変化に伴うb1/b0の値の変化をプロットしたグラフを生成してもよい。基準値特定部43は、生成したグラフから、第3基準値Tc、b1/b0の最大値Rなどを読取ることができる。
Note that the reference value specifying unit 43 may generate a graph plotting the change in the value of b1 / b0 accompanying the change in the reference value for binarization. The reference value specifying unit 43 can read the third reference value Tc, the maximum value R of b1 / b0, and the like from the generated graph.
[判定部44]
判定部44は、下記の(1)~(6)のうちの少なくとも2つに基づいて、肺に生じた変化を判定する。 [Judgment unit 44]
Thedetermination unit 44 determines the changes that have occurred in the lungs based on at least two of the following (1) to (6).
判定部44は、下記の(1)~(6)のうちの少なくとも2つに基づいて、肺に生じた変化を判定する。 [Judgment unit 44]
The
(1)第1基準値Ta
(2)最大1次元ベッチ数Va
(3)第2基準値Tb
(4)最大0次元ベッチ数Vb
(5)第3基準値Tc
(6)b1/b0の最大値R。 (1) First reference value Ta
(2) Maximum one-dimensional Betti number Va
(3) Second reference value Tb
(4) Maximum 0-dimensional Betti number Vb
(5) Third reference value Tc
(6) Maximum value R of b1 / b0.
(2)最大1次元ベッチ数Va
(3)第2基準値Tb
(4)最大0次元ベッチ数Vb
(5)第3基準値Tc
(6)b1/b0の最大値R。 (1) First reference value Ta
(2) Maximum one-dimensional Betti number Va
(3) Second reference value Tb
(4) Maximum 0-dimensional Betti number Vb
(5) Third reference value Tc
(6) Maximum value R of b1 / b0.
結節が生じていない肺野および肺血管の対象領域画像における第3基準値Tcおよびb1/b0の最大値Rは、各種肺結節の対象領域画像における第3基準値Tcおよびb1/b0の最大値Rと大きく異なる。そこで、判定部44は、対象領域画像における第3基準値Tcおよびb1/b0の最大値Rを、肺に生じた変化の有無の判定に利用してもよい。具体的には、判定部44は、対象領域画像における第3基準値Tcおよびb1/b0の最大値Rに基づいて、対象領域画像の中から、結節が生じていない肺野および肺血管に該当する画像を除去することが可能である。
The maximum values R of the third reference values Tc and b1 / b0 in the target area images of the lung field and pulmonary blood vessels without nodules are the maximum values of the third reference values Tc and b1 / b0 in the target area images of various lung nodules. It is very different from R. Therefore, the determination unit 44 may use the maximum values R of the third reference value Tc and b1 / b0 in the target region image to determine the presence or absence of changes occurring in the lungs. Specifically, the determination unit 44 corresponds to the lung field and pulmonary blood vessels in which nodules have not occurred from the target region image based on the third reference value Tc and the maximum value R of b1 / b0 in the target region image. It is possible to remove the image to be used.
〔実施形態3〕
本発明の他の実施形態について、以下に説明する。なお、説明の便宜上、上記実施形態にて説明した部材と同じ機能を有する部材については、同じ符号を付記し、その説明を繰り返さない。 [Embodiment 3]
Other embodiments of the present invention will be described below. For convenience of explanation, the same reference numerals will be added to the members having the same functions as the members described in the above embodiment, and the description will not be repeated.
対象領域画像毎に算出される1次元ベッチ数b1および0次元ベッチ数b0の値は、各対象領域画像に撮像されている領域の面積に依存する。対象領域画像毎に撮像されている領域の面積が異なっている場合には、1次元ベッチ数b1および0次元ベッチ数b0などは、単位面積当たりの値として算出されることが望ましい。以下、対象領域画像に撮像されている領域の面積をWと記す場合がある。また、単位面積当たりの1次元ベッチ数をb1/W、単位面積当たりの0次元ベッチ数をb0/W、と記す場合がある。
The values of the one-dimensional Betti number b1 and the zero-dimensional Betti number b0 calculated for each target area image depend on the area of the area captured in each target area image. When the area of the captured area is different for each target area image, it is desirable that the one-dimensional Betti number b1 and the zero-dimensional Betti number b0 are calculated as values per unit area. Hereinafter, the area of the region captured in the target region image may be referred to as W. Further, the number of one-dimensional vetches per unit area may be described as b1 / W, and the number of zero-dimensional vetches per unit area may be described as b0 / W.
(画像解析装置1aの構成)
本発明の一態様に係る画像解析装置1aの構成について、図18を用いて説明する。図18は、本発明の一態様に係る画像解析装置1aの構成の一例を示すブロック図である。なお、図18では、図1と同様に、画像解析装置1aに画像を送信する外部機器8も示している。 (Configuration ofimage analysis device 1a)
The configuration of theimage analysis device 1a according to one aspect of the present invention will be described with reference to FIG. FIG. 18 is a block diagram showing an example of the configuration of the image analysis device 1a according to one aspect of the present invention. Note that FIG. 18 also shows an external device 8 that transmits an image to the image analysis device 1a, as in FIG.
本発明の一態様に係る画像解析装置1aの構成について、図18を用いて説明する。図18は、本発明の一態様に係る画像解析装置1aの構成の一例を示すブロック図である。なお、図18では、図1と同様に、画像解析装置1aに画像を送信する外部機器8も示している。 (Configuration of
The configuration of the
図18に示すように、画像解析装置1aは、画像取得部2、記憶部3a、および制御部4aを備えている。記憶部3aには少なくとも、組織画像31および判定基準32aが記憶されている。
As shown in FIG. 18, the image analysis device 1a includes an image acquisition unit 2, a storage unit 3a, and a control unit 4a. At least the tissue image 31 and the determination criterion 32a are stored in the storage unit 3a.
画像解析装置1aは、対象領域画像に撮像されている領域の面積を算出する機能を備えている点で、図1の画像解析装置1と異なっている。
The image analysis device 1a is different from the image analysis device 1 of FIG. 1 in that it has a function of calculating the area of the area captured in the target area image.
[二値化部41a]
二値化部41aは、肺のCT画像から解析対象となる対象領域画像を抽出し、該対象領域画像に対して二値化処理を行い、二値化の基準値が異なる複数の二値化画像を生成する(図7参照)。 [Binarization unit 41a]
Thebinarization unit 41a extracts a target region image to be analyzed from the CT image of the lung, performs binarization processing on the target region image, and binarizes a plurality of binarizations having different reference values for binarization. Generate an image (see FIG. 7).
二値化部41aは、肺のCT画像から解析対象となる対象領域画像を抽出し、該対象領域画像に対して二値化処理を行い、二値化の基準値が異なる複数の二値化画像を生成する(図7参照)。 [
The
[面積算出部46]
面積算出部46は、対象領域画像を二値化部41aから取得し、対象領域画像に撮像されている領域の面積Wを算出する。面積算出部46は、撮像されている領域の広さが異なる対象領域画像について算出された1次元ベッチ数b1および0次元ベッチ数b0などを、単位面積当たりの値として比較するために、各対象領域画像の面積Wを算出する。 [Area calculation unit 46]
Thearea calculation unit 46 acquires the target area image from the binarization unit 41a and calculates the area W of the area captured in the target area image. The area calculation unit 46 compares each target with the one-dimensional Betti number b1 and the zero-dimensional Betti number b0 calculated for the target area images having different widths of the captured area as values per unit area. The area W of the area image is calculated.
面積算出部46は、対象領域画像を二値化部41aから取得し、対象領域画像に撮像されている領域の面積Wを算出する。面積算出部46は、撮像されている領域の広さが異なる対象領域画像について算出された1次元ベッチ数b1および0次元ベッチ数b0などを、単位面積当たりの値として比較するために、各対象領域画像の面積Wを算出する。 [Area calculation unit 46]
The
面積算出部46が算出する値は、各対象領域画像における単位面積当たりの1次元ベッチ数b1/Wを表す値、および、単位面積当たりの0次元ベッチ数b0/Wを表す値を算出するために利用可能な値であればよく、面積Wに限定されない。例えば、面積算出部46は、対象領域画像に撮像されている領域が正方形または長方形であれば、面積Wの代わりに、例えば該領域の対角線の長さを算出してもよい。例えば、面積算出部46は、対象領域画像に撮像されている領域が円形であれば、面積Wの代わりに該領域の半径または直径の長さを算出してもよい。
The value calculated by the area calculation unit 46 is for calculating a value representing the one-dimensional vetch number b1 / W per unit area in each target area image and a value representing the zero-dimensional vetch number b0 / W per unit area. It is not limited to the area W as long as it is a value that can be used for. For example, if the area captured in the target area image is a square or a rectangle, the area calculation unit 46 may calculate, for example, the length of the diagonal line of the area instead of the area W. For example, if the area captured in the target area image is circular, the area calculation unit 46 may calculate the radius or the length of the diameter of the area instead of the area W.
なお、肺のCT画像から対象領域画像が抽出されたときに画像として拡大・縮小処理がなされていない場合には、面積算出部46は、対象領域画像の面積の代わりに対象領域画像を構成する画素数を算出してもよい。
If the target area image is extracted from the CT image of the lung and the enlargement / reduction process is not performed as an image, the area calculation unit 46 constitutes the target area image instead of the area of the target area image. The number of pixels may be calculated.
[ベッチ数算出部42a]
ベッチ数算出部42aは、対象領域画像毎に算出した1次元ベッチ数b1および0次元ベッチ数b0と、面積算出部46から取得した該対象領域画像の面積Wとに基づいて、単位面積当たりの1次元ベッチ数b1/Wおよび0次元ベッチ数b0/Wを算出する。 [Bettinumber calculation unit 42a]
The Bettinumber calculation unit 42a per unit area based on the one-dimensional Betti number b1 and the zero-dimensional Betti number b0 calculated for each target area image and the area W of the target area image acquired from the area calculation unit 46. The one-dimensional Betti number b1 / W and the zero-dimensional Betti number b0 / W are calculated.
ベッチ数算出部42aは、対象領域画像毎に算出した1次元ベッチ数b1および0次元ベッチ数b0と、面積算出部46から取得した該対象領域画像の面積Wとに基づいて、単位面積当たりの1次元ベッチ数b1/Wおよび0次元ベッチ数b0/Wを算出する。 [Betti
The Betti
このように構成すれば、ベッチ数算出部42aは、任意の広さの領域を撮像した対象領域画像における単位面積当たりの1次元ベッチ数b1/Wおよび単位面積当たりの0次元ベッチ数b0/Wを算出することができる。
With this configuration, the Betti number calculation unit 42a has a one-dimensional Betti number b1 / W per unit area and a zero-dimensional Betti number b0 / W per unit area in a target area image obtained by capturing an area of an arbitrary size. Can be calculated.
[判定部44a]
判定部44aは、下記の(1)~(6)のうちの少なくとも2つに基づいて、肺に生じた変化を判定する。なお、以下では、単位面積当たりの1次元ベッチ数b1/Wが最大となる二値化画像における、二値化の基準値のことを「第1基準値Ta」と呼称する。同様に、単位面積当たりの0次元ベッチ数b0/Wが最大となる二値化画像における、二値化の基準値のことを「第2基準値Tb」と呼称する。 [Determination unit 44a]
Thedetermination unit 44a determines the change that has occurred in the lungs based on at least two of the following (1) to (6). In the following, the reference value for binarization in the binarized image in which the number of one-dimensional Betti numbers b1 / W per unit area is maximized is referred to as "first reference value Ta". Similarly, the reference value for binarization in the binarized image in which the number of 0-dimensional Betti numbers b0 / W per unit area is maximized is referred to as "second reference value Tb".
判定部44aは、下記の(1)~(6)のうちの少なくとも2つに基づいて、肺に生じた変化を判定する。なお、以下では、単位面積当たりの1次元ベッチ数b1/Wが最大となる二値化画像における、二値化の基準値のことを「第1基準値Ta」と呼称する。同様に、単位面積当たりの0次元ベッチ数b0/Wが最大となる二値化画像における、二値化の基準値のことを「第2基準値Tb」と呼称する。 [
The
(1)第1基準値Ta
(2)単位面積当たりの1次元ベッチ数b1/Wの最大値(最大1次元ベッチ数Va)
(3)第2基準値Tb
(4)単位面積当たりの0次元ベッチ数b0/Wの最大値(最大0次元ベッチ数Vb)
(5)第3基準値Tc
(6)b1/b0の最大値R。 (1) First reference value Ta
(2) Maximum value of one-dimensional Betti number b1 / W per unit area (maximum one-dimensional Betti number Va)
(3) Second reference value Tb
(4) Maximum value of 0-dimensional Betti number b0 / W per unit area (maximum 0-dimensional Betti number Vb)
(5) Third reference value Tc
(6) Maximum value R of b1 / b0.
また、判定部44aは、ベッチ数算出部42aによって算出された第3基準値Tcおよびb1/b0の最大値Rのみに基づいて、肺に生じた変化の有無を判定してもよい。
Further, the determination unit 44a may determine the presence or absence of changes occurring in the lungs based only on the third reference value Tc calculated by the Betti number calculation unit 42a and the maximum value R of b1 / b0.
(画像解析装置1が行う処理の流れ)
画像解析装置1aが行う処理の流れについて、適宜、図20~図26を参照しながら、図19を用いて説明する。図19は、画像解析装置1aが行う処理の流れの一例を示すフローチャートである。 (Flow of processing performed by the image analysis device 1)
The flow of processing performed by theimage analysis apparatus 1a will be described with reference to FIGS. 20 to 26 as appropriate. FIG. 19 is a flowchart showing an example of the flow of processing performed by the image analysis apparatus 1a.
画像解析装置1aが行う処理の流れについて、適宜、図20~図26を参照しながら、図19を用いて説明する。図19は、画像解析装置1aが行う処理の流れの一例を示すフローチャートである。 (Flow of processing performed by the image analysis device 1)
The flow of processing performed by the
まず、画像取得部2は、外部機器8から組織を撮像した組織画像を取得する(ステップS21)。
First, the image acquisition unit 2 acquires a tissue image obtained by imaging the tissue from the external device 8 (step S21).
次に、二値化部41aは、組織画像から対象領域画像を抽出する(ステップS22)。
Next, the binarization unit 41a extracts the target area image from the tissue image (step S22).
次に、面積算出部46は、二値化部41aによって抽出された対象領域画像の撮像範囲の面積Wを算出する(ステップS23:面積算出ステップ)。
Next, the area calculation unit 46 calculates the area W of the imaging range of the target area image extracted by the binarization unit 41a (step S23: area calculation step).
一方、二値化部41aは、ステップS22において抽出した対象領域画像について、二値化の基準値が異なる複数の二値化画像を生成する(ステップS24:二値化ステップ)。なお、図20~図25に示すグラフは、-1000HU~1000HUの範囲のCT値を、0~255の範囲の画素値に対応付けられた対象領域画像に対して、二値化部41が二値化処理を行った二値化画像を用いて描画されている。したがって、図20~図25に示すグラフと、図9~図11および図14~図16とでは、第1基準値および第2基準値の値が異なっている。
On the other hand, the binarization unit 41a generates a plurality of binarized images having different reference values for binarization with respect to the target area image extracted in step S22 (step S24: binarization step). In the graphs shown in FIGS. 20 to 25, the binarization unit 41 has two CT values in the range of −1000HU to 1000HU with respect to the target area image in which the CT values in the range of −1000HU to 1000HU are associated with the pixel values in the range of 0 to 255. It is drawn using a binarized image that has been binarized. Therefore, the values of the first reference value and the second reference value are different between the graphs shown in FIGS. 20 to 25 and FIGS. 9 to 11 and 14 to 16.
次に、ベッチ数算出部42aは、複数の二値化画像のそれぞれについて、単位面積当たりの1次元ベッチ数b1/W、単位面積当たりのb0/W、およびb1/b0を算出する(ステップS25:特徴数算出ステップ)。
Next, the Betti number calculation unit 42a calculates the one-dimensional Betti number b1 / W per unit area, b0 / W per unit area, and b1 / b0 for each of the plurality of binarized images (step S25). : Feature number calculation step).
判定部44aは、第3基準値Tcおよびb1/b0の最大値Rに基づいて、肺に生じた変化の有無を判定する(ステップS26:判定ステップ)。肺に生じた変化の有無を判定する場合、判定部44aは第1基準値Ta、第2基準値Tbなどは使用しない。そこで、図19に示すように、判定部44aは、肺に生じた変化の有無の判定を先にする構成であってもよい。このような構成を採用すれば、基準値特定部43は、次のステップS27において、肺に生じた変化が有ると判定された対象領域画像のみについて、第1基準値Ta、第2基準値Tbなどを特定すればよい。これにより、画像解析装置1aは、肺に生じた変化の判定処理をより効率的に実行することができる。
The determination unit 44a determines whether or not there is a change in the lungs based on the third reference value Tc and the maximum value R of b1 / b0 (step S26: determination step). When determining the presence or absence of changes occurring in the lungs, the determination unit 44a does not use the first reference value Ta, the second reference value Tb, or the like. Therefore, as shown in FIG. 19, the determination unit 44a may be configured to first determine the presence or absence of changes occurring in the lungs. If such a configuration is adopted, the reference value specifying unit 43 uses the first reference value Ta and the second reference value Tb only for the target region image determined to have a change in the lung in the next step S27. And so on. As a result, the image analysis device 1a can more efficiently execute the determination process of the change occurring in the lungs.
図20は、結節が生じていない肺野、および肺血管の領域について生成した二値化画像において、二値化の基準値を変化させたことに伴うb1/b0の変化をプロットしたグラフである。図20において、結節が生じていない肺野の対象領域画像についてのb1/b0は実線で示されており、肺血管の対象領域画像についてのb1/b0は破線で示されている。なお、図20には、結節が生じていない肺野の対象領域画像の第3基準値Tc1とb1/b0の最大値R1、および、肺血管の対象領域画像の第3基準値Tc2とb1/b0の最大値R2が示されている。
FIG. 20 is a graph plotting changes in b1 / b0 associated with changing the reference value for binarization in binarized images generated for the lung field without nodules and the region of pulmonary blood vessels. .. In FIG. 20, b1 / b0 for the target area image of the lung field without nodules is shown by a solid line, and b1 / b0 for the target area image of the pulmonary blood vessel is shown by a broken line. In addition, in FIG. 20, the maximum value R1 of the third reference value Tc1 and b1 / b0 of the target area image of the lung field where nodule is not generated, and the third reference value Tc2 and b1 / of the target area image of the pulmonary blood vessel. The maximum value R2 of b0 is shown.
図21は、肺結節が生じている対象領域画像について生成した二値化画像において、二値化の基準値を変化させたことに伴うb1/b0の変化をプロットしたグラフである。図21において、充実型結節の対象領域画像についてのb1/b0は一点鎖線で示されており、すりガラス型結節の対象領域画像についてのb1/b0は破線で示されている。また、混合型結節の対象領域画像についてのb1/b0は実線で示されている。図21には、混合型結節の対象領域画像の第3基準値Tc3とb1/b0の最大値R3、すりガラス型結節の対象領域画像の第3基準値Tc4とb1/b0の最大値R4、および充実型結節の対象領域画像の第3基準値Tc5とb1/b0の最大値R5が示されている。
FIG. 21 is a graph plotting the change in b1 / b0 accompanying the change in the reference value for binarization in the binarized image generated for the target region image in which the lung nodule is generated. In FIG. 21, b1 / b0 for the target region image of the solid nodule is indicated by a dash-dotted line, and b1 / b0 for the target region image of the ground glass type nodule is indicated by a broken line. In addition, b1 / b0 for the target region image of the mixed nodule is shown by a solid line. In FIG. 21, the maximum values R3 of the third reference values Tc3 and b1 / b0 of the target area image of the mixed type nodule, the maximum values R4 of the third reference values Tc4 and b1 / b0 of the target area image of the frosted glass type nodule, and The maximum values R5 of the third reference value Tc5 and b1 / b0 of the target area image of the solid nodule are shown.
結節が生じていない肺野の対象領域画像の第3基準値Tc1は、他の対象領域画像の第3基準値Tc2~Tc5に比べて小さい。また、肺血管の対象領域画像のb1/b0の最大値R2は、図21に示された肺結節の対象領域画像のb1/b0の最大値R3~R5に比べて小さい。それゆえ、判定部44aは、結節が生じていない肺野の対象領域画像および肺血管の対象領域画像と、肺結節の対象領域画像とを判定することができる。
The third reference value Tc1 of the target region image of the lung field without nodules is smaller than the third reference values Tc2 to Tc5 of the other target region images. Further, the maximum value R2 of b1 / b0 of the target area image of the lung blood vessel is smaller than the maximum value R3 to R5 of b1 / b0 of the target area image of the lung nodule shown in FIG. Therefore, the determination unit 44a can determine the target area image of the lung field where no nodule is formed, the target area image of the pulmonary blood vessel, and the target area image of the lung nodule.
図19に戻り、基準値特定部43は、対象領域画像毎に、第1基準値Ta、最大1次元ベッチ数Va、第2基準値Tb、最大0次元ベッチ数Vb、第3基準値Tc、およびb1/b0の最大値R、を特定する(ステップS27:基準値特定ステップ)。
Returning to FIG. 19, the reference value specifying unit 43 has a first reference value Ta, a maximum one-dimensional Betti number Va, a second reference value Tb, a maximum 0-dimensional Betti number Vb, and a third reference value Tc for each target area image. And the maximum value R of b1 / b0 are specified (step S27: reference value specifying step).
図22は、結節が生じていない肺野、および肺血管の領域について生成した二値化画像において、二値化の基準値を変化させたことに伴う単位面積当たりの1次元ベッチ数b1/Wの変化をプロットしたグラフである。図22において、結節が生じていない肺野の対象領域画像についての単位面積当たりの1次元ベッチ数b1/Wは実線で示されており、肺血管の対象領域画像についての単位面積当たりの1次元ベッチ数b1/Wは破線で示されている。なお、図22は、結節が生じていない肺野の対象領域画像の第1基準値Ta1と最大1次元ベッチ数Va1、および、肺血管の対象領域画像の第1基準値Ta2と最大1次元ベッチ数Va2が示されている。
FIG. 22 shows the one-dimensional Betti number b1 / W per unit area due to the change of the binarization reference value in the binarized image generated for the lung field without nodules and the region of the pulmonary blood vessel. It is a graph plotting the change of. In FIG. 22, the one-dimensional Betti number b1 / W per unit area for the target area image of the lung field without nodules is shown by a solid line, and one-dimensional per unit area for the target area image of the lung blood vessel. The Betti number b1 / W is indicated by a broken line. In addition, FIG. 22 shows the first reference value Ta1 and the maximum one-dimensional Betti number Va1 of the target area image of the lung field without nodules, and the first reference value Ta2 and the maximum one-dimensional Betti number of the target area image of the lung blood vessel. The number Va2 is shown.
一方、図23は、肺結節が生じている対象領域画像について生成した二値化画像において、二値化の基準値を変化させたことに伴う単位面積当たりの1次元ベッチ数b1/Wの変化をプロットしたグラフである。図23において、充実型結節の対象領域画像についての単位面積当たりの1次元ベッチ数b1/Wは一点鎖線で示されており、すりガラス型結節の対象領域画像についての単位面積当たりの1次元ベッチ数b1/Wは破線で示されている。また、混合型結節の対象領域画像についての単位面積当たりの1次元ベッチ数b1/Wは実線で示されている。図23には、混合型結節の対象領域画像の第1基準値Ta3と最大1次元ベッチ数Va3、すりガラス型結節の対象領域画像の第1基準値Ta4と最大1次元ベッチ数Va4、および充実型結節の対象領域画像の第1基準値Ta5と最大1次元ベッチ数Va5が示されている。
On the other hand, FIG. 23 shows a change in the one-dimensional Betti number b1 / W per unit area due to a change in the binarization reference value in the binarized image generated for the target region image in which the lung nodule is generated. It is a graph plotting. In FIG. 23, the one-dimensional Betti number b1 / W per unit area for the target area image of the solid knot is indicated by a alternate long and short dash line, and the one-dimensional Betti number per unit area for the target area image of the ground glass type knot. b1 / W is indicated by a broken line. Further, the one-dimensional Betti number b1 / W per unit area for the target area image of the mixed type nodule is shown by a solid line. In FIG. 23, the first reference value Ta3 and the maximum one-dimensional Betti number Va3 of the target area image of the mixed type knot, the first reference value Ta4 and the maximum one-dimensional Betti number Va4 of the target area image of the frosted glass type knot, and the full type. The first reference value Ta5 and the maximum one-dimensional Betti number Va5 of the target area image of the nodule are shown.
図24は、結節が生じていない肺野、および肺血管の領域について生成した二値化画像において、二値化の基準値を変化させたことに伴う単位面積当たりの0次元ベッチ数b0/Wの変化をプロットしたグラフである。図24において、結節が生じていない肺野の対象領域画像についての単位面積当たりの0次元ベッチ数b0/Wは実線で示されており、肺血管の対象領域画像についての単位面積当たりの0次元ベッチ数b0/Wは破線で示されている。図24には、結節が生じていない肺野の対象領域画像の第2基準値Tb1と最大0次元ベッチ数Vb1、および、肺血管の対象領域画像の第2基準値Tb2と最大0次元ベッチ数Vb2が示されている。
FIG. 24 shows the number of 0-dimensional Betti numbers b0 / W per unit area due to the change of the binarization reference value in the binarized images generated for the lung field without nodules and the region of the pulmonary blood vessels. It is a graph plotting the change of. In FIG. 24, the 0-dimensional Betti number b0 / W per unit area for the target area image of the lung field without nodules is shown by a solid line, and the 0-dimensional Betti number per unit area for the target area image of the lung blood vessel is shown by a solid line. The Betti number b0 / W is indicated by a broken line. In FIG. 24, the second reference value Tb1 and the maximum 0-dimensional Betti number Vb1 of the target area image of the lung field without nodules, and the second reference value Tb2 and the maximum 0-dimensional Betti number of the target area image of the lung blood vessel are shown. Vb2 is shown.
図25は、肺結節が生じている対象領域画像について生成した二値化画像において、二値化の基準値を変化させたことに伴う単位面積当たりの0次元ベッチ数b0/Wの変化をプロットしたグラフである。図25において、充実型結節の対象領域画像についての単位面積当たりの0次元ベッチ数b0/Wは一点鎖線で示されており、すりガラス型結節の対象領域画像についての単位面積当たりの0次元ベッチ数b0/Wは破線で示されている。また、混合型結節の対象領域画像についての単位面積当たりの0次元ベッチ数b0/Wは実線で示されている。図25には、混合型結節の対象領域画像の第2基準値Tb3と最大0次元ベッチ数Vb3、すりガラス型結節の対象領域画像の第2基準値Tb4と最大0次元ベッチ数Vb4、および充実型結節の対象領域画像の第2基準値Tb5と最大0次元ベッチ数Vb5が示されている。
FIG. 25 plots the change in the 0-dimensional Betti number b0 / W per unit area due to the change in the binarization reference value in the binarized image generated for the target area image in which the lung nodule is generated. It is a graph. In FIG. 25, the number of 0-dimensional Betti numbers b0 / W per unit area for the target area image of the solid knot is indicated by a dash-dotted line, and the number of 0-dimensional Betti numbers per unit area for the target area image of the ground glass type knot. b0 / W is indicated by a broken line. Further, the 0-dimensional Betti number b0 / W per unit area for the target area image of the mixed type nodule is shown by a solid line. In FIG. 25, the second reference value Tb3 and the maximum 0-dimensional Betti number Vb3 of the target area image of the mixed type knot, the second reference value Tb4 and the maximum 0-dimensional Betti number Vb4 of the target area image of the frosted glass type knot, and the full type. The second reference value Tb5 and the maximum 0-dimensional Betti number Vb5 of the target area image of the nodule are shown.
図19に戻り、判定部44は、下記の(1)~(6)のうちの少なくとも2つに基づいて、肺に生じた変化を判定する(ステップS28:判定ステップ)。
Returning to FIG. 19, the determination unit 44 determines the change occurring in the lungs based on at least two of the following (1) to (6) (step S28: determination step).
(1)第1基準値Ta
(2)最大1次元ベッチ数Va
(3)第2基準値Tb
(4)最大0次元ベッチ数Vb
(5)第3基準値Tc
(6)b1/b0の最大値R。 (1) First reference value Ta
(2) Maximum one-dimensional Betti number Va
(3) Second reference value Tb
(4) Maximum 0-dimensional Betti number Vb
(5) Third reference value Tc
(6) Maximum value R of b1 / b0.
(2)最大1次元ベッチ数Va
(3)第2基準値Tb
(4)最大0次元ベッチ数Vb
(5)第3基準値Tc
(6)b1/b0の最大値R。 (1) First reference value Ta
(2) Maximum one-dimensional Betti number Va
(3) Second reference value Tb
(4) Maximum 0-dimensional Betti number Vb
(5) Third reference value Tc
(6) Maximum value R of b1 / b0.
図26は、判定基準32aの一例を示す図である。判定部44は、対象領域画像について特定された上記(1)~(6)のうちの少なくとも2つを、判定基準32aに規定されている値と比較して、肺に生じた変化を判定する。
FIG. 26 is a diagram showing an example of the determination criterion 32a. The determination unit 44 compares at least two of the above (1) to (6) specified for the target area image with the values specified in the determination criterion 32a, and determines the change that has occurred in the lungs. ..
上記の構成によれば、判定部44は、肺に生じた変化をより詳細に判定することができる。例えば、b1/b0の最大値R、および単位面積当たりの最大1次元ベッチ数Va/Wに基づいて、判定部44は、充実型結節と混合型結節とを判別することが可能である。また、例えば、b1/b0の最大値Rおよび第1基準値Taに基づいて、判定部44は、するガラス型結節と混合型結節とを判別することが可能である。
According to the above configuration, the determination unit 44 can determine in more detail the changes that have occurred in the lungs. For example, the determination unit 44 can discriminate between a solid nodule and a mixed nodule based on the maximum value R of b1 / b0 and the maximum one-dimensional Betti number Va / W per unit area. Further, for example, based on the maximum value R of b1 / b0 and the first reference value Ta, the determination unit 44 can discriminate between the glass type nodule and the mixed type nodule.
表示制御部45は、判定結果を表示装置5に出力する(ステップS29)。
The display control unit 45 outputs the determination result to the display device 5 (step S29).
〔実施形態4〕
本発明の他の実施形態について、以下に説明する。なお、説明の便宜上、上記実施形態にて説明した部材と同じ機能を有する部材については、同じ符号を付記し、その説明を繰り返さない。 [Embodiment 4]
Other embodiments of the present invention will be described below. For convenience of explanation, the same reference numerals will be added to the members having the same functions as the members described in the above embodiment, and the description will not be repeated.
(画像解析装置1bの構成)
次に、図27を用いて、画像解析装置1bの構成について説明する。図27は、本発明の実施例4に係る画像解析装置1bの構成の一例を示すブロック図である。画像解析装置1bは通信部6を備えている点で、図1に示す画像解析装置1と異なっている。通信部6は、外部機器8から受信した画像データが示す組織画像を解析した結果に基づいて判定した判定結果を表示装置5にて表示させるための表示データを表示制御部45から取得し、表示装置5へ送信する。 (Configuration ofimage analysis device 1b)
Next, the configuration of theimage analysis device 1b will be described with reference to FIG. 27. FIG. 27 is a block diagram showing an example of the configuration of the image analysis device 1b according to the fourth embodiment of the present invention. The image analysis device 1b is different from the image analysis device 1 shown in FIG. 1 in that the image analysis device 1b includes a communication unit 6. The communication unit 6 acquires display data from the display control unit 45 and displays the display data for displaying the determination result determined based on the analysis result of the tissue image indicated by the image data received from the external device 8 on the display device 5. It is transmitted to the device 5.
次に、図27を用いて、画像解析装置1bの構成について説明する。図27は、本発明の実施例4に係る画像解析装置1bの構成の一例を示すブロック図である。画像解析装置1bは通信部6を備えている点で、図1に示す画像解析装置1と異なっている。通信部6は、外部機器8から受信した画像データが示す組織画像を解析した結果に基づいて判定した判定結果を表示装置5にて表示させるための表示データを表示制御部45から取得し、表示装置5へ送信する。 (Configuration of
Next, the configuration of the
なお、外部機器8および提示装置5の数は1つに限定されるものではなく、複数であってもよい。
The number of the external device 8 and the presentation device 5 is not limited to one, and may be a plurality.
画像解析装置1bは、図27に示す構成に限定されない。例えば、図18に示す画像解析装置1aに通信部6を加えた構成であってもよい。
The image analysis device 1b is not limited to the configuration shown in FIG. 27. For example, the image analysis device 1a shown in FIG. 18 may be configured by adding the communication unit 6.
(画像解析システム)
ここでは、画像解析装置1bを含む画像解析システム100および100aの構成例について、図28および図29を用いて説明する。図28は、本発明に係る画像解析装置1bを含む画像解析システム100の構成例を示す概略図である。図28は、外部機器8と提示装置7とが離れた場所に設置されている例を示している。一方、図29は、本発明に係る画像解析装置1bを含む別の画像解析システム100aの構成例を示す概略図である。図29は、提示装置7が外部機器8aに接続されている例を示している。 (Image analysis system)
Here, a configuration example of the image analysis systems 100 and 100a including the image analysis device 1b will be described with reference to FIGS. 28 and 29. FIG. 28 is a schematic view showing a configuration example of an image analysis system 100 including an image analysis device 1b according to the present invention. FIG. 28 shows an example in which the external device 8 and the presenting device 7 are installed at separate locations. On the other hand, FIG. 29 is a schematic view showing a configuration example of another image analysis system 100a including the image analysis device 1b according to the present invention. FIG. 29 shows an example in which the presentation device 7 is connected to the external device 8a.
ここでは、画像解析装置1bを含む画像解析システム100および100aの構成例について、図28および図29を用いて説明する。図28は、本発明に係る画像解析装置1bを含む画像解析システム100の構成例を示す概略図である。図28は、外部機器8と提示装置7とが離れた場所に設置されている例を示している。一方、図29は、本発明に係る画像解析装置1bを含む別の画像解析システム100aの構成例を示す概略図である。図29は、提示装置7が外部機器8aに接続されている例を示している。 (Image analysis system)
Here, a configuration example of the
図29に示すように、画像解析システム100は、外部機器8、画像解析装置1b、および提示装置7を有している。外部機器8、画像解析装置1b、および提示装置7は、インターネットなどの情報通信ネットワーク50に接続されており、相互にデータの送受信が可能である。
As shown in FIG. 29, the image analysis system 100 includes an external device 8, an image analysis device 1b, and a presentation device 7. The external device 8, the image analysis device 1b, and the presentation device 7 are connected to an information communication network 50 such as the Internet, and can transmit and receive data to and from each other.
外部機器8は、例えば、CT装置に接続されたパーソナルコンピュータであってもよいし、組織を撮像した画像を集約して管理するサーバ(電子カルテサーバ、CT画像データサーバなど)であってもよい。
The external device 8 may be, for example, a personal computer connected to a CT device, or a server (electronic medical record server, CT image data server, etc.) that aggregates and manages images of tissues. ..
提示装置7は、ユーザに画像解析の結果を提示する機能を有する装置であればよく、例えば、提示装置7はディスプレイを備える表示装置である。あるいは、提示装置7は、医療関係者などが携帯するタブレット端末などの通信端末機器であってもよい。
The presenting device 7 may be any device having a function of presenting the result of image analysis to the user. For example, the presenting device 7 is a display device including a display. Alternatively, the presentation device 7 may be a communication terminal device such as a tablet terminal carried by a medical person or the like.
組織を撮像した組織画像の画像データは、外部機器8から画像解析装置1bへと送信される。画像データを受信した画像解析装置1bは該画像を解析し、判定部44による判定結果を、通信部6を介して提示装置7に送信する。
The image data of the tissue image obtained by capturing the tissue is transmitted from the external device 8 to the image analysis device 1b. The image analysis device 1b that has received the image data analyzes the image and transmits the determination result by the determination unit 44 to the presentation device 7 via the communication unit 6.
画像解析システム100aは、外部機器8a、画像解析装置1b、および提示装置7を有している。外部機器8aおよび画像解析装置1bは、インターネットなどの情報通信ネットワーク50に接続されており、相互にデータの送受信が可能である。提示装置7は、外部機器8aに接続されている。
The image analysis system 100a includes an external device 8a, an image analysis device 1b, and a presentation device 7. The external device 8a and the image analysis device 1b are connected to an information communication network 50 such as the Internet, and can transmit and receive data to and from each other. The presentation device 7 is connected to the external device 8a.
すなわち、画像解析装置1bは、遠隔地で撮像された画像を外部機器8または8aから受信して、画像解析を行い、判定部44による判定結果を、提示装置7に送信することができる。なお、判定結果を、解析に供した組織画像と対応付けて提示装置7に送信してもよい。提示装置7は、外部機器8aに接続された装置であってもよいし、画像解析装置1bおよび外部機器8と独立している装置であってもよい。
That is, the image analysis device 1b can receive the image captured at a remote location from the external device 8 or 8a, perform image analysis, and transmit the determination result by the determination unit 44 to the presentation device 7. The determination result may be transmitted to the presentation device 7 in association with the tissue image used for analysis. The presentation device 7 may be a device connected to the external device 8a, or may be a device independent of the image analysis device 1b and the external device 8.
この構成を採用することにより、画像解析システム100および100aは、遠隔地の外部機器8および8aからの組織画像を受信して、当該画像を解析することができ、かつ組織画像および決定された情報を遠隔地のユーザに提示することができる。よって、医師が不在であったり、不足していたりする遠隔地のユーザに対しても、高い精度の画像診断の結果を提供することができる。
By adopting this configuration, the image analysis systems 100 and 100a can receive the tissue image from the external devices 8 and 8a at a remote location and analyze the image, and the tissue image and the determined information can be analyzed. Can be presented to users in remote areas. Therefore, it is possible to provide highly accurate diagnostic imaging results even to users in remote areas where doctors are absent or in short supply.
〔ソフトウェアによる実現例〕
画像解析装置1、1a、1bの制御ブロック(特に制御部4、4a)は、集積回路(ICチップ)等に形成された論理回路(ハードウェア)によって実現してもよいし、ソフトウェアによって実現してもよい。 [Example of realization by software]
The control blocks (particularly the control units 4 and 4a) of the image analysis devices 1, 1a and 1b may be realized by a logic circuit (hardware) formed in an integrated circuit (IC chip) or the like, or by software. You may.
画像解析装置1、1a、1bの制御ブロック(特に制御部4、4a)は、集積回路(ICチップ)等に形成された論理回路(ハードウェア)によって実現してもよいし、ソフトウェアによって実現してもよい。 [Example of realization by software]
The control blocks (particularly the
後者の場合、画像解析装置1、1a、1bは、各機能を実現するソフトウェアであるプログラムの命令を実行するコンピュータを備えている。このコンピュータは、例えば1つ以上のプロセッサを備えていると共に、上記プログラムを記憶したコンピュータ読み取り可能な記録媒体を備えている。そして、上記コンピュータにおいて、上記プロセッサが上記プログラムを上記記録媒体から読み取って実行することにより、本発明の目的が達成される。上記プロセッサとしては、例えばCPU(Central Processing Unit)を用いることができる。上記記録媒体としては、「一時的でない有形の媒体」、例えば、ROM(Read Only Memory)等の他、テープ、ディスク、カード、半導体メモリ、プログラマブルな論理回路などを用いることができる。また、上記プログラムを展開するRAM(Random Access Memory)などをさらに備えていてもよい。また、上記プログラムは、該プログラムを伝送可能な任意の伝送媒体(通信ネットワークや放送波等)を介して上記コンピュータに供給されてもよい。なお、本発明の一態様は、上記プログラムが電子的な伝送によって具現化された、搬送波に埋め込まれたデータ信号の形態でも実現され得る。
In the latter case, the image analysis devices 1, 1a, and 1b include a computer that executes a program instruction, which is software that realizes each function. The computer includes, for example, one or more processors and a computer-readable recording medium that stores the program. Then, in the computer, the processor reads the program from the recording medium and executes it, thereby achieving the object of the present invention. As the processor, for example, a CPU (Central Processing Unit) can be used. As the recording medium, in addition to a “non-temporary tangible medium” such as a ROM (Read Only Memory), a tape, a disk, a card, a semiconductor memory, a programmable logic circuit, or the like can be used. Further, a RAM (RandomAccessMemory) for expanding the above program may be further provided. Further, the program may be supplied to the computer via an arbitrary transmission medium (communication network, broadcast wave, etc.) capable of transmitting the program. It should be noted that one aspect of the present invention can also be realized in the form of a data signal embedded in a carrier wave, in which the above program is embodied by electronic transmission.
〔付記事項〕
本発明は上述した各実施形態に限定されるものではなく、請求項に示した範囲で種々の変更が可能であり、異なる実施形態にそれぞれ開示された技術的手段を適宜組み合わせて得られる実施形態についても本発明の技術的範囲に含まれる。 [Additional notes]
The present invention is not limited to the above-described embodiments, and various modifications can be made within the scope of the claims, and the embodiments obtained by appropriately combining the technical means disclosed in the different embodiments. Is also included in the technical scope of the present invention.
1、1a、1b 画像解析装置
2 画像取得部
3、3a 記憶部
7 提示装置
8、8a 外部機器
41、41a 二値化部
42、42a ベッチ数算出部(特徴数算出部)
43 基準値特定部
44、44a 判定部
46 面積算出部
100、100a 画像解析システム
S2、S12、S24 二値化ステップ
S3、S13、S25 特徴数算出ステップ
S4、S14、S27 基準値特定ステップ
S5、S15、S26、S28 判定ステップ
S23 面積算出ステップ 1, 1a, 1bImage analysis device 2 Image acquisition unit 3, 3a Storage unit 7 Presentation device 8, 8a External device 41, 41a Binarization unit 42, 42a Betti number calculation unit (feature number calculation unit)
43 Reference value identification unit 44, 44a Judgment unit 46 Area calculation unit 100, 100a Image analysis system S2, S12, S24 Binarization step S3, S13, S25 Feature number calculation step S4, S14, S27 Reference value identification step S5, S15 , S26, S28 Judgment step S23 Area calculation step
2 画像取得部
3、3a 記憶部
7 提示装置
8、8a 外部機器
41、41a 二値化部
42、42a ベッチ数算出部(特徴数算出部)
43 基準値特定部
44、44a 判定部
46 面積算出部
100、100a 画像解析システム
S2、S12、S24 二値化ステップ
S3、S13、S25 特徴数算出ステップ
S4、S14、S27 基準値特定ステップ
S5、S15、S26、S28 判定ステップ
S23 面積算出ステップ 1, 1a, 1b
43 Reference
Claims (13)
- 組織を撮像した組織画像を解析する方法であって、
前記組織画像から解析対象となる対象領域画像を抽出し、該対象領域画像について、二値化の基準値が異なる複数の二値化画像を生成する二値化ステップと、
複数の前記二値化画像のそれぞれについて、第1画素値と第2画素値とに二値化された後における前記第1画素値の画素に囲まれた、該二値化後における前記第2画素値の画素からなる穴形状の領域の数を示す第1特徴数を含む特徴数を算出する特徴数算出ステップと、
前記第1特徴数が最大となる二値化画像を特定し、特定した該二値化画像における二値化の基準値を示す第1基準値、および該二値化画像における前記第1特徴数を示す最大第1特徴数を特定する基準値特定ステップと、
前記第1基準値および前記最大第1特徴数に基づいて、前記組織に生じた変化を判定する判定ステップと、を含む、
画像解析方法。 It is a method of analyzing a tissue image obtained by imaging a tissue.
A binarization step of extracting a target region image to be analyzed from the tissue image and generating a plurality of binarized images having different binarization reference values for the target region image.
Each of the plurality of the binarized images is surrounded by the pixels of the first pixel value after being binarized to the first pixel value and the second pixel value, and the second after the binarization. A feature number calculation step for calculating the number of features including the first feature number indicating the number of hole-shaped regions composed of pixels of pixel values, and a feature number calculation step.
A binarized image having the maximum number of first features is specified, a first reference value indicating a reference value for binarization in the identified binarized image, and the number of first features in the binarized image. A reference value specifying step for specifying the maximum number of first features indicating
A determination step for determining a change occurring in the tissue based on the first reference value and the maximum number of first features is included.
Image analysis method. - 前記特徴数算出ステップにおいて、
複数の前記二値化画像のそれぞれについて、前記第1画素値の画素が連結して成る連結領域の数を示す第2特徴数をさらに含み、
前記基準値特定ステップにおいて、
前記第2特徴数が最大値となる二値化画像を特定し、特定した該二値化画像における二値化の基準値を示す第2基準値、および該二値化画像における前記第2特徴数を示す最大第2特徴数をさらに特定し、
前記判定ステップにおいて、
前記第1基準値、前記最大第1特徴数、前記第2基準値、および前記最大第2特徴数に基づいて、前記組織に生じた変化を判定する、
請求項1に記載の画像解析方法。 In the feature number calculation step
For each of the plurality of binarized images, a second feature number indicating the number of connected regions formed by connecting the pixels of the first pixel value is further included.
In the reference value specifying step
A binarized image having the maximum number of the second features is specified, a second reference value indicating a binarization reference value in the identified binarized image, and the second feature in the binarized image. Further identify the maximum number of second features that indicate the number,
In the determination step
A change that has occurred in the tissue is determined based on the first reference value, the maximum number of first features, the second reference value, and the maximum number of second features.
The image analysis method according to claim 1. - 前記対象領域画像に撮像されている領域の面積を算出する面積算出ステップをさらに含み、
前記特徴数算出ステップにおいて、
複数の前記二値化画像のそれぞれについて、単位面積当たりの前記第1特徴数、および単位面積当たりの前記第2特徴数を算出し、
前記基準値特定ステップにおいて、
単位面積当たりの前記第1特徴数の最大値、および単位面積当たりの前記第2特徴数の最大値をそれぞれ、前記第1基準値および前記第2基準値として特定する、
請求項2に記載の画像解析方法。 The area calculation step of calculating the area of the area captured in the target area image is further included.
In the feature number calculation step
For each of the plurality of binarized images, the number of the first features per unit area and the number of the second features per unit area were calculated.
In the reference value specifying step
The maximum value of the first feature number per unit area and the maximum value of the second feature number per unit area are specified as the first reference value and the second reference value, respectively.
The image analysis method according to claim 2. - 前記特徴数算出ステップにおいて、
複数の前記二値化画像のそれぞれについての、前記第1特徴数と前記第2特徴数との比をさらに算出し、
前記基準値特定ステップにおいて、
前記比が最大値となる二値化画像を特定し、特定した該二値化画像における二値化の基準値を示す第3基準値、および該二値化画像における前記第1特徴数と前記第2特徴数との比を示す最大第3特徴数をさらに特定し、
前記判定ステップにおいて、
前記第1基準値、前記最大第1特徴数、前記第2基準値、前記最大第2特徴数、前記第3基準値、および前記最大第3特徴数のうちの少なくとも2つに基づいて、前記組織に生じた変化を判定する、
請求項2または3に記載の画像解析方法。 In the feature number calculation step
The ratio of the number of the first features to the number of the second features for each of the plurality of binarized images is further calculated.
In the reference value specifying step
The binarized image having the maximum ratio is specified, and the third reference value indicating the binarization reference value in the identified binarized image, the first feature number in the binarized image, and the above. Further specifying the maximum number of third features, which indicates the ratio to the number of second features,
In the determination step
Based on at least two of the first reference value, the maximum first feature number, the second reference value, the maximum second feature number, the third reference value, and the maximum third feature number. Determine changes that have occurred in an organization,
The image analysis method according to claim 2 or 3. - 前記判定ステップにおいて、
前記第3基準値および前記最大第3特徴数に基づいて、前記組織に生じた変化の有無を判定する、
請求項4に記載の画像解析方法。 In the determination step
Based on the third reference value and the maximum number of third features, it is determined whether or not there is a change in the tissue.
The image analysis method according to claim 4. - 組織を撮像した組織画像を解析する画像解析装置であって、
前記組織画像から解析対象となる対象領域画像を抽出し、該対象領域画像について、二値化の基準値が異なる複数の二値化画像を生成する二値化部と、
複数の前記二値化画像のそれぞれについて、第1画素値と第2画素値とに二値化された後における前記第1画素値の画素に囲まれた、該二値化後における前記第2画素値の画素からなる穴形状の領域の数を示す第1特徴数を算出する特徴数算出部と、
前記第1特徴数が最大となる二値化画像を特定し、特定した該二値化画像における二値化の基準値を示す第1基準値、および該二値化画像における前記第1特徴数を示す最大第1特徴数を特定する基準値特定部と、
前記第1基準値および前記最大第1特徴数に基づいて、前記組織に生じた変化を判定する判定部と、を備える、
画像解析装置。 It is an image analysis device that analyzes a tissue image obtained by imaging a tissue.
A binarization unit that extracts a target region image to be analyzed from the tissue image and generates a plurality of binarized images having different binarization reference values for the target region image.
Each of the plurality of the binarized images is surrounded by the pixels of the first pixel value after being binarized to the first pixel value and the second pixel value, and the second after the binarization. A feature number calculation unit that calculates the number of first features indicating the number of hole-shaped regions composed of pixels of pixel values, and a feature number calculation unit.
A binarized image having the maximum number of first features is specified, a first reference value indicating a reference value for binarization in the identified binarized image, and the number of first features in the binarized image. A reference value specifying part that specifies the maximum number of first features indicating
A determination unit for determining a change occurring in the tissue based on the first reference value and the maximum number of first features is provided.
Image analyzer. - 前記特徴数算出部は、
複数の前記二値化画像のそれぞれについて、前記第1画素値の画素が連結して成る連結領域の数を示す第2特徴数をさらに算出し、
前記基準値特定部は、
前記第2特徴数が最大値となる二値化画像を特定し、特定した該二値化画像における二値化の基準値を示す第2基準値、および該二値化画像における前記第2特徴数を示す最大第2特徴数をさらに特定し、
前記判定部は、
前記第1基準値、前記最大第1特徴数、前記第2基準値、および前記最大第2特徴数に基づいて、前記組織に生じた変化を判定する、
請求項6に記載の画像解析装置。 The feature number calculation unit
For each of the plurality of the binarized images, the number of second features indicating the number of connected regions formed by connecting the pixels of the first pixel value is further calculated.
The reference value specifying part is
A binarized image having the maximum number of the second features is specified, a second reference value indicating a binarization reference value in the identified binarized image, and the second feature in the binarized image. Further identify the maximum number of second features that indicate the number,
The determination unit
A change that has occurred in the tissue is determined based on the first reference value, the maximum number of first features, the second reference value, and the maximum number of second features.
The image analysis apparatus according to claim 6. - 前記対象領域画像に撮像された撮像範囲の面積を算出する面積算出部をさらに備え、
前記特徴数算出部は、
複数の前記二値化画像のそれぞれについて、単位面積当たりの前記第1特徴数、および単位面積当たりの前記第2特徴数を算出し、
前記基準値特定部は、
単位面積当たりの前記第1特徴数の最大値および単位面積当たりの前記第2特徴数の最大値をそれぞれ、前記第1基準値および前記第2基準値として特定する、
請求項7に記載の画像解析装置。 An area calculation unit for calculating the area of the imaging range captured in the target area image is further provided.
The feature number calculation unit
For each of the plurality of binarized images, the number of the first features per unit area and the number of the second features per unit area were calculated.
The reference value specifying part is
The maximum value of the first feature number per unit area and the maximum value of the second feature number per unit area are specified as the first reference value and the second reference value, respectively.
The image analysis apparatus according to claim 7. - 前記特徴数算出部は、
複数の前記二値化画像のそれぞれについての、前記第1特徴数と前記第2特徴数との比をさらに算出し、
前記基準値特定部は、
前記比が最大値となる二値化画像を特定し、特定した該二値化画像における二値化の基準値を示す第3基準値、および該二値化画像における前記第1特徴数と前記第2特徴数との比の最大値を示す最大第3特徴数をさらに特定し、
前記判定部は、
前記第1基準値、前記最大第1特徴数、前記第2基準値、前記最大第2特徴数、前記第3基準値、および前記最大第3特徴数のうちの少なくとも2つに基づいて、前記組織に生じた変化を判定する、
請求項7または8に記載の画像解析装置。 The feature number calculation unit
The ratio of the number of the first features to the number of the second features for each of the plurality of binarized images is further calculated.
The reference value specifying part is
The binarized image having the maximum ratio is specified, and the third reference value indicating the binarization reference value in the identified binarized image, the first feature number in the binarized image, and the above. Further specifying the maximum number of third features, which indicates the maximum value of the ratio with the number of second features,
The determination unit
Based on at least two of the first reference value, the maximum first feature number, the second reference value, the maximum second feature number, the third reference value, and the maximum third feature number. Determine changes that have occurred in an organization,
The image analysis apparatus according to claim 7 or 8. - 前記判定部は、
前記第3基準値および前記最大第3特徴数に基づいて、前記組織に生じた変化の有無を判定する、
請求項9に記載の画像解析装置。 The determination unit
Based on the third reference value and the maximum number of third features, it is determined whether or not there is a change in the tissue.
The image analysis apparatus according to claim 9. - 請求項6から10のいずれか1項に記載の画像解析装置と、
前記組織画像および前記対象領域画像のうちの少なくとも一方の画像データを前記画像解析装置へ送信する外部機器と、
前記画像解析装置において決定された情報を取得して該情報を提示する提示装置と、を含む、
画像解析システム。 The image analysis apparatus according to any one of claims 6 to 10.
An external device that transmits image data of at least one of the tissue image and the target area image to the image analysis device, and
A presentation device that acquires information determined by the image analysis device and presents the information, and the like.
Image analysis system. - 請求項6から10のいずれか1項に記載の画像解析装置としてコンピュータを機能させるための画像解析プログラムであって、前記二値化部、前記特徴数算出部、前記基準値特定部、および前記判定部としてコンピュータを機能させるための画像解析プログラム。 An image analysis program for operating a computer as the image analysis device according to any one of claims 6 to 10, wherein the binarization unit, the feature number calculation unit, the reference value identification unit, and the reference value identification unit are used. An image analysis program for operating a computer as a judgment unit.
- 請求項12に記載の画像解析プログラムを記録したコンピュータ読み取り可能な記録媒体。 A computer-readable recording medium on which the image analysis program according to claim 12 is recorded.
Priority Applications (2)
| Application Number | Priority Date | Filing Date | Title |
|---|---|---|---|
| US17/782,080 US20230005148A1 (en) | 2019-12-05 | 2020-12-04 | Image analysis method, image analysis device, image analysis system, control program, and recording medium |
| JP2021562735A JP7265805B2 (en) | 2019-12-05 | 2020-12-04 | Image analysis method, image analysis device, image analysis system, control program, recording medium |
Applications Claiming Priority (2)
| Application Number | Priority Date | Filing Date | Title |
|---|---|---|---|
| JP2019-220455 | 2019-12-05 | ||
| JP2019220455 | 2019-12-05 |
Publications (1)
| Publication Number | Publication Date |
|---|---|
| WO2021112205A1 true WO2021112205A1 (en) | 2021-06-10 |
Family
ID=76221990
Family Applications (1)
| Application Number | Title | Priority Date | Filing Date |
|---|---|---|---|
| PCT/JP2020/045155 WO2021112205A1 (en) | 2019-12-05 | 2020-12-04 | Image analysis method, image analysis device, image analysis system, control program, and recording medium |
Country Status (3)
| Country | Link |
|---|---|
| US (1) | US20230005148A1 (en) |
| JP (1) | JP7265805B2 (en) |
| WO (1) | WO2021112205A1 (en) |
Families Citing this family (1)
| Publication number | Priority date | Publication date | Assignee | Title |
|---|---|---|---|---|
| CN116664413B (en) * | 2023-03-27 | 2024-02-02 | 北京拙河科技有限公司 | Image volume fog eliminating method and device based on Abbe convergence operator |
Citations (7)
| Publication number | Priority date | Publication date | Assignee | Title |
|---|---|---|---|---|
| JP2004041617A (en) * | 2001-08-06 | 2004-02-12 | Aloka Co Ltd | Ultrasonographic system |
| WO2010087112A1 (en) * | 2009-01-27 | 2010-08-05 | 国立大学法人大阪大学 | Image analysis apparatus, image analysis method, image analysis program and recording medium |
| WO2017010397A1 (en) * | 2015-07-15 | 2017-01-19 | 国立大学法人大阪大学 | Image analysis device, image analysis method, image analysis system, image analysis program, and recording medium |
| WO2019102829A1 (en) * | 2017-11-24 | 2019-05-31 | 国立大学法人大阪大学 | Image analysis method, image analysis device, image analysis system, image analysis program, and storage medium |
| WO2020067481A1 (en) * | 2018-09-28 | 2020-04-02 | 国立大学法人東北大学 | Image analysis device, image analysis system, image analysis method, computer program, and non-transitory recording medium |
| WO2020195258A1 (en) * | 2019-03-26 | 2020-10-01 | 国立大学法人大阪大学 | Image analysis method, image analysis program, recording medium, image analysis device, and image analysis system |
| WO2020241178A1 (en) * | 2019-05-29 | 2020-12-03 | 国立大学法人九州大学 | Lung cancer assessment device and lung cancer assessment method |
-
2020
- 2020-12-04 WO PCT/JP2020/045155 patent/WO2021112205A1/en active Application Filing
- 2020-12-04 US US17/782,080 patent/US20230005148A1/en active Pending
- 2020-12-04 JP JP2021562735A patent/JP7265805B2/en active Active
Patent Citations (7)
| Publication number | Priority date | Publication date | Assignee | Title |
|---|---|---|---|---|
| JP2004041617A (en) * | 2001-08-06 | 2004-02-12 | Aloka Co Ltd | Ultrasonographic system |
| WO2010087112A1 (en) * | 2009-01-27 | 2010-08-05 | 国立大学法人大阪大学 | Image analysis apparatus, image analysis method, image analysis program and recording medium |
| WO2017010397A1 (en) * | 2015-07-15 | 2017-01-19 | 国立大学法人大阪大学 | Image analysis device, image analysis method, image analysis system, image analysis program, and recording medium |
| WO2019102829A1 (en) * | 2017-11-24 | 2019-05-31 | 国立大学法人大阪大学 | Image analysis method, image analysis device, image analysis system, image analysis program, and storage medium |
| WO2020067481A1 (en) * | 2018-09-28 | 2020-04-02 | 国立大学法人東北大学 | Image analysis device, image analysis system, image analysis method, computer program, and non-transitory recording medium |
| WO2020195258A1 (en) * | 2019-03-26 | 2020-10-01 | 国立大学法人大阪大学 | Image analysis method, image analysis program, recording medium, image analysis device, and image analysis system |
| WO2020241178A1 (en) * | 2019-05-29 | 2020-12-03 | 国立大学法人九州大学 | Lung cancer assessment device and lung cancer assessment method |
Also Published As
| Publication number | Publication date |
|---|---|
| US20230005148A1 (en) | 2023-01-05 |
| JPWO2021112205A1 (en) | 2021-06-10 |
| JP7265805B2 (en) | 2023-04-27 |
Similar Documents
| Publication | Publication Date | Title |
|---|---|---|
| Elyan et al. | Computer vision and machine learning for medical image analysis: recent advances, challenges, and way forward. | |
| US9532762B2 (en) | Apparatus and method for lesion detection | |
| CN105701331B (en) | Computer-aided diagnosis apparatus and computer-aided diagnosis method | |
| US10198668B2 (en) | Apparatus and method for supporting computer aided diagnosis (CAD) based on probe speed | |
| US8270688B2 (en) | Method for intelligent qualitative and quantitative analysis assisting digital or digitized radiography softcopy reading | |
| KR101968144B1 (en) | Apparatus and method for diagnosising slant angle of vertebra and cervical vertebra | |
| US10872408B2 (en) | Method and system for imaging and analysis of anatomical features | |
| US11321841B2 (en) | Image analysis method, image analysis device, image analysis system, and storage medium | |
| RU2667879C1 (en) | Processing and analysis of data on computer-assisted tomography images | |
| WO2012073769A1 (en) | Image processing device and image processing method | |
| CN111080583B (en) | Medical image detection method, computer device, and readable storage medium | |
| KR102258756B1 (en) | Determination method for stage of cancer based on medical image and analyzing apparatus for medical image | |
| US20190125306A1 (en) | Method of transmitting a medical image, and a medical imaging apparatus performing the method | |
| Wallis et al. | Clever Hans effect found in a widely used brain tumour MRI dataset | |
| WO2021112205A1 (en) | Image analysis method, image analysis device, image analysis system, control program, and recording medium | |
| JP2006325640A (en) | Method of displaying abnormal shadow candidate and medical image processing system | |
| JP2018524071A (en) | Selection of transfer function for displaying medical images | |
| CN112862752A (en) | Image processing display method, system electronic equipment and storage medium | |
| KR20150141831A (en) | Apparatus for analysing medical image and method for classifying pulmonary vessel and pulmonary nodule | |
| KR20160115269A (en) | System and application for providing information of health examinations | |
| KR20150141832A (en) | Apparatus and method for bone density diagnosis based on noise of ct image | |
| KR102564437B1 (en) | Facial bone fracture detection system using deep learning model | |
| KR102632864B1 (en) | 3D Segmentation System and its method for Fracture Fragments using Semantic Segmentation | |
| KR102517232B1 (en) | Method for removing reflected light of medical image based on machine learning and device using the same | |
| EP4343780A1 (en) | Information processing apparatus, information processing method, and information processing program |
Legal Events
| Date | Code | Title | Description |
|---|---|---|---|
| 121 | Ep: the epo has been informed by wipo that ep was designated in this application |
Ref document number: 20897574 Country of ref document: EP Kind code of ref document: A1 |
|
| ENP | Entry into the national phase |
Ref document number: 2021562735 Country of ref document: JP Kind code of ref document: A |
|
| NENP | Non-entry into the national phase |
Ref country code: DE |
|
| 122 | Ep: pct application non-entry in european phase |
Ref document number: 20897574 Country of ref document: EP Kind code of ref document: A1 |