WO2020262087A1 - 応力およびひずみ量分布表示方法、装置およびプログラム - Google Patents
応力およびひずみ量分布表示方法、装置およびプログラム Download PDFInfo
- Publication number
- WO2020262087A1 WO2020262087A1 PCT/JP2020/023458 JP2020023458W WO2020262087A1 WO 2020262087 A1 WO2020262087 A1 WO 2020262087A1 JP 2020023458 W JP2020023458 W JP 2020023458W WO 2020262087 A1 WO2020262087 A1 WO 2020262087A1
- Authority
- WO
- WIPO (PCT)
- Prior art keywords
- loading
- pixel position
- stress
- unloading
- strain
- Prior art date
- Legal status (The legal status is an assumption and is not a legal conclusion. Google has not performed a legal analysis and makes no representation as to the accuracy of the status listed.)
- Ceased
Links
Images




Classifications
-
- G—PHYSICS
- G01—MEASURING; TESTING
- G01N—INVESTIGATING OR ANALYSING MATERIALS BY DETERMINING THEIR CHEMICAL OR PHYSICAL PROPERTIES
- G01N3/00—Investigating strength properties of solid materials by application of mechanical stress
- G01N3/20—Investigating strength properties of solid materials by application of mechanical stress by applying steady bending forces
-
- G—PHYSICS
- G01—MEASURING; TESTING
- G01B—MEASURING LENGTH, THICKNESS OR SIMILAR LINEAR DIMENSIONS; MEASURING ANGLES; MEASURING AREAS; MEASURING IRREGULARITIES OF SURFACES OR CONTOURS
- G01B11/00—Measuring arrangements characterised by the use of optical techniques
- G01B11/16—Measuring arrangements characterised by the use of optical techniques for measuring the deformation in a solid, e.g. optical strain gauge
- G01B11/165—Measuring arrangements characterised by the use of optical techniques for measuring the deformation in a solid, e.g. optical strain gauge by means of a grating deformed by the object
-
- G—PHYSICS
- G01—MEASURING; TESTING
- G01L—MEASURING FORCE, STRESS, TORQUE, WORK, MECHANICAL POWER, MECHANICAL EFFICIENCY, OR FLUID PRESSURE
- G01L1/00—Measuring force or stress, in general
- G01L1/24—Measuring force or stress, in general by measuring variations of optical properties of material when it is stressed, e.g. by photoelastic stress analysis using infrared, visible light, ultraviolet
-
- G—PHYSICS
- G01—MEASURING; TESTING
- G01N—INVESTIGATING OR ANALYSING MATERIALS BY DETERMINING THEIR CHEMICAL OR PHYSICAL PROPERTIES
- G01N3/00—Investigating strength properties of solid materials by application of mechanical stress
- G01N3/02—Details
- G01N3/06—Special adaptations of indicating or recording means
- G01N3/068—Special adaptations of indicating or recording means with optical indicating or recording means
-
- G—PHYSICS
- G01—MEASURING; TESTING
- G01N—INVESTIGATING OR ANALYSING MATERIALS BY DETERMINING THEIR CHEMICAL OR PHYSICAL PROPERTIES
- G01N3/00—Investigating strength properties of solid materials by application of mechanical stress
- G01N3/32—Investigating strength properties of solid materials by application of mechanical stress by applying repeated or pulsating forces
-
- G—PHYSICS
- G01—MEASURING; TESTING
- G01L—MEASURING FORCE, STRESS, TORQUE, WORK, MECHANICAL POWER, MECHANICAL EFFICIENCY, OR FLUID PRESSURE
- G01L5/00—Apparatus for, or methods of, measuring force, work, mechanical power, or torque, specially adapted for specific purposes
- G01L5/0047—Apparatus for, or methods of, measuring force, work, mechanical power, or torque, specially adapted for specific purposes measuring forces due to residual stresses
-
- G—PHYSICS
- G01—MEASURING; TESTING
- G01N—INVESTIGATING OR ANALYSING MATERIALS BY DETERMINING THEIR CHEMICAL OR PHYSICAL PROPERTIES
- G01N2203/00—Investigating strength properties of solid materials by application of mechanical stress
- G01N2203/0001—Type of application of the stress
- G01N2203/0005—Repeated or cyclic
-
- G—PHYSICS
- G01—MEASURING; TESTING
- G01N—INVESTIGATING OR ANALYSING MATERIALS BY DETERMINING THEIR CHEMICAL OR PHYSICAL PROPERTIES
- G01N2203/00—Investigating strength properties of solid materials by application of mechanical stress
- G01N2203/0058—Kind of property studied
- G01N2203/0069—Fatigue, creep, strain-stress relations or elastic constants
- G01N2203/0073—Fatigue
-
- G—PHYSICS
- G01—MEASURING; TESTING
- G01N—INVESTIGATING OR ANALYSING MATERIALS BY DETERMINING THEIR CHEMICAL OR PHYSICAL PROPERTIES
- G01N2203/00—Investigating strength properties of solid materials by application of mechanical stress
- G01N2203/0058—Kind of property studied
- G01N2203/0069—Fatigue, creep, strain-stress relations or elastic constants
- G01N2203/0075—Strain-stress relations or elastic constants
-
- G—PHYSICS
- G01—MEASURING; TESTING
- G01N—INVESTIGATING OR ANALYSING MATERIALS BY DETERMINING THEIR CHEMICAL OR PHYSICAL PROPERTIES
- G01N2203/00—Investigating strength properties of solid materials by application of mechanical stress
- G01N2203/02—Details not specific for a particular testing method
- G01N2203/06—Indicating or recording means; Sensing means
- G01N2203/0641—Indicating or recording means; Sensing means using optical, X-ray, ultraviolet, infrared or similar detectors
- G01N2203/0647—Image analysis
Definitions
- the present invention relates to a method, an apparatus and a program for displaying the distribution of stress and strain amount.
- the present invention has been made in view of these problems, and an object of the present invention is to provide a method for displaying the distribution of local stresses and strains generated by repeatedly loading and unloading a material. ..
- the method of one aspect of the present invention is a method of displaying the strain amount distribution on the sample surface while repeatedly loading and unloading the sample, and is a method of displaying the strain amount distribution on the sample surface before and after loading.
- the step of taking an image, the step of measuring the strain amount for each pixel position based on the correlation between the image before loading and the image after loading, and the distribution of the measured strain amount are displayed at each pixel position.
- This method is a method of displaying the stress distribution on the sample surface while repeatedly loading and unloading the sample, and is a step of taking images of the sample surface before, during, and after loading, and an image before loading.
- This device is a device that displays the stress distribution on the sample surface while repeatedly loading and unloading the sample, and has an imaging unit that captures images of the sample surface before, during, and after loading, and before loading.
- Strain amount measurement that measures the first strain amount for each pixel position based on the correlation between the images after unloading and measures the second strain amount for each pixel position based on the correlation between the images before and under load.
- Yet another aspect of the present invention is a program.
- This program is a program that displays the stress distribution on the sample surface while repeatedly loading and unloading the sample, and includes the steps to take images of the sample surface before, during, and after loading, and the image before loading.
- a fatigue test is performed to examine the fatigue fracture of a material, in which stress and displacement are repeatedly applied to the test piece, and the presence or absence of fracture and the number of repetitions until fracture are measured.
- the material is repeatedly loaded and unloaded in the elastic region, so that local plastic deformation occurs inside the material. It is considered that this local plastic deformation causes dislocations of the metal crystal lattice and local microcracks, which accumulate to cause fracture of the material.
- the main cause of the local occurrence of plastic deformation as described above is considered to be local stress concentration due to the complexity of the material shape and the non-uniformity of the material itself. Therefore, in order to observe or predict the occurrence of local plastic deformation, it is desirable to be able to measure and display the local distribution of stress.
- the conventional DIC can measure the distribution of the strain amount due to deformation, it cannot directly measure the distribution of the stress generated in the material.
- the strain observed in the plastic region of a material includes both elastic strain and plastic strain, so it is difficult to calculate the stress directly from the strain. Therefore, the present inventor has devised a method for obtaining stress by extracting only elastic strain from the total strain observed in the plastic region. Before explaining a specific embodiment, first, when the total strain includes both elastic strain and plastic strain, a method of extracting only the elastic strain and obtaining the stress will be described with reference to FIGS. 1 and 2. ..
- FIG. 1 shows the relationship between strain and stress when stress is applied to a material such as metal.
- the horizontal and vertical axes represent strain and stress, respectively.
- the material elastically deforms. At this time, the strain is proportional to the stress. That is, the state of the material changes from point O to point D along the straight line OA (load line). When the stress is set to 0 (unloading) from this state, the state of the material returns to the point O and the strain becomes 0.
- the region from point O to point A is generally called an elastic region, and the strain generated in the elastic region is called elastic strain.
- the maximum value ⁇ Y of stress in the elastic region is called the elastic limit.
- the material enters a plastic region (region from point A to point B).
- the point A at which the state of the material changes from the elastic region to the plastic region is called the yield point.
- the strain in the plastic region is the elastic strain plus the plastic strain
- the slope of the stress with respect to the strain in the plastic region is gentler than that in the elastic region.
- the material is an isotropic / homogeneous elastic body.
- (1) shows the relationship between elastic strain and stress in one dimension
- (2) and (3) show the relationship between elastic strain and stress in two dimensions.
- E Young's ratio
- ⁇ Poisson's ratio
- ⁇ stress in the length direction
- e elastic strain in the length direction
- ⁇ 11 stress in the first direction
- e 11 elastic strain in the first direction
- ⁇ 22 Represents the stress in the second direction
- e 22 represents the elastic strain in the second direction.
- equations (1) to (3) all show the relationship between stress and elastic strain. Therefore, in order to obtain the stress from the strain in the plastic region based on these equations, it is necessary to remove the plastic strain from the observed total strain and extract only the elastic strain.
- FIG. 2 is a graph showing the relationship between strain and stress when measuring stress from total strain.
- the dotted line represents a theoretical straight line based on Young's modulus determined by strength of materials, and the solid line represents the measured value.
- a stress larger than the elastic limit is applied to the material in the state of zero strain to bring the material into the state B (hereinafter referred to as the first state) in the plastic region.
- the state of the material changes from the point o to the first state B via the yield point A.
- the strain amount ⁇ in the first state B is measured at a plurality of measurement points defined on the material.
- the strain amount ⁇ 0.0083 is obtained.
- the strain amount ⁇ measured here is the sum of the elastic strain amount and the plastic strain amount.
- the strain amount ⁇ * in the second state C is measured at the above-mentioned plurality of measurement points.
- the strain amount ⁇ * 0.0033 is obtained.
- the strain amount ⁇ * measured here is the plastic strain amount ⁇ * .
- the elastic strain amount e at the plurality of measurement points described above is calculated from the difference between the strain amount ⁇ in the first state B and the plastic strain amount ⁇ * in the second state C.
- the plastic strain can be removed from the total strain observed in the plastic region, and only the elastic strain can be extracted.
- the known Young's modulus and Poisson's ratio can be applied to equations (1) (in the case of one dimension) and equations (2) (3) (in the case of two dimensions). Therefore, the stress distribution can be obtained.
- the present inventor conducted an experiment in which the material was put into the second state C and then stressed again to make the state of the material point E.
- the load line from the point C to the point E coincides with the unloading line from the point B to the point C with high accuracy, and the material in the state C exhibits normal elastic characteristics. It turned out.
- the strain regions below the yield point are collectively referred to as "elastic regions". That is, the elastic region collectively refers to (1) a strain region when the entire material is elastically deformed, and (2) a strain region when an elastically deformed portion and a locally plastically deformed portion are mixed inside the material. It is a thing. Some metal materials such as mild steel show a clear yield point, but other metals may not have a clear yield point. Therefore, if the yield point is not clear, the point where 0.2% permanent strain appears (0.2% proof stress) in the stress-strain curve is regarded as the yield point.
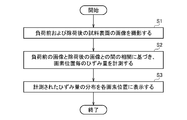
- FIG. 3 is a flow chart of the method according to the first embodiment. This method is a method of displaying the strain amount distribution on the sample surface while repeatedly loading and unloading the sample, and includes step S1, step S2, and step S3.
- this method takes images of the sample surface before loading and after unloading.
- the equipment and means for photographing are not particularly limited, but for example, a general digital camera, a microscope camera, a high-speed camera, or the like may be used. Further, one camera may be used to shoot from one direction, or a plurality of cameras may be used to shoot from different directions. The captured image is stored for each pixel position.
- step S2 this method measures the amount of strain for each pixel position based on the correlation between the image before loading and the image after unloading taken in step S1.
- the specific means for measuring the strain amount is not particularly limited, but for example, the displacement is obtained by comparing the images before loading and after unloading and finding the place where the point on the sample surface before loading moves after unloading. You may.
- the amount of strain may be measured for all pre-load and post-unload images, or may be measured by selecting several sets of pre-load and post-unload images.
- step S2 the strain generated on the sample surface in the process of repeating loading and unloading is obtained in time series for each pixel position.
- step S3 this method displays the distribution of the amount of strain measured in step S2 at each pixel position.
- the display method is not particularly limited, but the magnitude of distortion may be displayed for each pixel position by color, shading, contour lines, three-dimensional display, or the like.
- the distribution of the strain amount of the sample in which loading and unloading are repeated can be displayed at each pixel position, so that the local plastic deformation generated inside the material is measured and visualized as the strain amount distribution. can do.
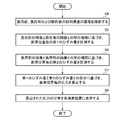
- FIG. 4 is a flow chart of the method according to the second embodiment.
- This method is a method of displaying the stress distribution on the sample surface while repeatedly loading and unloading the sample, and includes step S4, step S5, step S6, step S7, and step S8.
- step S4 the method takes images of the sample surface before, during, and after loading. That is, in step S4, in addition to step S1 of the first embodiment, an image of the sample surface under load (when a load is applied) is also taken.
- step S5 this method measures the first strain amount for each pixel position based on the correlation between the image before loading and the image after unloading taken in step S4.
- the first strain amount is the plastic strain (when the plastic strain is present).
- step S6 this method measures the second strain amount for each pixel position based on the correlation between the image before loading and the image under loading taken in step S4.
- the second strain amount is the sum (total strain) of the elastic strain and the plastic strain (when the plastic strain is present).
- step S7 this method calculates the stress for each pixel position based on the difference between the first strain amount measured in step S5 and the second strain amount measured in step S6.
- the elasticity of each pixel position is calculated by calculating the difference between the second strain amount (total strain) and the first strain amount (plastic strain) for each pixel position according to the above method. Only the strain can be extracted and the stress for each pixel position can be calculated.
- step S8 this method displays the stress distribution calculated in step S7 at each pixel position.
- step S8 the distribution of stress acting on the sample surface in the process of repeating loading and unloading is visualized in time series for each pixel position.
- the stress distribution of the sample in which loading and unloading are repeated can be displayed at each pixel position, so that the local stress that causes local plastic deformation and the like generated inside the material can be measured. It can be visualized as a stress distribution.
- the sample may be in the elastic range during the execution of this method.
- loading and unloading of the sample is repeated within a range generally regarded as an elastic region.
- the entire material is within the elastic region and the deformation of the material is reversible, there should be no difference between the pre-load and post-load images taken in step S4.
- the pixel position where there is a difference between the pre-load and post-load images taken in step S4.
- local plastic deformation generated by a small load can be measured and visualized as a stress distribution. This can provide insight into the local structure of the sample, which cannot be obtained by conventional fatigue tests of the type that repeats loading and unloading until fracture.
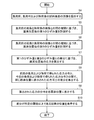
- FIG. 5 is a flow chart of the method according to the third embodiment.
- the third embodiment further includes steps S9 and S10 with respect to the second embodiment.
- step S9 this method is between the stress distribution obtained by the previous load and unloading (n-1st time) and the stress distribution obtained by the load and unloading this time (nth time). To calculate the difference between the stresses displayed at the same pixel position.
- this method displays the positions of pixels whose difference calculated in step S9 is equal to or greater than a predetermined threshold value. That is, the stress distribution after the n-1th unloading is compared with the stress distribution after the nth unloading, and when there is a pixel whose stress difference is equal to or greater than a predetermined threshold value, the pixel position is displayed. To do. At this time, since the stress at the pixel position changed significantly, it is highly possible that the sample had local plastic deformation or the like in the portion corresponding to the pixel position during the nth loading and unloading process. it is conceivable that. That is, it can be estimated that the timing at which local plastic deformation or the like occurs at the pixel position is the nth loading and unloading process as a result of repeating loading and unloading the sample.
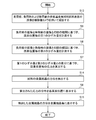
- FIG. 6 is a flow chart of the method according to the fourth embodiment.
- the fourth embodiment includes step S110 instead of step S10 with respect to the third embodiment.
- step S9 this method is between the stress distribution obtained by the previous load and unloading (n-1st time) and the stress distribution obtained by the load and unloading this time (nth time). To calculate the difference between the stresses displayed at the same pixel position.
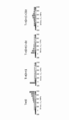
- this method displays the difference calculated in step S9 as a frequency distribution for each pixel position in a predetermined stress value range.
- the range of the predetermined stress value may be arbitrarily determined, but hereinafter, ⁇ 200 MPa to -100 MPa, -100 MPa to 0 MPa, 0 MPa to 100 MPa, 100 MPa to 200 MPa, 200 MPa to 300 MPa, 300 MPa to 400 MPa, 400 MPa to 500 MPa, 500 MPa to 600 MPa. , 600 MPa to 700 MPa, 700 MPa to 800 MPa, 800 MPa to 900 MPa, 900 MPa to 1000 MPa, an example defined by 12 pieces will be described.
- FIG. 10 is a frequency distribution of the stress difference at a certain pixel position displayed in step S110.
- T represents the time.
- the difference between the stresses displayed at the same pixel position is calculated, and instead of displaying the frequency distribution of the stress difference for each pixel position, the difference between the stresses of the entire material is calculated.
- the difference between the stresses of the entire material may be displayed in a frequency distribution for each unloading. According to this embodiment, it is possible to evaluate the change in the deformation mechanism of the entire material for each unloading without repeating a large number of loads and unloading for each pixel position and displaying the frequency distribution of the stress difference.
- FIG. 7 is a flow chart of the method according to the fifth embodiment.
- the fifth embodiment includes, for the second embodiment, step S11 instead of step S6, and further includes step S12.
- step S11 the present method measures the second strain amount for each pixel position based on the correlation between the image before the load and the image under the load, and between the image before the load and the image under the load.
- the pixel whose maximum value of the correlation of is equal to or less than a predetermined threshold value is detected. If the sample does not break during the process of repeating loading and unloading, it is considered that there is a certain correlation between the image before loading and the image after loading. That is, when a load is applied to the sample, each position of the sample is displaced, but it is considered that the displacement of each position is within a certain range unless breakage or the like occurs. That is, in this case, it is considered that there is a correlation between the image before loading the sample and the image under loading.
- step S11 pixels in which the maximum value of the correlation between the image before loading and the image under loading is equal to or less than a predetermined threshold value are detected, so that the portion corresponding to the pixel is detected. It can be estimated that a local break or the like has occurred.
- step S12 this method displays the positions of pixels in which the maximum value of the correlation between the image before loading and the image under loading detected in step S11 is equal to or less than a predetermined threshold value. By executing step 12, the position where it is estimated that a local break or the like has occurred is visualized.
- FIG. 8 is a flow chart of the method according to the sixth embodiment.
- the sixth embodiment includes, for the second embodiment, step S13 instead of step S4, and further includes steps S14 and S15.
- step S13 in this method, images of the surface of the polycrystalline metal material sample before, during, and after loading are taken using a microscope camera.
- the microscope used for the microscope camera is not particularly limited, but may be an optical microscope, a scanning electron microscope, a transmission electron microscope, or the like.
- step S14 this method detects the orientation of the metal crystal of the sample photographed in step S13.
- step S15 this method displays the orientation of the metal crystal detected in step S14 for each metal crystal.
- steps S8 and S15 the stress distribution of the sample and the orientation of the metal crystal can be aligned and visualized. This makes it possible to observe, for example, how stress is concentrated at the grain boundaries. In addition, it is possible to compare the difference in stress distribution at the boundary between crystals having a small difference in crystal orientation and crystals having a large difference.
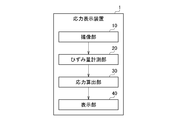
- FIG. 9 is a block diagram of the stress display device 1 according to the seventh embodiment.
- the stress display device 1 is a device that displays the stress distribution on the sample surface while repeatedly loading and unloading the sample, and includes a photographing unit 10, a strain amount measuring unit 20, a stress calculating unit 30, and a display unit 40. To be equipped.
- the photographing unit 10 photographs the image of the sample surface before, during, and after loading, and transmits the photographed image to the strain amount measuring unit 20.
- the strain amount measuring unit 20 measures the first strain amount for each pixel position based on the correlation between the images before and after loading received from the photographing unit 10.
- the strain amount measuring unit 20 also measures the second strain amount for each pixel position based on the correlation between the images before and during the load received from the photographing unit 10.
- the strain amount measuring unit 20 transmits the measured first strain amount and the second strain amount to the stress calculation unit 30.
- the stress calculation unit 30 calculates the stress for each pixel position based on the difference between the first strain amount and the second strain amount received from the strain amount measurement unit 20.
- the stress calculation unit 30 transmits the calculated stress for each pixel position to the display unit 40.
- the display unit 40 displays the stress distribution received from the stress calculation unit 30 at each pixel position.
- the program according to the eighth embodiment is a program for displaying the stress distribution on the sample surface while repeatedly loading and unloading the sample.
- This program takes the steps of taking images of the sample surface before, during and after loading, and the first strain amount for each pixel position based on the correlation between the image before loading and the image after unloading.
- the computer is made to execute a step of calculating the stress for each pixel position based on the difference and a step of displaying the calculated stress distribution at each pixel position.
- the strain amount and stress distribution may be acquired for each surface having a different depth by performing tomography. According to this modification, the strain amount and stress distribution inside the three-dimensional material can be obtained.
- the method according to the present invention can be applied to various materials at low cost, and can contribute to material evaluation, manufacturing method selection, material performance improvement, etc., and therefore has extremely high industrial applicability.
- the present invention can be used in methods, devices and programs for displaying stress and strain distributions.
- S1 Step of taking an image of the sample surface before and after loading
- S2 A step of measuring the amount of strain for each pixel position based on the correlation between the image before loading and the image after unloading
- S3 A step of displaying the measured strain distribution at each pixel position
- S4 A step of taking an image of the sample surface before loading, during loading, and after unloading
- S5 A step of measuring the first strain amount for each pixel position based on the correlation between the image before loading and the image after unloading
- S6 ... A step of measuring the second strain amount for each pixel position based on the correlation between the image before loading and the image under loading.
- S7 ...
- S8 A step of displaying the calculated stress distribution at each pixel position
- S9 A step of calculating the difference between the stresses displayed at the same pixel position between the stress distribution obtained by the previous load and unloading and the stress distribution obtained by the current load and unloading.
- S10 A step of displaying the position of a pixel whose difference is equal to or greater than a predetermined threshold value.
- S110 A step of displaying the difference in frequency distribution for each pixel position in a predetermined stress value range.
- S11 ...
- the second strain amount for each pixel position is measured based on the correlation between the image before the load and the image under load, and the maximum correlation between the image before load and the image under load is maximized.
- Steps to detect pixels whose value is below a predetermined threshold S12: A step of displaying the position of a pixel in which the maximum value of the correlation between the image before loading and the image under loading is equal to or less than a predetermined threshold value.
- S13 A step of taking an image of the surface of the polycrystalline metal material sample before, during, and after loading with a microscope camera.
- S14 ... Step of detecting the orientation of the metal crystal of the sample, S15 ... A step of displaying the orientation of the detected metal crystal for each metal crystal, 1 ... Stress display device, 10 ... Shooting department, 20 ... Strain amount measuring unit, 30 ... Stress calculation unit, 40 ... Display
Landscapes
- Physics & Mathematics (AREA)
- General Physics & Mathematics (AREA)
- Health & Medical Sciences (AREA)
- Life Sciences & Earth Sciences (AREA)
- Chemical & Material Sciences (AREA)
- Analytical Chemistry (AREA)
- Biochemistry (AREA)
- General Health & Medical Sciences (AREA)
- Immunology (AREA)
- Pathology (AREA)
- Investigating Strength Of Materials By Application Of Mechanical Stress (AREA)
- Force Measurement Appropriate To Specific Purposes (AREA)
Abstract
Description

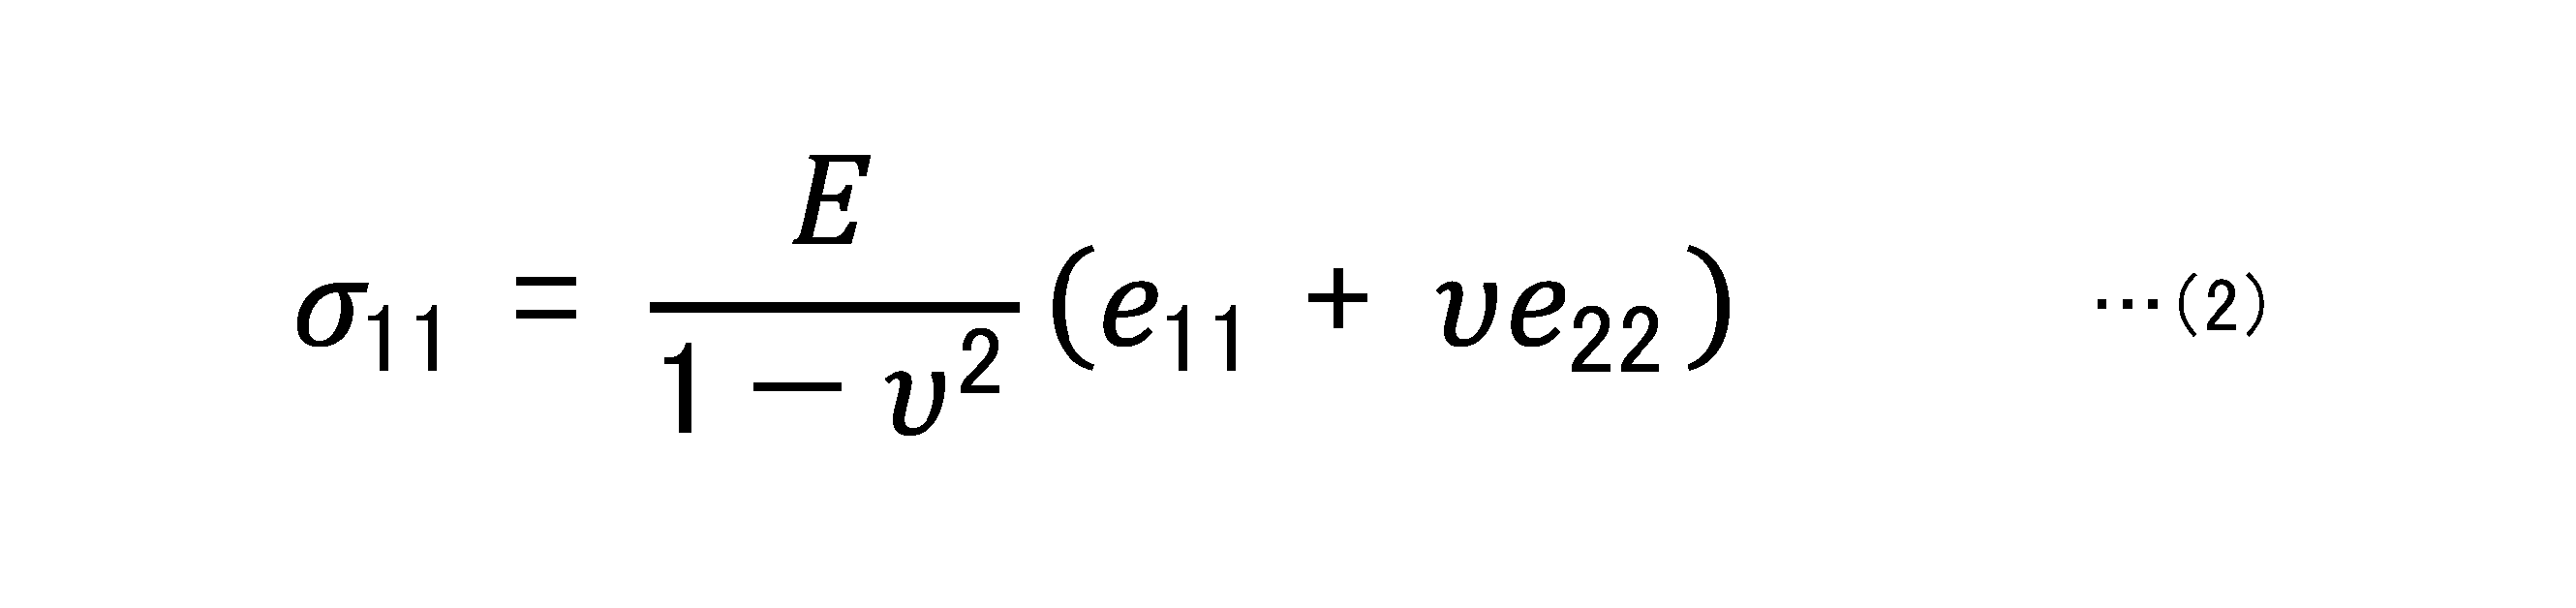
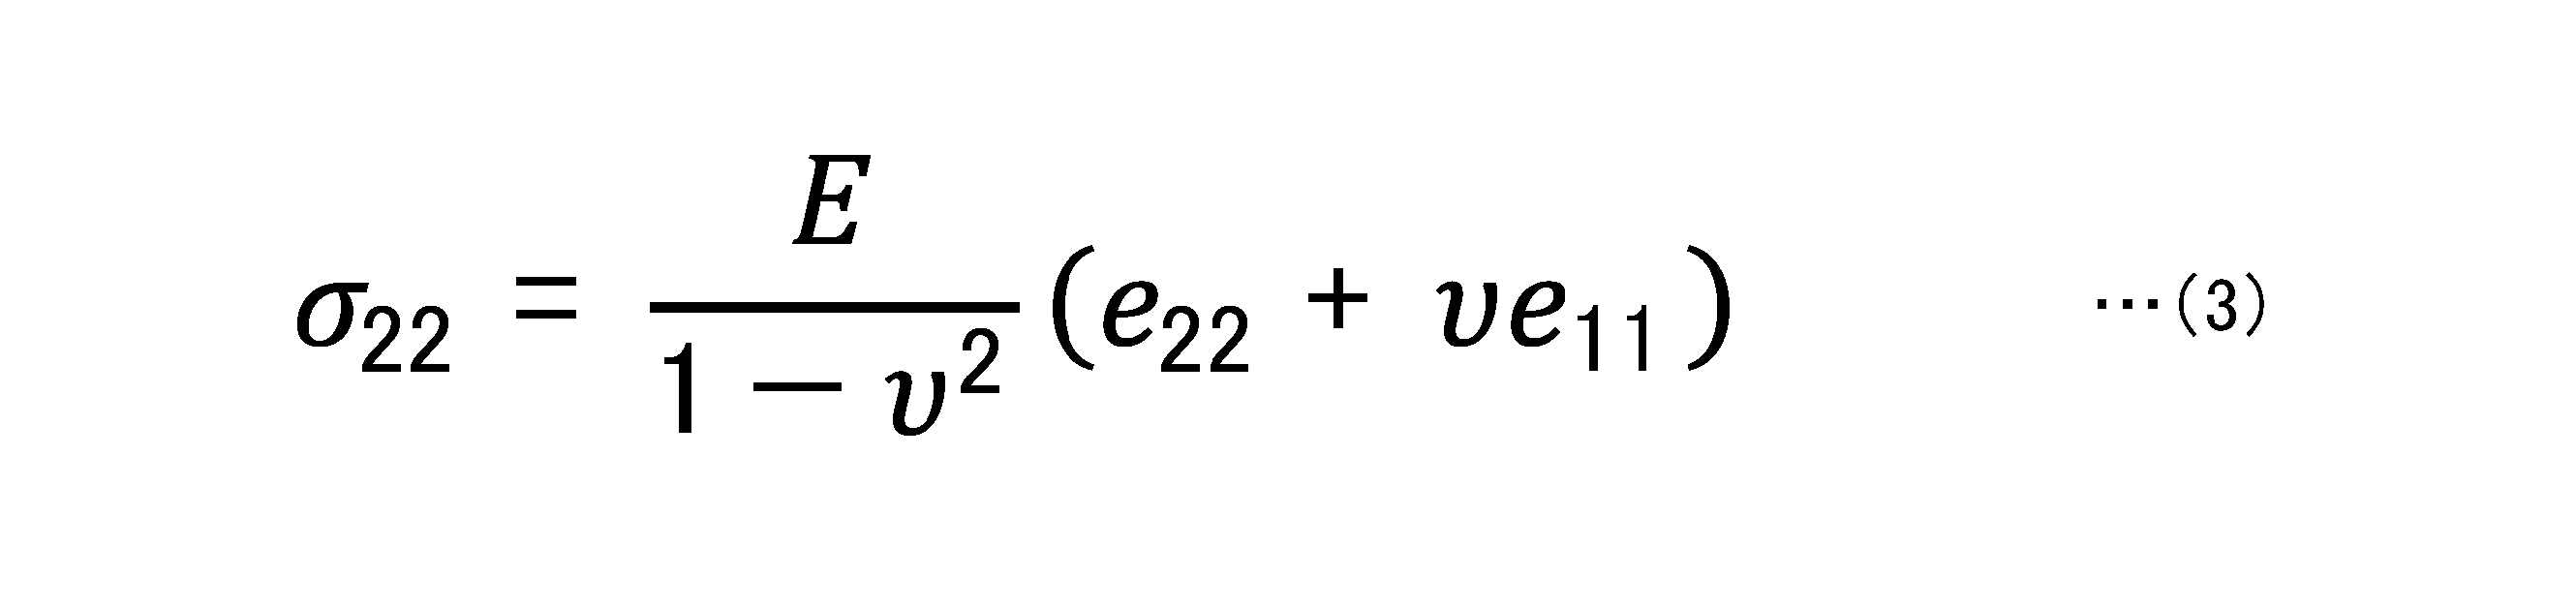
図3は、第1実施形態に係る方法のフロー図である。この方法は、試料に負荷と除荷を繰り返しながら試料表面のひずみ量分布を表示する方法であって、ステップS1と、ステップS2と、ステップS3とを備える。
図4は、第2実施形態に係る方法のフロー図である。この方法は、試料に負荷と除荷を繰り返しながら試料表面の応力分布を表示する方法であって、ステップS4と、ステップS5と、ステップS6と、ステップS7と、ステップS8と、を備える。
すなわちステップS4では、第1実施形態のステップS1に加えて、負荷時(負荷を与えているとき)の試料表面の画像も撮影する。
図5は、第3実施形態に係る方法のフロー図である。第3実施形態は、第2実施形態に対して、ステップS9と、ステップS10とをさらに備える。
図6は、第4実施形態に係る方法のフロー図である。第4実施形態は、第3実施形態に対して、ステップS10に代えてステップS110を備える。
図7は、第5実施形態に係る方法のフロー図である。第5実施形態は、第2実施形態に対して、ステップS6に代えてステップS11を備え、ステップS12をさらに備える。
図8は、第6実施形態に係る方法のフロー図である。第6実施形態は、第2実施形態に対して、ステップS4に代えてステップS13を備え、ステップS14と、ステップS15とをさらに備える。
図9は、第7実施形態に係る応力表示装置1のブロック図である。応力表示装置1は、試料に負荷と除荷を繰り返しながら試料表面の応力分布を表示する装置であって、撮影部10と、ひずみ量計測部20と、応力算出部30と、表示部40とを備える。
第8実施形態に係るプログラムは、試料に負荷と除荷を繰り返しながら試料表面の応力分布を表示するプログラムである。このプログラムは、負荷前、負荷時および除荷後の試料表面の画像を撮影するステップと、負荷前の画像と除荷後の画像との間の相関に基づき画素位置ごとの第1のひずみ量を計測するステップと、負荷前の画像と負荷時の画像との間の相関に基づき画素位置ごとの第2のひずみ量を計測するステップと、第1のひずみ量と第2のひずみ量との差分に基づき画素位置ごとの応力を算出するステップと、算出された応力の分布を各画素位置に表示するステップとをコンピュータに実行させる。
S2・・・負荷前の画像と除荷後の画像との間の相関に基づき、画素位置ごとのひずみ量を計測するステップ、
S3・・・計測されたひずみ量の分布を各画素位置に表示するステップ、
S4・・・負荷前、負荷時および除荷後の試料表面の画像を撮影するステップ、
S5・・・負荷前の画像と除荷後の画像との間の相関に基づき、画素位置ごとの第1のひずみ量を計測するステップ、
S6・・・負荷前の画像と負荷時の画像との間の相関に基づき、画素位置ごとの第2のひずみ量を計測するステップ、
S7・・・第1のひずみ量と第2のひずみ量との差分に基づき、画素位置ごとの応力を算出するステップ、
S8・・・算出された応力の分布を各画素位置に表示するステップ、
S9・・・前回の負荷および除荷で得られた応力分布と、今回の負荷および除荷で得られた応力分布との間で、同じ画素位置に表示された応力同士の差分を算出するステップ、
S10・・・差分が所定の閾値以上である画素の位置を表示するステップ、
S110・・・差分を、画素位置ごとに所定の応力値の範囲別に度数分布表示するステップ、
S11・・・負荷前の画像と負荷時の画像との間の相関に基づき、画素位置ごとの第2のひずみ量を計測し、負荷前の画像と負荷時の画像との間の相関の最大値が所定の閾値以下となる画素を検出するステップ、
S12・・・負荷前の画像と負荷時の画像との間の相関の最大値が所定の閾値以下となる画素の位置を表示するステップ、
S13・・・負荷前、負荷時および除荷後の多結晶金属材料試料表面の画像を顕微鏡カメラを用いて撮影するステップ、
S14・・・試料の金属結晶の方位を検出するステップ、
S15・・・検出した金属結晶の方位を金属結晶ごとに表示するステップ、
1・・・応力表示装置、
10・・・撮影部、
20・・・ひずみ量計測部、
30・・・応力算出部、
40・・・表示部
Claims (10)
- 試料に負荷と除荷を繰り返しながら試料表面のひずみ量分布を表示する方法であって、
負荷前および除荷後の試料表面の画像を撮影するステップと、
負荷前の画像と除荷後の画像との間の相関に基づき画素位置ごとのひずみ量を計測するステップと、
計測されたひずみ量の分布を各画素位置に表示するステップと
を備える方法。 - 試料に負荷と除荷を繰り返しながら試料表面の応力分布を表示する方法であって、
負荷前、負荷時および除荷後の試料表面の画像を撮影するステップと、
負荷前の画像と除荷後の画像との間の相関に基づき画素位置ごとの第1のひずみ量を計測するステップと、
負荷前の画像と負荷時の画像との間の相関に基づき画素位置ごとの第2のひずみ量を計測するステップと、
前記第1のひずみ量と前記第2のひずみ量との差分に基づき画素位置ごとの応力を算出するステップと、
算出された応力の分布を各画素位置に表示するステップと
を備える方法。 - 前回の負荷および除荷で得られた応力分布と、今回の負荷および除荷で得られた応力分布との間で、同じ画素位置に表示された応力同士の差分を算出するステップと、
前記差分が所定の閾値以上である画素位置を表示するステップと
をさらに備える請求項2に記載の方法。 - 前回の負荷および除荷で得られた応力分布と、今回の負荷および除荷で得られた応力分布との間で、同じ画素位置に表示された応力同士の差分を算出するステップと、
前記応力同士の差分を、画素位置ごとに所定の応力値の範囲別に度数分布表示するステップと
をさらに備える請求項2または3に記載の方法。 - 前回の負荷および除荷で得られた応力分布と、今回の負荷および除荷で得られた応力分布との間で、材料全体の応力同士の差分を算出するステップと、
前記材料全体の応力同士の差分を、除荷ごとに度数分布表示するステップと
をさらに備える請求項2または3に記載の方法。 - 前記第2のひずみ量を計測するステップにおいて、負荷前の画像と負荷時の画像との間の相関の最大値が所定の閾値以下となる画素を検出し、当該検出した画素の位置を表示するステップをさらに備える請求項2乃至5のいずれかに記載の方法。
- 前記試料は多結晶金属材料であり、前記撮影するステップは顕微鏡カメラを用いて実行され、
前記試料の金属結晶の方位を検出するステップと、当該検出した金属結晶の方位を金属結晶ごとに表示するステップとをさらに備える請求項2乃至6のいずれかに記載の方法。 - 前記試料は弾性域にある請求項2乃至7のいずれかに記載の方法。
- 試料に負荷と除荷を繰り返しながら試料表面の応力分布を表示する装置であって、
負荷前、負荷時および除荷後の試料表面の画像を撮影する撮影部と、
負荷前と除荷後の画像間の相関に基づき画素位置ごとの第1のひずみ量を計測し、負荷前と負荷時の画像間の相関に基づき画素位置ごとの第2のひずみ量を計測するひずみ量計測部と、
前記第1のひずみ量と前記第2のひずみ量との差分に基づき画素位置ごとの応力を算出する応力算出部と、
算出された応力の分布を各画素位置に表示する表示部と
を備える装置。 - 試料に負荷と除荷を繰り返しながら試料表面の応力分布を表示するプログラムであって、
負荷前、負荷時および除荷後の試料表面の画像を撮影するステップと、
負荷前の画像と除荷後の画像との間の相関に基づき画素位置ごとの第1のひずみ量を計測するステップと、
負荷前の画像と負荷時の画像との間の相関に基づき画素位置ごとの第2のひずみ量を計測するステップと、
前記第1のひずみ量と前記第2のひずみ量との差分に基づき画素位置ごとの応力を算出するステップと、
算出された応力の分布を各画素位置に表示するステップと
をコンピュータに実行させるプログラム。
Priority Applications (4)
| Application Number | Priority Date | Filing Date | Title |
|---|---|---|---|
| JP2021528233A JP7253284B2 (ja) | 2019-06-26 | 2020-06-15 | 応力およびひずみ量分布表示方法、装置およびプログラム |
| KR1020217038692A KR102578830B1 (ko) | 2019-06-26 | 2020-06-15 | 응력 및 변형량 분포 표시 방법, 장치 및 프로그램 |
| CN202080041326.2A CN116897275B (zh) | 2019-06-26 | 2020-06-15 | 应力及应变量分布显示方法、装置及程序产品 |
| US17/621,340 US12135312B2 (en) | 2019-06-26 | 2020-06-15 | Stress and strain amount distribution display method, device, and program |
Applications Claiming Priority (2)
| Application Number | Priority Date | Filing Date | Title |
|---|---|---|---|
| JP2019118848 | 2019-06-26 | ||
| JP2019-118848 | 2019-06-26 |
Publications (1)
| Publication Number | Publication Date |
|---|---|
| WO2020262087A1 true WO2020262087A1 (ja) | 2020-12-30 |
Family
ID=74061964
Family Applications (1)
| Application Number | Title | Priority Date | Filing Date |
|---|---|---|---|
| PCT/JP2020/023458 Ceased WO2020262087A1 (ja) | 2019-06-26 | 2020-06-15 | 応力およびひずみ量分布表示方法、装置およびプログラム |
Country Status (5)
| Country | Link |
|---|---|
| US (1) | US12135312B2 (ja) |
| JP (1) | JP7253284B2 (ja) |
| KR (1) | KR102578830B1 (ja) |
| CN (1) | CN116897275B (ja) |
| WO (1) | WO2020262087A1 (ja) |
Cited By (1)
| Publication number | Priority date | Publication date | Assignee | Title |
|---|---|---|---|---|
| CN117191856A (zh) * | 2023-09-12 | 2023-12-08 | 中国矿业大学 | 一种煤显微组分热应变数字图像测量装置及方法 |
Families Citing this family (3)
| Publication number | Priority date | Publication date | Assignee | Title |
|---|---|---|---|---|
| JP2021173633A (ja) * | 2020-04-24 | 2021-11-01 | 株式会社島津製作所 | 材料試験機、及び材料試験機における表示方法 |
| WO2025187664A1 (ja) * | 2024-03-06 | 2025-09-12 | 国立研究開発法人科学技術振興機構 | ひずみ量測定装置、ひずみ量測定方法およびプログラム |
| CN119958747A (zh) * | 2025-02-20 | 2025-05-09 | 浙江大学杭州国际科创中心 | 一种基于fib-dic技术的微观残余应力检测方法 |
Citations (5)
| Publication number | Priority date | Publication date | Assignee | Title |
|---|---|---|---|---|
| US4591996A (en) * | 1981-05-18 | 1986-05-27 | Vachon Reginald I | Apparatus and method for determining stress and strain in pipes, pressure vessels, structural members and other deformable bodies |
| JP2014115281A (ja) * | 2012-12-06 | 2014-06-26 | Boeing Co | 多重スケールのデジタル画像相関パターン及び計測 |
| JP2016085153A (ja) * | 2014-10-28 | 2016-05-19 | 株式会社ジェイテクト | 赤外線応力測定方法および赤外線応力測定装置 |
| JP2016206104A (ja) * | 2015-04-27 | 2016-12-08 | 国立大学法人 岡山大学 | 残留応力の測定方法、弾性限界応力の測定方法、残留応力の測定装置および弾性限界応力の測定装置 |
| CN106370334A (zh) * | 2016-09-30 | 2017-02-01 | 西安交通大学 | 一种基于阶梯孔法的内部残余应力测量方法 |
Family Cites Families (17)
| Publication number | Priority date | Publication date | Assignee | Title |
|---|---|---|---|---|
| JPS60209132A (ja) * | 1984-03-31 | 1985-10-21 | Jeol Ltd | 応力分布画像形成方法 |
| JPS6138441A (ja) * | 1984-07-30 | 1986-02-24 | Jeol Ltd | 被検体応力分布の画像化方法 |
| CN1285893C (zh) * | 2004-07-22 | 2006-11-22 | 上海天竹机电科技有限公司 | 基于图像信息处理技术的压力测量与分析装置 |
| JP4630201B2 (ja) * | 2005-02-28 | 2011-02-09 | 株式会社神戸製鋼所 | 構造部材の応力推定方法 |
| JP2006313094A (ja) * | 2005-05-06 | 2006-11-16 | Eizo Nakaza | 材料解析方法及び解析装置 |
| JP4257982B2 (ja) | 2006-03-14 | 2009-04-30 | 国立大学法人山口大学 | 歪分布計測システムと弾性率分布計測システム及びそれらの方法 |
| CN101319977A (zh) * | 2008-07-18 | 2008-12-10 | 哈尔滨工业大学 | 真应力-真应变计算模型及测试系统 |
| KR101163916B1 (ko) * | 2010-10-20 | 2012-07-09 | 한국생산기술연구원 | 응력-변형률 곡선을 획득하는 방법 및 그 장치 |
| JP5765014B2 (ja) * | 2011-03-30 | 2015-08-19 | Jfeスチール株式会社 | プレス成形解析方法 |
| EP2740075A4 (en) | 2011-08-02 | 2014-12-31 | Us Gov Sec Navy | SYSTEM AND METHOD FOR REMOTE CONTROLLED FULL-SIDED THREE-DIMENSIONAL EXTENSION AND LOAD MEASUREMENTS |
| US9311566B2 (en) | 2012-08-03 | 2016-04-12 | George Mason Research Foundation, Inc. | Method and system for direct strain imaging |
| WO2015008404A1 (ja) | 2013-07-18 | 2015-01-22 | 独立行政法人産業技術総合研究所 | 規則性模様による変位分布のための測定方法、装置およびそのプログラム |
| JP6464815B2 (ja) | 2015-02-26 | 2019-02-06 | 新日鐵住金株式会社 | 歪み測定方法及び装置、並びにプログラム及び記録媒体 |
| CN109313110A (zh) * | 2016-05-13 | 2019-02-05 | 沙特基础工业全球技术公司 | 使用数字图像相关技术的应用评估 |
| US11557456B2 (en) * | 2018-09-14 | 2023-01-17 | University Of Connecticut | Real-time direct measurement of mechanical properties in-situ of scanning beam microscope |
| CA3029939C (en) * | 2019-01-14 | 2021-08-17 | Oren Petel | Cineradiography-based method and apparatus for testing protective headgear |
| US10989523B2 (en) * | 2019-03-14 | 2021-04-27 | The Boeing Company | Sub-surface patterning for diffraction-based strain measurement and damage detection in structures |
-
2020
- 2020-06-15 WO PCT/JP2020/023458 patent/WO2020262087A1/ja not_active Ceased
- 2020-06-15 CN CN202080041326.2A patent/CN116897275B/zh active Active
- 2020-06-15 US US17/621,340 patent/US12135312B2/en active Active
- 2020-06-15 JP JP2021528233A patent/JP7253284B2/ja active Active
- 2020-06-15 KR KR1020217038692A patent/KR102578830B1/ko active Active
Patent Citations (5)
| Publication number | Priority date | Publication date | Assignee | Title |
|---|---|---|---|---|
| US4591996A (en) * | 1981-05-18 | 1986-05-27 | Vachon Reginald I | Apparatus and method for determining stress and strain in pipes, pressure vessels, structural members and other deformable bodies |
| JP2014115281A (ja) * | 2012-12-06 | 2014-06-26 | Boeing Co | 多重スケールのデジタル画像相関パターン及び計測 |
| JP2016085153A (ja) * | 2014-10-28 | 2016-05-19 | 株式会社ジェイテクト | 赤外線応力測定方法および赤外線応力測定装置 |
| JP2016206104A (ja) * | 2015-04-27 | 2016-12-08 | 国立大学法人 岡山大学 | 残留応力の測定方法、弾性限界応力の測定方法、残留応力の測定装置および弾性限界応力の測定装置 |
| CN106370334A (zh) * | 2016-09-30 | 2017-02-01 | 西安交通大学 | 一种基于阶梯孔法的内部残余应力测量方法 |
Cited By (1)
| Publication number | Priority date | Publication date | Assignee | Title |
|---|---|---|---|---|
| CN117191856A (zh) * | 2023-09-12 | 2023-12-08 | 中国矿业大学 | 一种煤显微组分热应变数字图像测量装置及方法 |
Also Published As
| Publication number | Publication date |
|---|---|
| US12135312B2 (en) | 2024-11-05 |
| KR20220005534A (ko) | 2022-01-13 |
| KR102578830B1 (ko) | 2023-09-15 |
| CN116897275A (zh) | 2023-10-17 |
| CN116897275B (zh) | 2026-06-30 |
| JPWO2020262087A1 (ja) | 2020-12-30 |
| JP7253284B2 (ja) | 2023-04-06 |
| US20220412856A1 (en) | 2022-12-29 |
Similar Documents
| Publication | Publication Date | Title |
|---|---|---|
| JP7253284B2 (ja) | 応力およびひずみ量分布表示方法、装置およびプログラム | |
| Wei et al. | Analysis of ductile damage and fracture under reverse loading | |
| Demir et al. | Mechanical and microstructural single-crystal Bauschinger effects: Observation of reversible plasticity in copper during bending | |
| Tong et al. | Time-resolved strain mapping measurements of individual Portevin–Le Chatelier deformation bands | |
| EP2688288A1 (en) | Image compositing device, image compositing method, image compositing program, and recording medium | |
| JP4833172B2 (ja) | 結晶方位の方位差分布の測定方法及び塑性ひずみの局所分布の測定方法 | |
| WO2016152076A1 (ja) | 構造物の状態判定装置と状態判定システムおよび状態判定方法 | |
| EP2796916B1 (en) | Image processing device, imaging device, microscope system, image processing method, and image processing program | |
| JP6299380B2 (ja) | 金属材料のgn転位密度算出方法 | |
| US8179301B2 (en) | Image processor and image processing method for synthetic aperture radar | |
| US9002499B2 (en) | Methods for determining a recovery state of a metal alloy | |
| JP7075773B2 (ja) | 画像処理装置、顕微鏡システム、画像処理方法および画像処理プログラム | |
| CN111653323B (zh) | 一种金属材料变形能力预估方法 | |
| CN120213645B (zh) | 一种紧固件的抗拉伸性能检测方法及装置 | |
| CN113656959B (zh) | 一种基于光学测量的含节理岩石动态断裂模式的分类方法 | |
| JP5583489B2 (ja) | 金属材料の損傷評価方法および装置 | |
| US10846819B2 (en) | Method and apparatus to infer structural stresses with visual image and video data | |
| JP7474225B2 (ja) | 金属材料のミクロ組織の損傷挙動評価方法 | |
| EP3015850B1 (en) | Image acquiring method and image acquiring apparatus using same | |
| Nagrodzka-Godycka et al. | State-of-the-art framework for high-speed camera and photogrammetric use in geometry evaluation of prestressed concrete failure process | |
| EP2722819A1 (en) | Character region pixel identification device and method thereof | |
| JP4909925B2 (ja) | 構造物の検査画像処理装置及び処理方法 | |
| JP7564468B2 (ja) | 施工方法及び検出装置 | |
| CN117667735B (zh) | 图像增强软件响应时间校准装置及方法 | |
| JPH04346004A (ja) | 変位測定装置 |
Legal Events
| Date | Code | Title | Description |
|---|---|---|---|
| 121 | Ep: the epo has been informed by wipo that ep was designated in this application |
Ref document number: 20832869 Country of ref document: EP Kind code of ref document: A1 |
|
| ENP | Entry into the national phase |
Ref document number: 20217038692 Country of ref document: KR Kind code of ref document: A |
|
| ENP | Entry into the national phase |
Ref document number: 2021528233 Country of ref document: JP Kind code of ref document: A |
|
| WWE | Wipo information: entry into national phase |
Ref document number: 202080041326.2 Country of ref document: CN |
|
| NENP | Non-entry into the national phase |
Ref country code: DE |
|
| 122 | Ep: pct application non-entry in european phase |
Ref document number: 20832869 Country of ref document: EP Kind code of ref document: A1 |