WO2020195618A1 - 血圧関連情報表示装置、血圧関連情報表示方法、およびプログラム - Google Patents
血圧関連情報表示装置、血圧関連情報表示方法、およびプログラム Download PDFInfo
- Publication number
- WO2020195618A1 WO2020195618A1 PCT/JP2020/008982 JP2020008982W WO2020195618A1 WO 2020195618 A1 WO2020195618 A1 WO 2020195618A1 JP 2020008982 W JP2020008982 W JP 2020008982W WO 2020195618 A1 WO2020195618 A1 WO 2020195618A1
- Authority
- WO
- WIPO (PCT)
- Prior art keywords
- blood pressure
- surge
- related information
- caution
- information display
- Prior art date
- Legal status (The legal status is an assumption and is not a legal conclusion. Google has not performed a legal analysis and makes no representation as to the accuracy of the status listed.)
- Ceased
Links
Images




Classifications
-
- A—HUMAN NECESSITIES
- A61—MEDICAL OR VETERINARY SCIENCE; HYGIENE
- A61B—DIAGNOSIS; SURGERY; IDENTIFICATION
- A61B5/00—Measuring for diagnostic purposes; Identification of persons
- A61B5/02—Detecting, measuring or recording for evaluating the cardiovascular system, e.g. pulse, heart rate, blood pressure or blood flow
- A61B5/021—Measuring pressure in heart or blood vessels
- A61B5/02108—Measuring pressure in heart or blood vessels from analysis of pulse wave characteristics
- A61B5/02116—Measuring pressure in heart or blood vessels from analysis of pulse wave characteristics of pulse wave amplitude
-
- A—HUMAN NECESSITIES
- A61—MEDICAL OR VETERINARY SCIENCE; HYGIENE
- A61B—DIAGNOSIS; SURGERY; IDENTIFICATION
- A61B5/00—Measuring for diagnostic purposes; Identification of persons
- A61B5/02—Detecting, measuring or recording for evaluating the cardiovascular system, e.g. pulse, heart rate, blood pressure or blood flow
- A61B5/021—Measuring pressure in heart or blood vessels
- A61B5/022—Measuring pressure in heart or blood vessels by applying pressure to close blood vessels, e.g. against the skin; Ophthalmodynamometers
- A61B5/02233—Occluders specially adapted therefor
-
- A—HUMAN NECESSITIES
- A61—MEDICAL OR VETERINARY SCIENCE; HYGIENE
- A61B—DIAGNOSIS; SURGERY; IDENTIFICATION
- A61B5/00—Measuring for diagnostic purposes; Identification of persons
- A61B5/74—Details of notification to user or communication with user or patient; User input means
- A61B5/742—Details of notification to user or communication with user or patient; User input means using visual displays
- A61B5/743—Displaying an image simultaneously with additional graphical information, e.g. symbols, charts, function plots
-
- G—PHYSICS
- G06—COMPUTING OR CALCULATING; COUNTING
- G06T—IMAGE DATA PROCESSING OR GENERATION, IN GENERAL
- G06T11/00—Two-dimensional [2D] image generation
- G06T11/10—Texturing; Colouring; Generation of textures or colours
-
- G—PHYSICS
- G06—COMPUTING OR CALCULATING; COUNTING
- G06T—IMAGE DATA PROCESSING OR GENERATION, IN GENERAL
- G06T11/00—Two-dimensional [2D] image generation
- G06T11/20—Drawing from basic elements
- G06T11/26—Drawing of charts or graphs
-
- G—PHYSICS
- G06—COMPUTING OR CALCULATING; COUNTING
- G06T—IMAGE DATA PROCESSING OR GENERATION, IN GENERAL
- G06T2210/00—Indexing scheme for image generation or computer graphics
- G06T2210/41—Medical
Definitions
- the present invention relates to a blood pressure-related information display device and a blood pressure-related information display method, and more particularly to a device and method for visualizing and displaying information related to a blood pressure surge of a subject.
- the present invention also relates to a program for causing a computer to execute such a blood pressure-related information display method.
- Patent Document 1 WO2017 / 082107A1
- SAS sleep apnea syndrome
- the relationship between the representative value [mmHg] of (the difference between the blood pressure value at the surge peak point and the blood pressure value) is displayed as a two-dimensional graph. Visualizing and displaying information related to blood pressure surges that have occurred in patients is considered to be useful for the diagnosis and treatment of SAS.
- Patent Document 1 does not disclose the visualization and display of information related to blood pressure surge for each time zone.
- the blood pressure baseline is below the blood pressure reference value LM
- the measured blood pressure value is generally less than the blood pressure standard value LM (normal range), so there is no risk from the viewpoint of the absolute value of blood pressure. It will be judged.
- the blood pressure-related information display device of this disclosure is A blood pressure-related information display device that visualizes and displays information related to blood pressure surges.
- a blood pressure surge detector that detects a blood pressure surge based on predetermined criteria from time-series data of blood pressure that changes in conjunction with the subject's pulsation,
- a feature amount calculation unit that calculates a feature amount representing the characteristics of the detected blood pressure surge,
- a statistic calculation unit that statistically processes the detected number of occurrences of the blood pressure surge and / or the feature amount for each time zone to calculate the statistic.
- the caution level calculation unit for obtaining the caution level indicating the degree of caution regarding the blood pressure surge for each time zone, and It is characterized by including a display processing unit that performs a process of displaying the obtained caution level and / or the statistic side by side for each time zone on the display screen.
- the "predetermined criteria” typically refers to criteria for detecting blood pressure surges in patients with sleep apnea syndrome (SAS). For example, from the time of the surge start point to the time of the surge peak point within the peak detection section (for example, a period of 15 beats) as disclosed in Japanese Patent Application No. 2017-048946 and Japanese Patent Application No. 2017-050066 In addition to being included, the difference (blood pressure fluctuation) between the systolic blood pressure value at the time of the surge start point and the systolic blood pressure value at the time of the peak point is 20 mmHg (or 15 mmHg) or more, and the time and peak of the surge start point. It means that the period between the point time is larger than 5 beats and the period between the peak point time and the surge end point time is larger than 7 beats.
- the “feature amount" representing the characteristics of the blood pressure surge is, for example, the surge peak value (blood pressure value at the peak point) and the surge fluctuation amount (difference in blood pressure value from the start point to the peak point of the blood pressure surge) with respect to systolic blood pressure. ), Surge time (time from the start point to the end point of the blood pressure surge), surge rise rate (value obtained by dividing the above surge fluctuation amount by the time from the start point to the peak point of the blood pressure surge), etc. ..
- statistical processing refers to processing for averaging, processing for obtaining the median, processing for obtaining the standard deviation, and the like.
- the "display screen” typically refers to the screen of the display device, but may be, for example, a paper surface output by a printer.
- the blood pressure surge detection unit detects the blood pressure surge from the time-series data of the blood pressure that changes in conjunction with the pulsation of the subject based on a predetermined determination criterion.
- the feature amount calculation unit calculates a feature amount representing the characteristics of the detected blood pressure surge.
- the statistic calculation unit calculates the statistic by statistically processing the detected number of occurrences of the blood pressure surge and / or the feature amount for each time zone. Based on the number of occurrences of the blood pressure surge and / or the statistic of the feature amount, the caution level calculation unit obtains the caution level indicating the degree of caution regarding the blood pressure surge for each time zone.
- the display processing unit performs a process of displaying the obtained caution level and / or the statistic side by side for each time zone on the display screen.
- the blood pressure-related information display device visualizes and displays information related to the blood pressure surge for each time zone.
- the user typically, refers to a medical person such as a doctor or a nurse, a system administrator, etc., may be a subject, and the same applies hereinafter
- the user can see the above display screen. It is possible to know the transition of the attention level and / or the above statistics for each time zone.
- the doctor can understand the tendency of the patient (subject)'s symptom for each time zone, and can easily give advice to the patient at the time of examination.
- the doctor can first check the surge case during the time period when the above caution level is high, which enables efficient analysis. Become. Furthermore, the information displayed on the above display screen is useful for diagnosing and treating SAS, as well as studying the relationship between blood pressure surges and cardiovascular events (angina, myocardial infarction, ischemic heart failure, etc.). , May lead to new clinical findings.
- the degree of caution is divided into a plurality of stages according to the degree of caution, and each of the plurality of stages is represented by a specific color according to the stage. It is characterized by that.
- the "plurality of stages” included in the above caution level refers to, for example, three stages of low, medium, and high, but is not limited to this.
- Examples of the "specific color” include, but are not limited to, three colors of green (G), yellow (Y), and red (R).
- the degree of caution is divided into a plurality of stages according to the degree of caution, and each of the plurality of stages is represented by a specific color according to the stage. Will be done. Therefore, the user can intuitively grasp the degree to be noted indicated by the caution level by the specific color displayed on the display screen.
- the above display processing unit On the display screen, the closed areas corresponding to each time zone are set side by side according to the progress of the time zone, and Each of the closed regions is characterized in that the specific color is assigned according to the degree of caution in the corresponding time zone.
- the "closed area” refers to, for example, a rectangular area, but is not limited to this.
- the "progress of the time zone” means a sequence from the previous time zone to the later time zone on the display screen.
- the display processing unit sets closed regions corresponding to each time zone side by side along the progress of the time zone on the display screen. At the same time, the display processing unit assigns each of the closed regions a specific color according to the degree of caution in the corresponding time zone. Therefore, the user can intuitively grasp the transition of the caution level for each time zone by looking at the display screen.
- the blood pressure-related information display device of one embodiment is characterized in that the display processing unit displays on the display screen in a state in which graphs representing the statistics are superimposed on the plurality of closed regions. ..
- the display processing unit displays a graph representing the statistic on the plurality of closed areas on the display screen. Therefore, by looking at the display screen, the user can intuitively grasp the transition of the statistic for each time zone as well as the transition of the statistic for each time zone at the stage indicated by the caution level. .. Further, by looking at the graph, the user can intuitively grasp the reason and grounds of the degree of caution indicated by the caution level for each time zone.
- the statistic is characterized by including at least the number of occurrences of the blood pressure surge, the surge fluctuation amount as the feature amount, and the surge peak value.
- the user sees the display screen to obtain the number of occurrences of the blood pressure surge included in the statistic, the surge fluctuation amount as the feature amount, and the surge peak value. You can know the transition for each time zone.
- the caution level calculation unit includes the number of occurrences of the blood pressure surge, the surge fluctuation amount as the feature amount, and the statistic about the surge peak value for each time zone. , Each of the above is characterized in that the degree of caution is obtained based on the comparison result with a predetermined threshold value.
- the above caution level is obtained by a simple arithmetic process.
- the above caution level calculation unit For each of the time zones, the number of occurrences of the blood pressure surge, the amount of surge fluctuation as the above-mentioned feature amount, and the above-mentioned statistic about the surge peak value, each of the individual indexes indicating the degree to be noted is determined in advance. Based on the comparison result with different (m-1) threshold values, the individual index calculation unit that obtains the individual index by dividing it into m steps according to the degree to be noted above. Includes an integrated processing unit that divides the degree of caution into the m stages using the individual indexes obtained for the number of occurrences of the blood pressure surge, the surge fluctuation amount as the feature amount, and the surge peak value, respectively. It is characterized by that.
- the most (stage) is determined as the above-mentioned caution level (majority decision method), or the highest (stage) among the above three levels of low, medium, and high is determined as the above-mentioned caution level. Refers to the method of obtaining by the method (high-level priority method).
- the individual index calculation unit included in the caution level calculation unit indicates the degree of caution regarding the number of occurrences of the blood pressure surge for each time zone. (This is referred to as an "occurrence frequency index”) is obtained by dividing it into m stages according to the degree to be noted above based on the comparison result with the predetermined (m-1) threshold values.
- the individual index calculation unit is an individual index indicating the degree to be noted with respect to the statistic of the surge fluctuation amount as the feature amount for each time zone (this is referred to as a "variation amount index”). Is calculated in m steps according to the degree to be noted, based on the comparison result with the predetermined (m-1) threshold values.
- the individual index calculation unit is an individual index (referred to as a "peak value index") indicating a degree to be noted with respect to the statistic regarding the surge peak value as the feature amount for each time zone. Is calculated in m steps according to the degree to be noted, based on the comparison result with the predetermined (m-1) threshold values.
- the integrated processing unit included in the caution level calculation unit is the individual index (that is, the occurrence) obtained for each of the number of occurrences of the blood pressure surge, the surge fluctuation amount as the feature amount, and the surge peak value.
- the caution level is divided into m stages for each time zone. As a result, the degree of caution required can be obtained by dividing it into the above m stages by a simple calculation process.
- the blood pressure-related information display device of one embodiment is characterized by including an input unit for variably setting the above threshold values.
- the user can variably set the above threshold values via the input unit. Therefore, the user's experience can be reflected with respect to the number of occurrences of the blood pressure surge, the surge fluctuation amount as the feature amount, and the respective threshold values (references) for the statistic regarding the surge peak value.
- the blood pressure-related information display device when the blood pressure-related information display device is provided with an input unit for variably setting (m-1) threshold values having different sizes, the user can use the input unit to set the size. (M-1) different threshold values can be variably set. Therefore, it is possible to reflect the user's experience with respect to the criteria for dividing each individual index into m stages and, by extension, for the criteria for dividing the above caution level into m stages.
- the display processing unit is displayed on the display screen.
- the number of occurrences of the blood pressure surge is represented as a bar graph for each time zone.
- the statistic for the surge peak value is represented as a dot-shaped mark for each time zone.
- the statistic for the surge fluctuation amount is represented as a line segment-shaped mark extending downward from each dot-shaped mark representing the surge peak value.
- the user sees the display screen to obtain the number of occurrences of the blood pressure surge included in the statistic, the surge fluctuation amount as the feature amount, and the surge peak value. It is possible to intuitively grasp the transition for each time zone.
- the blood pressure-related information display method of this disclosure is a blood pressure related information display method that visualizes and displays information related to blood pressure surge.
- Blood pressure surge is detected based on predetermined criteria from time-series data of blood pressure that changes in conjunction with the pulsation of the subject.
- Calculate the feature amount that represents the feature of the detected blood pressure surge The number of occurrences of the detected blood pressure surge and / or the feature amount is statistically processed for each time zone to calculate the statistic.
- the degree of caution indicating the degree of caution regarding the blood pressure surge is obtained for each time zone. It is characterized in that a process of displaying the obtained caution level and / or the statistic side by side for each time zone on the display screen is performed.
- the doctor can understand the tendency of the patient (subject)'s symptom for each time zone, and can easily give advice to the patient at the time of examination.
- the doctor can first check the surge case during the time period when the above caution level is high, which enables efficient analysis. Become.
- the information displayed on the above display screen is useful for diagnosing and treating SAS, as well as studying the relationship between blood pressure surges and cardiovascular events (angina, myocardial infarction, ischemic heart failure, etc.). , May lead to new clinical findings.
- the blood pressure related information display device of this disclosure is A blood pressure-related information display device that visualizes and displays information related to blood pressure surges.
- a blood pressure surge detector that detects a blood pressure surge based on predetermined criteria from time-series data of blood pressure that changes in conjunction with the subject's pulsation,
- a feature amount calculation unit that calculates a feature amount representing the characteristics of the detected blood pressure surge,
- a statistic calculation unit that statistically processes the number of occurrences of the blood pressure surge detected for a plurality of subjects and / or the feature amount and calculates the statistic for each subject.
- the caution level calculation unit for obtaining the caution level indicating the degree of caution regarding the blood pressure surge for each subject.
- It is characterized by including a display processing unit that performs a process of displaying the obtained caution level and / or the statistic side by side for each subject on the display screen.
- the blood pressure surge detection unit detects the blood pressure surge from the time-series data of the blood pressure that changes in conjunction with the pulsation of the subject based on a predetermined determination criterion.
- the feature amount calculation unit calculates a feature amount representing the characteristics of the detected blood pressure surge.
- the statistic calculation unit statistically processes the number of occurrences of the blood pressure surge detected for a plurality of subjects and / or the feature amount, and calculates the statistic for each subject. Based on the number of occurrences of the blood pressure surge and / or the statistic for each subject regarding the feature amount, the caution level calculation unit determines the caution level indicating the degree of caution regarding the blood pressure surge for each subject. Ask.
- the display processing unit performs a process of displaying the obtained degree of caution and / or the statistic side by side for each subject on the display screen.
- the blood pressure-related information display device visualizes and displays information related to the blood pressure surge for each subject.
- the user can know the caution level and / or the statistic for each subject by looking at the display screen.
- the doctor can evaluate and analyze the symptom by giving priority to the patient having the highest degree of attention among the plurality of patients (subjects).
- the doctor can identify patients having the same degree of caution and / or the above statistics as a group. This allows patients in that group to look for common lifestyle habits, common trends in measurements other than blood pressure surges (eg, measurements for cardiovascular events), and with other groups. You can check the differences between. In this way, effective analysis can be performed for the diagnosis and treatment of blood pressure surges.
- the degree of caution is divided into a plurality of stages according to the degree of caution, and each of the plurality of stages is represented by a specific color according to the stage. It is characterized by that.
- the degree of caution is divided into a plurality of stages according to the degree of caution, and each of the plurality of stages is represented by a specific color according to the stage. Will be done. Therefore, the user can intuitively grasp the degree to be noted indicated by the caution level by the specific color displayed on the display screen.
- the above display processing unit On the above display screen, the closed areas corresponding to each subject are set side by side in the horizontal or vertical direction, and are set. Each of the closed areas is characterized in that the specific color corresponding to the degree of caution of the corresponding subject is given.
- the display processing unit sets closed areas corresponding to each subject side by side in the horizontal direction or the vertical direction on the display screen. At the same time, the display processing unit assigns the specific color to each of the closed regions according to the degree of caution of the corresponding subject. Therefore, the user can intuitively grasp the degree of caution for each subject by looking at the display screen.
- the blood pressure-related information display device of one embodiment is characterized in that the display processing unit displays on the display screen in a state in which graphs representing the statistics are superimposed on the plurality of closed regions. ..
- the blood pressure-related information display method of this disclosure is a blood pressure related information display method that visualizes and displays information related to blood pressure surge.
- Blood pressure surge is detected based on predetermined criteria from time-series data of blood pressure that changes in conjunction with the pulsation of the subject.
- Calculate the feature amount that represents the feature of the detected blood pressure surge The number of occurrences of the blood pressure surge detected for a plurality of subjects and / or the feature amount was statistically processed, and the statistic was calculated for each subject.
- the degree of caution indicating the degree of caution regarding the blood pressure surge was obtained for each subject. It is characterized in that a process of displaying the obtained caution level and / or the statistic side by side for each subject is performed on the display screen.
- the user can know the caution level and / or the statistic for each subject by looking at the display screen.
- the doctor can evaluate and analyze the symptom by giving priority to the patient having the highest degree of attention among the plurality of patients (subjects).
- the doctor can identify patients having the same degree of caution and / or the above statistics as a group. This allows patients in that group to look for common lifestyle habits, common trends in measurements other than blood pressure surges (eg, measurements for cardiovascular events), and with other groups. You can check the differences between. In this way, effective analysis can be performed for the diagnosis and treatment of blood pressure surges.
- this disclosed program is a program for causing a computer to execute the above blood pressure-related information display method.
- the blood pressure-related information display device and the blood pressure-related information display method of this disclosure information related to the blood pressure surge can be visualized and displayed for each time zone. Further, the blood pressure-related information display method can be implemented by causing a computer to execute the program of this disclosure.
- FIG. 7A is a diagram showing time-series data of the overnight blood pressure of the subject.
- FIG. 7B is an enlarged view of a part of FIG.
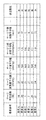
- FIG. 7A to show the blood pressure surge detected on the time-series data. It is a figure which illustrates the waveform of the blood pressure surge. Regarding the number of occurrences of blood pressure surges, the amount of surge fluctuation as a feature amount, and the statistics on the surge peak value, a reference table for classifying the individual indicators showing the degree of caution into three stages of low, medium, and high is provided. It shows. It shows the three statistics obtained for each time zone (“number of surge occurrences”, “average surge fluctuation”, and “average surge peak value”) and the degree to be noted for each of these three statistics. The three individual indicators ("occurrence frequency index”, “variation amount index”, and “peak value index”) are associated with the "attention required" obtained by integrating these individual indicators for each time zone.
- FIG. 1 shows an example in which the blood pressure-related information display device of the present invention is configured as a system of one embodiment on a network (the whole is indicated by reference numeral 100).
- This system 100 is a hospital terminal having a tonometry type sphygmomanometer 200, a server 300 that detects and analyzes a blood pressure surge from time-series data of blood pressure acquired by the sphygmomanometer 200, and a display 420 as a display screen. It includes 400A and 400B.
- These sphygmomanometers 200, servers 300, and hospital terminals 400A and 400B can communicate with each other via a network 900, which is a local area network (LAN) in this example.
- LAN local area network
- Communication via the network 900 may be wireless or wired.
- the network 900 is an in-hospital LAN (Local Area Network), but is not limited to this, and may be another type of network such as the Internet, or a USB cable or the like is used. It may be one-to-one communication.
- two hospital terminals 400A and 400B (hereinafter collectively referred to by reference numerals 400) are shown in this example, three or more hospital terminals may be provided.
- sphygmomanometer 200 is shown in this example, two or more sphygmomanometers may be provided.
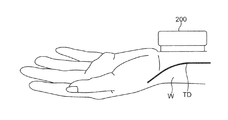
- the sphygmomanometer 200 shown in FIG. 1 includes, for example, a tonometry type sphygmomanometer as disclosed in Japanese Patent Application Laid-Open No. 2018-42606.
- FIG. 2 illustrates how the sphygmomanometer 200 is attached to the wrist W of the subject.
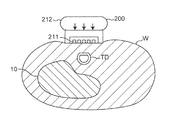
- FIG. 3 illustrates a state in which the sphygmomanometer 200 attached to the wrist W of the subject is performing blood pressure measurement.
- the sphygmomanometer 200 illustrated in FIGS. 2 and 3 continuously measures the pressure pulse wave of the radial artery TD running along the radius 10 for each beat.
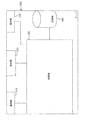
- FIG. 4 illustrates the block configuration of the sphygmomanometer 200.
- the sphygmomanometer 200 includes a blood pressure device 210, an operation unit 230, a communication unit 240, a memory 250, and a control unit 260.
- the blood pressure device 210 includes a pressure sensor 211 and a pressing mechanism 212.
- the pressing mechanism 212 applies a pressing force to the part to be measured, as shown by an arrow in FIG.
- the pressure sensor 211 continuously detects the pressure pulse wave of the radial artery TD for each beat by the tonometry method.
- the tonometry method is a method in which a pressure sensor 211 measures a pressure pulse wave to determine blood pressure by compressing a blood vessel using a pressing mechanism 212. If a blood vessel is regarded as a circular tube of uniform thickness, the internal pressure (blood pressure) of the blood vessel and the external pressure of the blood vessel are followed according to Laplace's law, considering the blood vessel wall regardless of the blood flow in the blood vessel and the presence or absence of pulsation.
- the relational expression with (pressure of pressure pulse wave) can be derived. Under the condition that the blood vessel is compacted on the pressing surface by this relational expression, the pressure of the pressure pulse wave and the blood pressure can be approximated to be equal by approximating the radii of the outer wall and the inner wall of the blood vessel. Therefore, the pressure of the pressure pulse wave becomes the same value as the blood pressure.
- the sphygmomanometer 200 measures the blood pressure value of the measurement site for each heartbeat. Then, the sphygmomanometer 200 generates time-series data 801 of blood pressure in which the measurement time (time) and the blood pressure are associated with each other, as shown in FIG. 7A, for example.
- the overnight blood pressure time series data 801 includes beat-corresponding peaks (peaks corresponding to SBP or DBP) for about 30,000 beats.
- the operation unit 230 shown in FIG. 4 receives an instruction (input) from the user.
- the operation unit 230 is composed of, for example, a plurality of buttons.
- the communication unit 240 transmits and receives various data.
- the communication unit 240 is connected to the network 900 shown in FIG.
- the memory 250 shown in FIG. 4 stores various data.
- the memory 250 can store the measured values (time series data 801 of blood pressure) measured by the blood pressure device 210, the SBP value / DBP value for each beat, the pulse rate, and the like.
- the memory 250 includes a RAM (Random Access Memory), a ROM (Read Only Memory), and the like.
- various programs are mutably stored in the memory 250.
- control unit 260 includes a CPU (Central Processing Unit).
- the control unit 260 reads each program and each data stored in the memory 250. Further, the control unit 260 controls each unit 210, 230, 240, 250 according to the read program to execute a predetermined operation (function). Further, the control unit 260 performs a predetermined calculation, analysis, processing, etc. in the control unit 260 according to the read program. It should be noted that a part or all of each function executed by the control unit 260 may be configured in hardware by one or a plurality of integrated circuits or the like.
- This sphygmomanometer 200 measures blood pressure time series data 801 (see FIG. 7 (A)) in which the measurement time (time) and blood pressure are associated with each other, such as SBP value / DBP value and pulse rate for each beat. Is output to another device (server 300 in this example).
- FIG. 5 illustrates a block configuration of the server 300.
- the server 300 includes a communication unit 310, a display 320, an operation unit 330, a storage unit 340, and a control unit 350.
- the communication unit 310 transmits and receives various data.
- the communication unit 310 is connected to the network 900 shown in FIG.
- the communication unit 310 receives, for example, the measurement data transmitted from the sphygmomanometer 200 via the network 900. Further, the communication unit 310 transmits various output data generated by the control unit 350 in the server 300 to the hospital terminal 400 via the network 900.
- the display 320 shown in FIG. 5 has a display screen for displaying various images.
- the display 320 can visually display the results of various analyzes in the control unit 350 and the like.
- the display 320 can visually display predetermined information according to a request from the user via the operation unit 330.
- the display 320 may visually display the information (data) stored in the storage unit 340.
- a liquid crystal display, an organic EL (Electro Luminescence) display, or the like can be adopted as the display 320.
- the operation unit 330 receives a predetermined operation (instruction) from the user.
- the operation unit 330 is composed of a mouse, a keyboard, and the like.
- the display 320 has not only a display function but also a function as an operation unit 330.
- the storage unit 340 stores various data.
- the storage unit 340 can store the measured values (time series data 801 of blood pressure) measured by the blood pressure device 210, and the measured data such as the SBP value / DBP value for each beat and the pulse rate.
- the storage unit 340 can also store various output data generated by the control unit 350.
- the storage unit 340 includes a RAM, a ROM, and the like. Further, various programs are stored in the storage unit 340 so as to be changeable. In this example, the storage unit 340 stores a program for carrying out the blood pressure-related information display method described later.
- a magnetic disk (HD (Hard Disk), FD (Flexible Disk)), an optical disk (CD (Compact Disc), DVD (Digital Versatile Disk)) ), BD (Blu-ray Disc)), magneto-optical disk (MO (Magneto-Optical disk)), semiconductor memory (memory card, SSD), or the like may be used.
- HD Hard Disk
- FD Fluorescent Disk
- CD Compact Disc
- DVD Digital Versatile Disk
- BD Blu-ray Disc
- MO Magneto-optical disk
- semiconductor memory memory card, SSD
- the control unit 350 includes a CPU in this example.
- the control unit 350 reads each program and each data stored in the storage unit 340. Further, the control unit 350 controls each unit 310, 320, 330, 340 according to the read program, and executes a predetermined operation (function). In addition, the control unit 350 performs predetermined calculations, analyzes, processes, and the like in the control unit 350 according to the read program. In addition, a part or all of each function executed by the control unit 350 may be configured in hardware by one or a plurality of integrated circuits or the like. The specific operation of the control unit 350 will be described later.
- the hospital terminal 400 shown in FIG. 1 is composed of a general personal computer in this example.
- the hospital terminal 400 may be a mobile terminal such as a tablet instead of the personal computer.
- the display 420 included in the hospital terminal 400 has a display screen for displaying various images.
- the display 420 visually displays, for example, images corresponding to various output data received from the server 300.
- the display 420 can visually display predetermined information according to the operation by the user.
- a liquid crystal display, an organic EL display, or the like can be adopted as the display 420.
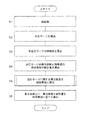
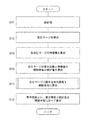
- the system 100 is roughly divided into blood pressure surge detection / analysis processing in the server 300 shown in steps S1 to S5 in FIG. 6 and blood pressure surge in the hospital terminal 400 shown in step S6 in FIG.
- the following first blood pressure-related information display method including the related information display process can be executed.
- the system 100 can also execute a second blood pressure-related information display method described later.
- First blood pressure related information display method In this first blood pressure-related information display method, information related to the blood pressure surge of the subject is visualized and displayed for each time zone.
- the measurement data including the overnight blood pressure time series data 801 (see FIG. 7 (A)), the SBP value / DBP value for each beat, the pulse rate, etc. is measured by the sphygmomanometer 200. It is assumed that the data is stored in the storage unit 340 of the server 300 via the network 900. The sphygmomanometer 200 may once transmit the measurement data to any hospital terminal 400, and the hospital terminal 400 may transmit the measurement data to the server 300.
- step S1 of FIG. 6 the control unit 350 of the server 300 functions as a preprocessing unit, smoothing using a moving average known for time series data of blood pressure, noise removal, high frequency component removal using a low-pass filter, and the like. Pretreatment of.
- control unit 350 of the server 300 extracts an effective section to be the target of detection / analysis of the blood pressure surge from the blood pressure time series data 801. That is, in the blood pressure time series data 801, the section affected by the disturbance (noise or the like) is excluded as an invalid section, and the section not affected by the disturbance is left as an effective section. As a result, the risk of erroneously detecting fluctuations due to noise as a blood pressure surge can be reduced. In addition, the processing time for detecting and analyzing blood pressure surges can be shortened.
- steps S2 to S6 in FIG. 6 shall be performed for this effective section.
- step S2 of FIG. 6 the control unit 350 of the server 300 acts as a blood pressure surge detection unit, and from the time series data 801 (of which the effective section) of the blood pressure for the subject, for example, Japanese Patent Application No. 2017-048946 No., as disclosed in Japanese Patent Application No. 2017-050066, the blood pressure surge is detected based on a predetermined criterion.
- a predetermined criterion for example, in FIG. 7B, a plurality of blood pressure surges are detected as shown by the broken rectangular frames 803, 803, .... It is said that hundreds of blood pressure surges can occur overnight.
- SBP systolic blood pressure
- one of the SBPs is shown as PS as an example) and they are connected by an envelope.
- the diastolic blood pressure (DBP) for each beat is plotted (in FIG. 7B, one of the DBPs is shown as PD as an example), which are connected by an envelope.
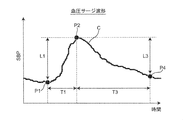
- the “predetermined criterion” for detecting the blood pressure surge is a peak detection section (for example, 15) as shown in FIG. 8 (an example of the waveform of the blood pressure surge is shown by the curve C).
- the period from the surge start point P1 to the surge peak point P2 is included in the pulse period), and the systolic blood pressure value (SBP) at the surge start point P1 and the systolic blood pressure at the peak point P2 are included.
- the difference (surge fluctuation amount) L1 from the value (SBP) is 20 mmHg (or 15 mmHg) or more, and the period T1 between the time of the surge start point P1 and the time of the peak point P2 is larger than 5 beats.
- the period T3 between the time of the peak point P2 and the time of the surge end point P4 is larger than 7 beats.
- the surge start point P1 is defined as a point prior to the peak point P2 that gives the minimum systolic blood pressure value (SBP).
- step S3 of FIG. 6 the control unit 350 of the server 300 functions as a feature amount calculation unit, and for each blood pressure surge detected for the subject (for example, surge Nos. 1, 2, ).
- “surge fluctuation amount”, “surge peak value”, “surge time”, “surge rising speed”, and “surge falling time” are calculated as the feature amount representing the characteristic of the blood pressure surge.
- the “surge fluctuation amount” is the difference L1 between the systolic blood pressure value (SBP) at the time of the surge start point P1 and the systolic blood pressure value (SBP) at the time of the peak point P2 shown in FIG. Point to.
- the “surge peak value” refers to the systolic blood pressure value (SBP) at the time of the peak point P2.
- the “surge descent time” refers to the period T3 between the time of the peak point P2 and the time of the surge end point P4.
- “Surge fluctuation amount” and “surge fluctuation amount” are shown as characteristic amounts of the blood pressure surge.
- the “surge peak value”, “surge time”, “surge rising speed”, and “surge falling time” are recorded in association with each other.
- step S4 of FIG. 6 the control unit 350 of the server 300 acts as a statistic calculation unit, and in this example, the number of occurrences of blood pressure surge detected for the subject and the feature amount calculated in step S3. Is statistically processed for each time zone to calculate the statistic.
- the statistical processing is a process of counting the number of occurrences of blood pressure surges for each time zone and averaging the feature amounts of blood pressure surges for each time zone.
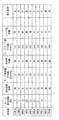
- the above statistics are the "number of surge occurrences" which is the number of occurrences of blood pressure surge, the "average value of surge fluctuation amount” as the feature amount of blood pressure surge, and "Surge peak value average value” is included.
- the "number of surge occurrences” is set for each time zone "22:00", “23:00", “0:00", ..., "7 o'clock” shown in the "time” column.
- the “average surge peak value” is recorded as “141”, “143”, “149”, ..., “149” (unit [mmHg]).
- the "occurrence frequency index” column, “variation amount index” column, “peak value index” column, and "attention required” column shown in the time zone table of FIG. 10 will be described later.
- the statistical process includes a process for finding the standard deviation, a process for finding the maximum / minimum value, a process for finding the quartile, a process for creating a bar graph, a process for creating a scatter plot, and the like. Can be included.
- the targets to be statistically processed are i) Systolic blood pressure (SBP) value / diastolic blood pressure (DBP) value for each beat, ii) Heart rate (PR) (beats / minute), iii) Combining the above-mentioned blood pressure surge features by four arithmetic operations, Etc. can be included.
- the pulse rate also gradually rises and shows a peak value, and then shows a change (mountain-shaped waveform) in a mode of falling.
- the unit period for which statistical processing should be performed is for each time zone, and in this example, it is in units of one hour, but it is not limited to this. For example, it may be every 30 minutes, every 2 hours, every 3 hours, and so on.
- step S5 of FIG. 6 the control unit 350 of the server 300 acts as a caution level calculation unit, and determines the caution level (this is represented by DC) indicating the degree of caution regarding the blood pressure surge for the subject. , Calculate for each time zone.
- DC the caution level
- control unit 350 presets “number of surge occurrences”, “average surge fluctuation amount”, and “average surge peak value” for each time zone shown in the time zone table of FIG.
- the degree of caution DC is obtained based on the comparison result with the obtained threshold value.
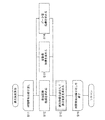
- control unit 350 executes the flow of the caution level calculation process shown in FIG.
- the control unit 350 starts a routine that repeats each time zone. From the time zone table of FIG. 10, the control unit 350 refers to the number of surge occurrences in a certain time zone (this is referred to as “attention time zone”. In the first turn, the attention time zone is in the “22:00 range”). , Surge fluctuation amount average value, surge peak value average value is read and acquired. Next, the control unit 350 acts as an individual index calculation unit (included in the caution level calculation unit), and as shown in step S12, an individual index indicating the degree to be noted regarding the “number of surge occurrences” (this is referred to as “the number of occurrences of surge”).
- step S13 the individual indexes indicating the degree to be noted regarding the “average surge fluctuation amount” (this is referred to as the “variation amount index” and is represented by the code ID 2) are set to the threshold values ⁇ 1 and ⁇ 2. It is calculated based on the comparison result of.
- step S14 an individual index (this is called a “peak value index” and is represented by a code ID 3) indicating the degree to be noted with respect to the “average surge peak value” is set with the threshold values ⁇ 1 and ⁇ 2. Obtained based on the comparison result.
- the processes of steps S12 to S14 may be executed in a different order, or may be executed in parallel with each other.
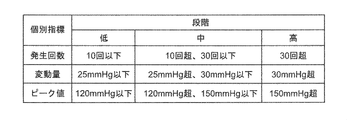
- the “occurrence frequency index” ID1, "variation amount index” ID2, and “peak value index” ID3 are all obtained by classifying them into three stages of low, medium, and high.
- the "number of surge occurrences” is three, so the "number of occurrences index” ID1 is “low” and the "average surge fluctuation amount”. Since it is 22 mmHg, the "variation amount index” ID2 is obtained as “low”, and since the "surge peak value average value” is 141 mmHg, the "peak value index” ID3 is obtained as “medium”.
- the obtained "occurrence frequency index” ID1, "variation amount index” ID2, and “peak value index” ID3 correspond to the attention time zone ("22:00 level” in the first turn) of the time zone table of FIG. It is attached and recorded.
- control unit 350 acts as an integrated processing unit (included in the caution level calculation unit), integrates the attention time zone using an individual index, and performs a blood pressure surge.
- the degree of caution DC which indicates the degree of caution regarding the above, is obtained by dividing it into three stages.
- the caution level DC is determined from the viewpoint of notifying the representative of the individual indicators (stage).
- the "occurrence frequency index” ID1 is “low”
- the “variation amount index” ID2 is “low”
- the obtained attention level DC is recorded in the "attention level” column in association with the attention time zone ("22:00 level” in the first turn) of the time zone table of FIG.
- the attention time zone will be "23:00".
- the "occurrence frequency index” ID1 is “medium” and the “surge fluctuation amount average value” is 25 mmHg, so the "variation amount index”.
- ID2 is “medium” and the “surge peak value average value” is 143 mmHg
- the "peak value index” ID3 is obtained as “medium” (steps S12 to S14 in FIG. 11).
- the caution level DC is obtained as "medium”.
- the obtained attention level DC is recorded in the "attention level” column in association with the attention time zone ("23:00 level”) in the time zone table of FIG. 10 (step S15 of FIG. 11).
- the "occurrence frequency index” ID1, the “variation amount index” ID2, the “peak value index” ID3, and the "attention level” DC are sequentially obtained for each attention time zone, and are displayed in the time zone table of FIG. Recorded sequentially.
- the "occurrence frequency index” ID1 is “ About “Low”, “Medium”, “Medium”, ..., “Low”, “Variation amount index” ID2 About “Low”, “Medium”, “Medium”, ..., “Low”, “Peak value index” ID3 Is “medium”, “medium”, “medium”, ..., “medium”, and "attention required” DC is “low”, “medium”, “medium”, ..., “low”, and so on. Each is recorded in association with each other.
- the caution level DC can be obtained by a simple arithmetic process.
- the value is assumed to be set by default, but is not limited to this.
- a user mainly a system administrator
- ⁇ 2, ⁇ 1, ⁇ 2 may be changed and set.
- the caution level DC is set to three stages. It is possible to reflect the experience of the user (mainly a doctor) with respect to the criteria required by dividing into.
- the majority voting method is adopted as a method of integrating individual indexes (“occurrence frequency index” ID1, “variation amount index” ID2, “peak value index” ID3), but the method is not limited to this. Absent.
- the highest (step) of the three stages of "low”, “medium”, and “high” represented by each individual index may be determined as the caution level DC (attention level DC). High-level priority method). In this case, for example, for "22:00" in the time zone table of FIG. 10, "occurrence frequency index” ID1 is “low”, “variation amount index” ID2 is “low”, and "peak value index”.
- individual indicators other than the mean value may be used to indicate the degree of caution regarding statistical values such as standard deviation, maximum / minimum values, and quartiles.
- SBP Systolic blood pressure
- DBP diastolic blood pressure
- PR Heart rate
- Individual indicators may be used to indicate the degree of caution regarding the various statistical values of.
- step S6 of FIG. 6 Blood pressure surge related information display processing
- the control unit 350 of the server 300 determines the degree of caution DC, the “number of surge occurrences”, and the “average surge fluctuation amount” obtained for the subject.
- Create image data (this is referred to as Im) that displays the "average surge peak value" side by side for each time zone.
- the image data Im is received from the server 300 via the network 900 by any hospital terminal 400 (400A, 400B, ).
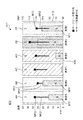
- the hospital terminal 400 functions as a display processing unit and displays the image data Im as a graph on the display screen of the display 420 as shown in FIG.
- the image data Im is displayed on the display screen along the progress (horizontal axis X) of the time zones "22:00", “23:00", “0 o'clock”, ..., “7 o'clock”. It includes rectangular closed regions H22, H23, H0, ..., H7 corresponding to each time zone, which are set side by side. Each of these closed regions H22, H23, H0, ..., H7 is given a specific color according to the degree of caution DC in the corresponding time zone. As the "specific color”, in this example, green (G) corresponding to "low” of caution DC, yellow (Y) corresponding to "medium” of caution DC, and "high” of caution DC are used. The three colors of red (R) corresponding to "" are adopted.
- the "attention level” DC is recorded as “low” for the time zone "22:00”.
- green (G) is attached to the closed region H22.
- the "attention level” DC is recorded as "medium” for the time zone "23:00”.
- yellow (Y) is attached to the closed region H23.
- the "attention level” DC is recorded as "high” for the time zone "1 o'clock”.
- red (R) is attached to the closed region H1.
- each of the closed regions H22, H23, H0, ..., And H7 is given a specific color according to the degree of caution DC in the corresponding time zone.
- the user can intuitively grasp the transition of the caution level DC (that is, the degree to be careful about the blood pressure surge) for each time zone by looking at the display screen of the display 420.
- the transition of the caution level DC that is, the degree to be careful about the blood pressure surge
- the image data Im is the “number of surge occurrences” and the “average value of surge fluctuation amount” on the plurality of closed regions H22, H23, H0, ..., H7, respectively.
- the graph showing the "average surge peak value” is displayed in an superimposed state.
- the "number of surge occurrences" is represented as a bar graph M1 for each time zone.
- Each bar forming the bar graph M1 is colored in blue (B). Since this blue (B) is different from any specific color (green (G), yellow (Y), red (R)) for expressing the caution level DC, the background colors (closed regions H22, H23, It is easy to distinguish from H0, ..., H7 color).
- the vertical axis Y1 on the left side shows a scale for "number of surge occurrences”.
- the "average surge peak value” is represented as a square dot-shaped mark M3 for each time zone.
- the dot-shaped mark M3 may be a circle, a triangle, or the like instead of a square.
- the “average surge fluctuation amount” is represented as a line segment-shaped mark M2 extending downward from each dot-shaped mark M3 representing the “average surge peak value”.
- the color of the dot-shaped mark M3 and the line segment-shaped mark M2 may be any color that can be easily distinguished from the background color (colors of closed regions H22, H23, H0, ..., H7), for example, black (Bk). You may.
- the user can intuitively grasp the transition of the "average surge fluctuation amount” and “average surge peak value” for each time zone.
- the vertical axis Y1 on the right side shows the scales for the “average surge fluctuation amount” and the “average surge peak value”.
- the information (including image data Im) displayed on the display screen of the display 420 includes the diagnosis and treatment of SAS, as well as blood pressure surges and cardiovascular events (angina, myocardial infarction, ischemic heart failure, etc.). ), And may lead to new clinical findings.
- a graph of caution level DC indicating the degree of caution regarding the blood pressure surge and a statistic graph (bar graph M1 and mark) of the feature amount indicating the characteristics of the blood pressure surge are displayed side by side for each time zone, but the present invention is not limited to this. Only one of the caution level DC indicating the degree of caution regarding the blood pressure surge and the graph of the statistic for the feature amount indicating the characteristics of the blood pressure surge may be displayed side by side for each time zone.
- the above-mentioned system 100 is roughly classified into the blood pressure surge detection / analysis process in the server 300 shown in steps S11 to S15 in FIG. 13 and the blood pressure in the hospital terminal 400 shown in step S16 in FIG.
- a second blood pressure-related information display method including a surge-related information display process is executed.
- the measurement data including the overnight blood pressure time series data 801 (see FIG. 7 (A)), the SBP value / DBP value for each beat, the pulse rate, etc. is measured by the sphygmomanometer 200. It is assumed that the data is stored separately for each subject in the storage unit 340 of the server 300 via the network 900.
- the measurement data for the plurality of subjects may be measured by the sphygmomanometer 200 assigned to each subject among the plurality of sphygmomanometers 200 connected to the network 900. Further, each sphygmomanometer 200 may once transmit the measurement data to any hospital terminal 400, and the hospital terminal 400 may transmit the measurement data to the server 300.
- steps S11 to S13 in FIG. 13 From preprocessing to feature calculation processing (steps S11 to S13 in FIG. 13) In this second blood pressure-related information display method, the processes of steps S11 to S13 in FIG. 13 are performed for each subject in the same manner as the processes of steps S1 to S3 in FIG.
- step S11 of FIG. 13 the control unit 350 of the server 300 functions as a preprocessing unit, distinguishes each subject, and smoothes, removes noise, and uses a moving average known for blood pressure time series data. Pretreatment such as removal of high frequency components using a filter is performed. Further, the control unit 350 of the server 300 extracts an effective section to be the target of detection / analysis of the blood pressure surge from the blood pressure time series data 801. The following processing (steps S12 to S16 in FIG. 13) is assumed to be performed for this effective section.
- control unit 350 of the server 300 functions as a blood pressure surge detection unit, distinguishes each subject, and is predetermined from the blood pressure time series data 801 (effective section of the blood pressure). Detect blood pressure surges based on criteria.
- the control unit 350 of the server 300 functions as a feature amount calculation unit, distinguishes each subject, and sets the detected blood pressure surge (for example, surge Nos. 1, 2, ). ),
- "surge fluctuation amount”, “surge peak value”, “surge time”, “surge rising speed”, and “surge falling time” are calculated as feature quantities representing the characteristics of the blood pressure surge. ..
- the surge unit table (not shown) provided in the storage unit 340, each subject is classified, and each detected blood pressure surge (surge No. 1, 2, 7) Is described as a characteristic amount of the blood pressure surge.
- the "surge fluctuation amount”, “surge peak value”, “surge time”, “surge rising speed”, and “surge falling time” are recorded in association with each other.
- step S14 of FIG. 13 the control unit 350 of the server 300 acts as a statistic calculation unit, and in this example, the number of occurrences of the detected blood pressure surge and the feature amount calculated in step S13 are set as the subject. Statistical processing is performed for each and the statistic is calculated. In this example, the statistical processing is a processing in which the number of occurrences of blood pressure surge is counted overnight (from 22:00 to 7:00), and the feature amount of blood pressure surge is averaged overnight.
- the above statistics are, as shown in the patient unit table of FIG. 14, the “number of surge occurrences” which is the number of occurrences of blood pressure surge, and the “average value of surge fluctuation amount” as a characteristic amount of blood pressure surge. It includes “average surge peak value”, “average surge time”, “average surge rise rate” and “average surge fall time”.
- “surge occurrence frequency” “surge fluctuation amount average value”
- surge time average value "surge peak value average value
- surge peak value average value as a characteristic amount of blood pressure surge.
- the “average surge increase rate” and “average surge decrease time” are recorded in association with each other (for the sake of simplicity, the "average surge time” is not shown).
- the "number of surge occurrences” is 14 times, the “average surge fluctuation amount” is 27 mmHg, the “average surge peak value” is 149 mmHg, and the “average surge increase rate” is 1.3 mmHg /. sec, the “average surge descent time” is recorded as 15 sec.
- the "number of surge occurrences” was once, the “average surge fluctuation amount” was 21 mmHg, the “average surge peak value” was 149 mmHg, and the “average surge increase rate” was 0.8 mmHg / sec.
- the “average surge descent time” is recorded as 5 sec.
- step S15 of FIG. 13 the control unit 350 of the server 300 acts as a caution level calculation unit, and the patient (expressed in DC) indicates the caution level (which is represented by DC) indicating the degree of caution regarding the blood pressure surge. Obtained for each subject).
- control unit 350 executes the same process as the process of step S5 of FIG. 6 for each patient shown in the patient unit table of FIG. 14, and performs the “number of surge occurrences” and “average surge fluctuation amount”.
- the degree of caution DC is obtained based on the comparison result between the "value” and the "average surge peak value” and the respective predetermined threshold values.
- the control unit 350 acts as an individual index calculation unit, and the patient with respect to the “number of surge occurrences”, “average surge fluctuation amount”, and “average surge peak value” shown in the patient unit table of FIG. For each, three individual indexes (corresponding to the above-mentioned "occurrence number index” ID1, "variation amount index” ID2, and “peak value index” ID3) indicating the degree to be noted are obtained.
- the control unit 350 works as an integrated processing unit, and uses the above three individual indexes to obtain the above-mentioned caution level DC in three stages (low, medium, and high) for each patient.
- the required "attention required” DC is recorded for each patient in the patient unit table of FIG.
- "patient A” is “medium”
- “patient B” is “medium”
- “patient C” is “low”.
- “Patient D” is recorded as “low”
- “patient E” is recorded as “high”
- “patient F” is recorded as "medium”.
- the "number of surge occurrences" in the time zone table of FIG. 10 is the number of occurrences for each time zone, whereas the “number of surge occurrences" in the patient unit table of FIG. 14 is the number of occurrences over one night.
- the threshold values ⁇ 1 and ⁇ 2 for the “number of surge occurrences” are set larger than the threshold values ⁇ 1 and ⁇ 2 for the “number of surge occurrences” in the process of step S5 of FIG. desirable.
- indexes As in the case of the first blood pressure-related information display method, three indexes, "occurrence frequency index” ID1, "variation amount index” ID2, and “peak value index” ID3, are used as individual indexes. It is used, but it is not limited to this.
- individual indexes in addition to the above three indexes, a “surge time index”, a “surge rising speed index”, and a “surge falling time index” may be used.
- individual indicators other than the mean value may be used to indicate the degree of caution regarding statistical values such as standard deviation, maximum / minimum values, and quartiles.
- step S16 of FIG. 13 the control unit 350 of the server 300 determines the degree of caution DC, the “number of surge occurrences”, the “average surge fluctuation amount”, and the “surge peak”.
- Image data (this is referred to as Im1) for displaying "value average value" side by side for each patient (subject) is created.
- the image data Im1 is received from the server 300 via the network 900 by any hospital terminal 400 (400A, 400B, ).
- the hospital terminal 400 functions as a display processing unit, and as shown in FIG. 15, displays the image data Im1 as a graph on the display screen of the display 420.
- the image data Im1 has a rectangular shape corresponding to each patient A, B, C, D, E, F, ... Set side by side along the horizontal direction (horizontal axis X10) on the display screen. It includes closed regions AA, AB, AC, AD, AE, AF, .... Each of these closed regions AA, AB, AC, AD, AE, AF, ... Is given a specific color according to the corresponding patient's attention level DC.
- the "specific color” in this example, as in the case of the first blood pressure-related information display method, green (G) corresponding to the "low” of the caution level DC and “medium” of the caution level DC are used. Three colors are adopted: yellow (Y) according to the degree of attention and red (R) according to the "high” degree of caution DC.
- the “attention required” DC is recorded as “medium” for “patient A”.
- yellow (Y) is attached to the closed region AA.
- the “attention required” DC is recorded as “low” for “patient C”.
- green (G) is attached to the closed region AC.
- the “attention required” DC is recorded as “high” for “patient E”.
- red (R) is attached to the closed region AE.
- each of the closed regions AA, AB, AC, AD, AE, AF, ... Is given a specific color according to the corresponding patient's attention level DC.
- the user can intuitively grasp the degree of attention DC (that is, the degree to be careful about the blood pressure surge) for each patient by looking at the display screen of the display 420.
- the degree of attention DC that is, the degree to be careful about the blood pressure surge
- the image data Im1 is displayed on the plurality of closed areas AA, AB, AC, AD, AE, AF, ...
- the graphs showing the "average surge fluctuation amount” and the "average surge peak value” are displayed in an superimposed state.
- the "number of surge occurrences" is represented as a bar graph M11 for each patient.
- Each bar forming the bar graph M11 is colored in blue (B). Since this blue (B) is different from any specific color (green (G), yellow (Y), red (R)) for expressing the caution level DC, the background colors (closed areas AA, AB, It is easy to distinguish from AC, AD, AE, AF, ).
- the vertical axis Y11 on the left side shows a scale for “number of surge occurrences”.
- the "average surge peak value” is represented as a square dot-shaped mark M13 for each patient.
- the dot-shaped mark M13 may be a circle, a triangle, or the like instead of a square.
- the "average surge fluctuation amount” is represented as a line segment-shaped mark M12 extending downward from each dot-shaped mark M13 representing the "average surge peak value”.
- the colors of the dot-shaped mark M13 and the line segment-shaped mark M12 may be any color that can be easily distinguished from the background color (colors of closed regions AA, AB, AC, AD, AE, AF, ...), for example, black (black). Bk) may be used.
- the user can intuitively grasp the “average surge fluctuation amount” and “average surge peak value” for each patient.
- the vertical axis Y12 on the right side shows the scales for the “average surge fluctuation amount” and the “average surge peak value”.
- this blood pressure-related information display method information related to blood pressure surge is visualized and displayed for each patient (subject).
- the user can obtain a caution level DC indicating the degree of caution regarding the blood pressure surge and a statistic regarding the feature amount indicating the characteristics of the blood pressure surge for each patient.
- the doctor can evaluate and analyze the symptom by giving priority to the patient having the highest degree of attention DC among the plurality of patients.
- the doctor can identify patients with similar levels of attention DC and / or the above statistics as a group. This allows patients in that group to look for common lifestyle habits, common trends in measurements other than blood pressure surges (eg, measurements for cardiovascular events), and with other groups. You can check the differences between. In this way, effective analysis can be performed for the diagnosis and treatment of blood pressure surges.
- a graph of caution level DC indicating the degree of caution regarding the blood pressure surge and a statistic graph (bar graph M11 and mark) of the feature amount indicating the characteristics of the blood pressure surge are displayed side by side for each patient, but the present invention is not limited to this. Only one of the caution level DC indicating the degree of caution regarding the blood pressure surge and the graph of the statistic for the feature amount indicating the characteristics of the blood pressure surge may be displayed side by side for each patient.
- AF, ... may be displayed side by side along the vertical direction (vertical axis).
- the corresponding patient's overnight “surge occurrence frequency”, “surge fluctuation amount average value”, and “surge peak value average value”, respectively. Bar graph M11 and marks M12, M13) may be superimposed and displayed according to the scale on the horizontal axis.
- control unit 350 of the server 300 creates the image data Im and Im1, and the display 420 of the hospital terminal 400 displays the image, but the present invention is not limited to this. Instead of transmitting the image data Im and Im1 to the hospital terminal 400, the control unit 350 of the server 300 may transmit only the data for image creation, and the hospital terminal 400 may exclusively create the image data Im and Im1. ..
- the blood pressure-related information display device of the present invention is configured as a system 100 on a network including a hospital terminal 400 and a server 300, but the present invention is not limited thereto.
- the blood pressure-related information display device of the present invention may be configured only by the hospital terminal 400 (for example, 400A). That is, all of the above-mentioned blood pressure-related information display methods (including receiving time-series data of blood pressure from the sphygmomanometer 200 and displaying image data on the display screen of the display 420) are executed on the hospital terminal 400. You may let me.
- a program for executing the above-mentioned blood pressure-related information display method is installed in the hospital terminal 400.
- the blood pressure-related information display device of the present invention can be configured compactly and compactly.
- the above-mentioned blood pressure-related information display method can be used as software (computer program) to record non-transitory data such as a CD (compact disc), DVD (digital universal disc), and flash memory. It may be recorded on a medium.
- a substantial computer device such as a personal computer, a PDA (Personal Digital Assistance), or a smartphone, the above-mentioned blood pressure-related information is displayed on those computer devices. The method can be executed.
- the individual index (“occurrence frequency index” ID1, “variation amount index” ID2, “peak value index” ID3) and the caution level DC are all divided into three stages of low, medium, and high.
- m 2
- the number of threshold values for each individual index may be one.
- the stage represented by the individual index is, for example, two stages of “low” and “high”.
- the caution level DC has two stages, for example, “low” with green (G) and “high” with red (R).
- the number of threshold values for each individual index may be different (m-1).
- the stage represented by the individual index is m stage (m ⁇ 4).
- the caution level DC is, for example, m steps in which m specific colors different from each other are attached.
- the sphygmomanometer 200 is a sphygmomanometer of the tonometry type, but the present invention is not limited to this.
- the sphygmomanometer 200 includes a light emitting element that irradiates light toward an artery passing through a corresponding portion of the measurement site, and a light receiving element that receives reflected light (or transmitted light) of the light, and has an arterial pulse. Blood pressure may be detected continuously based on the change in volume of the wave (photoelectric method).
- the sphygmomanometer 200 is provided with a piezoelectric sensor in contact with the part to be measured, detects strain due to pressure of an artery passing through the corresponding part of the part to be measured as a change in electrical resistance, and changes in this electrical resistance. Blood pressure may be continuously detected based on (piezoelectric method). Further, the sphygmomanometer 200 includes a transmitting element that sends a radio wave (transmitted wave) toward an artery passing through a corresponding portion of the measured portion, and a receiving element that receives a reflected wave of the radio wave, and has an arterial pulse.
- a radio wave transmitted wave
- the change in the distance between the artery and the sensor due to the wave may be detected as the phase shift between the transmitted wave and the reflected wave, and the blood pressure may be continuously detected based on this phase shift (radio wave irradiation method). ). Further, if a physical quantity capable of calculating blood pressure can be observed, a method other than these may be applied.
Landscapes
- Health & Medical Sciences (AREA)
- Life Sciences & Earth Sciences (AREA)
- Physics & Mathematics (AREA)
- Engineering & Computer Science (AREA)
- Public Health (AREA)
- Surgery (AREA)
- Veterinary Medicine (AREA)
- General Health & Medical Sciences (AREA)
- Animal Behavior & Ethology (AREA)
- Biophysics (AREA)
- Pathology (AREA)
- Biomedical Technology (AREA)
- Heart & Thoracic Surgery (AREA)
- Medical Informatics (AREA)
- Molecular Biology (AREA)
- Cardiology (AREA)
- Vascular Medicine (AREA)
- Theoretical Computer Science (AREA)
- General Physics & Mathematics (AREA)
- Physiology (AREA)
- Nuclear Medicine, Radiotherapy & Molecular Imaging (AREA)
- Radiology & Medical Imaging (AREA)
- Dentistry (AREA)
- Ophthalmology & Optometry (AREA)
- Measuring Pulse, Heart Rate, Blood Pressure Or Blood Flow (AREA)
- Measuring And Recording Apparatus For Diagnosis (AREA)
Abstract
本発明では、被験者の脈動に連動して変化する血圧の時系列データから、予め定められた判定基準に基づいて血圧サージを検出する(S2)。検出された血圧サージの特徴を表す特徴量を算出する(S3)。検出された血圧サージの発生回数および/または特徴量を、時間帯毎に統計処理して統計量を算出する(S4)。血圧サージの発生回数および/または特徴量についての統計量に基づいて、血圧サージに関して注意すべき程度を表す要注意度を、時間帯毎に求める(S5)。表示画面上で、求められた要注意度および/または統計量を、時間帯毎に並べて表示する処理を行う(S6)。
Description
この発明は血圧関連情報表示装置および血圧関連情報表示方法に関し、より詳しくは、被験者の血圧サージに関連する情報を可視化して表示する装置および方法に関する。また、この発明は、そのような血圧関連情報表示方法をコンピュータに実行させるためのプログラムに関する。
睡眠時無呼吸症候群(SAS;Sleep Apnea Syndrome)を罹患している患者においては、無呼吸後の呼吸再開時に血圧が例えば5秒間~15秒間程度かけて上昇し、その後に下降することが知られている。本明細書では、このような急激な血圧変動を「血圧サージ」(または単に「サージ」)と呼ぶ。
従来、例えば特許文献1(WO 2017/082107 A1)では、睡眠時無呼吸症候群(SAS)患者における変動状態(血圧サージ)の発生頻度[回/時]とサージ変動量(サージ開始点の血圧値とサージピーク点の血圧値との差)の代表値[mmHg]との関係が、2次元グラフとして表示されている。患者に発生した血圧サージに関連する情報を可視化して表示することは、SASの診断や治療に役立つと考えられる。
ところで、24時間自由行動下血圧測定(24 hour ambulatory blood pressure monitoring; ABPM)(1時間あたり数点の血圧測定(これを「スポット測定」と呼ぶ。)を行う。)での研究から、夜間の血圧変動は心血管イベント(狭心症、心筋梗塞、虚血性心不全など)のリスクと関連性があることが知られている。このため、夜間の血圧サージについても、血圧サージに関連する情報、例えば血圧サージの発生頻度、サージピーク値、サージ変動量、および、それらに基づいて評価されるリスクなどを時間帯毎に可視化して表示することは、臨床的に重要であると考えられる。
しかしながら、特許文献1では、血圧サージに関連する情報を時間帯毎に可視化して表示することについては、開示されていない。
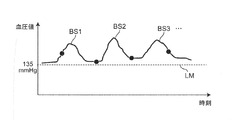
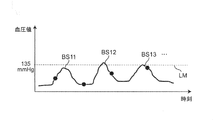
なお、ABPMによるスポット測定では、血圧サージ自体を十分に観測することができない。すなわち、例えば図16Aに示すように、血圧サージBS1,BS2,BS3,…が時々発生している場合において、血圧のベースライン(血圧サージが発生していない期間の血圧値のレベルを想定したライン)が血圧基準値LM(=135mmHg)よりも上方にあれば、スポット測定(測定点を図16A,図16B中に●印で示す。)であっても、血圧の絶対値の観点でリスク評価がある程度可能になる。しかしながら、図16Bに示すように、血圧サージBS11,BS12,BS13,…が時々発生している場合において、血圧のベースラインが血圧基準値LMよりも下方にあれば、血圧サージBS11,BS12,BS13,…によって血圧が時々血圧基準値LMを超えるにもかかわらず、スポット測定では、血圧の測定値が概ね血圧基準値LM未満(正常範囲)になるため、血圧の絶対値の観点でリスク無しと判断されてしまう。
そこで、この発明の課題は、血圧サージに関連する情報を時間帯毎に可視化して表示できる血圧関連情報表示装置および血圧関連情報表示方法を提供することにある。また、この発明の課題は、そのような血圧関連情報表示方法をコンピュータに実行させるためのプログラムを提供することにある。
上記課題を解決するため、この開示の血圧関連情報表示装置は、
血圧サージに関連する情報を可視化して表示する血圧関連情報表示装置であって、
被験者の脈動に連動して変化する血圧の時系列データから、予め定められた判定基準に基づいて血圧サージを検出する血圧サージ検出部と、
検出された上記血圧サージの特徴を表す特徴量を算出する特徴量算出部と、
検出された上記血圧サージの発生回数および/または上記特徴量を、時間帯毎に統計処理して統計量を算出する統計量算出部と、
上記血圧サージの発生回数および/または上記特徴量についての上記統計量に基づいて、血圧サージに関して注意すべき程度を表す要注意度を、上記時間帯毎に求める要注意度算出部と、
表示画面上で、求められた上記要注意度および/または上記統計量を、上記時間帯毎に並べて表示する処理を行う表示処理部とを備えたことを特徴とする。
本明細書で、「予め定められた判定基準」とは、典型的には、睡眠時無呼吸症候群(SAS)患者において血圧サージを検出するための基準を指す。例えば、特願2017-048946号、特願2017-050066号に開示されているような、ピーク検出区間(例えば、15拍分の期間)内にサージ開始点の時刻からサージピーク点の時刻までが含まれるとともに、サージ開始点の時刻における収縮期血圧値とピーク点の時刻における収縮期血圧値との差(血圧変動量)が20mmHg(または15mmHg)以上であること、サージ開始点の時刻とピーク点の時刻との間の期間が5拍分よりも大きいこと、かつ、ピーク点の時刻とサージ終了点の時刻との間の期間が7拍分よりも大きいことを指す。
また、血圧サージの特徴を表す「特徴量」とは、例えば収縮期血圧に関して、サージピーク値(ピーク点の血圧値)、サージ変動量(血圧サージの開始点からピーク点までの血圧値の差)、サージ時間(血圧サージの開始点から終了点までの時間)、サージ上昇速度(上記サージ変動量を血圧サージの開始点からピーク点までの時間で除算して得られた値)などを指す。
また、「統計処理」とは、平均する処理、中央値を求める処理、標準偏差を求める処理などを指す。
また、「表示画面」は、典型的には表示器の画面を指すが、例えば、プリンタによって出力される紙面であってもよい。
この開示の血圧関連情報表示装置では、血圧サージ検出部は、被験者の脈動に連動して変化する血圧の時系列データから、予め定められた判定基準に基づいて血圧サージを検出する。特徴量算出部は、検出された上記血圧サージの特徴を表す特徴量を算出する。統計量算出部は、検出された上記血圧サージの発生回数および/または上記特徴量を、時間帯毎に統計処理して統計量を算出する。要注意度算出部は、上記血圧サージの発生回数および/または上記特徴量についての上記統計量に基づいて、血圧サージに関して注意すべき程度を表す要注意度を、上記時間帯毎に求める。表示処理部は、表示画面上で、求められた上記要注意度および/または上記統計量を、上記時間帯毎に並べて表示する処理を行う。この血圧関連情報表示装置は、このようにして、血圧サージに関連する情報を時間帯毎に可視化して表示する。これにより、ユーザ(典型的には、医師、看護師などの医療関係者、システム管理者などを指す。被験者であってもよい。以下同様。)は、上記表示画面を見ることによって、上記要注意度および/または上記統計量の、上記時間帯毎の推移を知ることができる。これにより、例えば、医師は、患者(被験者)の症状の時間帯毎の傾向が分かり、診察時に患者に対するアドバイスがし易くなる。また、血圧サージの波形まで詳細に確認したいとの要求が発生したときに、医師は、まず上記要注意度が高い時間帯のサージ事例から確認することが可能となり、効率的な解析が可能となる。さらに、上記表示画面上に表示される情報は、SASの診断や治療のほか、血圧サージと心血管イベント(狭心症、心筋梗塞、虚血性心不全など)との関連性を研究するのに役立ち、新たな臨床的知見につながる可能性がある。
一実施形態の血圧関連情報表示装置では、上記要注意度は、上記注意すべき程度に応じた複数の段階に区分され、上記複数の段階のそれぞれが、その段階に応じた特定色によって表されることを特徴とする。
ここで、上記要注意度が含む「複数の段階」とは、例えば低、中、高の3段階を指すが、これに限られるものではない。「特定色」としては、例えば緑(G)、黄(Y)、赤(R)の3色が挙げられるが、これに限られるものではない。
この一実施形態の血圧関連情報表示装置では、上記要注意度は、上記注意すべき程度に応じた複数の段階に区分され、上記複数の段階のそれぞれが、その段階に応じた特定色によって表される。したがって、ユーザは、上記表示画面上に表示された上記特定色によって、上記要注意度が表す上記注意すべき程度を、直感的に把握することができる。
一実施形態の血圧関連情報表示装置では、
上記表示処理部は、
上記表示画面上で、各時間帯に対応する閉領域を、上記時間帯の進行に沿って並べて設定するとともに、
上記閉領域のそれぞれに、対応する時間帯の上記要注意度に応じた上記特定色を付す
ことを特徴とする。
上記表示処理部は、
上記表示画面上で、各時間帯に対応する閉領域を、上記時間帯の進行に沿って並べて設定するとともに、
上記閉領域のそれぞれに、対応する時間帯の上記要注意度に応じた上記特定色を付す
ことを特徴とする。
ここで、「閉領域」とは、例えば矩形状の領域を指すが、これに限られるものではない。また、「時間帯の進行」とは、上記表示画面上での、前の時間帯から後の時間帯へ向かう並びを意味する。
この一実施形態の血圧関連情報表示装置では、上記表示処理部は、上記表示画面上で、各時間帯に対応する閉領域を、上記時間帯の進行に沿って並べて設定する。これとともに、上記表示処理部は、上記閉領域のそれぞれに、対応する時間帯の上記要注意度に応じた上記特定色を付す。したがって、ユーザは、上記表示画面を見ることによって、上記要注意度の上記時間帯毎の推移を、直感的に把握することができる。
一実施形態の血圧関連情報表示装置では、上記表示処理部は、上記表示画面上で、上記複数の閉領域の上にそれぞれ上記統計量を表すグラフを重ねた状態で表示することを特徴とする。
この一実施形態の血圧関連情報表示装置では、上記表示処理部は、上記表示画面上で、上記複数の閉領域の上にそれぞれ上記統計量を表すグラフを重ねた状態で表示する。したがって、ユーザは、上記表示画面を見ることによって、上記要注意度が表す上記段階の上記時間帯毎の推移とともに、上記統計量の上記時間帯毎の推移を、直感的に把握することができる。また、ユーザは、上記グラフを見ることによって、上記時間帯毎に上記要注意度が表す上記注意すべき程度の理由や根拠を、直感的に把握することができる。
一実施形態の血圧関連情報表示装置では、上記統計量は、上記血圧サージの発生回数、上記特徴量としてのサージ変動量およびサージピーク値を、少なくとも含むことを特徴とする。
この一実施形態の血圧関連情報表示装置では、ユーザは、上記表示画面を見ることによって、上記統計量が含む上記血圧サージの発生回数、上記特徴量としてのサージ変動量およびサージピーク値の、上記時間帯毎の推移を知ることができる。
一実施形態の血圧関連情報表示装置では、上記要注意度算出部は、上記時間帯毎に、上記血圧サージの発生回数、上記特徴量としてのサージ変動量およびサージピーク値についての上記統計量と、それぞれ予め定められた閾値との比較結果に基づいて、上記要注意度を求めることを特徴とする。
この一実施形態の血圧関連情報表示装置では、上記要注意度が簡単な演算処理によって求められる。
一実施形態の血圧関連情報表示装置では、
上記要注意度算出部は、mを2以上の自然数としたとき、
上記時間帯毎に、上記血圧サージの発生回数、上記特徴量としてのサージ変動量およびサージピーク値についての上記統計量に関して、それぞれ注意すべき程度を表す個別指標を、それぞれ予め定められた大小が異なる(m-1)個の閾値との比較結果に基づいて、上記注意すべき程度に応じたm段階に区分して求める個別指標算出部と、
上記血圧サージの発生回数、上記特徴量としてのサージ変動量およびサージピーク値についてそれぞれ求められた上記個別指標を用いて、上記要注意度を上記m段階に区分して求める統合処理部と
を含むことを特徴とする。
上記要注意度算出部は、mを2以上の自然数としたとき、
上記時間帯毎に、上記血圧サージの発生回数、上記特徴量としてのサージ変動量およびサージピーク値についての上記統計量に関して、それぞれ注意すべき程度を表す個別指標を、それぞれ予め定められた大小が異なる(m-1)個の閾値との比較結果に基づいて、上記注意すべき程度に応じたm段階に区分して求める個別指標算出部と、
上記血圧サージの発生回数、上記特徴量としてのサージ変動量およびサージピーク値についてそれぞれ求められた上記個別指標を用いて、上記要注意度を上記m段階に区分して求める統合処理部と
を含むことを特徴とする。
「求められた上記個別指標を用いて、上記要注意度を上記m段階に区分して求める」とは、例えばm=3であるとき、上記個別指標が表す上記低、中、高の3段階のうち、最も多いもの(段階)を上記要注意度として決定する方式(多数決方式)、または、上記低、中、高の3段階のうち、最も高いもの(段階)を上記要注意度として決定する方式(高段階優先方式)などによって求めることを指す。
この一実施形態の血圧関連情報表示装置では、上記要注意度算出部に含まれた個別指標算出部は、上記時間帯毎に、上記血圧サージの発生回数に関して、注意すべき程度を表す個別指標(これを「発生回数指標」と呼ぶ。)を、予め定められた(m-1)個の閾値との比較結果に基づいて、上記注意すべき程度に応じたm段階に区分して求める。また、上記個別指標算出部は、上記時間帯毎に、上記特徴量としてのサージ変動量についての上記統計量に関して、注意すべき程度を表す個別指標(これを「変動量指標」と呼ぶ。)を、予め定められた(m-1)個の閾値との比較結果に基づいて、上記注意すべき程度に応じたm段階に区分して求める。また、上記個別指標算出部は、上記時間帯毎に、上記特徴量としてのサージピーク値についての上記統計量に関して、注意すべき程度を表す個別指標(これを「ピーク値指標」と呼ぶ。)を、予め定められた(m-1)個の閾値との比較結果に基づいて、上記注意すべき程度に応じたm段階に区分して求める。次に、上記要注意度算出部に含まれた統合処理部は、上記血圧サージの発生回数、上記特徴量としてのサージ変動量およびサージピーク値についてそれぞれ求められた上記個別指標(すなわち、上記発生回数指標、上記変動量指標、上記ピーク値指標)を用いて、上記時間帯毎に、上記要注意度を上記m段階に区分して求める。これにより、上記要注意度が、簡単な演算処理によって上記m段階に区分して求められる。
一実施形態の血圧関連情報表示装置では、上記閾値をそれぞれ可変して設定するための入力部を備えたことを特徴とする。
この一実施形態の血圧関連情報表示装置では、ユーザは、入力部を介して、上記閾値をそれぞれ可変して設定することができる。したがって、上記血圧サージの発生回数、上記特徴量としてのサージ変動量およびサージピーク値についての上記統計量に対するそれぞれの閾値(基準)に関して、ユーザの経験を反映させることができる。
特に、この血圧関連情報表示装置が、上記大小が異なる(m-1)個の閾値をそれぞれ可変して設定するための入力部を備えた場合、ユーザは、上記入力部を介して、上記大小が異なる(m-1)個の閾値をそれぞれ可変して設定することができる。したがって、各個別指標をm段階に区分して求める基準に関して、ひいては上記要注意度をm段階に区分して求める基準に関して、ユーザの経験を反映させることができる。
一実施形態の血圧関連情報表示装置では、
上記表示処理部は、上記表示画面上で、
上記血圧サージの発生回数を上記時間帯毎に棒グラフとして表し、
上記サージピーク値についての上記統計量を上記時間帯毎にドット状のマークとして表し、
上記サージ変動量についての上記統計量を、上記サージピーク値を表す各ドット状のマークから下方へ延びる線分状のマークとして表す
ことを特徴とする。
上記表示処理部は、上記表示画面上で、
上記血圧サージの発生回数を上記時間帯毎に棒グラフとして表し、
上記サージピーク値についての上記統計量を上記時間帯毎にドット状のマークとして表し、
上記サージ変動量についての上記統計量を、上記サージピーク値を表す各ドット状のマークから下方へ延びる線分状のマークとして表す
ことを特徴とする。
この一実施形態の血圧関連情報表示装置では、ユーザは、上記表示画面を見ることによって、上記統計量が含む上記血圧サージの発生回数、上記特徴量としてのサージ変動量およびサージピーク値の、上記時間帯毎の推移を、直感的に把握することができる。
別の局面では、この開示の血圧関連情報表示方法は、
血圧サージに関連する情報を可視化して表示する血圧関連情報表示方法であって、
被験者の脈動に連動して変化する血圧の時系列データから、予め定められた判定基準に基づいて血圧サージを検出し、
検出された上記血圧サージの特徴を表す特徴量を算出し、
検出された上記血圧サージの発生回数および/または上記特徴量を、時間帯毎に統計処理して統計量を算出し、
上記血圧サージの発生回数および/または上記特徴量についての上記統計量に基づいて、血圧サージに関して注意すべき程度を表す要注意度を、上記時間帯毎に求め、
表示画面上で、求められた上記要注意度および/または上記統計量を、上記時間帯毎に並べて表示する処理を行うことを特徴とする。
この開示の血圧関連情報表示方法では、このようにして、血圧サージに関連する情報を時間帯毎に可視化して表示する。したがって、ユーザは、上記表示画面を見ることによって、上記要注意度および/または上記統計量の、上記時間帯毎の推移を知ることができる。これにより、例えば、医師は、患者(被験者)の症状の時間帯毎の傾向が分かり、診察時に患者に対するアドバイスがし易くなる。また、血圧サージの波形まで詳細に確認したいとの要求が発生したときに、医師は、まず上記要注意度が高い時間帯のサージ事例から確認することが可能となり、効率的な解析が可能となる。さらに、上記表示画面上に表示される情報は、SASの診断や治療のほか、血圧サージと心血管イベント(狭心症、心筋梗塞、虚血性心不全など)との関連性を研究するのに役立ち、新たな臨床的知見につながる可能性がある。
別の局面では、この開示の血圧関連情報表示装置は、
血圧サージに関連する情報を可視化して表示する血圧関連情報表示装置であって、
被験者の脈動に連動して変化する血圧の時系列データから、予め定められた判定基準に基づいて血圧サージを検出する血圧サージ検出部と、
検出された上記血圧サージの特徴を表す特徴量を算出する特徴量算出部と、
複数の被験者について検出された上記血圧サージの発生回数および/または上記特徴量を統計処理して、上記被験者毎に統計量を算出する統計量算出部と、
上記血圧サージの発生回数および/または上記特徴量についての上記被験者毎の上記統計量に基づいて、血圧サージに関して注意すべき程度を表す要注意度を、上記被験者毎に求める要注意度算出部と、
表示画面上で、求められた上記要注意度および/または上記統計量を、上記被験者毎に並べて表示する処理を行う表示処理部とを備えたことを特徴とする。
この開示の血圧関連情報表示装置では、血圧サージ検出部は、被験者の脈動に連動して変化する血圧の時系列データから、予め定められた判定基準に基づいて血圧サージを検出する。特徴量算出部は、検出された上記血圧サージの特徴を表す特徴量を算出する。統計量算出部は、複数の被験者について検出された上記血圧サージの発生回数および/または上記特徴量を統計処理して、上記被験者毎に統計量を算出する。要注意度算出部は、上記血圧サージの発生回数および/または上記特徴量についての上記被験者毎の上記統計量に基づいて、血圧サージに関して注意すべき程度を表す要注意度を、上記被験者毎に求める。表示処理部は、表示画面上で、求められた上記要注意度および/または上記統計量を、上記被験者毎に並べて表示する処理を行う。この血圧関連情報表示装置は、このようにして、血圧サージに関連する情報を被験者毎に可視化して表示する。これにより、ユーザは、上記表示画面を見ることによって、上記要注意度および/または上記統計量を、上記被験者毎に知ることができる。これにより、例えば、医師は、複数の患者(被験者)のうち、上記要注意度が最も高い患者から優先して、症状の評価や分析をすることができる。また、医師は、上記要注意度および/または上記統計量が同程度である患者を、グループとして特定することができる。これにより、そのグループに含まれた患者について、生活習慣での共通点、血圧サージ以外の他の測定値(例えば心血管イベントに関する測定値)での共通の傾向などを探したり、他のグループとの相違点を調べたりすることができる。このように、血圧サージの診断や治療のために効果的な分析を行うことができる。
一実施形態の血圧関連情報表示装置では、上記要注意度は、上記注意すべき程度に応じた複数の段階に区分され、上記複数の段階のそれぞれが、その段階に応じた特定色によって表されることを特徴とする。
この一実施形態の血圧関連情報表示装置では、上記要注意度は、上記注意すべき程度に応じた複数の段階に区分され、上記複数の段階のそれぞれが、その段階に応じた特定色によって表される。したがって、ユーザは、上記表示画面上に表示された上記特定色によって、上記要注意度が表す上記注意すべき程度を、直感的に把握することができる。
一実施形態の血圧関連情報表示装置では、
上記表示処理部は、
上記表示画面上で、各被験者に対応する閉領域を、横方向または縦方向に沿って並べて設定するとともに、
上記閉領域のそれぞれに、対応する被験者の上記要注意度に応じた上記特定色を付す
ことを特徴とする。
上記表示処理部は、
上記表示画面上で、各被験者に対応する閉領域を、横方向または縦方向に沿って並べて設定するとともに、
上記閉領域のそれぞれに、対応する被験者の上記要注意度に応じた上記特定色を付す
ことを特徴とする。
この一実施形態の血圧関連情報表示装置では、上記表示処理部は、上記表示画面上で、各被験者に対応する閉領域を、横方向または縦方向に沿って並べて設定する。これとともに、上記表示処理部は、上記閉領域のそれぞれに、対応する被験者の上記要注意度に応じた上記特定色を付す。したがって、ユーザは、上記表示画面を見ることによって、上記被験者毎の上記要注意度を、直感的に把握することができる。
一実施形態の血圧関連情報表示装置では、上記表示処理部は、上記表示画面上で、上記複数の閉領域の上にそれぞれ上記統計量を表すグラフを重ねた状態で表示することを特徴とする。
別の局面では、この開示の血圧関連情報表示方法は、
血圧サージに関連する情報を可視化して表示する血圧関連情報表示方法であって、
被験者の脈動に連動して変化する血圧の時系列データから、予め定められた判定基準に基づいて血圧サージを検出し、
検出された上記血圧サージの特徴を表す特徴量を算出し、
複数の被験者について検出された上記血圧サージの発生回数および/または上記特徴量を統計処理して、上記被験者毎に統計量を算出し、
上記血圧サージの発生回数および/または上記特徴量についての上記被験者毎の上記統計量に基づいて、血圧サージに関して注意すべき程度を表す要注意度を、上記被験者毎に求め、
表示画面上で、求められた上記要注意度および/または上記統計量を、上記被験者毎に並べて表示する処理を行うことを特徴とする。
この開示の血圧関連情報表示方法では、このようにして、血圧サージに関連する情報を被験者毎に可視化して表示する。これにより、ユーザは、上記表示画面を見ることによって、上記要注意度および/または上記統計量を、上記被験者毎に知ることができる。これにより、例えば、医師は、複数の患者(被験者)のうち、上記要注意度が最も高い患者から優先して、症状の評価や分析をすることができる。また、医師は、上記要注意度および/または上記統計量が同程度である患者を、グループとして特定することができる。これにより、そのグループに含まれた患者について、生活習慣での共通点、血圧サージ以外の他の測定値(例えば心血管イベントに関する測定値)での共通の傾向などを探したり、他のグループとの相違点を調べたりすることができる。このように、血圧サージの診断や治療のために効果的な分析を行うことができる。
さらに別の局面では、この開示のプログラムは、上記血圧関連情報表示方法をコンピュータに実行させるためのプログラムである。
この開示のプログラムをコンピュータに実行させることによって、上記血圧関連情報表示方法を実施することができる。
以上より明らかなように、この開示の血圧関連情報表示装置および血圧関連情報表示方法によれば、血圧サージに関連する情報を時間帯毎に可視化して表示することができる。また、この開示のプログラムをコンピュータに実行させることによって、上記血圧関連情報表示方法を実施することができる。
以下、この発明の実施の形態を、図面を参照しながら詳細に説明する。
(システムの概略構成)
図1は、この発明の血圧関連情報表示装置をネットワーク上の一実施形態のシステム(全体を符号100で示す。)として構成した例を示している。このシステム100は、トノメトリ方式の血圧計200と、この血圧計200によって取得された血圧の時系列データから血圧サージを検出して解析するサーバ300と、表示画面としての表示器420を有する病院端末400A,400Bとを含んでいる。これらの血圧計200、サーバ300および病院端末400A,400Bは、この例では病院内LAN(Local Area Network)であるネットワーク900を介して互いに通信可能になっている。このネットワーク900を介した通信は、無線、有線のいずれでも良い。この実施の形態において、ネットワーク900は、病院内LAN(Local Area Network)であるが、これに限定されず、インターネットのような他の種類のネットワークであってもよいし、USBケーブルなどを用いた1対1の通信であってもよい。なお、病院端末400A,400B(以下、符号400で総称する。)は、この例では2台のみを示しているが、3台以上設けられていてもよい。同様に、血圧計200は、この例では1台のみを示しているが、2台以上設けられていてもよい。
図1は、この発明の血圧関連情報表示装置をネットワーク上の一実施形態のシステム(全体を符号100で示す。)として構成した例を示している。このシステム100は、トノメトリ方式の血圧計200と、この血圧計200によって取得された血圧の時系列データから血圧サージを検出して解析するサーバ300と、表示画面としての表示器420を有する病院端末400A,400Bとを含んでいる。これらの血圧計200、サーバ300および病院端末400A,400Bは、この例では病院内LAN(Local Area Network)であるネットワーク900を介して互いに通信可能になっている。このネットワーク900を介した通信は、無線、有線のいずれでも良い。この実施の形態において、ネットワーク900は、病院内LAN(Local Area Network)であるが、これに限定されず、インターネットのような他の種類のネットワークであってもよいし、USBケーブルなどを用いた1対1の通信であってもよい。なお、病院端末400A,400B(以下、符号400で総称する。)は、この例では2台のみを示しているが、3台以上設けられていてもよい。同様に、血圧計200は、この例では1台のみを示しているが、2台以上設けられていてもよい。
(血圧計の構成)
図1中に示す血圧計200は、例えば、特開2018-42606号公報に開示されているようなトノメトリ方式の血圧計からなる。図2は、血圧計200が被験者の手首Wに装着されている様子を、例示している。また、図3は、被験者の手首Wに装着された血圧計200が、血圧測定を実施している様子を例示している。図2,図3に例示された血圧計200は、橈骨10に沿って走行する橈骨動脈TDの圧脈波を、一拍毎に連続的に測定する。
図1中に示す血圧計200は、例えば、特開2018-42606号公報に開示されているようなトノメトリ方式の血圧計からなる。図2は、血圧計200が被験者の手首Wに装着されている様子を、例示している。また、図3は、被験者の手首Wに装着された血圧計200が、血圧測定を実施している様子を例示している。図2,図3に例示された血圧計200は、橈骨10に沿って走行する橈骨動脈TDの圧脈波を、一拍毎に連続的に測定する。
図4は、血圧計200のブロック構成を例示している。この例では、血圧計200は、血圧装置210、操作部230、通信部240、メモリ250、および制御部260を、備えている。また、血圧装置210は、圧力センサ211と押圧機構212とを、備えている。
押圧機構212は、図3中に矢印で示すように、被測定部位に対して、押圧力を印加する。押圧機構212が被測定部位に対して押圧力を印加している際に、圧力センサ211は、トノメトリ方式で、橈骨動脈TDの圧脈波を一拍毎に連続的に検出する。トノメトリ法は、血管を押圧機構212を用いて圧扁することにより、圧力センサ211が圧脈波を計測し、血圧を決定する手法である。血管を厚さが一様な円管と見なすと、血管内の血液の流れ、拍動の有無に関係なく、血管壁を考慮してラプラスの法則に従い、血管の内圧(血圧)と血管の外圧(圧脈波の圧力)との関係式を導くことができる。この関係式で押圧面において血管が圧扁されている条件下では、血管の外壁及び内壁の半径を近似することにより、圧脈波の圧力と血圧とが等しいと近似できる。したがって、圧脈波の圧力は、血圧と同一値になる。この結果、血圧計200は、被測定部位の血圧値を一心拍毎に測定する。そして、血圧計200は、例えば図7(A)に示すような、測定時刻(時間)と血圧とを対応付けた血圧の時系列データ801を生成する。一晩の血圧の時系列データ801は、約3万拍分の拍対応ピーク(SBPまたはDBPに相当するピーク)を含んでいる。
図4中に示す操作部230は、ユーザからの指示(入力)を受け付ける。操作部230は、例えば、複数のボタンから構成される。通信部240は、各種データの送受信を行う。この通信部240は、図1中に示すネットワーク900に接続されている。図4中に示すメモリ250は、各種データを記憶する。例えば、メモリ250は、血圧装置210が計測した測定値(血圧の時系列データ801)、1拍毎のSBP値・DBP値、脈拍数等を、格納することができる。メモリ250は、RAM(Random Access Memory)およびROM(Read Only Memory)等を含む。例えば、メモリ250には、各種プログラムが、変更可能に格納されている。
制御部260は、この例では、CPU(Central Processing Unit)を含んでいる。例えば、制御部260は、メモリ250に格納されている各プログラムおよび各データを読み込む。また、制御部260は、読み込んだプログラムに従い、各部210,230,240,250を制御し、所定の動作(機能)を実行させる。また、制御部260は、読み込んだプログラムに従い、当該制御部260内において、所定の演算、解析、処理等を実施する。なお、制御部260が実行する各機能の一部又は全部を、一つ或いは複数の集積回路等によりハードウェア的に構成してもよい。
この血圧計200は、測定時刻(時間)と血圧とを対応付けた血圧の時系列データ801(図7(A)参照)、1拍毎のSBP値・DBP値、脈拍数等を、測定データとして他の機器(この例では、サーバ300)へ出力する。
(サーバの構成)
図5は、サーバ300のブロック構成を例示している。この例では、サーバ300は、通信部310、表示器320、操作部330、記憶部340、および制御部350を、備えている。
図5は、サーバ300のブロック構成を例示している。この例では、サーバ300は、通信部310、表示器320、操作部330、記憶部340、および制御部350を、備えている。
通信部310は、各種データの送受信を行う。この通信部310は、図1中に示すネットワーク900に接続されている。通信部310は、例えば、血圧計200から送信される測定データを、ネットワーク900を介して受信する。また、通信部310は、サーバ300内の制御部350で生成された種々の出力データを、ネットワーク900を介して病院端末400へ、送信する。
図5中に示す表示器320は、各種画像を表示するための表示画面を有している。表示器320は、制御部350における各種解析の結果等を、視認可能に表示することができる。また、表示器320は、操作部330を介したユーザからの希望に応じて、所定の情報を、視認可能に表示することもできる。例えば、表示器320は、記憶部340に格納されている情報(データ)を、視認可能に表示してもよい。例えば、表示器320として、液晶ディスプレイ、有機EL(Electro Luminescence)ディスプレイ等を採用することができる。
操作部330は、ユーザからの、所定の操作(指示)を受け付ける。例えば、操作部330は、マウスおよびキーボードなどから、構成される。ここで、表示器320として、タッチパネル式のモニタを採用した場合には、表示器320は、表示機能だけでなく、操作部330としての機能をも有する。
記憶部340は、各種データを記憶する。例えば、記憶部340は、血圧装置210が計測した測定値(血圧の時系列データ801)、1拍毎のSBP値・DBP値、脈拍数等の測定データを、格納することができる。また、記憶部340は、制御部350で生成された各種出力データを格納することもできる。記憶部340は、RAMおよびROM等を含む。また、記憶部340には、各種プログラムが、変更可能に格納されている。この例では、記憶部340には、後述の血圧関連情報表示方法を実施するためのプログラムが格納されている。なお、記憶部340の記憶領域を補助するための補助記憶装置の記憶媒体として、磁気ディスク(HD(Hard Disk)、FD(Flexible Disk))、光ディスク(CD(Compact Disc)、DVD(Digital Versatile Disk)、BD(Blu-ray Disc))、光磁気ディスク(MO(Magneto-Optical disk))、または、半導体メモリ(メモリカード、SSD)などが用いられてもよい。
制御部350は、この例では、CPUを含んでいる。例えば、制御部350は、記憶部340に格納されている各プログラムおよび各データを読み込む。また、制御部350は、読み込んだプログラムに従い、各部310,320,330,340を制御し、所定の動作(機能)を実行させる。また、制御部350は、読み込んだプログラムに従い、当該制御部350内において、所定の演算、解析、処理等を実施する。なお、制御部350が実行する各機能の一部又は全部を、一つ或いは複数の集積回路等によりハードウェア的に構成してもよい。制御部350の具体的な動作については、後述する。
(病院端末の構成)
図1中に示す病院端末400は、この例では、一般的なパーソナルコンピュータからなる。ここで、病院端末400は、パーソナルコンピュータに代えて、タブレットなどの携帯端末であってもよい。
図1中に示す病院端末400は、この例では、一般的なパーソナルコンピュータからなる。ここで、病院端末400は、パーソナルコンピュータに代えて、タブレットなどの携帯端末であってもよい。
病院端末400が備える表示器420は、各種画像を表示するための表示画面を有している。表示器420は、例えば、サーバ300から受信した各種出力データに応じた画像を、視認可能に表示する。また、表示器420は、ユーザによる操作に応じて、所定の情報を、視認可能に表示することもできる。例えば、表示器420として、液晶ディスプレイ、有機ELディスプレイ等を採用することができる。
(システムの動作)
このシステム100は、大別して、図6中のステップS1~S5に示されたサーバ300での血圧サージの検出・解析処理と、図6中のステップS6に示された病院端末400での血圧サージ関連情報表示処理とを含む、次のような第1の血圧関連情報表示方法を実行することができる。なお、このシステム100は、後述する第2の血圧関連情報表示方法も実行することができる。
このシステム100は、大別して、図6中のステップS1~S5に示されたサーバ300での血圧サージの検出・解析処理と、図6中のステップS6に示された病院端末400での血圧サージ関連情報表示処理とを含む、次のような第1の血圧関連情報表示方法を実行することができる。なお、このシステム100は、後述する第2の血圧関連情報表示方法も実行することができる。
[第1の血圧関連情報表示方法]
この第1の血圧関連情報表示方法では、被験者の血圧サージに関連する情報を時間帯毎に可視化して表示する。
この第1の血圧関連情報表示方法では、被験者の血圧サージに関連する情報を時間帯毎に可視化して表示する。
ここで、或る被験者について既に一晩の血圧の時系列データ801(図7(A)参照)、1拍毎のSBP値・DBP値、脈拍数等を含む測定データが、血圧計200によって測定され、ネットワーク900を介してサーバ300の記憶部340に記憶されているものとする。なお、血圧計200は、一旦、いずれかの病院端末400へ上記測定データを送信し、その病院端末400が、サーバ300へ、上記測定データを送信してもよい。
(1) 前処理(図6のステップS1)
図6のステップS1では、サーバ300の制御部350は前処理部として働いて、血圧の時系列データに公知の移動平均などを用いた平滑化、ノイズ除去、ローパスフィルタを用いた高周波成分除去等の前処理を施す。
図6のステップS1では、サーバ300の制御部350は前処理部として働いて、血圧の時系列データに公知の移動平均などを用いた平滑化、ノイズ除去、ローパスフィルタを用いた高周波成分除去等の前処理を施す。
さらに、サーバ300の制御部350は、血圧の時系列データ801のうち、血圧サージの検出・解析の対象となるべき有効区間を抽出する。すなわち、血圧の時系列データ801のうち、外乱(ノイズ等)の影響を受けた区間を無効区間として排除し、外乱の影響を受けていない区間を有効区間として残す。これにより、ノイズによる変動を血圧サージとして誤検出するリスクを低減できる。また、血圧サージの検出・解析のための処理時間を短縮できる。
以下の処理(図6中のステップS2~S6)は、この有効区間を対象として行われるものとする。
(2) 血圧サージ検出処理(図6のステップS2)
次に、図6のステップS2では、サーバ300の制御部350は血圧サージ検出部として働いて、上記被験者についての血圧の時系列データ801(のうちの有効区間)から、例えば特願2017-048946号、特願2017-050066号に開示されているように、予め定められた判定基準に基づいて血圧サージを検出する。これにより、例えば図7(B)中に、破線の矩形枠803,803,…で示すように、複数の血圧サージを検出する。血圧サージは一晩に数百個も発生することがあると言われている。この例では、一拍ごとの収縮期血圧(SBP)がプロットされ(図7(B)中に、一例として、SBPの一つをPSとして示す)、それらが包絡線で結ばれている。また、一拍ごとの拡張期血圧(DBP)がプロットされ(図7(B)中に、一例として、DBPの一つをPDとして示す)、それらが包絡線で結ばれている。
次に、図6のステップS2では、サーバ300の制御部350は血圧サージ検出部として働いて、上記被験者についての血圧の時系列データ801(のうちの有効区間)から、例えば特願2017-048946号、特願2017-050066号に開示されているように、予め定められた判定基準に基づいて血圧サージを検出する。これにより、例えば図7(B)中に、破線の矩形枠803,803,…で示すように、複数の血圧サージを検出する。血圧サージは一晩に数百個も発生することがあると言われている。この例では、一拍ごとの収縮期血圧(SBP)がプロットされ(図7(B)中に、一例として、SBPの一つをPSとして示す)、それらが包絡線で結ばれている。また、一拍ごとの拡張期血圧(DBP)がプロットされ(図7(B)中に、一例として、DBPの一つをPDとして示す)、それらが包絡線で結ばれている。
ここで、血圧サージを検出するための「予め定められた判定基準」とは、例えば図8(血圧サージの波形の一例を曲線Cで示す。)に示すように、ピーク検出区間(例えば、15拍分の期間)内にサージ開始点P1の時刻からサージピーク点P2の時刻までが含まれるとともに、サージ開始点P1の時刻における収縮期血圧値(SBP)とピーク点P2の時刻における収縮期血圧値(SBP)との差(サージ変動量)L1が20mmHg(または15mmHg)以上であること、サージ開始点P1の時刻とピーク点P2の時刻との間の期間T1が5拍分よりも大きいこと、かつ、ピーク点P2の時刻とサージ終了点P4の時刻との間の期間T3が7拍分よりも大きいことを指す。この例では、サージ開始点P1は、ピーク点P2よりも前で、収縮期血圧値(SBP)の極小を与える点として規定されている。また、サージ終了点P4は、ピーク点P2よりも後で、ピーク点P2からL1×0.75(=L3)の分だけ血圧が降下した点として規定されている。
(3) 特徴量算出処理(図6のステップS3)
次に、図6のステップS3では、サーバ300の制御部350は特徴量算出部として働いて、上記被験者について検出された血圧サージ(例えば、サージNo.1,2,…とする。)毎に、その血圧サージの特徴を表す特徴量として、この例では、「サージ変動量」、「サージピーク値」、「サージ時間」、「サージ上昇速度」、「サージ下降時間」を算出する。ここで、「サージ変動量」とは、図8中に示したサージ開始点P1の時刻における収縮期血圧値(SBP)とピーク点P2の時刻における収縮期血圧値(SBP)との差L1を指す。「サージピーク値」とは、ピーク点P2の時刻における収縮期血圧値(SBP)を指す。「サージ時間」とは、サージ時間サージ開始点P1の時刻とサージ終了点P4の時刻との間の期間の長さ(=T1+T2)を指す。また、「サージ上昇速度」とは、サージ開始点P1からピーク点P2までの収縮期血圧値(SBP)の上昇速度(=L1/T1)を指す。「サージ下降時間」とは、ピーク点P2の時刻とサージ終了点P4の時刻との間の期間T3を指す。記憶部340に設けられたサージ単位テーブル(図示せず)には、検出された血圧サージ(サージNo.1,2,…)毎に、その血圧サージの特徴量として「サージ変動量」、「サージピーク値」、「サージ時間」、「サージ上昇速度」、「サージ下降時間」が、対応付けて記録される。
次に、図6のステップS3では、サーバ300の制御部350は特徴量算出部として働いて、上記被験者について検出された血圧サージ(例えば、サージNo.1,2,…とする。)毎に、その血圧サージの特徴を表す特徴量として、この例では、「サージ変動量」、「サージピーク値」、「サージ時間」、「サージ上昇速度」、「サージ下降時間」を算出する。ここで、「サージ変動量」とは、図8中に示したサージ開始点P1の時刻における収縮期血圧値(SBP)とピーク点P2の時刻における収縮期血圧値(SBP)との差L1を指す。「サージピーク値」とは、ピーク点P2の時刻における収縮期血圧値(SBP)を指す。「サージ時間」とは、サージ時間サージ開始点P1の時刻とサージ終了点P4の時刻との間の期間の長さ(=T1+T2)を指す。また、「サージ上昇速度」とは、サージ開始点P1からピーク点P2までの収縮期血圧値(SBP)の上昇速度(=L1/T1)を指す。「サージ下降時間」とは、ピーク点P2の時刻とサージ終了点P4の時刻との間の期間T3を指す。記憶部340に設けられたサージ単位テーブル(図示せず)には、検出された血圧サージ(サージNo.1,2,…)毎に、その血圧サージの特徴量として「サージ変動量」、「サージピーク値」、「サージ時間」、「サージ上昇速度」、「サージ下降時間」が、対応付けて記録される。
(4) 統計量算出処理(図6のステップS4)
次に、図6のステップS4では、サーバ300の制御部350は統計量算出部として働いて、この例では、上記被験者について検出された血圧サージの発生回数と上記ステップS3で算出された特徴量を、時間帯毎に統計処理して統計量を算出する。統計処理は、この例では、血圧サージの発生回数を時間帯毎にカウントし、また、血圧サージの特徴量を時間帯毎に平均する処理である。
次に、図6のステップS4では、サーバ300の制御部350は統計量算出部として働いて、この例では、上記被験者について検出された血圧サージの発生回数と上記ステップS3で算出された特徴量を、時間帯毎に統計処理して統計量を算出する。統計処理は、この例では、血圧サージの発生回数を時間帯毎にカウントし、また、血圧サージの特徴量を時間帯毎に平均する処理である。
上記統計量は、この例では、図10の時間帯テーブル中に示すように、血圧サージの発生回数である「サージ発生回数」と、血圧サージの特徴量としての「サージ変動量平均値」および「サージピーク値平均値」とを含んでいる。図10の時間帯テーブルでは、「時間帯」欄に示す時間帯「22時台」、「23時台」、「0時台」、…、「7時台」毎に、「サージ発生回数」、「サージ変動量平均値」、「サージピーク値平均値」、「サージ時間平均値」、「サージ上昇速度平均値」が、それぞれ対応付けて記録されている(なお、簡単のため、「サージ時間平均値」、「サージ上昇速度平均値」については、図示が省略されている。)。この例では、時間帯「22時台」、「23時台」、「0時台」、…、「7時台」毎に、「サージ発生回数」については「3」、「11」、「14」、…、「1」(単位[回])と記録され、「サージ変動量平均値」については「22」、「25」、「27」、…、「21」(単位[mmHg])と記録され、また、「サージピーク値平均値」については「141」、「143」、「149」、…、「149」(単位[mmHg])と記録されている。図10の時間帯テーブル中に示す「発生回数指標」欄、「変動量指標」欄、「ピーク値指標」欄、「要注意度」欄については、後述する。
なお、統計処理としては、上述の平均する処理以外に、標準偏差を求める処理、最大値・最小値を求める処理、四分位を求める処理、棒グラフを作成する処理、散布図を作成する処理などを含むことができる。
統計処理を行うべき対象としては、上述のもの以外に、
i) 1拍毎の収縮期血圧(SBP)値・拡張期血圧(DBP)値、
ii) 脈拍数(PR)(拍/分)、
iii) 上述の血圧サージの特徴量同士を四則演算で組み合わせたもの、
などを含むことができる。なお、血圧サージの発生に伴って、脈拍数も、血圧サージと同様に、次第に上昇して、ピーク値を示し、続いて下降する態様の変化(山状の波形)を示す。
i) 1拍毎の収縮期血圧(SBP)値・拡張期血圧(DBP)値、
ii) 脈拍数(PR)(拍/分)、
iii) 上述の血圧サージの特徴量同士を四則演算で組み合わせたもの、
などを含むことができる。なお、血圧サージの発生に伴って、脈拍数も、血圧サージと同様に、次第に上昇して、ピーク値を示し、続いて下降する態様の変化(山状の波形)を示す。
統計処理を行うべき単位期間は、時間帯毎、この例では、1時間単位としているが、これに限られるものではない。例えば、30分間毎でもよいし、または、2時間毎、3時間毎などでもよい。
(5) 要注意度算出処理(図6のステップS5)
次に、図6のステップS5では、サーバ300の制御部350は要注意度算出部として働いて、上記被験者について血圧サージに関して注意すべき程度を表す要注意度(これをDCで表す。)を、時間帯毎に求める。
次に、図6のステップS5では、サーバ300の制御部350は要注意度算出部として働いて、上記被験者について血圧サージに関して注意すべき程度を表す要注意度(これをDCで表す。)を、時間帯毎に求める。
この例では、制御部350は、図10の時間帯テーブル中に示した時間帯毎に、「サージ発生回数」、「サージ変動量平均値」、「サージピーク値平均値」と、それぞれ予め定められた閾値との比較結果に基づいて、要注意度DCを求める。
ここで、「サージ発生回数」のための閾値としては、この例では、大小が異なる2個の閾値(これらをα1,α2で表し、α1<α2とする。)が定められている。この例では、デフォルトとして、α1=10回、α2=30回に設定されているものとする。
また、「サージ変動量平均値」のための閾値としては、この例では、大小が異なる2個の閾値(これらをβ1,β2で表し、β1<β2とする。)が定められている。この例では、デフォルトとして、β1=25mmHg、β2=30mmHgに設定されているものとする。
また、「サージピーク値平均値」のための閾値としては、この例では、大小が異なる2個の閾値(これらをγ1,γ2で表し、γ1<γ2とする。)が定められている。この例では、デフォルトとして、γ1=120mmHg、γ2=150mmHgに設定されているものとする。
具体的には、上記要注意度DCを求めるために、制御部350は、図11に示す要注意度算出処理のフローを実行する。
まず、図11のステップS11に示すように、制御部350は、時間帯毎に繰り返しを行うルーチンを開始する。制御部350は、図10の時間帯テーブルから、或る時間帯(これを「注目時間帯」と呼ぶ。最初のターンでは、注目時間帯は「22時台」とする。)のサージ発生回数、サージ変動量平均値、サージピーク値平均値を読み出して取得する。次に、制御部350は個別指標算出部(要注意度算出部に含まれる)として働いて、ステップS12に示すように、「サージ発生回数」に関して注意すべき程度を表す個別指標(これを「発生回数指標」と呼び、符合ID1で表す。)を、閾値α1,α2との比較結果に基づいて求める。同様に、ステップS13に示すように、「サージ変動量平均値」に関して注意すべき程度を表す個別指標(これを「変動量指標」と呼び、符合ID2で表す。)を、閾値β1,β2との比較結果に基づいて求める。さらに、ステップS14に示すように、「サージピーク値平均値」に関して注意すべき程度を表す個別指標(これを「ピーク値指標」と呼び、符合ID3で表す。)を、閾値γ1,γ2との比較結果に基づいて求める。なお、ステップS12~S14の処理は、順序を入れ替えて実行されてもよいし、互いに並行して実行されてもよい。
上記3つの個別指標のための閾値は、それぞれ大小が異なる2個の閾値α1,α2;β1,β2;γ1,γ2であるから、図9の基準テーブル中に示すように、「発生回数指標」ID1、「変動量指標」ID2、「ピーク値指標」ID3は、いずれも低、中、高の3段階に区分して求められる。詳しくは、「発生回数指標」ID1は、閾値α1,α2の値(上述のように、α1=10回、α2=30回である。)に応じて、10回以下の「低」と、10回超かつ30回以下の「中」と、30回超の「高」との3段階に、区分して求められる。「変動量指標」ID2は、閾値β1,β2の値(上述のように、β1=25mmHg、β2=30mmHgである。)に応じて、25mmHg以下の「低」と、25mmHg超かつ30mmHg以下の「中」と、30mmHg超の「高」との3段階に、区分して求められる。また、「ピーク値指標」ID3は、閾値γ1,γ2の値(上述のように、γ1=120mmHg、γ2=150mmHgである。)に応じて、120mmHg以下の「低」と、120mmHg超かつ150mmHg以下の「中」と、150mmHg超の「高」との3段階に、区分して求められる。
例えば、最初のターンでの注目時間帯である「22時台」については、「サージ発生回数」が3回であるから「発生回数指標」ID1は「低」、「サージ変動量平均値」が22mmHgであるから「変動量指標」ID2は「低」、また、「サージピーク値平均値」が141mmHgであるから「ピーク値指標」ID3は「中」として求められる。求められた「発生回数指標」ID1、「変動量指標」ID2、「ピーク値指標」ID3は、それぞれ図10の時間帯テーブルの注目時間帯(最初のターンでは、「22時台」)に対応付けて記録される。
次に、図11のステップS15に示すように、制御部350は統合処理部(要注意度算出部に含まれる)として働いて、注目時間帯について、個別指標を用いて統合して、血圧サージに関して注意すべき程度を表す要注意度DCを、3段階に区分して求める。
この例では、個別指標を統合する方式として、それぞれの個別指標が表す「低」、「中」、「高」の3段階のうち、最も多いもの(段階)を要注意度DCとして決定するものとする(多数決方式)。この多数決方式によれば、個別指標のうち代表的なのも(段階)を知らせる観点から、要注意度DCが決定される。
例えば、最初のターンでの注目時間帯である「22時台」については、「発生回数指標」ID1は「低」、「変動量指標」ID2は「低」、また、「ピーク値指標」ID3は「中」であるから、そのうち最も多い「低」段階が採用されて、要注意度DCは「低」として求められる。求められた要注意度DCは、図10の時間帯テーブルの注目時間帯(最初のターンでは、「22時台」)に対応付けて、「要注意度」欄に記録される。
上述の最初のターンに続くターンでは、注目時間帯は「23時台」になる。ここで、「23時台」については、「サージ発生回数」が11回であるから「発生回数指標」ID1は「中」、「サージ変動量平均値」が25mmHgであるから「変動量指標」ID2は「中」、また、「サージピーク値平均値」が143mmHgであるから「ピーク値指標」ID3は「中」として求められる(図11のステップS12~S14)。この結果、要注意度DCは「中」として求められる。求められた要注意度DCは、図10の時間帯テーブルの注目時間帯(「23時台」)に対応付けて、「要注意度」欄に記録される(図11のステップS15)。
このようにして、注目時間帯毎に、「発生回数指標」ID1、「変動量指標」ID2、「ピーク値指標」ID3、「要注意度」DCが順次求められ、図10の時間帯テーブルに順次記録される。図10の時間帯テーブルに示す例では、時間帯「22時台」、「23時台」、「0時台」、…、「7時台」毎に、「発生回数指標」ID1については「低」、「中」、「中」、…、「低」、「変動量指標」ID2については「低」、「中」、「中」、…、「低」、「ピーク値指標」ID3については「中」、「中」、「中」、…、「中」、また、「要注意度」DCについては「低」、「中」、「中」、…、「低」というように、それぞれ対応付けて記録されている。
全ての時間帯について、「発生回数指標」ID1、「変動量指標」ID2、「ピーク値指標」ID3、「要注意度」DCの記録が完了すると、図11のステップS16に示すように、時間帯毎の繰り返しを行うルーチンを終了する。
このようにして、このシステム100によれば、要注意度DCを簡単な演算処理によって求めることができる。
なお、上の例では、「サージ発生回数」のための閾値α1,α2、「サージ変動量平均値」のための閾値β1,β2、「サージピーク値平均値」のための閾値γ1,γ2の値が、デフォルトで設定されているものとしたが、これに限られるものではない。例えば、ユーザ(主に、システム管理者)がサーバ300の操作部330を入力部として用いて、この要注意度算出処理(図6のステップS5)に先立って、それらの閾値α1,α2、β1,β2、γ1,γ2の値を可変して設定してもよい。これにより、各個別指標(「発生回数指標」ID1、「変動量指標」ID2、「ピーク値指標」ID3)を3段階に区分して求める閾値(基準)に関して、ひいては要注意度DCを3段階に区分して求める基準に関して、ユーザ(主に、医師)の経験を反映させることができる。
また、上の例では、個別指標(「発生回数指標」ID1、「変動量指標」ID2、「ピーク値指標」ID3)を統合する方式として、多数決方式を採用したが、これに限られるものではない。個別指標を統合する方式として、それぞれの個別指標が表す「低」、「中」、「高」の3段階のうち、最も高いもの(段階)を、要注意度DCとして決定してもよい(高段階優先方式)。この場合、例えば、図10の時間帯テーブル中の「22時台」については、「発生回数指標」ID1は「低」、「変動量指標」ID2は「低」、また、「ピーク値指標」ID3は「中」であるから、そのうち最も高い「中」段階が採用されて、要注意度DCは「中」として求められる。この高段階優先方式によれば、少しでも高い注意を要する個別指標があれば、それを指摘すべきとの観点から、要注意度DCが決定される。
また、上の例では、個別指標として、「発生回数指標」ID1と、「変動量指標」ID2と、「ピーク値指標」ID3との3指標を用いているが、これに限られるものではない。個別指標として、上記3指標に加えて、「サージ時間平均値」に関して注意すべき程度を表す個別指標(これを「サージ時間指標」と呼ぶ。)、「サージ上昇速度平均値」に関して注意すべき程度を表す個別指標(これを「サージ上昇速度指標」と呼ぶ。)、「サージ下降時間」に関して注意すべき程度を表す個別指標(これを「サージ下降時間指標」と呼ぶ。)を用いてもよい。また、それらの個別指標に加えて、平均値以外の、標準偏差、最大値・最小値、四分位などの統計値に関して注意すべき程度を表す個別指標を用いてもよい。さらに、
i) 1拍毎の収縮期血圧(SBP)値・拡張期血圧(DBP)値、
ii) 脈拍数(PR)(拍/分)、
iii) 上述の血圧サージの特徴量同士を四則演算で組み合わせたもの、
についての各種統計値に関して注意すべき程度を表す個別指標を用いてもよい。
i) 1拍毎の収縮期血圧(SBP)値・拡張期血圧(DBP)値、
ii) 脈拍数(PR)(拍/分)、
iii) 上述の血圧サージの特徴量同士を四則演算で組み合わせたもの、
についての各種統計値に関して注意すべき程度を表す個別指標を用いてもよい。
(6) 血圧サージ関連情報表示処理(図6のステップS6)
次に、図6のステップS6では、サーバ300の制御部350が、この例では、上記被験者について求められた要注意度DCと、「サージ発生回数」と、「サージ変動量平均値」と、「サージピーク値平均値」とを、時間帯毎に並べて表示する画像データ(これをImとする。)を作成する。その画像データImを、サーバ300からネットワーク900を介して、いずれかの病院端末400(400A,400B,…)が受信する。病院端末400は表示処理部として働いて、図12に示すように、表示器420の表示画面上に、その画像データImをグラフ表示する。
次に、図6のステップS6では、サーバ300の制御部350が、この例では、上記被験者について求められた要注意度DCと、「サージ発生回数」と、「サージ変動量平均値」と、「サージピーク値平均値」とを、時間帯毎に並べて表示する画像データ(これをImとする。)を作成する。その画像データImを、サーバ300からネットワーク900を介して、いずれかの病院端末400(400A,400B,…)が受信する。病院端末400は表示処理部として働いて、図12に示すように、表示器420の表示画面上に、その画像データImをグラフ表示する。
この例では、画像データImは、表示画面上に、時間帯「22時台」、「23時台」、「0時台」、…、「7時台」の進行(横軸X)に沿って並べて設定された、各時間帯に対応する矩形状の閉領域H22,H23,H0,…,H7を含んでいる。それらの閉領域H22,H23,H0,…,H7のそれぞれに、対応する時間帯の要注意度DCに応じた特定色が付されている。「特定色」としては、この例では、要注意度DCの「低」に応じた緑(G)、要注意度DCの「中」に応じた黄(Y)、要注意度DCの「高」に応じた赤(R)の3色が採用されている。
例えば、図10の時間帯テーブルでは、時間帯「22時台」について、「要注意度」DCが「低」として記録されている。これに応じて、図12の画像データImでは、閉領域H22に緑(G)が付されている。また、図10の時間帯テーブルでは、時間帯「23時台」について、「要注意度」DCが「中」として記録されている。これに応じて、図12の画像データImでは、閉領域H23に黄(Y)が付されている。また、図10の時間帯テーブルでは、時間帯「1時台」について、「要注意度」DCが「高」として記録されている。これに応じて、図12の画像データImでは、閉領域H1に赤(R)が付されている。このように、この画像データImでは、閉領域H22,H23,H0,…,H7のそれぞれに、対応する時間帯の要注意度DCに応じた特定色が付されている。
これにより、ユーザは、表示器420の表示画面を見ることによって、要注意度DC(すなわち、血圧サージに関して注意すべき程度)の時間帯毎の推移を、直感的に把握することができる。
また、この例では、表示器420の表示画面上で、画像データImは、複数の閉領域H22,H23,H0,…,H7の上にそれぞれ「サージ発生回数」、「サージ変動量平均値」および「サージピーク値平均値」を表すグラフを重ねた状態で表示されている。
この例では、「サージ発生回数」は、時間帯毎に棒グラフM1として表されている。棒グラフM1をなす各棒には、それぞれ青色(B)が付されている。この青色(B)は、要注意度DCを表すためのいずれの特定色(緑(G)、黄(Y)、赤(R))とも異なっているので、背景色(閉領域H22,H23,H0,…,H7の色)と区別し易い。ユーザは、この棒グラフM1を見ることによって、「サージ発生回数」の時間帯毎の推移を、直感的に把握することができる。なお、この例では、左側の縦軸Y1に、「サージ発生回数」のための目盛が表されている。
また、この例では、「サージピーク値平均値」は、時間帯毎に正方形のドット状のマークM3として表されている。ドット状のマークM3は、正方形でなく、円や三角形などであっても良い。「サージ変動量平均値」は、「サージピーク値平均値」を表す各ドット状のマークM3から下方へ延びる線分状のマークM2として表されている。ドット状のマークM3、線分状のマークM2の色は、背景色(閉領域H22,H23,H0,…,H7の色)と区別し易いものであればよく、例えば黒色(Bk)であってもよい。ユーザは、これらのマークM2,M3を見ることによって、「サージ変動量平均値」、「サージピーク値平均値」の、時間帯毎の推移を、直感的に把握することができる。なお、この例では、右側の縦軸Y1に、「サージ変動量平均値」、「サージピーク値平均値」のための目盛が表されている。
また、ユーザは、「サージ発生回数」、「サージ変動量平均値」および「サージピーク値平均値」を表すグラフ(棒グラフM1とマークM2,M3)を見ることによって、時間帯毎に要注意度DC(閉領域H22,H23,H0,…,H7の色)が緑(G)(低段階)、黄(Y)(中段階)または赤(R)(高段階)になっている理由や根拠を、直感的に把握することができる。
このように、この血圧関連情報表示方法では、血圧サージに関連する情報を時間帯毎に可視化して表示する。これにより、ユーザは、表示器420の表示画面を見ることによって、血圧サージに関して注意すべき程度を表す要注意度DCと、血圧サージの特徴を表す特徴量についての統計量の、時間帯毎の推移を知ることができる。これにより、例えば、医師は、患者(被験者)の症状の時間帯毎の傾向が分かり、診察時に患者に対するアドバイスがし易くなる。また、詳細に血圧サージの波形まで確認したいとの要求が発生したときに、医師は、まず要注意度DCが高い時間帯のサージ事例から確認することが可能となり、効率的な解析が可能となる。さらに、表示器420の表示画面上に表示される情報(画像データImを含む。)は、SASの診断や治療のほか、血圧サージと心血管イベント(狭心症、心筋梗塞、虚血性心不全など)との関連性を研究するのに役立ち、新たな臨床的知見につながる可能性がある。
なお、上の例では、表示器420の表示画面上に、血圧サージに関して注意すべき程度を表す要注意度DCと、血圧サージの特徴を表す特徴量についての統計量のグラフ(棒グラフM1とマークM2,M3)との両方を、時間帯毎に並べて表示したが、これに限られるものではない。血圧サージに関して注意すべき程度を表す要注意度DCと、血圧サージの特徴を表す特徴量についての統計量のグラフとのいずれか一方のみを、時間帯毎に並べて表示してもよい。
[第2の血圧関連情報表示方法]
上述のシステム100は、大別して、図13中のステップS11~S15に示されたサーバ300での血圧サージの検出・解析処理と、図13中のステップS16に示された病院端末400での血圧サージ関連情報表示処理とを含む、第2の血圧関連情報表示方法を実行する。
上述のシステム100は、大別して、図13中のステップS11~S15に示されたサーバ300での血圧サージの検出・解析処理と、図13中のステップS16に示された病院端末400での血圧サージ関連情報表示処理とを含む、第2の血圧関連情報表示方法を実行する。
血圧サージに関連する情報、例えば血圧サージの発生頻度、サージピーク値、サージ変動量、および、それらに基づいて評価されるリスクなどを被験者毎に区別して可視化して表示することは、臨床的に重要であると考えられる。しかしながら、本出願人が知る限り、血圧サージに関連する情報を被験者毎に可視化して表示する技術については、これまで知られていない。そこで、この第2の血圧関連情報表示方法では、複数の被験者についての血圧サージに関連する情報を被験者毎に区別して可視化して表示する。
ここで、複数の被験者について既に一晩の血圧の時系列データ801(図7(A)参照)、1拍毎のSBP値・DBP値、脈拍数等を含む測定データが、血圧計200によって測定され、ネットワーク900を介してサーバ300の記憶部340に、被験者毎に区別して記憶されているものとする。なお、複数の被験者についての測定データは、ネットワーク900に接続された複数台の血圧計200のうち、それぞれ被験者毎に割り当てられた血圧計200によって測定されてもよい。また、各血圧計200は、一旦、いずれかの病院端末400へ上記測定データを送信し、その病院端末400が、サーバ300へ、上記測定データを送信してもよい。
(1) 前処理から特徴量算出処理まで(図13のステップS11~S13)
この第2の血圧関連情報表示方法では、図13中のステップS11~S13までの処理については、被験者毎に、それぞれ図6中のステップS1~S3までの処理と同様に行われる。
この第2の血圧関連情報表示方法では、図13中のステップS11~S13までの処理については、被験者毎に、それぞれ図6中のステップS1~S3までの処理と同様に行われる。
すなわち、図13のステップS11では、サーバ300の制御部350は前処理部として働いて、被験者毎に区別して、血圧の時系列データに公知の移動平均などを用いた平滑化、ノイズ除去、ローパスフィルタを用いた高周波成分除去等の前処理を施す。さらに、サーバ300の制御部350は、血圧の時系列データ801のうち、血圧サージの検出・解析の対象となるべき有効区間を抽出する。以下の処理(図13中のステップS12~S16)は、この有効区間を対象として行われるものとする。
次に、図13のステップS12では、サーバ300の制御部350は血圧サージ検出部として働いて、被験者毎に区別して、血圧の時系列データ801(のうちの有効区間)から、予め定められた判定基準に基づいて血圧サージを検出する。
次に、図13のステップS13では、サーバ300の制御部350は特徴量算出部として働いて、被験者毎に区別して、検出された血圧サージ(例えば、サージNo.1,2,…とする。)毎に、その血圧サージの特徴を表す特徴量として、この例では、「サージ変動量」、「サージピーク値」、「サージ時間」、「サージ上昇速度」、「サージ下降時間」を算出する。記憶部340に設けられたサージ単位テーブル(図示せず)には、被験者毎に区別して、検出された血圧サージ(サージNo.1,2,…)毎に、その血圧サージの特徴量として「サージ変動量」、「サージピーク値」、「サージ時間」、「サージ上昇速度」、「サージ下降時間」が、対応付けて記録される。
(2) 統計量算出処理(図13のステップS14)
次に、図13のステップS14では、サーバ300の制御部350は統計量算出部として働いて、この例では、検出された血圧サージの発生回数と上記ステップS13で算出された特徴量を、被験者毎に統計処理して統計量を算出する。統計処理は、この例では、血圧サージの発生回数を一晩(22時台から7時台まで)にわたってカウントし、また、血圧サージの特徴量を一晩にわたって平均する処理である。
次に、図13のステップS14では、サーバ300の制御部350は統計量算出部として働いて、この例では、検出された血圧サージの発生回数と上記ステップS13で算出された特徴量を、被験者毎に統計処理して統計量を算出する。統計処理は、この例では、血圧サージの発生回数を一晩(22時台から7時台まで)にわたってカウントし、また、血圧サージの特徴量を一晩にわたって平均する処理である。
上記統計量は、この例では、図14の患者単位テーブル中に示すように、血圧サージの発生回数である「サージ発生回数」と、血圧サージの特徴量としての「サージ変動量平均値」、「サージピーク値平均値」、「サージ時間平均値」、「サージ上昇速度平均値」および「サージ下降時間平均値」とを含んでいる。図14の患者単位テーブルでは、患者(被験者)を特定する患者番号毎に、「サージ発生回数」、「サージ変動量平均値」、「サージ時間平均値」、「サージピーク値平均値」、「サージ上昇速度平均値」、「サージ下降時間平均値」がそれぞれ対応付けて記録されている(なお、簡単のため、「サージ時間平均値」については、図示が省略されている。)。例えば、「患者A」については、「サージ発生回数」は14回、「サージ変動量平均値」は27mmHg、「サージピーク値平均値」は149mmHg、「サージ上昇速度平均値」は1.3mmHg/sec、「サージ下降時間平均値」は15secと記録されている。「患者C」については、「サージ発生回数」は1回、「サージ変動量平均値」は21mmHg、「サージピーク値平均値」は149mmHg、「サージ上昇速度平均値」は0.8mmHg/sec、「サージ下降時間平均値」は5secと記録されている。また、「患者E」については、「サージ発生回数」は25回、「サージ変動量平均値」は31mmHg、「サージピーク値平均値」は158mmHg、「サージ上昇速度平均値」は2.1mmHg/sec、「サージ下降時間平均値」は21secと記録されている。
(3) 要注意度算出処理(図13のステップS15)
次に、図13のステップS15では、サーバ300の制御部350は要注意度算出部として働いて、血圧サージに関して注意すべき程度を表す要注意度(これをDCで表す。)を、患者(被験者)毎に求める。
次に、図13のステップS15では、サーバ300の制御部350は要注意度算出部として働いて、血圧サージに関して注意すべき程度を表す要注意度(これをDCで表す。)を、患者(被験者)毎に求める。
この例では、制御部350は、図14の患者単位テーブル中に示した患者毎に、図6のステップS5の処理と同様の処理を実行して、「サージ発生回数」、「サージ変動量平均値」、「サージピーク値平均値」と、それぞれ予め定められた閾値との比較結果に基づいて、要注意度DCを求める。
すなわち、まず、制御部350は個別指標算出部として働いて、図14の患者単位テーブル中に示した「サージ発生回数」、「サージ変動量平均値」、「サージピーク値平均値」に関して、患者毎に、それぞれ注意すべき程度を表す3つの個別指標(既述の「発生回数指標」ID1、「変動量指標」ID2、「ピーク値指標」ID3に相当する)を求める。次に、制御部350は統合処理部として働いて、上記3つの個別指標を用いて、患者毎に、上記要注意度DCを3段階(低、中、高)に区分して求める。
求められた「要注意度」DCは、図14の患者単位テーブルに、患者毎に記録される。この例では、図14の患者単位テーブルに、「要注意度」DCについて、「患者A」については「中」、「患者B」については「中」、「患者C」については「低」、「患者D」については「低」、「患者E」については「高」、「患者F」については「中」というように、それぞれ対応付けて記録されている。
なお、図10の時間帯テーブルにおける「サージ発生回数」は時間帯毎の発生回数であるのに対して、図14の患者単位テーブルにおける「サージ発生回数」は一晩にわたる発生回数であることから、図13のステップS15では、「サージ発生回数」のための閾値α1,α2は、図6のステップS5の処理における「サージ発生回数」のための閾値α1,α2よりも大きく設定されるのが望ましい。
上の例では、第1の血圧関連情報表示方法におけるのと同様に、個別指標として、「発生回数指標」ID1と、「変動量指標」ID2と、「ピーク値指標」ID3との3指標を用いているが、これに限られるものではない。個別指標として、上記3指標に加えて、「サージ時間指標」、「サージ上昇速度指標」、「サージ下降時間指標」を用いてもよい。また、それらの個別指標に加えて、平均値以外の、標準偏差、最大値・最小値、四分位などの統計値に関して注意すべき程度を表す個別指標を用いてもよい。
(4) 血圧サージ関連情報表示処理(図13のステップS16)
次に、図13のステップS16では、サーバ300の制御部350が、この例では、求められた要注意度DCと、「サージ発生回数」と、「サージ変動量平均値」と、「サージピーク値平均値」とを、患者(被験者)毎に並べて表示する画像データ(これをIm1とする。)を作成する。その画像データIm1を、サーバ300からネットワーク900を介して、いずれかの病院端末400(400A,400B,…)が受信する。病院端末400は表示処理部として働いて、図15に示すように、表示器420の表示画面上に、その画像データIm1をグラフ表示する。
次に、図13のステップS16では、サーバ300の制御部350が、この例では、求められた要注意度DCと、「サージ発生回数」と、「サージ変動量平均値」と、「サージピーク値平均値」とを、患者(被験者)毎に並べて表示する画像データ(これをIm1とする。)を作成する。その画像データIm1を、サーバ300からネットワーク900を介して、いずれかの病院端末400(400A,400B,…)が受信する。病院端末400は表示処理部として働いて、図15に示すように、表示器420の表示画面上に、その画像データIm1をグラフ表示する。
この例では、画像データIm1は、表示画面上に、横方向(横軸X10)に沿って並べて設定された、各患者A,B,C,D,E,F,…に対応する矩形状の閉領域AA,AB,AC,AD,AE,AF,…を含んでいる。それらの閉領域AA,AB,AC,AD,AE,AF,…のそれぞれに、対応する患者の要注意度DCに応じた特定色が付されている。「特定色」としては、この例では、第1の血圧関連情報表示方法におけるのと同様に、要注意度DCの「低」に応じた緑(G)、要注意度DCの「中」に応じた黄(Y)、要注意度DCの「高」に応じた赤(R)の3色が採用されている。
例えば、図14の患者単位テーブルでは、「患者A」について、「要注意度」DCが「中」として記録されている。これに応じて、図15の画像データIm1では、閉領域AAに黄(Y)が付されている。また、図14の患者単位テーブルでは、「患者C」について、「要注意度」DCが「低」として記録されている。これに応じて、図15の画像データIm1では、閉領域ACに緑(G)が付されている。また、図14の患者単位テーブルでは、「患者E」について、「要注意度」DCが「高」として記録されている。これに応じて、図15の画像データIm1では、閉領域AEに赤(R)が付されている。このように、この画像データIm1では、閉領域AA,AB,AC,AD,AE,AF,…のそれぞれに、対応する患者の要注意度DCに応じた特定色が付されている。
これにより、ユーザは、表示器420の表示画面を見ることによって、要注意度DC(すなわち、血圧サージに関して注意すべき程度)を、患者毎に、直感的に把握することができる。
また、この例では、表示器420の表示画面上で、画像データIm1は、複数の閉領域AA,AB,AC,AD,AE,AF,…の上にそれぞれ一晩の「サージ発生回数」、「サージ変動量平均値」および「サージピーク値平均値」を表すグラフを重ねた状態で表示されている。
この例では、「サージ発生回数」は、患者毎に棒グラフM11として表されている。棒グラフM11をなす各棒には、それぞれ青色(B)が付されている。この青色(B)は、要注意度DCを表すためのいずれの特定色(緑(G)、黄(Y)、赤(R))とも異なっているので、背景色(閉領域AA,AB,AC,AD,AE,AF,…の色)と区別し易い。ユーザは、この棒グラフM11を見ることによって、一晩の「サージ発生回数」を、直感的に把握することができる。なお、この例では、左側の縦軸Y11に、「サージ発生回数」のための目盛が表されている。
また、この例では、「サージピーク値平均値」は、患者毎に正方形のドット状のマークM13として表されている。ドット状のマークM13は、正方形でなく、円や三角形などであっても良い。「サージ変動量平均値」は、「サージピーク値平均値」を表す各ドット状のマークM13から下方へ延びる線分状のマークM12として表されている。ドット状のマークM13、線分状のマークM12の色は、背景色(閉領域AA,AB,AC,AD,AE,AF,…の色)と区別し易いものであればよく、例えば黒色(Bk)であってもよい。ユーザは、これらのマークM12,M13を見ることによって、「サージ変動量平均値」、「サージピーク値平均値」を、患者毎に、直感的に把握することができる。なお、この例では、右側の縦軸Y12に、「サージ変動量平均値」、「サージピーク値平均値」のための目盛が表されている。
また、ユーザは、一晩の「サージ発生回数」、「サージ変動量平均値」および「サージピーク値平均値」を表すグラフ(棒グラフM11とマークM12,M13)を見ることによって、患者毎に要注意度DC(閉領域AA,AB,AC,AD,AE,AF,…の色)が緑(G)(低段階)、黄(Y)(中段階)または赤(R)(高段階)になっている理由や根拠を、直感的に把握することができる。
このように、この血圧関連情報表示方法では、血圧サージに関連する情報を患者(被験者)毎に可視化して表示する。これにより、ユーザは、表示器420の表示画面を見ることによって、血圧サージに関して注意すべき程度を表す要注意度DCと、血圧サージの特徴を表す特徴量についての統計量とを、患者毎に知ることができる。これにより、例えば、医師は、複数の患者のうち、要注意度DCが最も高い患者から優先して、症状の評価や分析をすることができる。また、医師は、要注意度DCおよび/または上記統計量が同程度である患者を、グループとして特定することができる。これにより、そのグループに含まれた患者について、生活習慣での共通点、血圧サージ以外の他の測定値(例えば心血管イベントに関する測定値)での共通の傾向などを探したり、他のグループとの相違点を調べたりすることができる。このように、血圧サージの診断や治療のために効果的な分析を行うことができる。
なお、上の例では、表示器420の表示画面上に、血圧サージに関して注意すべき程度を表す要注意度DCと、血圧サージの特徴を表す特徴量についての統計量のグラフ(棒グラフM11とマークM12,M13)との両方を、患者毎に並べて表示したが、これに限られるものではない。血圧サージに関して注意すべき程度を表す要注意度DCと、血圧サージの特徴を表す特徴量についての統計量のグラフとのいずれか一方のみを、患者毎に並べて表示してもよい。
また、この第2の血圧関連情報表示方法では、表示画面上に、各患者A,B,C,D,E,F,…に対応する矩形状の閉領域AA,AB,AC,AD,AE,AF,…を、縦方向(縦軸)に沿って並べて表示してもよい。その場合、閉領域AA,AB,AC,AD,AE,AF,…の上に、それぞれ対応する患者の一晩の「サージ発生回数」、「サージ変動量平均値」および「サージピーク値平均値」を表すグラフ(棒グラフM11とマークM12,M13)を重ねて、横軸の目盛に従って表示してもよい。
(変形例1)
上述の実施形態では、サーバ300の制御部350が画像データIm,Im1を作成し、病院端末400の表示器420が画像を表示したが、これに限られるものではない。サーバ300の制御部350は、画像データIm,Im1を病院端末400へ送信する代わりに、画像作成のためのデータのみを送信し、病院端末400が専ら画像データIm,Im1を作成しても良い。
上述の実施形態では、サーバ300の制御部350が画像データIm,Im1を作成し、病院端末400の表示器420が画像を表示したが、これに限られるものではない。サーバ300の制御部350は、画像データIm,Im1を病院端末400へ送信する代わりに、画像作成のためのデータのみを送信し、病院端末400が専ら画像データIm,Im1を作成しても良い。
(変形例2)
また、上述の実施形態では、本発明の血圧関連情報表示装置を、病院端末400とサーバ300とを含むネットワーク上のシステム100として構成したが、これに限られるものではない。
また、上述の実施形態では、本発明の血圧関連情報表示装置を、病院端末400とサーバ300とを含むネットワーク上のシステム100として構成したが、これに限られるものではない。
例えば、本発明の血圧関連情報表示装置を、病院端末400(例えば400A)のみで構成しても良い。つまり、病院端末400に上述の血圧関連情報表示方法の全部(血圧計200からの血圧の時系列データの受信から、表示器420の表示画面上への画像データの表示までを含む。)を実行させてもよい。
その場合、病院端末400には、上述の血圧関連情報表示方法を実行させるプログラムをインストールしておく。これにより、本発明の血圧関連情報表示装置を小型かつコンパクトに構成することができる。
また、上述の血圧関連情報表示方法を、ソフトウェア(コンピュータプログラム)として、CD(コンパクトディスク)、DVD(デジタル万能ディスク)、フラッシュメモリなどの非一時的(non-transitory)にデータを記憶可能な記録媒体に記録してもよい。このような記録媒体に記録されたソフトウェアを、パーソナルコンピュータ、PDA(パーソナル・デジタル・アシスタンツ)、スマートフォンなどの実質的なコンピュータ装置にインストールすることによって、それらのコンピュータ装置に、上述の血圧関連情報表示方法を実行させることができる。
(変形例3)
また、上述の実施形態では、個別指標(「発生回数指標」ID1、「変動量指標」ID2、「ピーク値指標」ID3)と要注意度DCとを、いずれも低、中、高の3段階に区分して求めたが、これに限られるものではない。個別指標と要注意度DCとを区分する段階の数(これをmとする。)は、m=2でもよく、または、m≧4であってもよい。mの値が小さければ、演算処理を簡単に済ませられる。一方、mの値が大きければ、要注意度DCを求める精度を高めることができる。なお、m=2とする場合は、各個別指標のための閾値の数をそれぞれ1個ずつにすればよい。この場合、個別指標が表す段階は例えば「低」、「高」の2段階となる。これに応じて、要注意度DCは、例えば緑(G)が付される「低」と、赤(R)が付される「高」との2段階となる。また、m≧4とする場合は、各個別指標のための閾値の数をそれぞれ大小が異なる(m-1)個ずつにすればよい。この場合、個別指標が表す段階はm段階(m≧4)となる。これに応じて、要注意度DCは、例えば互いに互いに異なるm個の特定色が付されるm段階となる。
また、上述の実施形態では、個別指標(「発生回数指標」ID1、「変動量指標」ID2、「ピーク値指標」ID3)と要注意度DCとを、いずれも低、中、高の3段階に区分して求めたが、これに限られるものではない。個別指標と要注意度DCとを区分する段階の数(これをmとする。)は、m=2でもよく、または、m≧4であってもよい。mの値が小さければ、演算処理を簡単に済ませられる。一方、mの値が大きければ、要注意度DCを求める精度を高めることができる。なお、m=2とする場合は、各個別指標のための閾値の数をそれぞれ1個ずつにすればよい。この場合、個別指標が表す段階は例えば「低」、「高」の2段階となる。これに応じて、要注意度DCは、例えば緑(G)が付される「低」と、赤(R)が付される「高」との2段階となる。また、m≧4とする場合は、各個別指標のための閾値の数をそれぞれ大小が異なる(m-1)個ずつにすればよい。この場合、個別指標が表す段階はm段階(m≧4)となる。これに応じて、要注意度DCは、例えば互いに互いに異なるm個の特定色が付されるm段階となる。
(変形例4)
また、上述の実施形態では、血圧計200はトノメトリ方式の血圧計であるものとしたが、これに限られるものではない。血圧計200は、被測定部位のうち対応する部分を通る動脈へ向けて光を照射する発光素子と、その光の反射光(または透過光)を受光する受光素子とを備えて、動脈の脈波を容積の変化に基づいて連続的に血圧を検出してもよい(光電方式)。また、血圧計200は、被測定部位に当接された圧電センサを備えて、被測定部位のうち対応する部分を通る動脈の圧力による歪みを電気抵抗の変化として検出し、この電気抵抗の変化に基づいて連続的に血圧を検出してもよい(圧電方式)。さらに、血圧計200は、被測定部位のうち対応する部分を通る動脈へ向けて電波(送信波)を送る送信素子と、その電波の反射波を受信する受信素子とを備えて、動脈の脈波による動脈とセンサとの間の距離の変化を送信波と反射波との間の位相のずれとして検出し、この位相のずれに基づいて連続的に血圧を検出してもよい(電波照射方式)。また、血圧を算出することができる物理量を観測することができれば、これらの以外の方式を適用してもよい。
また、上述の実施形態では、血圧計200はトノメトリ方式の血圧計であるものとしたが、これに限られるものではない。血圧計200は、被測定部位のうち対応する部分を通る動脈へ向けて光を照射する発光素子と、その光の反射光(または透過光)を受光する受光素子とを備えて、動脈の脈波を容積の変化に基づいて連続的に血圧を検出してもよい(光電方式)。また、血圧計200は、被測定部位に当接された圧電センサを備えて、被測定部位のうち対応する部分を通る動脈の圧力による歪みを電気抵抗の変化として検出し、この電気抵抗の変化に基づいて連続的に血圧を検出してもよい(圧電方式)。さらに、血圧計200は、被測定部位のうち対応する部分を通る動脈へ向けて電波(送信波)を送る送信素子と、その電波の反射波を受信する受信素子とを備えて、動脈の脈波による動脈とセンサとの間の距離の変化を送信波と反射波との間の位相のずれとして検出し、この位相のずれに基づいて連続的に血圧を検出してもよい(電波照射方式)。また、血圧を算出することができる物理量を観測することができれば、これらの以外の方式を適用してもよい。
以上の実施形態は例示であり、この発明の範囲から離れることなく様々な変形が可能である。上述した複数の実施の形態は、それぞれ単独で成立し得るものであるが、実施の形態同士の組みあわせも可能である。また、異なる実施の形態の中の種々の特徴も、それぞれ単独で成立し得るものであるが、異なる実施の形態の中の特徴同士の組みあわせも可能である。
100 システム
200 血圧計
260,350 制御部
300 サーバ
320,420 表示器
400,400A,400B,… 病院端末
200 血圧計
260,350 制御部
300 サーバ
320,420 表示器
400,400A,400B,… 病院端末
Claims (16)
- 血圧サージに関連する情報を可視化して表示する血圧関連情報表示装置であって、
被験者の脈動に連動して変化する血圧の時系列データから、予め定められた判定基準に基づいて血圧サージを検出する血圧サージ検出部と、
検出された上記血圧サージの特徴を表す特徴量を算出する特徴量算出部と、
検出された上記血圧サージの発生回数および/または上記特徴量を、時間帯毎に統計処理して統計量を算出する統計量算出部と、
上記血圧サージの発生回数および/または上記特徴量についての上記統計量に基づいて、血圧サージに関して注意すべき程度を表す要注意度を、上記時間帯毎に求める要注意度算出部と、
表示画面上で、求められた上記要注意度および/または上記統計量を、上記時間帯毎に並べて表示する処理を行う表示処理部とを備えたことを特徴とする血圧関連情報表示装置。 - 請求項1に記載の血圧関連情報表示装置において、
上記要注意度は、上記注意すべき程度に応じた複数の段階に区分され、上記複数の段階のそれぞれが、その段階に応じた特定色によって表されることを特徴とする血圧関連情報表示装置。 - 請求項2に記載の血圧関連情報表示装置において、
上記表示処理部は、
上記表示画面上で、各時間帯に対応する閉領域を、上記時間帯の進行に沿って並べて設定するとともに、
上記閉領域のそれぞれに、対応する時間帯の上記要注意度に応じた上記特定色を付す
ことを特徴とする血圧関連情報表示装置。 - 請求項3に記載の血圧関連情報表示装置において、
上記表示処理部は、上記表示画面上で、上記複数の閉領域の上にそれぞれ上記統計量を表すグラフを重ねた状態で表示することを特徴とする血圧関連情報表示装置。 - 請求項1から4までのいずれか一つに記載の血圧関連情報表示装置において、
上記統計量は、上記血圧サージの発生回数、上記特徴量としてのサージ変動量およびサージピーク値を、少なくとも含むことを特徴とする血圧関連情報表示装置。 - 請求項5に記載の血圧関連情報表示装置において、
上記要注意度算出部は、上記時間帯毎に、上記血圧サージの発生回数、上記特徴量としてのサージ変動量およびサージピーク値についての上記統計量と、それぞれ予め定められた閾値との比較結果に基づいて、上記要注意度を求めることを特徴とする血圧関連情報表示装置。 - 請求項6に記載の血圧関連情報表示装置において、
上記要注意度算出部は、mを2以上の自然数としたとき、
上記時間帯毎に、上記血圧サージの発生回数、上記特徴量としてのサージ変動量およびサージピーク値についての上記統計量に関して、それぞれ注意すべき程度を表す個別指標を、それぞれ予め定められた大小が異なる(m-1)個の閾値との比較結果に基づいて、上記注意すべき程度に応じたm段階に区分して求める個別指標算出部と、
上記血圧サージの発生回数、上記特徴量としてのサージ変動量およびサージピーク値についてそれぞれ求められた上記個別指標を用いて、上記要注意度を上記m段階に区分して求める統合処理部と
を含むことを特徴とする血圧関連情報表示装置。 - 請求項6または7に記載の血圧関連情報表示装置において、
上記閾値をそれぞれ可変して設定するための入力部を備えたことを特徴とする血圧関連情報表示装置。 - 請求項5から8までのいずれか一つに記載の血圧関連情報表示装置において、
上記表示処理部は、上記表示画面上で、
上記血圧サージの発生回数を上記時間帯毎に棒グラフとして表し、
上記サージピーク値についての上記統計量を上記時間帯毎にドット状のマークとして表し、
上記サージ変動量についての上記統計量を、上記サージピーク値を表す各ドット状のマークから下方へ延びる線分状のマークとして表す
ことを特徴とする血圧関連情報表示装置。 - 血圧サージに関連する情報を可視化して表示する血圧関連情報表示方法であって、
被験者の脈動に連動して変化する血圧の時系列データから、予め定められた判定基準に基づいて血圧サージを検出し、
検出された上記血圧サージの特徴を表す特徴量を算出し、
検出された上記血圧サージの発生回数および/または上記特徴量を、時間帯毎に統計処理して統計量を算出し、
上記血圧サージの発生回数および/または上記特徴量についての上記統計量に基づいて、血圧サージに関して注意すべき程度を表す要注意度を、上記時間帯毎に求め、
表示画面上で、求められた上記要注意度および/または上記統計量を、上記時間帯毎に並べて表示する処理を行うことを特徴とする血圧関連情報表示方法。 - 血圧サージに関連する情報を可視化して表示する血圧関連情報表示装置であって、
被験者の脈動に連動して変化する血圧の時系列データから、予め定められた判定基準に基づいて血圧サージを検出する血圧サージ検出部と、
検出された上記血圧サージの特徴を表す特徴量を算出する特徴量算出部と、
複数の被験者について検出された上記血圧サージの発生回数および/または上記特徴量を統計処理して、上記被験者毎に統計量を算出する統計量算出部と、
上記血圧サージの発生回数および/または上記特徴量についての上記被験者毎の上記統計量に基づいて、血圧サージに関して注意すべき程度を表す要注意度を、上記被験者毎に求める要注意度算出部と、
表示画面上で、求められた上記要注意度および/または上記統計量を、上記被験者毎に並べて表示する処理を行う表示処理部とを備えたことを特徴とする血圧関連情報表示装置。 - 請求項11に記載の血圧関連情報表示装置において、
上記要注意度は、上記注意すべき程度に応じた複数の段階に区分され、上記複数の段階のそれぞれが、その段階に応じた特定色によって表されることを特徴とする血圧関連情報表示装置。 - 請求項12に記載の血圧関連情報表示装置において、
上記表示処理部は、
上記表示画面上で、各被験者に対応する閉領域を、横方向または縦方向に沿って並べて設定するとともに、
上記閉領域のそれぞれに、対応する被験者の上記要注意度に応じた上記特定色を付す
ことを特徴とする血圧関連情報表示装置。 - 請求項13に記載の血圧関連情報表示装置において、
上記表示処理部は、上記表示画面上で、上記複数の閉領域の上にそれぞれ上記統計量を表すグラフを重ねた状態で表示することを特徴とする血圧関連情報表示装置。 - 血圧サージに関連する情報を可視化して表示する血圧関連情報表示方法であって、
被験者の脈動に連動して変化する血圧の時系列データから、予め定められた判定基準に基づいて血圧サージを検出し、
検出された上記血圧サージの特徴を表す特徴量を算出し、
複数の被験者について検出された上記血圧サージの発生回数および/または上記特徴量を統計処理して、上記被験者毎に統計量を算出し、
上記血圧サージの発生回数および/または上記特徴量についての上記被験者毎の上記統計量に基づいて、血圧サージに関して注意すべき程度を表す要注意度を、上記被験者毎に求め、
表示画面上で、求められた上記要注意度および/または上記統計量を、上記被験者毎に並べて表示する処理を行うことを特徴とする血圧関連情報表示方法。 - 請求項10または15に記載の血圧関連情報表示方法をコンピュータに実行させるためのプログラム。
Priority Applications (3)
| Application Number | Priority Date | Filing Date | Title |
|---|---|---|---|
| CN202080024256.XA CN113631087B (zh) | 2019-03-25 | 2020-03-03 | 血压关联信息显示装置、血压关联信息显示方法以及存储介质 |
| DE112020001464.9T DE112020001464T5 (de) | 2019-03-25 | 2020-03-03 | Anzeigevorrichtung für blutdruckbezogene informationen, anzeigeverfahren für blutdruckbezogene informationen und programm |
| US17/482,297 US12186112B2 (en) | 2019-03-25 | 2021-09-22 | Blood pressure-related display device, blood pressure-related information display method, and computer-readable recording medium |
Applications Claiming Priority (2)
| Application Number | Priority Date | Filing Date | Title |
|---|---|---|---|
| JP2019056995A JP7253419B2 (ja) | 2019-03-25 | 2019-03-25 | 血圧関連情報表示装置、血圧関連情報表示方法、およびプログラム |
| JP2019-056995 | 2019-03-25 |
Related Child Applications (1)
| Application Number | Title | Priority Date | Filing Date |
|---|---|---|---|
| US17/482,297 Continuation US12186112B2 (en) | 2019-03-25 | 2021-09-22 | Blood pressure-related display device, blood pressure-related information display method, and computer-readable recording medium |
Publications (1)
| Publication Number | Publication Date |
|---|---|
| WO2020195618A1 true WO2020195618A1 (ja) | 2020-10-01 |
Family
ID=72610047
Family Applications (1)
| Application Number | Title | Priority Date | Filing Date |
|---|---|---|---|
| PCT/JP2020/008982 Ceased WO2020195618A1 (ja) | 2019-03-25 | 2020-03-03 | 血圧関連情報表示装置、血圧関連情報表示方法、およびプログラム |
Country Status (5)
| Country | Link |
|---|---|
| US (1) | US12186112B2 (ja) |
| JP (1) | JP7253419B2 (ja) |
| CN (1) | CN113631087B (ja) |
| DE (1) | DE112020001464T5 (ja) |
| WO (1) | WO2020195618A1 (ja) |
Families Citing this family (1)
| Publication number | Priority date | Publication date | Assignee | Title |
|---|---|---|---|---|
| WO2023203918A1 (ja) * | 2022-04-21 | 2023-10-26 | 株式会社村田製作所 | ガス濃度測定装置 |
Citations (6)
| Publication number | Priority date | Publication date | Assignee | Title |
|---|---|---|---|---|
| JP2016202346A (ja) * | 2015-04-17 | 2016-12-08 | セイコーエプソン株式会社 | 生体情報処理システム、生体情報処理装置及び解析結果情報の生成方法 |
| WO2017082107A1 (ja) * | 2015-11-10 | 2017-05-18 | オムロンヘルスケア株式会社 | 診断支援装置、診断支援方法、診断支援プログラム |
| WO2018002995A1 (ja) * | 2016-06-27 | 2018-01-04 | 富士通株式会社 | 生体リズムの検出装置、検出方法、及び、検出プログラム |
| JP2018149173A (ja) * | 2017-03-14 | 2018-09-27 | オムロン株式会社 | 情報処理装置および情報処理プログラム |
| JP2018149183A (ja) * | 2017-03-14 | 2018-09-27 | オムロンヘルスケア株式会社 | 血圧データ処理装置、血圧データ処理方法、およびプログラム |
| JP2018153269A (ja) * | 2017-03-15 | 2018-10-04 | オムロンヘルスケア株式会社 | 血圧測定装置、方法及びプログラム |
Family Cites Families (8)
| Publication number | Priority date | Publication date | Assignee | Title |
|---|---|---|---|---|
| CN101554322B (zh) * | 2008-04-09 | 2012-07-04 | 陈敦金 | 产科危重症患者病情评估系统 |
| CN103077301A (zh) * | 2012-12-24 | 2013-05-01 | 浙江大学医学院附属邵逸夫医院 | 代谢综合征组分积聚预测亚临床心血管病变的方法 |
| EP3281012A1 (en) * | 2015-04-09 | 2018-02-14 | Koninklijke Philips N.V. | Device, system and method for detecting illness- and/or therapy-related fatigue of a person |
| JP6508473B2 (ja) | 2015-08-31 | 2019-05-08 | 東芝ライテック株式会社 | 照明器具 |
| JP6548522B2 (ja) | 2015-08-31 | 2019-07-24 | カルソニックカンセイ株式会社 | 吸着器の作製方法 |
| JP6680155B2 (ja) | 2016-09-12 | 2020-04-15 | オムロンヘルスケア株式会社 | 血圧測定装置、血圧測定装置の制御方法およびプログラム |
| CN106599542A (zh) * | 2016-11-11 | 2017-04-26 | 中南大学 | 一种老年人综合能力评估方法和评估系统 |
| JP6766708B2 (ja) * | 2017-03-15 | 2020-10-14 | オムロンヘルスケア株式会社 | 情報処理装置、方法及びプログラム |
-
2019
- 2019-03-25 JP JP2019056995A patent/JP7253419B2/ja active Active
-
2020
- 2020-03-03 CN CN202080024256.XA patent/CN113631087B/zh active Active
- 2020-03-03 WO PCT/JP2020/008982 patent/WO2020195618A1/ja not_active Ceased
- 2020-03-03 DE DE112020001464.9T patent/DE112020001464T5/de active Pending
-
2021
- 2021-09-22 US US17/482,297 patent/US12186112B2/en active Active
Patent Citations (6)
| Publication number | Priority date | Publication date | Assignee | Title |
|---|---|---|---|---|
| JP2016202346A (ja) * | 2015-04-17 | 2016-12-08 | セイコーエプソン株式会社 | 生体情報処理システム、生体情報処理装置及び解析結果情報の生成方法 |
| WO2017082107A1 (ja) * | 2015-11-10 | 2017-05-18 | オムロンヘルスケア株式会社 | 診断支援装置、診断支援方法、診断支援プログラム |
| WO2018002995A1 (ja) * | 2016-06-27 | 2018-01-04 | 富士通株式会社 | 生体リズムの検出装置、検出方法、及び、検出プログラム |
| JP2018149173A (ja) * | 2017-03-14 | 2018-09-27 | オムロン株式会社 | 情報処理装置および情報処理プログラム |
| JP2018149183A (ja) * | 2017-03-14 | 2018-09-27 | オムロンヘルスケア株式会社 | 血圧データ処理装置、血圧データ処理方法、およびプログラム |
| JP2018153269A (ja) * | 2017-03-15 | 2018-10-04 | オムロンヘルスケア株式会社 | 血圧測定装置、方法及びプログラム |
Also Published As
| Publication number | Publication date |
|---|---|
| JP7253419B2 (ja) | 2023-04-06 |
| US12186112B2 (en) | 2025-01-07 |
| JP2020156608A (ja) | 2020-10-01 |
| DE112020001464T5 (de) | 2021-12-09 |
| CN113631087B (zh) | 2024-06-25 |
| CN113631087A (zh) | 2021-11-09 |
| US20220008023A1 (en) | 2022-01-13 |
Similar Documents
| Publication | Publication Date | Title |
|---|---|---|
| JP5584413B2 (ja) | 患者監視システム及び監視する方法 | |
| US12243649B2 (en) | Physiological parameter monitoring system | |
| US9936882B2 (en) | Blood pressure monitor coordinated with a cardiovascular health condition monitoring module | |
| US9504400B2 (en) | Atrial fibrillation analyzer, atrial fibrillation analysis system, atrial fibrillation analysis method, and program | |
| US20120197146A1 (en) | Methods, systems, and monitoring devices for managing hemodynamic parameters | |
| US12029590B2 (en) | Blood pressure surge pattern detection system | |
| CN106604674A (zh) | 用于控制缺血监测ecg算法的用户反馈 | |
| US20190387979A1 (en) | Blood pressure measurement apparatus, method, and program | |
| JP6645190B2 (ja) | 診断支援装置、診断支援方法、及び、診断支援プログラム | |
| CN121054245A (zh) | 一种基于多维度分析的胸外科术后并发症评估方法及系统 | |
| JP5296392B2 (ja) | 自己組織化マップを用いた健康状態判定支援システム及び自己組織化マップ生成システム | |
| JP7253419B2 (ja) | 血圧関連情報表示装置、血圧関連情報表示方法、およびプログラム | |
| JP6668606B2 (ja) | 生体情報処理システム、生体情報処理装置及び解析結果情報の生成方法 | |
| JP2020156608A5 (ja) | ||
| US10327648B2 (en) | Blood vessel mechanical signal analysis | |
| WO2020170826A1 (ja) | 血圧関連情報処理装置、血圧関連情報処理方法、およびプログラム | |
| US12575748B2 (en) | Blood pressure-related information display device, blood pressure-related information display method, and a non-transitory computer- readable computer medium | |
| JP7405654B2 (ja) | 容態情報生成装置、コンピュータプログラムおよび非一時的コンピュータ可読媒体 | |
| CN106691417B (zh) | 具有心率分析模块的血压计 | |
| WO2020195615A1 (ja) | 血圧関連情報表示装置、血圧関連情報表示方法、およびプログラム | |
| JP2020156609A5 (ja) | ||
| US20250281095A1 (en) | Method and apparatus for determining abnormal cardiac conditions non-invasively | |
| JP2024143139A (ja) | 聴診装置およびこれを備えた聴診システム、聴診方法、聴診プログラム | |
| WO2021049378A1 (ja) | 判定アルゴリズムを生成する方法、判定アルゴリズム、判定システム、判定方法、プログラム、および記録媒体 |
Legal Events
| Date | Code | Title | Description |
|---|---|---|---|
| 121 | Ep: the epo has been informed by wipo that ep was designated in this application |
Ref document number: 20776411 Country of ref document: EP Kind code of ref document: A1 |
|
| 122 | Ep: pct application non-entry in european phase |
Ref document number: 20776411 Country of ref document: EP Kind code of ref document: A1 |