WO2020170546A1 - 水質計、分析ユニットおよびフローセル - Google Patents
水質計、分析ユニットおよびフローセル Download PDFInfo
- Publication number
- WO2020170546A1 WO2020170546A1 PCT/JP2019/047089 JP2019047089W WO2020170546A1 WO 2020170546 A1 WO2020170546 A1 WO 2020170546A1 JP 2019047089 W JP2019047089 W JP 2019047089W WO 2020170546 A1 WO2020170546 A1 WO 2020170546A1
- Authority
- WO
- WIPO (PCT)
- Prior art keywords
- detection
- channel
- flow
- acquisition device
- image acquisition
- Prior art date
- Legal status (The legal status is an assumption and is not a legal conclusion. Google has not performed a legal analysis and makes no representation as to the accuracy of the status listed.)
- Ceased
Links
Images










Classifications
-
- G—PHYSICS
- G01—MEASURING; TESTING
- G01N—INVESTIGATING OR ANALYSING MATERIALS BY DETERMINING THEIR CHEMICAL OR PHYSICAL PROPERTIES
- G01N21/00—Investigating or analysing materials by the use of optical means, i.e. using sub-millimetre waves, infrared, visible or ultraviolet light
- G01N21/01—Arrangements or apparatus for facilitating the optical investigation
- G01N21/03—Cuvette constructions
- G01N21/05—Flow-through cuvettes
-
- G—PHYSICS
- G01—MEASURING; TESTING
- G01N—INVESTIGATING OR ANALYSING MATERIALS BY DETERMINING THEIR CHEMICAL OR PHYSICAL PROPERTIES
- G01N21/00—Investigating or analysing materials by the use of optical means, i.e. using sub-millimetre waves, infrared, visible or ultraviolet light
- G01N21/01—Arrangements or apparatus for facilitating the optical investigation
- G01N21/13—Moving of cuvettes or solid samples to or from the investigating station
-
- G—PHYSICS
- G01—MEASURING; TESTING
- G01N—INVESTIGATING OR ANALYSING MATERIALS BY DETERMINING THEIR CHEMICAL OR PHYSICAL PROPERTIES
- G01N21/00—Investigating or analysing materials by the use of optical means, i.e. using sub-millimetre waves, infrared, visible or ultraviolet light
- G01N21/17—Systems in which incident light is modified in accordance with the properties of the material investigated
- G01N21/59—Transmissivity
-
- G—PHYSICS
- G01—MEASURING; TESTING
- G01N—INVESTIGATING OR ANALYSING MATERIALS BY DETERMINING THEIR CHEMICAL OR PHYSICAL PROPERTIES
- G01N33/00—Investigating or analysing materials by specific methods not covered by groups G01N1/00 - G01N31/00
- G01N33/18—Water
-
- G—PHYSICS
- G01—MEASURING; TESTING
- G01N—INVESTIGATING OR ANALYSING MATERIALS BY DETERMINING THEIR CHEMICAL OR PHYSICAL PROPERTIES
- G01N21/00—Investigating or analysing materials by the use of optical means, i.e. using sub-millimetre waves, infrared, visible or ultraviolet light
- G01N21/75—Systems in which material is subjected to a chemical reaction, the progress or the result of the reaction being investigated
- G01N21/77—Systems in which material is subjected to a chemical reaction, the progress or the result of the reaction being investigated by observing the effect on a chemical indicator
- G01N21/78—Systems in which material is subjected to a chemical reaction, the progress or the result of the reaction being investigated by observing the effect on a chemical indicator producing a change of colour
Definitions
- the present invention relates to a water quality meter, an analysis unit and a flow cell.
- Non-Patent Document 1 a treatment liquid colored by mixing sample water and an analytical reagent in a micro reaction channel is sent to a flow cell, and the flow cell is irradiated with light, and the flow cell is irradiated.
- a water quality meter that measures the concentration of a substance in water by receiving light at a light receiving unit and calculating the transmittance or the absorbance from the intensity of the received light.
- Patent Document 1 describes a flow cell that suppresses the spread of a chromatogram in a liquid chromatograph and the deterioration of analysis accuracy.
- the flow cell described in Patent Document 1 has a detection unit that is irradiated with detection light, an inflow unit that allows the sample to flow into the detection unit in a direction different from the flow direction of the sample in the detection unit, and a flow direction of the sample in the detection unit.
- An outflow section for outflowing the sample from the detection section in different directions is provided, and the irradiation direction of the detection light and the flow direction of the sample in the detection section are parallel.
- the flow cell has a flow path in which the outflow part flows out the sample from the detection part in a plurality of directions.
- the inflow portion is composed of a flow path that branches once before the detection portion and merges in the detection portion, and the inflow position in the detection portion is a point with respect to the center of the end face of the detection portion. It is symmetric, and it is described that the inflow direction to the detection unit does not intersect the center of the end face of the detection unit. Further, Patent Document 1 describes that, due to this structure, a swirl flow is generated by a jet flow that flows into the detection unit from the inflow passage.
- Patent Document 1 describes a flow cell in which a swirl flow is generated by a jet flow flowing into the detection unit from the inflow passage. According to the invention described in Patent Document 1, that is, by generating a swirl flow in the flow cell, it is possible to remove bubbles at the swirl flow generation site.
- the flow stays in a place other than the swirling flow, and the bubbles in the staying place cannot be removed. Therefore, in the invention described in Patent Document 1, although the bubbles in the flow cell are removed to some extent by the swirling flow, the bubbles in the stagnant portion of the flow may not be removed, and measurement noise may remain. There was room for improvement.
- the present invention has been made in view of the above circumstances, and an object thereof is to provide a water quality meter, an analysis unit, and a flow cell in which measurement noise due to bubbles mixed in the flow cell is reduced.
- the water quality meter according to the present invention which has solved the above-mentioned problems, has a detection flow channel that allows a solution to flow therethrough, a light source that is provided in a part of the detection flow channel, and illuminates light in the detection flow channel, and the detection flow channel.
- An analysis unit including a flow cell having an image acquisition device that is provided to face the light source in a part of the path and receives light from the light source to measure at least one of the transmittance and the absorbance of the solution.
- the image acquisition device acquires a cross-sectional image of the detection channel and divides the cross-sectional image into a plurality of regions.
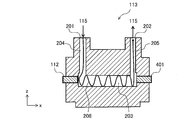
- FIG. 2B is a cross-sectional view taken along the line AA in one aspect of the flow cell shown in FIG. 2A.
- FIG. 2B is a cross-sectional view taken along the line AA in another aspect of the flow cell shown in FIG. 2A.
- FIG. 2B is a cross-sectional view taken along line AA in yet another aspect of the flow cell shown in FIG. 2A.
- FIG. 2B is an AA cross-sectional view of one aspect of the flow cell shown in FIG. 2A and is an explanatory diagram illustrating a flow of a processing liquid.
- FIG. 3B is a cross-sectional view taken along the line BB of the flow cell shown in FIG. 2B, illustrating the flow of the processing liquid. It is a flow chart at the time of measurement by the analysis unit when bubbles are present in the detection channel.
- FIG. 6 is a schematic diagram showing a case where a designated specific region has bubbles in a cross-sectional image of a detection channel having bubbles.
- FIG. 9 is a schematic diagram showing a case where a specified specific region does not have bubbles in a cross-sectional image of a detection channel having bubbles.
- FIG. 3B is a cross-sectional view taken along the line BB in the aspect of the flow cell shown in FIG. 2B.
- FIG. 6B is a sectional view taken along line CC of the flow cell shown in FIG. 6A. It is a longitudinal cross-sectional view showing the inside of the flow cell before removal of air bubbles. It is a longitudinal cross-sectional view showing the inside of the flow cell during removal of bubbles. It is a longitudinal cross-sectional view which shows the inside of the flow cell which performs the next measurement, after removing air bubbles.
- FIG. 7A It is a schematic block diagram which shows the state of the valve of a water quality meter for setting it as the state shown to FIG. 7A. It is a schematic block diagram which shows the state of the valve of a water quality meter for setting it as the state shown in FIG. 7B. It is a schematic block diagram which shows the state of the valve of a water quality meter for setting it as the state shown in FIG. 7C.
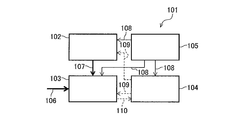
- FIG. 1A is a schematic configuration diagram illustrating the configuration of the water quality meter 101 according to the first embodiment.
- FIG. 1B is a schematic configuration diagram illustrating the configuration of the analysis unit 103 shown in FIG. 1A.
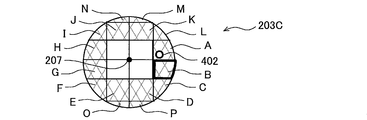
- FIG. 1C is an explanatory diagram illustrating an example in which the cross-sectional image 203C of the detection flow channel 203 acquired by the image acquisition device 401 illustrated in FIG. 1B is divided into a plurality of areas A to T.
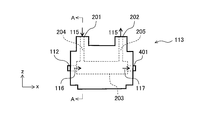
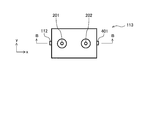
- FIG. 2A is a schematic side view illustrating the configuration of the flow cell 113 included in the analysis unit 103.
- FIG. 2B is a schematic plan view illustrating the configuration of the flow cell 113 included in the analysis unit 103. It should be noted that FIGS. 2A and 2B more specifically illustrate the flow cell 113 schematically illustrated in FIG. 1B.
- the water quality meter 101 has a reagent unit 102, an analysis unit 103, a communication control unit 104, and a power supply unit 105. These units are detachably connected, and any of them can be replaced with a new unit as needed.
- the water quality meter 101 includes a flow cell 113 (see FIGS. 1B, 2A and 2B) in the analysis unit 103.
- the flow cell 113 has a detection channel 203 for allowing the solution to flow therethrough, as shown in FIGS. 1B and 2A. Further, the flow cell 113 is provided in a part of the detection flow channel 203, and includes a light source 112 for irradiating the detection flow channel 203 with light (incident light 116 having a predetermined wavelength arbitrarily selected according to the substance to be measured). Have Further, the flow cell 113 is provided so as to face the light source 112 in a part of the detection channel 203, and receives light from the light source 112 and at least one of the transmittance and the absorbance of the solution (simply referred to as “transmission in this specification”).
- the image acquisition device 401 has a function of measuring an image acquisition device 401.
- the image acquisition device 401 acquires a cross-sectional image 203C (see FIG. 1C) of the detection flow channel 203 and divides the cross-sectional image 203C into a plurality of areas A to T. It is preferable that the above-mentioned transmittance and the like be measured for each image in the regions A to T.
- the flow cell 113 has a flow cell inlet 201 for injecting a treatment liquid 115 formed by mixing the sample water 106 and the analytical reagent 107, and for discharging the treatment liquid 115.
- the flow cell 113 has an inflow passage 204 between the flow cell inlet 201 and the detection flow passage 203, and an outflow passage 205 between the detection flow passage 203 and the flow cell outlet 202.
- the inflow passage 204 is provided at a right angle to the detection passage 203
- the outflow passage 205 is in the same direction as the inflow passage 204
- the detection passage It is provided at a right angle to 203. That is, the inflow channel 204 and the outflow channel 205 are provided so as to be orthogonal to the detection channel 203.
- the reagent unit 102 is filled with an analysis reagent 107 for measuring the substance to be measured in the sample water 106 in an amount that can be analyzed multiple times.
- the sample water 106 for example, various water such as tap water, sewage, reclaimed water, water for temperature control, water for agricultural use, regardless of the attribute, characteristics, origin of the water, and the like.
- substances to be measured include chlorine, carbon dioxide, sodium chlorite, free cyanide, total cyanide, hexavalent chromium, total chromium, iron, divalent iron, trivalent iron, hydrogen peroxide, manganese, nickel.
- any commercially available reagent for measuring the substance to be measured can be used.
- the analysis unit 103 includes a mixing section 118 including a micro flow channel 111 for mixing the sample water 106 and the analysis reagent 107, and a reaction including a micro flow channel 111 for developing a color of the mixed solution. It has a section 119 and an analysis section 120 having the flow cell 113 connected to the microchannel 111 of the reaction section 119. That is, the micro flow channel 111 is a flow channel through which the treatment liquid 115 in which the sample water 106 and the analysis reagent 107 are mixed and reacted is passed.
- the representative length of the channel diameter that is, the width or diameter of the channel is 2 mm or less.
- the representative length of the channel diameter is preferably in the range of several tens ⁇ m to 1 mm.
- the image acquisition device 401 in the present embodiment receives the light (incident light 116) from the light source 112 to measure the transmittance of the solution and the like, and at the same time, the cross-sectional image 203C of the detection channel 203 (FIG. 1C), and the sectional image 203C is divided into a plurality of areas A to T.
- the areas A to T can be obtained by dividing the cross-sectional image 203C with a predetermined pixel group. By doing so, the transmitted light 117 can be photographed for each image group of the regions A to T, and the transmittance of the transmitted light 117 and the like can be measured. Then, at this time, in the areas A to T in which the bubble 402 (see FIG. 1C) exists, the data such as the transmittance can not be adopted. That is, it is possible to adopt the data such as the transmittance for the region where the bubble 402 does not exist. Therefore, the water quality meter 101 that employs the image acquisition device 401 according to the present embodiment can reduce measurement noise caused by the bubbles 402 mixed in the flow cell 113. Note that FIG. 1C shows an example in which the bubble 402 exists in the area A.
- the presence or absence of the bubble 402 in the region is analyzed by analyzing the captured images of the regions A to T, and a dark ring-shaped portion caused by the interface between the bubble 402 and the solution or a circular color caused by the bubble 402 is detected. This can be done by checking the presence or absence of the thinned part.
- a CMOS (Complementary Metal Oxide Semiconductor) image sensor, a CCD (Charge Coupled Device) image sensor, or the like can be used, but the image acquisition device 401 is not limited thereto.
- Both ends of the detection channel 203 are transparent so that light (incident light 116 and transmitted light 117) can be transmitted, and the incident light 116 emitted from the light source 112 passes through the treatment liquid 115 of the detection channel 203. After that, the image acquisition device 401 can receive the transmitted light 117. That is, the length of the detection channel 203 becomes the optical path length. Therefore, as the length is increased, it becomes possible to measure even a solution having a low concentration of the substance to be measured, and the measurement accuracy is improved. However, if the length of the detection channel 203 is increased, the inner volume of the detection channel 203 increases, and the amount of the analysis reagent 107 to be used and the amount of the processing liquid 115 to be a waste liquid increase.
- the representative length of the cross section of the detection channel 203 of the flow cell 113 that is, the width and diameter of the cross section perpendicular to the optical path passing through the detection channel 203 is 2 mm or less.
- the length (optical path length) is preferably in the range of 10 to 50 mm.
- the analysis unit 103 transmits the images of the areas A to T thus obtained and various data 110 such as the transparency captured by the image acquisition device 401 to the communication control unit 104 (see FIG. 1A).
- the communication control unit 104 receives, from the analysis unit 103, various data 110 such as the images of the areas A to T and the transparency described above. Although not shown in FIG. 1A for signals and the like, the communication control unit 104 transmits/receives various signals and data to/from the outside and controls 109 the reagent unit 102 and the analysis unit 103.
- the power supply unit 105 includes appropriate means for supplying power such as a battery, an AC power supply, and a DC power supply, and supplies power to the reagent unit 102, the analysis unit 103, and the communication control unit 104, as shown in FIG. 1A.
- the water quality meter 101 having the configuration described above is used as follows. First, as shown in FIGS. 1A and 1B, the sample water 106 to be measured and the analysis reagent 107 for one analysis are introduced from the reagent unit 102 into the analysis unit 103.
- the sample water 106 may be introduced into the analysis unit 103 by various pumps such as a syringe pump and a peristaltic pump, or may be branched into a water pipe or the like and introduced into the analysis unit 103. Further, the sample water 106 may be introduced into the analysis unit 103 after being branched from a water pipe or the like and then subjected to flow rate control with a valve (not shown).
- the analysis reagent 107 may be introduced from the reagent unit 102 to the analysis unit 103 by various pumps such as a syringe pump and a peristaltic pump.
- the analysis reagent 107 is provided with a reagent pack (not shown) in which the analysis reagent 107 is filled in an amount capable of being analyzed a plurality of times in the reagent unit 102, and a sample is provided between the housing of the reagent unit 102 and the reagent pack.
- the water 106 may be introduced and the pressure thereof may be introduced from the reagent unit 102 (from the reagent pack) into the analysis unit 103.
- a valve (not shown) is installed at the mouth of the reagent pack, and this valve is opened for a certain period of time so that a certain amount of the analytical reagent 107 can be discharged.
- the sample water 106 introduced into the reagent unit 102 for pressurizing the reagent pack may be subsequently introduced into the analysis unit 103 as the sample water 106. This makes it possible to serve both as a means for introducing the sample water 106 and a means for pressurizing the analytical reagent 107.
- the communication control unit 104 operates a pump (not shown) and opens/closes a valve (not shown).
- the sample water 106 and the analysis reagent 107 introduced into the analysis unit 103 are mixed in the microchannel 111 of the mixing unit 118, and then the measurement target substance contained in the sample water 106 and the analysis reagent 107 react with each other.
- the reaction occurs in the micro flow channel 111 of the part 119 to develop color.
- the treatment liquid 115 thus obtained is introduced into the detection channel 203 of the flow cell 113 of the analysis unit 120, flows through, and then is discharged from the flow cell 113.
- Incident light 116 emitted from the light source 112 passes through the colored treatment liquid 115 and becomes transmitted light 117.
- the transmitted light 117 is received by the image acquisition device 401, the transmittance and the like are measured, and the data 110 is obtained.
- the image acquisition device 401 acquires a cross-sectional image 203C of the detection flow path 203 and divides the cross-sectional image 203C into a plurality of areas A to T.
- the data 110 described above may be data obtained by converting the measured transmittance and the like into concentration in the analysis unit 103 based on a calibration curve. The conversion to the concentration based on this calibration curve can also be performed by the communication control unit 104.
- the water quality meter 101 can not adopt the data such as the transmittance with respect to the image in which the bubbles 402 exist in the regions A to T.
- the water quality meter 101 according to the present embodiment has the above-described image acquisition device 401, and does not adopt the regions A to T in which the bubbles 402 exist, that is, relates to such regions A to T. Data such as transparency can be omitted. Therefore, the water quality meter 101 can reduce measurement noise derived from the bubbles 402 mixed in the flow cell 113.
- FIG. 3A is a cross-sectional view taken along the line AA in one mode of the flow cell 113 shown in FIG. 2A.
- FIG. 3B is a cross-sectional view taken along the line AA in another aspect of the flow cell 113 shown in FIG. 2A.
- FIG. 3C is a cross-sectional view taken along the line AA in yet another aspect of the flow cell 113 shown in FIG. 2A.
- FIG. 4A is an AA cross-sectional view of one aspect of the flow cell 113 shown in FIG.
- FIG. 4B is a BB cross-sectional view of one aspect of the flow cell 113 shown in FIG. 2B and is an explanatory diagram illustrating the flow of the processing liquid 115.
- the flow cell 113 has the upstream side when the light source 112 side of the detection channel 203 is the upstream side and the image acquisition device 401 side of the detection channel 203 is the downstream side. It is preferable that an inflow passage 204 having a diameter smaller than that of the detection passage 203 is provided at the end portion. By doing so, the momentum of the solution (treatment liquid 115) when being introduced from the inflow channel 204 into the detection channel 203 can be increased. Thereby, when the bubble 402 is present in the detection flow channel 203, the bubble 402 can be swept to the downstream side and easily discharged from the outflow flow channel 205. Therefore, the measurement noise derived from the bubbles 402 mixed in the flow cell 113 can be further reduced.
- the central axis 206 of the inflow channel 204 and the central axis 207 of the detection channel 203 are displaced from each other in the connecting portion connected to the detection channel 203. It is preferably provided. In this way, since the central axis 206 of the inflow channel 204 and the central axis 207 of the detection channel 203 are deviated from each other, the treatment liquid 115 is introduced so as to wrap around along the wall surface of the detection channel 203, as shown in FIG. And, the swirling flow 208 as shown in FIG. 4B is obtained. As shown in FIG.
- this swirl flow 208 is generated from the upstream side to the downstream side of the detection flow passage 203, and in the detection flow passage 203, the flow in the vicinity of the wall surface of the detection flow passage 203 is relatively greater than in the vicinity of the central axis 207. Get faster. Due to the action of the swirling flow 208, the bubbles 402 existing in the vicinity of the wall surface of the detection flow channel 203 are flowed to the downstream side of the detection flow channel 203, further to the outflow flow channel 205, and are discharged from the flow cell outlet 202.
- the flow is slow in the vicinity of the central axis 207 in the flow direction of the detection flow path 203, it is difficult for the bubbles 402 existing at this location to flow to the downstream side. Therefore, when the swirling flow 208 is generated, the bubbles 402 remain only near the central axis 207 in the flow direction of the detection flow path 203. Therefore, by preferentially acquiring the images in the vicinity of the wall surface of the detection flow channel 203 in the areas A to T acquired by the image acquisition device 401, the transmittance of the treatment liquid 115 and the like can be more preferably measured.
- the inclination angle ⁇ of the central axis 206 of the inflow channel 204 with respect to the central axis 207 of the detection channel 203 is preferably larger than 0° and smaller than 90°. Also in this case, since the central axis 206 of the inflow channel 204 and the central axis 207 of the detection channel 203 are deviated, a swirling flow 208 as shown in FIGS. 4A and 4B is obtained. Therefore, similarly to the above, the bubble 402 remains only near the central axis 207 in the flow direction of the detection flow path 203. Therefore, by preferentially acquiring the images in the vicinity of the wall surface of the detection flow channel 203 in the areas A to T acquired by the image acquisition device 401, the transmittance of the treatment liquid 115 and the like can be more preferably measured.
- the wall surface 204y at the end in the y-axis direction (diameter direction) on the downstream side of the inflow channel 204 is the y-axis direction of the detection channel 203 ( It is preferably connected so as to be in contact with the wall surface 203y at the end (diameter direction). That is, assuming that the wall surface 203y of the detection channel 203 in FIG. 3A is a circle and the wall surface 204y of the inflow channel 204 is a straight line, this straight line is a tangent line passing through one point of the circle, It is preferable to connect the wall surface 203y and the wall surface 204y.
- the connection between the inflow channel 204 and the detection channel 203 is in the negative direction ( ⁇ ) of the y axis of the detection channel 203, but may be in the positive direction (+) of the y axis.
- the wall surface 203y at the end of the detection flow path 203 in the y-axis direction is connected to the wall surface 204y at the end of the inflow flow path 204 in the y-axis direction, a swirling flow 208 is generated, and thus, as described above, bubbles 402 remains only near the central axis 207 in the flow direction of the detection channel 203. Therefore, by preferentially acquiring the images in the vicinity of the wall surface of the detection flow channel 203 in the areas A to T acquired by the image acquisition device 401, the transmittance of the treatment liquid 115 and the like can be more preferably measured.
- the measurement noise may occur in the vicinity of the central axis 207 due to the bubbles 402 remaining in the vicinity of the central axis 207 in the flow direction of the detection flow channel 203 described above, but in such a case, in the analysis unit 103. It is preferable to perform the processing described later (this processing will be described later with reference to FIG. 5A).
- FIG. 3A shows a state where the inclination angle ⁇ is obtained by bending the inflow passage 204 halfway.
- the inflow passage 204 may be a straight pipe, and the inflow passage 204 may be inclined at an inclination angle ⁇ from the upstream side.
- the inflow passage 204 is not straightened and is a straight pipe, and the central axis 206 of the inflow passage 204 and the central axis 207 of the detection flow passage 203 are provided so as to be displaced from each other, so that the distance t May be spaced.
- the wall surface 204y at the end of the inflow passage 204 in the y-axis direction may be connected to the wall surface 203y at the end of the detection passage 203 in the y-axis direction.
- the distance t may be set to a value at which the wall surface 204y at the end of the inflow channel 204 in the y-axis direction contacts the wall surface 203y at the end of the detection channel 203 in the y-axis direction. That is, when the wall surface 203y of the detection flow channel 203 in FIGS.
- 3B and 3C is assumed to be a circle and the wall surface 204y of the inflow flow channel 204 is assumed to be a straight line, this straight line becomes a tangent line passing through one point on the circumference.
- the inflow channel 204 and the detection channel 203 are connected in the negative direction of the y-axis of the detection channel 203, but may be in the positive direction of the y-axis.
- a swirl flow 208 is formed.
- the measurement noise may occur in the vicinity of the central axis 207 due to the bubbles 402 remaining in the vicinity of the central axis 207 in the flow direction of the detection flow channel 203 described above, but in such a case, in the analysis unit 103. It is preferable to perform the processing described later (this processing will be described later with reference to FIG. 5A).
- FIG. 5A is a flowchart at the time of measurement by the analysis unit 103 when the air bubble 402 exists in the detection flow path 203.
- FIG. 5B is a schematic diagram showing a case where the specified specific region A has the bubbles 402 in the cross-sectional image 203C of the detection flow channel 203 having the bubbles 402.
- 5C is a schematic diagram showing a case where the specified specific region B does not have the bubble 402 in the cross-sectional image 203C of the detection flow channel 203 having the bubble 402.
- 5B and 5C show the case where the detection flow channel 203 has a circular cross-sectional shape, the detection flow channel 203 may have a rectangular cross-sectional shape or another shape.
- a cross-sectional image 203C (see FIG. 1C) of the detection channel 203 obtained by photographing the detection channel 203 using the image acquisition device 401 is captured in the analysis unit 103 (step S1).
- a region that is not near the central axis 207 (see FIG. 5B), that is, a portion near the wall surface where the bubbles 402 have been removed by the swirling flow 208 is, for example, the region A. , Region B, region C, region D,... And each region is divided (step S2).
- the region A is designated as a specific region from the plurality of divided regions (step S3), and the presence or absence of the bubble 402 in the region A is confirmed (step S4).
- the image acquisition device 401 measures the transmittance of the area A and the like (step S6).
- the acquisition device 401 specifies a region B different from the region A (step S7, see FIG.
- step S4 confirms the presence or absence of bubbles 402 in the region B.
- the image acquisition device 401 repeats this series of operations until the region without the bubble 402 is designated, and measures the transmittance and the like of the region without the bubble 402 (step S6).
- the swirling flow 208 causes the bubbles 402 to remain in the vicinity of the central axis 207 in the flow direction of the detection flow channel 203, causing measurement noise in the vicinity of the central axis 207. Therefore, it is also preferable that the region near the central axis 207 is not designated in advance. In this case, the processing is not performed on the area where the measurement noise is likely to occur, so that the processing speed can be increased and the data recording capacity can be reduced.
- the analysis unit 103 specifically, the image acquisition device 401 does not specify a region less than 1/2 from the center (central axis 207) in the radius of the detection channel 203. Can be mentioned.
- the image acquisition device 401 may specify a region outside the center (center axis 207) of 1/2 or more in the radius of the detection channel 203. In this aspect, it is more preferable that the image acquisition device 401 designates a region outside the center (center axis 207) of the radius of the detection flow channel 203 by 1 ⁇ 4 or more.
- the vicinity of the central axis 207 of the detection flow path 203 is not specified, and 16 areas A to P near the wall surface of the detection flow path 203 are specified. It is preferable to do so.
- the next treatment liquid 115 may be introduced into the flow cell 113 for the next measurement, or air may be introduced into the flow cell 113 to flush the bubbles 402, After that, the next measurement may be performed.
- 16 areas A to P are used, but the number of areas may be smaller or larger than this. The number of areas can be appropriately set according to the sensitivity of measurement such as the transmittance of the image acquisition device 401 and the area dividing performance.
- FIG. 6A is a cross-sectional view taken along the line BB in one mode of the flow cell 113 shown in FIG. 2B.
- FIG. 6B is a sectional view taken along line CC of the flow cell 113 shown in FIG. 6A.
- the side view and the plan view of the third embodiment are the same as FIGS. 2A and 2B shown in the first embodiment, respectively.
- the image acquisition device 401 measures the transmittance in the areas A to T or the areas A to P to calculate the concentration of the substance to be measured.
- the analysis unit 103 measures the transmittance and the like according to the flowchart shown in FIG. 5A.
- the bubble 402 (not shown in FIG. 6A) trapped in the gap 601 is removed by the removal operation of the bubble 402 after measuring the transmittance and the like.
- the operation of removing the bubbles 402 may be an operation of introducing air from the flow cell inlet 201 or the flow cell outlet 202 to push it away with the air.
- the inflow passage 204, the detection passage 203, and the outflow passage 205 of the flow cell 113 may have a structure for generating the swirl flow 208 shown in FIGS. 2A to 4B, or may not have a structure for generating the swirl flow 208. Good.
- the location where the bubble 402 is trapped is in the vicinity of the central axis 207 in the flow direction of the detection flow channel 203 and the gap 601, so that the bubble 402 becomes larger.
- the probability of being trapped at these points increases. Therefore, the probability that the bubble 402 does not exist in the regions A to P (see FIG. 5B) increases. Therefore, if these configurations are adopted, the measurement noise derived from the bubbles 402 mixed in the flow cell 113 can be further reduced.
- the water quality meter 101 according to the fourth embodiment is a preferred mode for removing the air bubbles 402 existing in the detection flow path 203. That is, in the fourth embodiment, the bubbles 402 existing inside the detection channel 203 of the flow cell 113 before the measurement are removed by sending the bubble removal reagent 802 before the measurement, and the next treatment after the removal of the bubbles. The liquid 115 is measured. As described above, by removing the bubbles 402 existing in the detection flow channel 203 in a timely manner, the measurement noise derived from the bubbles 402 mixed in the flow cell 113 can be further reduced.
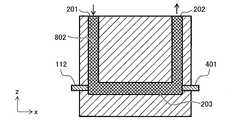
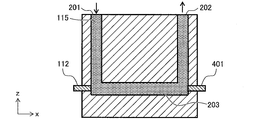
- FIG. 7A is a vertical cross-sectional view showing the inside of the flow cell 113 before removal of bubbles (when measuring the permeability and the like).
- FIG. 7B is a vertical cross-sectional view showing the inside of the flow cell 113 during bubble removal.
- FIG. 7C is a vertical cross-sectional view showing the inside of the flow cell 113 which is being subjected to the next measurement after removing the bubbles.
- the side view and the plan view of the fourth embodiment are the same as FIGS. 2A and 2B shown in the first embodiment, respectively.
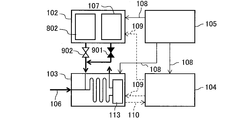
- FIG. 8A is a schematic configuration diagram showing the state of the valve of the water quality meter 101 for achieving the state shown in FIG. 7A.
- FIG. 8A is a schematic configuration diagram showing the state of the valve of the water quality meter 101 for achieving the state shown in FIG. 7A.
- FIG. 8B is a schematic configuration diagram showing the state of the valve of the water quality meter 101 to bring it into the state shown in FIG. 7B.
- FIG. 8C is a schematic configuration diagram showing the state of the valve of the water quality meter 101 to bring it into the state shown in FIG. 7C.
- the reagent unit 102 shown in the first embodiment is filled with a bubble removal reagent 802 in addition to the analysis reagent 107.
- the analysis reagent 107 in the reagent unit 102 is connected to the analysis unit 103 via the analysis reagent valve 901.
- the bubble removal reagent 802 in the reagent unit 102 is connected to the analysis unit 103 via the bubble removal reagent valve 902.
- the liquid feeding of each reagent in the analysis unit 103 is controlled by the opening/closing operation of these valves.
- the inside of the flow cell 113 before removal of bubbles is filled with the processing liquid 801 of the previous measurement, and the wall surfaces of the inflow channel 204, the detection channel 203, and the outflow channel 205 are respectively formed.
- the analysis reagent valve 901 and the bubble removal reagent valve 902 are closed.
- bubble removal reagent 802 is introduced from flow cell inlet 201, as shown in FIG. 7B, and inflow channel 204, detection channel 203, and The outflow channel 205 is filled with the bubble removal reagent 802.
- the bubbles 402 existing before the measurement can be removed.
- the treatment liquid 115 is introduced from the flow cell inlet 201 as shown in FIG.
- the inside of 113 that is, the inside of the inflow channel 204, the detection channel 203, and the outflow channel 205 is filled with the processing liquid 115, and the next measurement is performed.
- the bubble removal reagent 802 is introduced to remove the bubbles 402 existing in the inflow channel 204, the detection channel 203, and the outflow channel 205 before the measurement, and then the processing liquid 115 is sent, whereby the bubbles are removed.
- the measurement noise derived from 402 can be reduced more.
- the air bubble removing reagent 802 for example, a silicone antifoaming agent, an organic antifoaming agent and the like can be mentioned.
- the organic antifoaming agent include higher alcohols.
- examples of the bubble removing reagent 802 include a surfactant and a polyether. Note that the bubble removing reagent 802 is not limited to these, and any conventionally known one can be used as appropriate.
- the flow cell 113 may have a structure for generating the swirl flow 208 shown in FIGS. 3A to 4B, or may not have a structure for generating the swirl flow 208.
- the bubbles 402 near the wall surface of the detection channel 203 are removed, so the number of bubbles 402 is reduced, and the remaining bubbles 402 are also in the flow direction of the detection channel 203. Since it collects in the vicinity of the central axis 207, it becomes easier to remove the bubbles 402 with the bubble removing reagent 802 than in the case where the structure that generates the swirling flow 208 is not used, which is preferable.
- the analysis unit 103 is detachably connected to the reagent unit 102, the communication control unit 104, the power supply unit 105 and the like.
- the analysis unit 103 can be arbitrarily replaced when the flow cell 113 becomes dirty or when the microchannel 111 is clogged with a foreign substance or the like. That is, the analysis unit 103 is a replacement part in the water quality meter 101.
- the analysis unit 103 can be attached to and detached from the reagent unit 102, the communication control unit 104, the power supply unit 105 and the like via a conventionally known connector.
- the connector may be any one that can maintain liquid-tightness in the place where the solution flows, and any part that can maintain electrical connection in the place where the data 110, the power supply 108, and the control 109 are performed. ..
- the configuration of the analysis unit 103 used as a replacement part is the same as that shown in FIG. 1B. That is, as shown in FIG. 1B, the analysis unit 103 used as a replacement part is provided in a part of the detection flow channel 203 and the detection flow channel 203 through which the solution flows, and the light (incident light) enters the detection flow channel 203.
- a light source 112 for irradiating the light 116) and an image acquisition device 401 which is provided in a part of the detection flow path 203 so as to face the light source 112 and receives light from the light source 112 to measure the transmittance of the solution and the like.
- the flow cell 113 is included.
- the image acquisition device 401 included in the analysis unit 103 acquires the cross-sectional image 203C of the detection flow path 203 and divides the cross-sectional image 203C into a plurality of regions A to T. Therefore, as described above, the flow cell 113 according to the present embodiment can reduce the measurement noise caused by the bubbles 402 mixed in the flow cell 113. Also in this case, the flow cell 113 may have a structure that generates the swirl flow 208 shown in FIGS. 3A to 4B, or may not have a structure that generates the swirl flow 208. Moreover, since the configuration and effects of the analysis unit 103 have already been described in detail, the description thereof will be omitted.
- the flow cell 113 can also be detachably attached to the analysis unit 103. Therefore, the flow cell 113 can be arbitrarily replaced when the flow cell 113 becomes dirty or the light source 112 or the image acquisition device 401 fails. That is, the flow cell 113 is a replacement part in the analysis unit 103 and the water quality meter 101.
- the flow cell 113 can be attached/detached in/from the analysis unit 103 via a conventionally known connector.
- the connector may be any one that can maintain liquid-tightness in the place where the solution flows, and any part that can maintain electrical connection in the place where the data 110, the power supply 108, and the control 109 are performed. ..
- the flow cell 113 may be provided with a guide groove (not shown) or the like for positioning or the like when attaching and detaching.
- a guide protrusion (not shown) corresponding to the shape and size of the guide groove may be provided at the mounting position of the flow cell 113 in the analysis unit 103. In this way, the flow cell 113 can be easily and surely attached and detached.
- the configuration of the flow cell 113 used as a replacement part is similar to that shown in FIGS. 2A to 4B and FIGS. 6A to 7C. That is, as shown in FIGS. 2A to 4B and FIGS. 6A to 7C, the flow cell 113 used as a replacement part is provided in a detection flow channel 203 for allowing a solution to flow therethrough and a part of the detection flow channel 203.
- an image acquisition device 401 that does this.
- the image acquisition device 401 included in the flow cell 113 acquires the cross-sectional image 203C of the detection flow path 203 and divides the cross-sectional image 203C into a plurality of areas A to T. Therefore, as described above, the flow cell 113 according to the present embodiment can reduce the measurement noise caused by the bubbles 402 mixed in the flow cell 113.
- the flow cell 113 may have a structure for generating the swirl flow 208 shown in FIGS. 3A to 4B, or may not have a structure for generating the swirl flow 208. Further, since the configuration and effects of the flow cell 113 have already been described in detail, the description thereof will be omitted.
Landscapes
- Chemical & Material Sciences (AREA)
- Health & Medical Sciences (AREA)
- Life Sciences & Earth Sciences (AREA)
- Immunology (AREA)
- Analytical Chemistry (AREA)
- Biochemistry (AREA)
- General Health & Medical Sciences (AREA)
- General Physics & Mathematics (AREA)
- Physics & Mathematics (AREA)
- Pathology (AREA)
- Engineering & Computer Science (AREA)
- Food Science & Technology (AREA)
- Medicinal Chemistry (AREA)
- Optical Measuring Cells (AREA)
- Investigating Or Analysing Materials By The Use Of Chemical Reactions (AREA)
- Investigating Or Analysing Materials By Optical Means (AREA)
Abstract
フローセルに混入した気泡に由来する測定ノイズを低減した水質計、分析ユニットおよびフローセルを提供する。本発明に係る水質計(101)は、溶液を通流させる検出流路(203)と、前記検出流路(203)の一部に設けられ、前記検出流路(203)内に光を照射する光源(112)と、前記検出流路(203)の一部において前記光源(112)と対向して設けられ、前記光源(112)からの光を受けて前記溶液の透過度および吸光度のうちの少なくとも一方を測定する画像取得装置(401)と、を有するフローセル(113)を備えた分析ユニット(103)を有し、前記画像取得装置(401)は、前記検出流路(203)の断面画像(203C)を取得し、前記断面画像(203C)を複数の領域(A~T)に分割する。
Description
本発明は、水質計、分析ユニットおよびフローセルに関する。
工場や下水処理からの排水や油水分離した後の処理水中に含まれる重金属類、有機化合物、硝酸・亜硝酸などの検出に代表される水質検査が重要となってきている。例えば、非特許文献1には、マイクロ反応流路で試料水と分析用試薬を混合することにより発色させた処理液をフローセルへ送液し、光源からフローセルへ光を照射し、フローセルへ照射した光を受光部で受光し、受光した光の強度から透過度または吸光度を算出することにより、水中の物質の濃度を測定する水質計が記載されている。
一方、液体クロマトグラフにおけるクロマトグラムの拡がり、分析精度の低下を抑制するフローセルが、特許文献1に記載されている。この特許文献1に記載のフローセルは、検出光が照射される検出部と、検出部における試料の流れ方向と異なる方向に検出部に試料を流入させる流入部と、検出部における試料の流れ方向と異なる方向に検出部から試料を流出させる流出部とを備え、検出光の照射方向と検出部の試料の流れ方向が平行となっている。そして、このフローセルは、流出部が試料を検出部から複数方向へ流出する流路を有している。なお、特許文献1には、流入部は検出部の手前で一旦分岐し、検出部で合流する流路から構成されており、検出部における流入位置が、検出部の端面の中心に対して点対称であり、検出部への流入方向が、検出部の端面の中心と交差しない、と記載されている。さらに、特許文献1には、この構造により、流入路から検出部に流入する噴流によって旋回流を生じさせる、と記載されている。
戦略的創造研究推進事業CREST研究領域「持続可能な水利用を実現する革新的な技術とシステム」研究課題「モデルベースによる水循環系スマート水質モニタリング網構築技術の開発」研究終了報告書、第21頁、図25、URL:https://www.jst.go.jp/kisoken/crest/research/s-houkoku/sh_h27/JST_1111074_10101620_2015_PER.pdf
しかしながら、非特許文献1に記載された水質計では、フローセルに気泡が混入した場合、その気泡が光を反射するため、測定ノイズが発生してしまう。これに対し、前述の通り、特許文献1には、流入路から検出部に流入する噴流によって旋回流を生じさせるフローセルが記載されている。特許文献1に記載の発明により、すなわちフローセル中に旋回流を発生させることにより、旋回流発生箇所の気泡を除去することができる。しかし、特許文献1に記載の発明においては、旋回流以外の箇所は流れが滞留してしまい、その滞留箇所の気泡は除去することができない。したがって、特許文献1に記載の発明には、フローセル中の気泡は旋回流によりある程度は除去されるが、流れの滞留箇所の気泡は除去されず、測定ノイズが残ってしまうことがあり、この点に改善の余地があった。
本発明は前記状況に鑑みてなされたものであり、フローセルに混入した気泡に由来する測定ノイズを低減した水質計、分析ユニットおよびフローセルを提供することを課題とする。
前記課題を解決した本発明に係る水質計は、溶液を通流させる検出流路と、前記検出流路の一部に設けられ、前記検出流路内に光を照射する光源と、前記検出流路の一部において前記光源と対向して設けられ、前記光源からの光を受けて前記溶液の透過度および吸光度のうちの少なくとも一方を測定する画像取得装置と、を有するフローセルを備えた分析ユニットを有し、前記画像取得装置は、前記検出流路の断面画像を取得し、前記断面画像を複数の領域に分割する。
本発明によれば、フローセルに混入した気泡に由来する測定ノイズを低減した水質計、分析ユニットおよびフローセルを提供できる。
前述した以外の課題、構成および効果は、以下の実施形態の説明により明らかにされる。
前述した以外の課題、構成および効果は、以下の実施形態の説明により明らかにされる。
以下、図面を参照して、本発明の実施形態について説明する。なお、以下の説明において参照する図面は、実施形態を概略的に示したものであるため、各部材のスケールや間隔、位置関係などが誇張、変形、あるいは、部材の一部の図示が省略されている場合がある。また、平面図とその断面図において、各部材のスケールや間隔が一致しない場合もある。なお、以下の説明は本発明の内容の具体例を示すものであり、本発明はこれらの説明に限定されるものではなく、本明細書に開示される技術的思想の範囲内において当業者による様々な変更および修正が可能である。また、本発明を説明するための全図において、同一の機能を有するものは、同一の符号を付け、その繰り返しの説明は省略する場合がある。
本明細書に記載される「~」は、その前後に記載される数値を下限値および上限値として有する意味で使用する。本明細書に段階的に記載されている数値範囲において、一つの数値範囲で記載された上限値または下限値は、他の段階的に記載されている上限値または下限値に置き換えてもよい。
本明細書に記載される「~」は、その前後に記載される数値を下限値および上限値として有する意味で使用する。本明細書に段階的に記載されている数値範囲において、一つの数値範囲で記載された上限値または下限値は、他の段階的に記載されている上限値または下限値に置き換えてもよい。
(水質計101)
(第1実施形態)
図1Aは、第1実施形態に係る水質計101の構成を説明する概略構成図である。図1Bは、図1Aに示す分析ユニット103の構成を説明する概略構成図である。図1Cは、図1Bに示す画像取得装置401が取得した検出流路203の断面画像203Cを複数の領域A~Tに分割した一例を説明する説明図である。図2Aは、分析ユニット103が備えるフローセル113の構成を説明する概略側面図である。図2Bは、分析ユニット103が備えるフローセル113の構成を説明する概略平面図である。なお、図2Aおよび図2Bは、図1Bに概略的に示されているフローセル113をより具体的に図示したものである。
(第1実施形態)
図1Aは、第1実施形態に係る水質計101の構成を説明する概略構成図である。図1Bは、図1Aに示す分析ユニット103の構成を説明する概略構成図である。図1Cは、図1Bに示す画像取得装置401が取得した検出流路203の断面画像203Cを複数の領域A~Tに分割した一例を説明する説明図である。図2Aは、分析ユニット103が備えるフローセル113の構成を説明する概略側面図である。図2Bは、分析ユニット103が備えるフローセル113の構成を説明する概略平面図である。なお、図2Aおよび図2Bは、図1Bに概略的に示されているフローセル113をより具体的に図示したものである。
図1Aに示すように、水質計101は、試薬ユニット102と、分析ユニット103と、通信制御ユニット104と、電源ユニット105と、を有している。これらのユニットは着脱自在に接続されており、いずれも必要に応じて新しいユニットに交換することができる。そして、この水質計101は、分析ユニット103内にフローセル113(図1B、図2Aおよび図2B参照)を備えている。
そして、このフローセル113は、図1Bおよび図2Aに示すように、溶液を通流させる検出流路203を有している。また、フローセル113は、検出流路203の一部に設けられ、検出流路203内に光(測定対象物質に応じて任意に選定される所定の波長の入射光116)を照射する光源112を有している。さらに、フローセル113は、検出流路203の一部において光源112と対向して設けられ、光源112からの光を受けて溶液の透過度および吸光度のうちの少なくとも一方(本明細書において単に「透過度など」ということがある)を測定する画像取得装置401を有している。また、この画像取得装置401は、検出流路203の断面画像203C(図1C参照)を取得し、この断面画像203Cを複数の領域A~Tに分割する。なお、前記した透過度などは、領域A~Tの画像毎に測定されることが好ましい。
また、図2Aおよび図2Bに示すように、フローセル113は、試料水106と分析用試薬107とが混合してなる処理液115を注入するためのフローセル入口201と、処理液115を排出するためのフローセル出口202と、を有している。フローセル113は、フローセル入口201と検出流路203の間の流入流路204と、検出流路203とフローセル出口202の間の流出流路205と、を有している。本実施形態においては、図2Aに示すように、流入流路204は検出流路203に対して直角に設けられており、流出流路205は流入流路204と同じ方向に、かつ検出流路203に対して直角に設けられている。つまり、流入流路204および流出流路205は、検出流路203に対して直交するように設けられている。
試薬ユニット102には、試料水106中の測定対象物質を測定するための分析用試薬107が、複数回分析可能な量充填されている。
ここで、試料水106としては、例えば、上水、下水、再生水、温調用水、農業用水など、水の属性・特性・由来などを問わず様々な水が対象となる。
また、測定対象物質としては、例えば、塩素、二酸化炭素、亜塩素酸ナトリウム、遊離シアン、全シアン、6価クロム、全クロム、鉄、2価鉄、3価鉄、過酸化水素、マンガン、ニッケル、亜硝酸、亜硝酸態窒素、硝酸、硝酸態窒素、鉛、フェノール、全窒素、亜鉛、銅、ほう素、化学的酸素要求量、ホルムアルデヒド、過マンガン酸カリウム量、ヒ素、陰イオン界面活性剤、溶存酸素、アンモニウム、アンモニウム態窒素、りん酸、りん酸態りん、全りん、硫化物(硫化水素)、シリカ、カルシウム、遊離ふっ素、オゾン、塩化物、カリウム、土壌油分、硫酸などが挙げられるが、これらに限定されない。分析用試薬107は、前記した測定対象物質を測定するために市販されている任意の試薬を用いることができる。
ここで、試料水106としては、例えば、上水、下水、再生水、温調用水、農業用水など、水の属性・特性・由来などを問わず様々な水が対象となる。
また、測定対象物質としては、例えば、塩素、二酸化炭素、亜塩素酸ナトリウム、遊離シアン、全シアン、6価クロム、全クロム、鉄、2価鉄、3価鉄、過酸化水素、マンガン、ニッケル、亜硝酸、亜硝酸態窒素、硝酸、硝酸態窒素、鉛、フェノール、全窒素、亜鉛、銅、ほう素、化学的酸素要求量、ホルムアルデヒド、過マンガン酸カリウム量、ヒ素、陰イオン界面活性剤、溶存酸素、アンモニウム、アンモニウム態窒素、りん酸、りん酸態りん、全りん、硫化物(硫化水素)、シリカ、カルシウム、遊離ふっ素、オゾン、塩化物、カリウム、土壌油分、硫酸などが挙げられるが、これらに限定されない。分析用試薬107は、前記した測定対象物質を測定するために市販されている任意の試薬を用いることができる。
図1Bに示すように、分析ユニット103は、試料水106と分析用試薬107を混合させるためのマイクロ流路111からなる混合部118、混合した溶液を発色させるためのマイクロ流路111からなる反応部119、および反応部119のマイクロ流路111と接続された前記フローセル113を有する分析部120を有している。すなわち、マイクロ流路111は、試料水106と分析用試薬107とを混合して反応させた処理液115を通流させる流路である。
マイクロ流路111に関して、マイクロ反応場による効果を得るためには、流路径の代表長さ、すなわち流路の幅や直径は2mm以下にすることが好ましい。特に、試料水106と分析用試薬107を分子拡散により迅速に混合させるために、流路径の代表長さは数十μm~1mmの範囲が好ましい。これにより、使用する分析用試薬107の量、および廃液となる処理液115の量を大幅に減らすことができる。なお、マイクロ流路111の流路の長さは、測定対象物質と分析用試薬107とが混合して反応する時間を考慮し、適宜に設定することができる。
光源112は、水質計101や分光光度計などで従来用いられているものであればどのようなものも用いることができる。
そして、本実施形態における画像取得装置401は、前記したように、光源112からの光(入射光116)を受けて溶液の透過度などを測定するとともに、検出流路203の断面画像203C(図1C参照)を取得し、この断面画像203Cを複数の領域A~Tに分割する。
そして、本実施形態における画像取得装置401は、前記したように、光源112からの光(入射光116)を受けて溶液の透過度などを測定するとともに、検出流路203の断面画像203C(図1C参照)を取得し、この断面画像203Cを複数の領域A~Tに分割する。
領域A~Tは、断面画像203Cを所定の画素群で区分けすることでそれぞれ得ることができる。このようにすると、領域A~Tの画像群毎に透過光117を撮影し、透過光117の透過度などを測定することができる。そして、このとき、領域A~Tにおいて気泡402(図1C参照)が存在する領域については透過度などのデータを採用しないことができる。つまり、気泡402が存在していない領域についての透過度などのデータを採用することができる。したがって、本実施形態における画像取得装置401を採用する水質計101は、フローセル113に混入した気泡402に由来する測定ノイズを低減できる。なお、図1Cでは、領域Aに気泡402が存在している例を示している。
領域内の気泡402の有無は、撮影された領域A~Tの画像を解析して、気泡402と溶液の界面に起因する円環状の色の濃い部分や、気泡402に起因する円形の色が薄くなっている部分の有無を確認することで行うことができる。画像取得装置401としては、例えば、CMOS(Complementary Metal Oxide Semiconductor)イメージセンサやCCD(Charge Coupled Device)イメージセンサなどを用いることができるが、これらに限定されない。
検出流路203の両端は、光(入射光116や透過光117)を透過できるように透明となっており、光源112から照射された入射光116は、検出流路203の処理液115を通過した後、画像取得装置401で透過光117として受光できるようになっている。すなわち、検出流路203の長さが光路長となる。したがって、その長さを長くするほど測定対象物質の濃度が低い溶液でも測定できるようになり、測定精度が上がる。しかし、検出流路203の長さを長くすると、検出流路203の内容積が増えて、使用する分析用試薬107の量、および廃液となる処理液115の量が増える。したがって、フローセル113の検出流路203の断面の代表長さ、すなわち、検出流路203を透過する光路に対して垂直な断面の幅や直径は2mm以下であるのが好ましく、検出流路203の長さ(光路長)は10~50mmの範囲が好ましい。
分析ユニット103は、このようにして得られた領域A~Tの画像および画像取得装置401で撮影された透過度などの各種データ110を通信制御ユニット104(図1A参照)に送信する。
通信制御ユニット104は、前記した領域A~Tの画像および透過度などの各種データ110を分析ユニット103から受信する。なお、通信制御ユニット104は、信号等を図1Aに図示してはいないが、外部との各種の信号およびデータの送受信を行うとともに、試薬ユニット102および分析ユニット103の制御109を行う。
電源ユニット105は、バッテリ、交流電源、直流電源などの電源供給用の適宜の手段を備え、図1Aに示すように、試薬ユニット102、分析ユニット103、通信制御ユニット104に電源108を供給する。
以上に説明した構成を有する水質計101は次のように用いられる。
まず、図1Aおよび図1Bに示すように、分析ユニット103に、測定対象である試料水106と、試薬ユニット102内から分析1回分の分析用試薬107と、が導入される。
まず、図1Aおよび図1Bに示すように、分析ユニット103に、測定対象である試料水106と、試薬ユニット102内から分析1回分の分析用試薬107と、が導入される。
ここで、試料水106は、シリンジポンプやペリスタルティックポンプなどの各種ポンプで分析ユニット103に導入してもよいし、水道管などから分岐させて分析ユニット103に導入してもよい。また、試料水106は、水道管などから分岐させた後、バルブ(図示せず)で流量制御して分析ユニット103に導入してもよい。
分析用試薬107は、シリンジポンプやペリスタルティックポンプなどの各種ポンプによって試薬ユニット102から分析ユニット103に導入してもよい。
また、分析用試薬107は、試薬ユニット102内に分析用試薬107を複数回分析可能な量充填した試薬パック(図示せず)を設け、試薬ユニット102の筐体と試薬パックとの間に試料水106を導入し、その圧力で試薬ユニット102から(試薬パックから)分析ユニット103に導入するようにしてもよい。この場合、試薬パックの口にバルブ(図示せず)を設置し、このバルブを一定時間開放することにより、一定量の分析用試薬107を吐出させるようにすることができる。
試薬パックの加圧のために試薬ユニット102内に導入した試料水106は、引き続き、試料水106として分析ユニット103に導入してもよい。このようにすると、試料水106の導入手段と分析用試薬107の加圧手段とを兼ねることができる。
なお、図示しないポンプの運転や図示しないバルブの開閉は、通信制御ユニット104で行う。
分析用試薬107は、シリンジポンプやペリスタルティックポンプなどの各種ポンプによって試薬ユニット102から分析ユニット103に導入してもよい。
また、分析用試薬107は、試薬ユニット102内に分析用試薬107を複数回分析可能な量充填した試薬パック(図示せず)を設け、試薬ユニット102の筐体と試薬パックとの間に試料水106を導入し、その圧力で試薬ユニット102から(試薬パックから)分析ユニット103に導入するようにしてもよい。この場合、試薬パックの口にバルブ(図示せず)を設置し、このバルブを一定時間開放することにより、一定量の分析用試薬107を吐出させるようにすることができる。
試薬パックの加圧のために試薬ユニット102内に導入した試料水106は、引き続き、試料水106として分析ユニット103に導入してもよい。このようにすると、試料水106の導入手段と分析用試薬107の加圧手段とを兼ねることができる。
なお、図示しないポンプの運転や図示しないバルブの開閉は、通信制御ユニット104で行う。
次いで、分析ユニット103に導入された試料水106および分析用試薬107は、混合部118のマイクロ流路111内で混合後、試料水106に含まれている測定対象物質と分析用試薬107が反応部119のマイクロ流路111内で反応して発色する。このようにして得られた処理液115は、分析部120のフローセル113の検出流路203に導入され、通流した後、フローセル113から排出される。光源112から照射された入射光116は、発色した処理液115を透過して透過光117となる。透過光117は、画像取得装置401で受光され、透過度などが測定されて、データ110が得られる。また、画像取得装置401は当該測定とともに、検出流路203の断面画像203Cを取得し、この断面画像203Cを複数の領域A~Tに分割する。なお、前記したデータ110は、測定された透過度などを分析ユニット103内で検量線に基づいて濃度に変換したものであってもよい。この検量線に基づく濃度への変換は、通信制御ユニット104で行うこともできる。
次いで、水質計101は、領域A~T内に気泡402が存在する画像に関しては、透過度などのデータを採用しないことができる。
このように、本実施形態に係る水質計101は、前述した画像取得装置401を有しており、気泡402が存在する領域A~Tについては採用しない、つまり、そのような領域A~Tに関する透過度などのデータを採用しないことができる。そのため、水質計101は、フローセル113に混入した気泡402に由来する測定ノイズを低減できる。
このように、本実施形態に係る水質計101は、前述した画像取得装置401を有しており、気泡402が存在する領域A~Tについては採用しない、つまり、そのような領域A~Tに関する透過度などのデータを採用しないことができる。そのため、水質計101は、フローセル113に混入した気泡402に由来する測定ノイズを低減できる。
(第2実施形態)
本発明に係る水質計101の好ましい第2実施形態を以下に説明する。なお、第2実施形態に係る水質計101は、フローセル113を好ましい態様としたものである。
図3Aは、図2Aに示すフローセル113の一態様におけるA-A断面図である。図3Bは、図2Aに示すフローセル113の他の態様におけるA-A断面図である。図3Cは、図2Aに示すフローセル113のさらに他の態様におけるA-A断面図である。図4Aは、図2Aに示すフローセル113の一態様のA-A断面図であって、処理液115の流れを説明する説明図である。図4Bは、図2Bに示すフローセル113の一態様のB-B断面図であって、処理液115の流れを説明する説明図である。
本発明に係る水質計101の好ましい第2実施形態を以下に説明する。なお、第2実施形態に係る水質計101は、フローセル113を好ましい態様としたものである。
図3Aは、図2Aに示すフローセル113の一態様におけるA-A断面図である。図3Bは、図2Aに示すフローセル113の他の態様におけるA-A断面図である。図3Cは、図2Aに示すフローセル113のさらに他の態様におけるA-A断面図である。図4Aは、図2Aに示すフローセル113の一態様のA-A断面図であって、処理液115の流れを説明する説明図である。図4Bは、図2Bに示すフローセル113の一態様のB-B断面図であって、処理液115の流れを説明する説明図である。
図2Aや図3Aなどに示すように、フローセル113は、検出流路203の光源112側を上流側とし、検出流路203の画像取得装置401側を下流側とした場合に、前記上流側の端部に検出流路203よりも直径の小さい流入流路204が設けられていることが好ましい。このようにすると、流入流路204から検出流路203内に導入される際の溶液(処理液115)の勢いを高めることができる。これにより、検出流路203内に気泡402が存在した場合に気泡402を下流側へ押し流し、流出流路205から排出させ易くなる。そのため、フローセル113に混入した気泡402由来の測定ノイズをより低減できる。
また、図3Aに示すように、フローセル113の流入流路204は、検出流路203と接続する接続部分において、流入流路204の中心軸206と検出流路203の中心軸207とをずらして設けていることが好ましい。このようにすると、流入流路204の中心軸206と検出流路203の中心軸207とがずれているので、処理液115が検出流路203の壁面に沿って回り込むように導入され、図4Aおよび図4Bに示すような旋回流208となる。この旋回流208は、図4Bに示すように、検出流路203の上流側から下流側にかけて発生し、検出流路203では中心軸207近傍よりも検出流路203の壁面近傍の流れが相対的に速くなる。この旋回流208の作用により、検出流路203の壁面近傍に存在した気泡402は、検出流路203の下流側、さらには流出流路205へ流され、フローセル出口202から排出される。一方、検出流路203の流れ方向の中心軸207近傍は流れが遅いため、この箇所に存在した気泡402は下流側へ流すことは困難である。したがって、旋回流208が発生することにより、気泡402は検出流路203の流れ方向の中心軸207近傍のみに残る。そのため、画像取得装置401で取得する領域A~Tについて、検出流路203の壁面近傍の画像を優先的に取得することによって、処理液115の透過度などをより好適に測定できる。なお、上述の検出流路203の流れ方向における中心軸207近傍に残った気泡402により、中心軸207近傍に測定ノイズが生じることがあるが、そのような場合は、分析ユニット103で後述する処理を行うとよい(なお、この処理については図5Aを参照して後に説明する)。
また、図3Aに示すように、フローセル113は、検出流路203の中心軸207に対する流入流路204の中心軸206の傾き角度θが0°より大きく90°より小さいことが好ましい。このようにした場合も、流入流路204の中心軸206と、検出流路203の中心軸207とがずれているので、図4Aおよび図4Bに示すような旋回流208となる。そのため、前記と同様、気泡402は検出流路203の流れ方向の中心軸207近傍のみに残る。したがって、画像取得装置401で取得する領域A~Tについて、検出流路203の壁面近傍の画像を優先的に取得することによって、処理液115の透過度などをより好適に測定できる。
ここで、この態様において、流入流路204と検出流路203とは、流入流路204の下流側のy軸方向(直径方向)の端の壁面204yが、検出流路203のy軸方向(直径方向)の端の壁面203yに接するように接続されていることが好ましい。つまり、図3Aにおける検出流路203の壁面203yを円周と仮定し、流入流路204の壁面204yを直線と仮定したときに、この直線が円周の1点をとおる接線となるように、壁面203yと壁面204yとを接続することが好ましい。このようにすると、流入流路204の壁面204yと検出流路203の壁面203yとの間に段差がないため、気泡402がトラップされるのを防止できる。なお、図3Aでは、流入流路204と検出流路203との接続は、検出流路203のy軸のマイナス方向(-)としているが、y軸のプラス方向(+)でもよい。この場合も、検出流路203のy軸方向の端の壁面203yが、流入流路204のy軸方向の端の壁面204yに接続されていれば旋回流208となるので、前記と同様、気泡402は検出流路203の流れ方向の中心軸207近傍のみに残る。したがって、画像取得装置401で取得する領域A~Tについて、検出流路203の壁面近傍の画像を優先的に取得することによって、処理液115の透過度などをより好適に測定できる。なお、この場合も上述の検出流路203の流れ方向における中心軸207近傍に残った気泡402により、中心軸207近傍に測定ノイズが生じることがあるが、そのような場合は、分析ユニット103で後述する処理を行うとよい(なお、この処理については図5Aを参照して後に説明する)。
また、図3Aでは、流入流路204を途中で屈曲させることによって、前記傾き角度θを得ている様子を示している。しかし、図3Bに示すように、流入流路204を直管とし、流入流路204上流側から傾き角度θで傾斜する構造としてもよい。また、図3Cに示すように、流入流路204を傾斜させずに直管とし、流入流路204の中心軸206と、検出流路203の中心軸207とをずらして設けることにより、距離tの間隔を空けるようにしてもよい。図3Bおよび図3Cのいずれの場合も流入流路204の中心軸206と、検出流路203の中心軸207とをずらして設けているので、図4Aおよび図4Bに示すような旋回流208となる。そのため、前記と同様、気泡402が存在するとしてもその気泡402は検出流路203の流れ方向の中心軸207近傍のみに残る。したがって、画像取得装置401で取得する領域A~Tについて、検出流路203の壁面近傍の画像を優先的に取得することによって、処理液115の透過度などをより好適に測定できる。
ここで、図3Bおよび図3Cのいずれの場合も、流入流路204のy軸方向の端の壁面204yが、検出流路203のy軸方向の端の壁面203yと接するように接続させてもよい。また、前記した距離tは、流入流路204のy軸方向の端の壁面204yが、検出流路203のy軸方向の端の壁面203yに接する値に設定するとよい。つまり、図3Bおよび図3Cにおける検出流路203の壁面203yを円周と仮定し、流入流路204の壁面204yを直線と仮定したときに、この直線が円周の1点をとおる接線となるように、壁面203yと壁面204yとを接続することが好ましい。このようにすると、流入流路204の壁面204yと検出流路203の壁面203yとの間に段差がないため、気泡402がトラップされるのを防止できる。なお、図3Bおよび図3Cでは、流入流路204と検出流路203との接続は、検出流路203のy軸のマイナス方向としているが、y軸のプラス方向でもよい。これらのいずれの態様によっても、流入流路204のy軸方向の端の壁面204yが、検出流路203のy軸方向の端の壁面203yに接続されていれば旋回流208となる。なお、この場合も上述の検出流路203の流れ方向における中心軸207近傍に残った気泡402により、中心軸207近傍に測定ノイズが生じることがあるが、そのような場合は、分析ユニット103で後述する処理を行うとよい(なお、この処理については図5Aを参照して後に説明する)。
次に、旋回流208によって検出流路203の流れ方向における中心軸207近傍に気泡402が残り、中心軸207近傍に測定ノイズが生じてしまう場合における分析ユニット103による処理について説明する。
図5Aは、検出流路203に気泡402が存在する場合における分析ユニット103による測定時のフローチャートである。また、図5Bは、気泡402を有する検出流路203の断面画像203Cにおいて、指定した特定の領域Aが気泡402を有する場合を示した模式図である。図5Cは、気泡402を有する検出流路203の断面画像203Cにおいて、指定した特定の領域Bが気泡402を有さない場合を示した模式図である。なお、図5Bおよび図5Cは、検出流路203の断面形状が円形の場合を示しているが、検出流路203の断面形状は矩形でもよく、その他の形状であってもよい。
図5Aは、検出流路203に気泡402が存在する場合における分析ユニット103による測定時のフローチャートである。また、図5Bは、気泡402を有する検出流路203の断面画像203Cにおいて、指定した特定の領域Aが気泡402を有する場合を示した模式図である。図5Cは、気泡402を有する検出流路203の断面画像203Cにおいて、指定した特定の領域Bが気泡402を有さない場合を示した模式図である。なお、図5Bおよび図5Cは、検出流路203の断面形状が円形の場合を示しているが、検出流路203の断面形状は矩形でもよく、その他の形状であってもよい。
まず、図5Aに示すように、画像取得装置401を用いて検出流路203を撮影した検出流路203の断面画像203C(図1C参照)を分析ユニット103に取り込む(ステップS1)。
続いて、取り込んだ断面画像203C(画像データ)において、中心軸207近傍ではない領域(図5B参照)、すなわち、旋回流208により気泡402が除去されている壁面近傍の箇所を、例えば、領域A、領域B、領域C、領域D…と領域毎に分割する(ステップS2)。
さらに、分割した複数の領域の中から特定の領域として、例えば、領域Aを指定し(ステップS3)、領域A内の気泡402の有無を確認する(ステップS4)。ここで、指定した領域Aに気泡402がなかった場合(ステップS5で“NO”)、画像取得装置401は、その領域Aの透過度などを測定する(ステップS6)。
一方、気泡402の有無を確認した際に(ステップS4)、指定した領域Aに旋回流208では除去しきれなかった気泡402があった場合(ステップS5で“YES”、図5B参照)、画像取得装置401は、図5Cに示すように、領域Aとは別の領域Bを指定し(ステップS7、図5C参照)、領域B内の気泡402の有無を確認する(ステップS4)。画像取得装置401は、この一連の流れを気泡402がない領域を指定するまで繰り返し行い、気泡402がない領域の透過度などを測定する(ステップS6)。
続いて、取り込んだ断面画像203C(画像データ)において、中心軸207近傍ではない領域(図5B参照)、すなわち、旋回流208により気泡402が除去されている壁面近傍の箇所を、例えば、領域A、領域B、領域C、領域D…と領域毎に分割する(ステップS2)。
さらに、分割した複数の領域の中から特定の領域として、例えば、領域Aを指定し(ステップS3)、領域A内の気泡402の有無を確認する(ステップS4)。ここで、指定した領域Aに気泡402がなかった場合(ステップS5で“NO”)、画像取得装置401は、その領域Aの透過度などを測定する(ステップS6)。
一方、気泡402の有無を確認した際に(ステップS4)、指定した領域Aに旋回流208では除去しきれなかった気泡402があった場合(ステップS5で“YES”、図5B参照)、画像取得装置401は、図5Cに示すように、領域Aとは別の領域Bを指定し(ステップS7、図5C参照)、領域B内の気泡402の有無を確認する(ステップS4)。画像取得装置401は、この一連の流れを気泡402がない領域を指定するまで繰り返し行い、気泡402がない領域の透過度などを測定する(ステップS6)。
前記したように、旋回流208によって検出流路203の流れ方向における中心軸207近傍に気泡402が残り、中心軸207近傍に測定ノイズが生じる。そのため、中心軸207近傍の領域については予め指定しないという態様とするのも好ましい。このようにすると、測定ノイズが生じる可能性が高い領域について処理を行わないため、処理速度の高速化やデータの記録容量の低減などを図ることができる。このような態様としては、例えば、分析ユニット103(具体的には、画像取得装置401)は、検出流路203の半径において、中心(中心軸207)から1/2未満の領域を指定しないようにすることが挙げられる。すなわち、画像取得装置401は、検出流路203の半径において、中心(中心軸207)から1/2以上外側の領域を指定することが挙げられる。この態様において、より好ましくは、画像取得装置401は、検出流路203の半径において、中心(中心軸207)から1/4以上外側の領域を指定することが挙げられる。この態様について、図5Bおよび図5Cに示すように、例えば、検出流路203の中心軸207近傍は指定せず、検出流路203の壁面近傍の領域A~Pの16個の領域を指定するようにすることが好ましい。
ここで、分割した全領域において気泡402が存在した場合、次の処理液115をフローセル113に導入して次の測定をしてもよいし、空気をフローセル113に導入して気泡402を押し流し、その後に次の測定をしてもよい。
また、図5Bおよび図5Cでは、領域A~Pの16個としたが、領域の個数はこれより少なくてもよいし、多くてもよい。領域の個数は、画像取得装置401の透過度などの測定の感度や領域の分割性能に応じて、適宜設定することができる。
また、図5Bおよび図5Cでは、領域A~Pの16個としたが、領域の個数はこれより少なくてもよいし、多くてもよい。領域の個数は、画像取得装置401の透過度などの測定の感度や領域の分割性能に応じて、適宜設定することができる。
(第3実施形態)
本発明に係る水質計101の好ましい第3実施形態を以下に説明する。なお、第3実施形態に係る水質計101は、領域A~Tに気泡402がより存在しなくなるようにしたものである。
図6Aは、図2Bに示すフローセル113の一態様におけるB-B断面図である。図6Bは、図6Aに示すフローセル113のC-C断面図である。なお、第3実施形態の側面図および平面図は、それぞれ第1実施形態で示した図2Aおよび図2Bと同様である。
本発明に係る水質計101の好ましい第3実施形態を以下に説明する。なお、第3実施形態に係る水質計101は、領域A~Tに気泡402がより存在しなくなるようにしたものである。
図6Aは、図2Bに示すフローセル113の一態様におけるB-B断面図である。図6Bは、図6Aに示すフローセル113のC-C断面図である。なお、第3実施形態の側面図および平面図は、それぞれ第1実施形態で示した図2Aおよび図2Bと同様である。
図6Aおよび図6Bに示すように、第3実施形態におけるフローセル113は、光源112の少なくとも一部および画像取得装置401の少なくとも一部のうちの少なくとも一方、好ましくは両方が、検出流路203中へ突出した構成となっている。なお、図6Aおよび図6Bは、これらの両方が突出した構成を図示している。このような構成とすることにより、光源112と検出流路203との間、および、画像取得装置401と検出流路203との間のうちの少なくとも一方に隙間601を設けることができる。隙間601は、流れの滞留箇所となり、この流れの滞留箇所に気泡402がトラップされる。この状態で領域A~Tまたは領域A~Pにおける透過度などを画像取得装置401で測定し、測定対象物質の濃度を算出する。このとき、分析ユニット103(画像取得装置401)では、図5Aに示すフローチャートに従い透過度などを測定する。
ここで、隙間601にトラップされた気泡402(図6Aには図示せず)は、透過度などを測定した後、気泡402の除去動作によって除去される。この気泡402の除去操作は、前記したように、フローセル入口201またはフローセル出口202から、空気を導入することによりその空気とともに押し流す操作としてもよい。
また、フローセル113の流入流路204、検出流路203および流出流路205は、図2Aから図4Bに示す旋回流208を発生する構造としてもよく、旋回流208を発生する構造としなくてもよい。ただし、図2Aから図4Bに示す旋回流208を発生する構造とした場合、気泡402がトラップされる箇所が、検出流路203の流れ方向の中心軸207近傍および隙間601となり、より気泡402がこれらの箇所でトラップされる確率が上がる。そのため、気泡402が領域A~P(図5B参照)に存在しなくなる確率が上がる。したがって、これらの構成を採用すると、フローセル113に混入した気泡402に由来する測定ノイズをさらに低減できる。
また、フローセル113の流入流路204、検出流路203および流出流路205は、図2Aから図4Bに示す旋回流208を発生する構造としてもよく、旋回流208を発生する構造としなくてもよい。ただし、図2Aから図4Bに示す旋回流208を発生する構造とした場合、気泡402がトラップされる箇所が、検出流路203の流れ方向の中心軸207近傍および隙間601となり、より気泡402がこれらの箇所でトラップされる確率が上がる。そのため、気泡402が領域A~P(図5B参照)に存在しなくなる確率が上がる。したがって、これらの構成を採用すると、フローセル113に混入した気泡402に由来する測定ノイズをさらに低減できる。
(第4実施形態)
本発明に係る水質計101の好ましい第4実施形態を以下に説明する。なお、第4実施形態に係る水質計101は、検出流路203内に存在する気泡402を除去する好ましい態様としたものである。つまり、第4実施形態は、測定前のフローセル113の検出流路203の内部に存在する気泡402を、測定前に気泡除去試薬802を送液することによって除去し、気泡除去後に次回分の処理液115を測定するというものである。このように、検出流路203内に存在する気泡402を適時に除去することによって、フローセル113に混入した気泡402に由来する測定ノイズをさらに低減できる。
本発明に係る水質計101の好ましい第4実施形態を以下に説明する。なお、第4実施形態に係る水質計101は、検出流路203内に存在する気泡402を除去する好ましい態様としたものである。つまり、第4実施形態は、測定前のフローセル113の検出流路203の内部に存在する気泡402を、測定前に気泡除去試薬802を送液することによって除去し、気泡除去後に次回分の処理液115を測定するというものである。このように、検出流路203内に存在する気泡402を適時に除去することによって、フローセル113に混入した気泡402に由来する測定ノイズをさらに低減できる。
図7Aは、気泡除去前(透過度などを測定しているとき)のフローセル113の内部を示す縦断面図である。図7Bは、気泡除去中のフローセル113の内部を示す縦断面図である。図7Cは、気泡除去後、次の測定を行っているフローセル113の内部を示す縦断面図である。なお、第4実施形態の側面図および平面図は、それぞれ第1実施形態で示した図2Aおよび図2Bと同様である。また、図8Aは、図7Aに示す状態とするための、水質計101のバルブの状態を示す概略構成図である。図8Bは、図7Bに示す状態とするための、水質計101のバルブの状態を示す概略構成図である。図8Cは、図7Cに示す状態とするための、水質計101のバルブの状態を示す概略構成図である。
図8Aから図8Cに示すように、第4実施形態では、第1実施形態で示した試薬ユニット102内に、分析用試薬107に加えて、気泡除去試薬802が充填されている。そして、試薬ユニット102内の分析用試薬107は、分析用試薬バルブ901を介して分析ユニット103と接続されている。また、試薬ユニット102内の気泡除去試薬802は、気泡除去試薬用バルブ902を介して分析ユニット103と接続されている。各試薬の分析ユニット103内の送液はこれらのバルブの開閉動作により制御される。
図7Aに示すように、前回の測定後、気泡除去前のフローセル113の内部には前回測定の処理液801が満たされ、流入流路204、検出流路203および流出流路205のそれぞれの壁面などに気泡402が存在している。その際は、図8Aに示すように、分析用試薬バルブ901および気泡除去試薬用バルブ902は閉じている。
続いて、図8Bに示すように、気泡除去試薬用バルブ902を開けることにより、図7Bに示すように、フローセル入口201から気泡除去試薬802が導入され、流入流路204、検出流路203および流出流路205が気泡除去試薬802で満たされる。これにより、測定前に存在した気泡402を除去できる。
さらに、図8Cに示すように、気泡除去試薬用バルブ902のバルブを閉じ、かつ分析用試薬バルブ901を開けることにより、図7Cに示すように、フローセル入口201から処理液115を導入し、フローセル113の内部、すなわち、流入流路204、検出流路203および流出流路205の内部を処理液115で満たし、次回の測定を行う。
このように、気泡除去試薬802を導入して測定前に流入流路204、検出流路203および流出流路205に存在した気泡402を除去した後に、処理液115を送液することにより、気泡402に由来する測定ノイズをより低減できる。
ここで、気泡除去試薬802としては、例えば、シリコーン系消泡剤、有機系消泡剤などが挙げられる。有機系消泡剤としては、例えば、高級アルコールなどが挙げられる。また、気泡除去試薬802としては、例えば、界面活性剤、ポリエーテルなどが挙げられる。なお、気泡除去試薬802はこれらに限定されず、従来公知のものを適宜使用できる。
また、言うまでもなく、フローセル113は、図3Aから図4Bに示す旋回流208を発生する構造としてもよく、旋回流208を発生する構造としなくてもよい。ただし、旋回流208を発生する構造とした場合、検出流路203の壁面付近の気泡402は除去されるため、気泡402の数が減り、かつ残った気泡402も検出流路203の流れ方向の中心軸207近傍に集まるため、旋回流208を発生する構造としなかった場合よりも気泡除去試薬802で気泡402を除去し易くなるため好ましい。
(第5実施形態)
前述したように、分析ユニット103は、試薬ユニット102、通信制御ユニット104、電源ユニット105などと着脱自在に接続されるものである。分析ユニット103は、フローセル113が汚れたり、マイクロ流路111が異物などで詰まってしまったりした場合などに、任意に交換することができる。つまり、分析ユニット103は、水質計101における交換部品となるものである。分析ユニット103と、試薬ユニット102、通信制御ユニット104および電源ユニット105などとの着脱は、従来公知のコネクタを介して行うことができる。コネクタは、溶液の通流を行う箇所については、液密性を維持できるものであればよく、データ110、電源108、制御109を行う箇所については電気的な接続を維持できるものであればよい。
前述したように、分析ユニット103は、試薬ユニット102、通信制御ユニット104、電源ユニット105などと着脱自在に接続されるものである。分析ユニット103は、フローセル113が汚れたり、マイクロ流路111が異物などで詰まってしまったりした場合などに、任意に交換することができる。つまり、分析ユニット103は、水質計101における交換部品となるものである。分析ユニット103と、試薬ユニット102、通信制御ユニット104および電源ユニット105などとの着脱は、従来公知のコネクタを介して行うことができる。コネクタは、溶液の通流を行う箇所については、液密性を維持できるものであればよく、データ110、電源108、制御109を行う箇所については電気的な接続を維持できるものであればよい。
交換部品として用いられる分析ユニット103の構成は、図1Bに示すものと同様である。すなわち、交換部品として用いられる分析ユニット103は、図1Bに示すように、溶液を通流させる検出流路203と、検出流路203の一部に設けられ、検出流路203内に光(入射光116)を照射する光源112と、検出流路203の一部において光源112と対向して設けられ、光源112からの光を受けて溶液の透過度などを測定する画像取得装置401と、を有するフローセル113を備えている。分析ユニット103が備えている画像取得装置401は、検出流路203の断面画像203Cを取得し、断面画像203Cを複数の領域A~Tに分割する。そのため、前述したように、本実施形態に係るフローセル113は、フローセル113に混入した気泡402に由来する測定ノイズを低減できる。なお、この場合も、フローセル113は、図3Aから図4Bに示す旋回流208を発生する構造としてもよく、旋回流208を発生する構造としなくてもよい。また、分析ユニット103の構成、効果などについては既に詳述しているので、その説明を省略する。
また、フローセル113も分析ユニット103と着脱自在に備えることができる。そのため、フローセル113は、フローセル113が汚れたり、光源112や画像取得装置401が機能しなくなったりした場合に、任意に交換することができる。つまり、フローセル113は、分析ユニット103および水質計101における交換部品となるものである。分析ユニット103内におけるフローセル113の着脱は、従来公知のコネクタを介して行うことができる。コネクタは、溶液の通流を行う箇所については、液密性を維持できるものであればよく、データ110、電源108、制御109を行う箇所については電気的な接続を維持できるものであればよい。
また、フローセル113は、着脱の際に位置決め等を行うガイド溝(図示せず)などが設けられていてもよい。この場合、分析ユニット103におけるフローセル113の取付位置には、当該ガイド溝の形状・大きさに応じたガイド用突起物(図示せず)が設けられていてもよい。このようにすると、フローセル113の着脱を容易且つ確実に行うことができる。
また、フローセル113は、着脱の際に位置決め等を行うガイド溝(図示せず)などが設けられていてもよい。この場合、分析ユニット103におけるフローセル113の取付位置には、当該ガイド溝の形状・大きさに応じたガイド用突起物(図示せず)が設けられていてもよい。このようにすると、フローセル113の着脱を容易且つ確実に行うことができる。
交換部品として用いられるフローセル113の構成は、図2Aから図4B、図6Aから図7Cに示すものと同様である。すなわち、交換部品として用いられるフローセル113は、図2Aから図4B、図6Aから図7Cに示すように、溶液を通流させる検出流路203と、検出流路203の一部に設けられ、検出流路203内に光(入射光116)を照射する光源112と、検出流路203の一部において光源112と対向して設けられ、光源112からの光を受けて溶液の透過度などを測定する画像取得装置401と、を有する。フローセル113が有している画像取得装置401は、検出流路203の断面画像203Cを取得し、断面画像203Cを複数の領域A~Tに分割する。そのため、前述したように、本実施形態に係るフローセル113は、フローセル113に混入した気泡402に由来する測定ノイズを低減できる。なお、フローセル113は、図3Aから図4Bに示す旋回流208を発生する構造としてもよく、旋回流208を発生する構造としなくてもよい。また、フローセル113の構成、効果などについては既に詳述しているので、その説明を省略する。
以上、本発明の一実施形態に係る水質計、分析ユニット、フローセルについて詳細に説明したが本発明の主旨はこれに限定されるものではなく、様々な変形例が含まれる。例えば、前記した実施形態は本発明を分かり易く説明するために詳細に説明したものであり、必ずしも説明した全ての構成を備えるものに限定されるものではない。また、ある実施形態の構成の一部を他の実施形態の構成に置き換えることが可能であり、また、ある実施形態の構成に他の実施形態の構成を加えることも可能である。また、各実施形態の構成の一部について、他の構成の追加・削除・置換をすることが可能である。さらに、制御線や情報線は説明上必要と考えられるものを示しており、製品上必ずしも全ての制御線や情報線を示しているとは限らない。実際には殆ど全ての構成が相互に接続されていると考えてもよい。
101 水質計
203 検出流路
112 光源
401 画像取得装置
103 分析ユニット
113 フローセル
203C 断面画像
A~T 領域
204 流入流路
206 流入流路の中心軸
207 検出流路の中心軸
104 通信制御ユニット
402 気泡
601 隙間
102 試薬ユニット
106 試料水
107 分析用試薬
802 気泡除去試薬
203 検出流路
112 光源
401 画像取得装置
103 分析ユニット
113 フローセル
203C 断面画像
A~T 領域
204 流入流路
206 流入流路の中心軸
207 検出流路の中心軸
104 通信制御ユニット
402 気泡
601 隙間
102 試薬ユニット
106 試料水
107 分析用試薬
802 気泡除去試薬
Claims (12)
- 溶液を通流させる検出流路と、
前記検出流路の一部に設けられ、前記検出流路内に光を照射する光源と、
前記検出流路の一部において前記光源と対向して設けられ、前記光源からの光を受けて前記溶液の透過度および吸光度のうちの少なくとも一方を測定する画像取得装置と、
を有するフローセルを備えた分析ユニットを有し、
前記画像取得装置は、前記検出流路の断面画像を取得し、前記断面画像を複数の領域に分割することを特徴とする水質計。 - 請求項1において、
前記検出流路の光源側を上流側とし、前記検出流路の画像取得装置側を下流側とした場合に、
前記上流側の端部に前記検出流路よりも直径の小さい流入流路が設けられている
ことを特徴とする水質計。 - 請求項2において、
前記流入流路が前記検出流路と接続する接続部分において、前記流入流路の中心軸と前記検出流路の中心軸とをずらして設けていることを特徴とする水質計。 - 請求項2において、
前記検出流路の中心軸に対する前記流入流路の中心軸の傾き角度が0°より大きく90°より小さいことを特徴とする水質計。 - 請求項4において、
前記流入流路が直管であることを特徴とする水質計。 - 請求項1において、
前記画像取得装置は、前記複数の領域の中から特定の領域を指定してその特定の領域の透過度および吸光度のうちの少なくとも一方を測定することを特徴とする水質計。 - 請求項6において、
前記画像取得装置は、前記検出流路の半径において、中心から1/2以上外側の領域を指定することを特徴とする水質計。 - 請求項6において、
前記画像取得装置は、指定した前記特定の領域に気泡があった場合は、別の領域を指定し、指定した前記別の領域の透過度および吸光度のうちの少なくとも一方を測定することを特徴とする水質計。 - 請求項1において、
前記光源の少なくとも一部および前記画像取得装置の少なくとも一部のうちの少なくとも一方が、前記検出流路に突出して設けられており、
前記光源と前記検出流路との間、および、前記画像取得装置と前記検出流路との間には、それぞれ隙間が設けられていることを特徴とする水質計。 - 請求項1において、
前記分析ユニットと接続される試薬ユニットを有し、
前記試薬ユニットは、試料水中の測定対象物質を測定する分析用試薬と、前記検出流路から気泡を除去する気泡除去試薬と、を有していることを特徴とする水質計。 - 溶液を通流させる検出流路と、
前記検出流路の一部に設けられ、前記検出流路内に光を照射する光源と、
前記検出流路の一部において前記光源と対向して設けられ、前記光源からの光を受けて前記溶液の透過度および吸光度のうちの少なくとも一方を測定する画像取得装置と、
を有するフローセルを備え、
前記画像取得装置は、前記検出流路の断面画像を取得し、前記断面画像を複数の領域に分割することを特徴とする分析ユニット。 - 溶液を通流させる検出流路と、
前記検出流路の一部に設けられ、前記検出流路内に光を照射する光源と、
前記検出流路の一部において前記光源と対向して設けられ、前記光源からの光を受けて前記溶液の透過度および吸光度のうちの少なくとも一方を測定する画像取得装置と、
を有し、
前記画像取得装置は、前記検出流路の断面画像を取得し、前記断面画像を複数の領域に分割することを特徴とするフローセル。
Applications Claiming Priority (2)
| Application Number | Priority Date | Filing Date | Title |
|---|---|---|---|
| JP2019-027864 | 2019-02-19 | ||
| JP2019027864A JP7199658B2 (ja) | 2019-02-19 | 2019-02-19 | 水質計、分析ユニットおよびフローセル |
Publications (1)
| Publication Number | Publication Date |
|---|---|
| WO2020170546A1 true WO2020170546A1 (ja) | 2020-08-27 |
Family
ID=72143464
Family Applications (1)
| Application Number | Title | Priority Date | Filing Date |
|---|---|---|---|
| PCT/JP2019/047089 Ceased WO2020170546A1 (ja) | 2019-02-19 | 2019-12-02 | 水質計、分析ユニットおよびフローセル |
Country Status (2)
| Country | Link |
|---|---|
| JP (1) | JP7199658B2 (ja) |
| WO (1) | WO2020170546A1 (ja) |
Families Citing this family (1)
| Publication number | Priority date | Publication date | Assignee | Title |
|---|---|---|---|---|
| JP7190232B2 (ja) * | 2019-05-14 | 2022-12-15 | 三菱電機株式会社 | 水質測定装置 |
Citations (9)
| Publication number | Priority date | Publication date | Assignee | Title |
|---|---|---|---|---|
| JPS5131575U (ja) * | 1974-08-30 | 1976-03-08 | ||
| JPS57164447U (ja) * | 1981-04-10 | 1982-10-16 | ||
| JPS61197543U (ja) * | 1985-05-30 | 1986-12-10 | ||
| JPH08159947A (ja) * | 1994-12-02 | 1996-06-21 | Nippon Syst House Kk | 画像解析による水質管理システム |
| JP2001255260A (ja) * | 2000-03-07 | 2001-09-21 | Toyobo Co Ltd | 尿中有形成分分類装置 |
| JP2003057153A (ja) * | 2001-08-09 | 2003-02-26 | Hitachi Ltd | 分析装置および分析システム |
| JP2015128750A (ja) * | 2014-01-08 | 2015-07-16 | 株式会社日立製作所 | 定置洗浄の終点時期決定装置及びそれを備える定置洗浄システム |
| WO2016207320A1 (en) * | 2015-06-26 | 2016-12-29 | Universiteit Twente | Microfluidic device and method for batch adsorption |
| WO2018199080A1 (ja) * | 2017-04-28 | 2018-11-01 | シンクサイト株式会社 | イメージングフローサイトメーター |
-
2019
- 2019-02-19 JP JP2019027864A patent/JP7199658B2/ja active Active
- 2019-12-02 WO PCT/JP2019/047089 patent/WO2020170546A1/ja not_active Ceased
Patent Citations (9)
| Publication number | Priority date | Publication date | Assignee | Title |
|---|---|---|---|---|
| JPS5131575U (ja) * | 1974-08-30 | 1976-03-08 | ||
| JPS57164447U (ja) * | 1981-04-10 | 1982-10-16 | ||
| JPS61197543U (ja) * | 1985-05-30 | 1986-12-10 | ||
| JPH08159947A (ja) * | 1994-12-02 | 1996-06-21 | Nippon Syst House Kk | 画像解析による水質管理システム |
| JP2001255260A (ja) * | 2000-03-07 | 2001-09-21 | Toyobo Co Ltd | 尿中有形成分分類装置 |
| JP2003057153A (ja) * | 2001-08-09 | 2003-02-26 | Hitachi Ltd | 分析装置および分析システム |
| JP2015128750A (ja) * | 2014-01-08 | 2015-07-16 | 株式会社日立製作所 | 定置洗浄の終点時期決定装置及びそれを備える定置洗浄システム |
| WO2016207320A1 (en) * | 2015-06-26 | 2016-12-29 | Universiteit Twente | Microfluidic device and method for batch adsorption |
| WO2018199080A1 (ja) * | 2017-04-28 | 2018-11-01 | シンクサイト株式会社 | イメージングフローサイトメーター |
Also Published As
| Publication number | Publication date |
|---|---|
| JP7199658B2 (ja) | 2023-01-06 |
| JP2020134306A (ja) | 2020-08-31 |
Similar Documents
| Publication | Publication Date | Title |
|---|---|---|
| O'Toole et al. | Absorbance based light emitting diode optical sensors and sensing devices | |
| JP2023040006A (ja) | 球面レンズを含む流体フローセル | |
| KR101446748B1 (ko) | Loc를 기반으로 한 수질측정 네트워크 시스템 및 이를 이용하는 휴대용 통합 수질측정기 | |
| CN100541171C (zh) | 紫外光协同臭氧消解光度法测量水体总氮总磷的方法 | |
| CN104730267B (zh) | Toc、tn、tp浓度及总量连续同步在线监测方法与仪器 | |
| US20160041103A1 (en) | Lab-on-a-chip for alkalinity analysis | |
| US9410894B2 (en) | Microfluidic device for analyzing a pressurized fluid | |
| JP2009288228A (ja) | 自動分析定量観測方法および自動分析定量観測装置 | |
| CN104641220B (zh) | 具有吸光度检测用的流通池的微流控芯片及包括该微流控芯片的吸光度检测装置 | |
| WO2004008090A1 (en) | Method and system for the determination and remediation of arsenic in aqueous media | |
| CN104345034A (zh) | 用于确定液体试样的化学需氧量的方法和分析仪 | |
| CN105102976B (zh) | 用于连续监测水中铬的微流控芯片及包含它的测铬装置 | |
| US20140004002A1 (en) | Permeable measuring cell for receiving measuring means | |
| CN106769949A (zh) | 基于钒钼黄分光光度法测定海水中磷含量的光流控检测器 | |
| JP7199658B2 (ja) | 水質計、分析ユニットおよびフローセル | |
| US10603661B2 (en) | Mini-fluidics cassette for colorimetric nutrient analysis and a method of using same | |
| KR20150106493A (ko) | 표준물첨가법을 이용한 흐름셀을 갖는 미세유체칩과 이를 포함하는 흡광 검출 장치 | |
| EP4114800B1 (en) | Nitrogen sensor apparatus for simultaneously measuring nitrate/nitrite and ammonium in wastewater and method of operation same | |
| Jiang et al. | Rapid on-chip quantification of ammonia nitrogen based on a ‘flow and react’mechanism | |
| KR100840181B1 (ko) | 전질소 및 전인 자동 측정 장치 및 방법 | |
| CN104792704A (zh) | Toc、tn、tp三指标连续同步实时在线测定方法与仪器 | |
| KR101238961B1 (ko) | 추적자 분석 시스템 | |
| CN205808915U (zh) | 一种总磷快速微检测系统 | |
| CN101000291B (zh) | 一种光学连续水质分析系统 | |
| KR100475429B1 (ko) | 다중 실린지 흡입ㆍ압송방식을 이용한 화학적 산소요구량연속자동측정장치 |
Legal Events
| Date | Code | Title | Description |
|---|---|---|---|
| 121 | Ep: the epo has been informed by wipo that ep was designated in this application |
Ref document number: 19916473 Country of ref document: EP Kind code of ref document: A1 |
|
| NENP | Non-entry into the national phase |
Ref country code: DE |
|
| 122 | Ep: pct application non-entry in european phase |
Ref document number: 19916473 Country of ref document: EP Kind code of ref document: A1 |