WO2020137362A1 - 判定装置、モータ装置及びプログラム - Google Patents
判定装置、モータ装置及びプログラム Download PDFInfo
- Publication number
- WO2020137362A1 WO2020137362A1 PCT/JP2019/046950 JP2019046950W WO2020137362A1 WO 2020137362 A1 WO2020137362 A1 WO 2020137362A1 JP 2019046950 W JP2019046950 W JP 2019046950W WO 2020137362 A1 WO2020137362 A1 WO 2020137362A1
- Authority
- WO
- WIPO (PCT)
- Prior art keywords
- current value
- period
- sub
- motor
- value
- Prior art date
- Legal status (The legal status is an assumption and is not a legal conclusion. Google has not performed a legal analysis and makes no representation as to the accuracy of the status listed.)
- Ceased
Links
Images







Classifications
-
- G—PHYSICS
- G01—MEASURING; TESTING
- G01R—MEASURING ELECTRIC VARIABLES; MEASURING MAGNETIC VARIABLES
- G01R31/00—Arrangements for testing electric properties; Arrangements for locating electric faults; Arrangements for electrical testing characterised by what is being tested not provided for elsewhere
-
- G—PHYSICS
- G01—MEASURING; TESTING
- G01R—MEASURING ELECTRIC VARIABLES; MEASURING MAGNETIC VARIABLES
- G01R31/00—Arrangements for testing electric properties; Arrangements for locating electric faults; Arrangements for electrical testing characterised by what is being tested not provided for elsewhere
- G01R31/34—Testing dynamo-electric machines
Definitions
- the present invention relates to a determination device, a motor device, and a program.
- the device In the conventional technology for detecting an abnormality in a motor, for example, the device needs to learn in advance the value of the physical quantity that occurs when the fan motor is abnormal, and there is a problem that learning time is required. Moreover, such a problem is not limited to the fan motor, but is a problem common to all motors.
- an object of the present invention is to provide a technique for reducing the time required for learning a value of a physical quantity indicating a motor abnormality and detecting a motor abnormality.
- One aspect of the present invention is a current value acquisition unit that acquires current value information indicating a current value of the current at each time in a main period when a current is applied to a motor, and a time indicated by the current value information.
- the current value at t is defined as a current value i(t) (t is a real number), and the current value at the time (t+ ⁇ t) after the elapsed time ⁇ t of the time t indicated by the current value information is the current value i(t+ ⁇ t).
- the difference between the current value i(t) and the current value i(t+ ⁇ t) is taken as the current value change amount at time t, and a distribution showing the distribution of the current value change amount and the variance of the physical quantity that changes at random.
- a determination unit that determines whether or not the operation of the motor is normal based on a difference from a certain normal distribution.
- the determination unit is a plurality of sub-periods that are periods within the main period and has a period that is half or less of a length of the main period.
- a statistic acquisition processing unit that acquires a value of a predetermined statistic for the distribution of the current value change amount in the sub-period, the normal distribution and the current value change amount in the sub-period.
- a stable sub-period determination processing unit that determines for each sub-period whether the value of the predetermined statistic indicates that the difference from the distribution is less than or equal to a predetermined magnitude, and the stable sub-period determination processing unit
- a motor determination processing unit that determines whether or not the operation of the motor is normal based on the determination result.
- One aspect of the present invention is the determination device, wherein the difference between the normal distribution and the distribution of the current value change amount in the sub-period is a predetermined magnitude or less value of the predetermined statistic Indicates that the sub-period determined by the stable sub-period determination processing unit is a stable sub-period, and the difference between the normal distribution and the distribution of the current value change amount in the sub-period is larger than a predetermined magnitude.
- the motor determination processing unit determines the number of the stable sub-periods and the unstable sub-period.
- the motor determination processing unit determines the number of the stable sub-periods and the unstable sub-period.
- the number of stable sub-periods with respect to the sum of the number of sub-periods is equal to or less than the predetermined value, it is determined that the operation of the motor is abnormal.
- One aspect of the present invention is the above determination device, wherein the normal distribution is a Gaussian distribution.
- One aspect of the present invention is the above determination device, wherein the predetermined statistic is varMD2, where varMD2 is the variance of the square distribution of MD (Mahalanobis' Distance).
- One aspect of the present invention is the above determination device, wherein the stable sub-period determination processing unit further determines whether the operation of the motor is based on a value indicating the randomness of the current value or the current value change amount. Determine whether it is normal.
- One aspect of the present invention is the determination device described above, wherein the stable sub-period determination processing unit sets the distribution of the square of MD (Mahalanobis' Distance) as varMD2, and the current value change amount in the sub-period.
- MD Morhalanobis' Distance
- the difference between varMD2 for the distribution of varMD2 and varMD2 for the Gaussian distribution is larger than the varMD2 threshold, and the difference between the CIV value and the predetermined first value for the distribution of the current value change amount in the sub-period.
- the sub-period is determined to be the unstable sub-period
- the varMD2 difference is greater than the varMD2 threshold
- the CIV difference is If it is less than or equal to a value of 2, it is determined that the sub period is the stable sub period, and if the varMD2 difference is less than or equal to the varMD2 threshold value and the CIV difference is greater than the second value, the sub period.
- the sub-period is determined to be the stable sub-period. To do.
- One aspect of the present invention includes a motor, a current value acquisition unit that acquires current value information indicating a current value of the current at each time in a main period when a current is applied to the motor, and the current value.
- the current value at time t indicated by the information is a current value i(t) (t is a real number), and the current value at time (t+ ⁇ t) after the elapsed time ⁇ t of the time t indicated by the current value information is the current value.
- i(t+ ⁇ t) and the difference between the current value i(t) and the current value i(t+ ⁇ t) as the current value change amount, based on the difference between the distribution of the current value change amount and the normal distribution.
- a determination unit that determines whether or not the operation is normal.
- One aspect of the present invention is a program for causing a computer to function as the above determination device.
- the present invention it becomes possible to reduce the time required for learning the value of the physical quantity indicating the abnormality of the motor and to detect the abnormality of the motor, as compared with the case without this configuration.
- the figure which shows an example of the flow of the determination process which the motor determination apparatus 40 in embodiment carries out.
- the figure which shows the 4th example of the experimental result of the electric current value change amount in embodiment. The figure which shows the 1st example of the determination result by the stable sub period determination process part 433 in embodiment.
- FIG. 1 is a diagram illustrating an example of a functional configuration of a motor device 1 of the embodiment.
- the motor device 1 includes a motor 10, a motor control circuit 20, a motor control device 30, a motor determination device 40, and an output device 50.
- the motor 10 is supplied with electric power and rotates to generate torque. That is, the motor 10 converts electric energy into kinetic energy.
- the motor 10 may be any motor as long as it is a motor, for example, a brushless motor or a stepping motor.
- the motor 10 may be, for example, a fan motor.
- the motor control circuit 20 is a circuit including switches such as semiconductor switches and connected to the motor 10.
- the motor control circuit 20 rotates the motor 10 by applying a current of a predetermined waveform shaped by turning the switch on/off to the motor 10.
- the motor control device 30 controls the operation of the motor 10 by controlling the motor control circuit 20.
- the motor control device 30 controls the rotation of the motor 10 by controlling on/off of a switch included in the motor control circuit 20, for example.
- the motor determination device 40 determines whether or not the operation of the motor 10 is abnormal based on the current value of the current applied to the motor 10 at each time.
- the operation of the motor 10 is abnormal means that the energy required for the rotation of the motor 10 has a predetermined value due to factors that hinder the rotation of the motor 10, such as solidification of the lubricant, reduction of the lubricant, and deformation of the bearing. This is the state of the motor 10 as described above.
- the output device 50 outputs the determination result of the motor determination device 40.
- the output device 50 may be any device as long as it can output the determination result of the motor determination device 40.
- the output device 50 may be configured to include a display device such as a CRT (Cathode Ray Tube) display, a liquid crystal display, and an organic EL (Electro-Luminescence) display.
- the output device 50 may be configured as an interface that connects these display devices to the own device.
- the output device 50 may be, for example, an LED (light emitting diode).
- the output device 50 may indicate whether or not the operation of the motor 10 is abnormal, for example, by a blinking pattern of the LED.
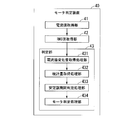
- FIG. 2 is a diagram illustrating an example of a functional configuration of the motor determination device 40 in the embodiment.
- the motor determination device 40 includes a CPU (Central Processing Unit), a memory, an auxiliary storage device, and the like connected by a bus, and executes a program.
- the motor determination device 40 functions as a device including a current value acquisition unit 41, an RMS value acquisition unit 42, and a determination unit 43 by executing the program.
- the current value acquisition unit 41 acquires current value information.
- the current value information is information indicating the current value of the current applied to the motor 10 at each time within the main period.
- the main period may be any period as long as the current is applied to the motor 10 and is a predetermined period, for example, 36 hours after the current is started to be applied to the motor 10. Good.
- the motor determination device 40 acquires the current value information, for example, by acquiring the current flowing through the motor control circuit 20.
- the current flowing through the motor control circuit 20 is a current flowing through a predetermined measurement point on the motor control circuit 20.
- the measurement location is, for example, a location where a predetermined resistance having a small resistance value is located.
- the predetermined resistance may be, for example, a shunt resistance.
- the predetermined resistance may be, for example, a shunt resistance arranged between a power source (not shown) of electric power supplied to the motor 10 and a ground wire.
- the small resistance value is, for example, 0.1 ⁇ .
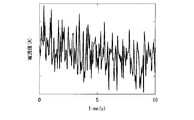
- FIG. 3 is a diagram showing an example of the current value of the current applied to the motor 10 in the embodiment at each time in the main period.
- the horizontal axis of FIG. 3 represents time.
- the vertical axis of FIG. 3 represents the current value.
- FIG. 3 shows changes in the current value of the current flowing through the measurement point of the motor control circuit 20 from 0 second to 10 seconds.
- the RMS value acquisition unit 42 executes an RMS value acquisition process.
- the RMS value acquisition process is a process of acquiring the RMS (root mean square) value of the current value indicated by the current value information in the RMS time based on the current value information.
- the RMS time is a predetermined time.
- the RMS time may be any time as long as it is shorter than half the length of the main period (hereinafter referred to as “main time”). For example, if the main time is 35 hours, the RMS time may be 1 minute, for example.
- the RMS time is 1 minute.
- the information indicating the value of the RMS value acquired by the RMS value acquisition process at each time is referred to as current value information for the sake of simplicity of the description below.
- the amount of change in the current value indicated by the current value information is called the amount of change in the current value.
- the current value change amount at time t is the current value i(t) at time t indicated by the current value information and the current value indicated by the current value information, which is the time after the elapsed time ⁇ t time from time t. It is the difference from the current value i(t+ ⁇ t) at (t+ ⁇ t).
- the time t is a real number.
- the current value change amount at time t is a value obtained by subtracting the current value i(t) from the current value i(t+ ⁇ t).
- i(t+ ⁇ t)-i(t) is referred to as a current value change amount d(t).
- the elapsed time ⁇ t may be any time as long as it is at least the RMS time and less than half the main time, and may be, for example, the RMS time.
- the elapsed time ⁇ t is the RMS time.
- the determination unit 43 will be described.
- the determination unit 43 executes a determination process.
- the determination process is a process in which the determination unit 43 determines whether or not the motor 10 is performing an abnormal operation based on the difference between the distribution of the current value change amount and the normal distribution.
- the normal distribution is a distribution that represents the variance of physical quantities that change randomly, and is a distribution in which statistical quantities that can be defined for the distribution of current value changes can be defined.
- the distribution representing the variance of the physical quantity that changes randomly may be, for example, a Gaussian distribution, an F distribution, or a chi-square distribution.
- a time that is longer than the elapsed time ⁇ t and is half the main time or less is referred to as a sub time.
- the length of the sub time is a predetermined length. For example, when the elapsed time ⁇ t is 1 minute and the main time is 35 hours, the sub time may be 6 hours or 5 hours, for example. For ease of explanation below, it is assumed that the sub-time is 6 hours.
- an abnormal current event an event in which the difference between the current value change amount distribution in the sub-time period and the normal distribution is larger than a predetermined magnitude.
- the determination unit 43 determines that the operation of the motor 10 is abnormal when the frequency of occurrence of the abnormal current event within the main period is larger than a predetermined value.
- a period which is within the main period and whose length is the sub-time is referred to as a sub-period. Due to the definition of sub-period, at least two sub-periods are included in the main period.
- the distribution of the current value change amount in the sub period will be referred to as the current value change amount distribution in the sub period.
- FIG. 4 is a diagram illustrating an example of the sub-period in the embodiment.
- the horizontal axis of FIG. 4 represents time.
- the vertical axis of FIG. 4 represents the RMS value of the current value.
- FIG. 4 shows that there are four sub-periods during the 35 hour period.
- the RMS value of the current value is a value of 0.35 A or more and less than 0.45 A.
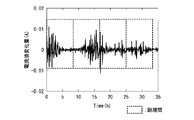
- FIG. 5 is a diagram showing an example of the relationship between the current value change amount and the sub period at each time indicated by the current value change amount information in the main period according to the embodiment.
- the current value change amount information in the main period is information indicating the current value change amount at each time in the main period.
- the horizontal axis of FIG. 5 represents time.
- the vertical axis of FIG. 5 indicates the current value change amount indicated by the current value change amount information within the main period.
- FIG. 5 shows that there are 4 sub-periods during the 35 hour period.
- the amount of change in current value is a value between about ⁇ 0.01 A and about 0.01 A.
- the determination unit 43 includes a current value change amount acquisition processing unit 431, a statistic amount acquisition processing unit 432, a stable sub-period determination processing unit 433, and a motor determination processing unit 434.
- the current value change amount acquisition processing unit 431 executes a current value change amount acquisition process.
- the current value change amount acquisition process is a process in which the current value change amount acquisition processing unit 431 acquires the current value change amount at each time in the main period based on the current value information.
- the statistic acquisition processing unit 432 executes statistic acquisition processing.
- the statistic amount acquisition process is a process in which the statistic amount acquisition processing unit 432 acquires a value of a predetermined statistic amount for the current value variation distribution within the sub-period for each of a plurality of sub-periods according to a predetermined method.
- the predetermined statistic is called the judgment statistic.
- the determination statistic is not necessarily one and may be plural.
- the judgment statistic is a statistic that can be defined even for a normal distribution, and as long as it is a statistic whose value changes according to the current value change amount distribution in the sub-period in the sub-time, any statistic It may be.
- the determination statistic may be, for example, the variance of the squared distribution of MD (Mahalanobis' Distance).
- varMD2 the variance of the MD squared distribution
- the predetermined method may be the first method, for example.
- the time after the sub-time of time t_(n) is time t_(n+1), and the sub-period whose start time is time t_(n) is the n-th sub-period of the first method.
- Method This is a method for acquiring the value of the determination statistic in the nth sub-period.
- n is an integer.
- the predetermined method may be the second method, for example.
- the time after the second method time of time t_(n) is time t_(n+1), and the sub-period whose start time is time t_(n) is the second method nth sub-period.
- the second method is a method for acquiring the value of the determination statistic in the nth sub-period.
- the second method time is half the sub time.
- the predetermined method is the first method.
- the stable sub period determination processing unit 433 executes a stable sub period determination process.
- the stable sub-period determination process is a process in which the stable sub-period determination processing unit 433 determines whether or not each sub-period satisfies the stability condition based on the value of the determination statistic for each sub-period.
- the stability condition may be any condition as long as the value of the statistic for determination indicates that the difference between the normal distribution and the distribution of the current value change amount in the sub period is less than or equal to a predetermined magnitude. Good.
- the stability condition is, for example, a condition that the difference between the value of the determination statistic in the sub period and the value of the determination statistic with respect to the normal distribution is equal to or less than the threshold.
- the stable sub-period determination processing unit 433 is based on not only the value of the determination statistic for each sub-period but also a predetermined condition regarding the randomness of the current value or the current value change amount. Then, it may be determined whether or not each sub period satisfies the stability condition.
- the stable sub-period determination processing unit 433 that operates in this way is referred to as a deformation determination processing unit.
- the predetermined condition regarding the randomness of the current value or the variation of the current value is, for example, a condition that the difference between the randomness value and the randomness comparison value that is a predetermined value is equal to or smaller than the randomness difference threshold value that is a predetermined value.
- the randomness value is a value indicating the randomness of the current value or the current value change amount.
- the disorder value may be, for example, CV (Coefficient of Variation) with respect to the amount of change in current value.
- the disorder value may be, for example, CIV (Coefficient of Increment Variation) with respect to the amount of change in current value.
- CIV is a value V civ represented by the following equation (1).
- s(di) represents the standard deviation of the current value variation distribution within the sub-period.
- ⁇ i> represents the average value of the current RMS.
- the statistic acquisition processing unit 432 may acquire the randomness value for each sub-period.
- the stable sub period determination processing unit 433 is the deformation determination processing unit, it is assumed that the statistic acquisition processing unit 432 acquires the disorder value for each sub period.
- the number of sub-periods determined to satisfy the stability condition by the stable sub-period determination processing unit 433 is referred to as a stable sub-period.
- the number of sub-periods determined by the stable sub-period determination processing unit 433 to not satisfy the stability condition is referred to as an unstable sub-period.
- the motor determination processing unit 434 executes motor determination processing.
- the motor determination process is a process in which the motor determination processing unit 434 determines whether or not the motor 10 is abnormal based on the determination result obtained by the stable sub-period determination processing unit 433 performing the stable sub-period determination process. Specifically, the motor determination processing unit 434 determines that the operation of the motor 10 is abnormal when the determination value is larger than a predetermined value (hereinafter, referred to as “determination threshold value”) by executing the motor determination processing.
- the motor determination processing unit 434 determines that the operation of the motor 10 is normal when the determination value is equal to or less than the determination threshold value by executing the motor determination process.
- the determination value is the ratio of the number of unstable sub-periods to the sum of the number of unstable sub-periods and the number of stable sub-periods.
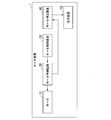
- FIG. 6 is a diagram illustrating an example of a flow of a determination process executed by the motor determination device 40 according to the embodiment.
- the current value acquisition unit 41 acquires current value information (step S101).
- the RMS value acquisition unit 42 executes an RMS value acquisition process (step S102).
- the statistic acquisition processing unit 432 executes the statistic acquisition processing based on the current value information after the RMS value acquisition processing is executed in step S102 (step S103).
- the stable sub period determination processing unit 433 executes the stable sub period determination process (step S104).
- the motor determination processing unit 434 executes motor determination processing (step S105).
- step S102 does not necessarily have to be executed.
- the statistic amount acquisition processing unit 432 in the process of step S103 executes the statistic amount acquisition process based on the current value information acquired in the process of step S101.
- the normal distribution is a Gaussian distribution.
- the determination statistic is varMD2.
- the determination unit 43 determines whether or not each sub period satisfies the stability condition based on not only varMD2 but also CIV for the current value change amount in the stable sub period determination process. ..
- FIG. 7 is a diagram illustrating an example of a flow of stable sub-period determination processing according to the embodiment.
- the determination unit 43 has already executed the statistic acquisition process in step S103 of FIG.
- the determination unit 43 has already acquired the CIV for the current value change amount for each sub period in step S103 of FIG. That is, in the flowchart shown in FIG. 7, the determination unit 43 has already acquired varMD2 for the current value change amount distribution in the sub period and CIV for the current value change amount in each sub period.
- the stable sub period determination processing unit 433 determines whether or not one sub period is a stable sub period.
- the stable sub-period determination processing unit 433 executes the processing flow shown in the flowchart of FIG. 7 for each sub-period.
- the sub-period to be determined by the stable sub-period determination processing unit 433 for determining whether or not the stability condition is satisfied is referred to as a determination sub-period.
- the stable sub-period determination processing unit 433 determines whether the varMD2 difference is larger than a predetermined threshold value for varMD2 (hereinafter referred to as “varMD2 threshold value”) (step S201).
- the varMD2 difference is the difference between varMD2 for the current value change amount distribution within the sub-period and varMD2 for the normal distribution.
- the stable sub-period determination processing unit 433 determines whether or not the CIV difference is larger than a predetermined threshold value (hereinafter referred to as “CIV threshold value”) regarding V civ . Yes (step S202).
- the CIV difference is the difference between V civ and the predetermined CIV with respect to the current value change amount distribution within the sub-period.
- the predetermined CIV determined in advance is, for example, the CIV for the current value variation distribution within the sub-period when the operation of the motor 10 is normal.
- the predetermined CIV determined in advance is an example of the randomness comparison value.
- the CIV threshold is an example of a randomness difference threshold.
- step S202 when the CIV difference is less than or equal to the CIV threshold (step S202: NO), the stable sub-period determination processing unit 433 determines that the determination target sub-period is the stable sub-period (step S204).
- step S201 when the varMD2 difference is less than or equal to the varMD2 threshold value in step S201 (step S201: NO), the stable sub-period determination processing unit 433 determines whether the CIV difference is greater than the CIV threshold value (step S205). When the CIV difference is larger than the CIV threshold value (step S205: YES), the stable sub period determination processing unit 433 determines that the determination target sub period is an unstable sub period (step S206). On the other hand, when the CIV difference is less than or equal to the CIV threshold in step S205 (step S205: NO), the stable sub period determination processing unit 433 determines that the determination target sub period is the stable sub period (step S207).
- Figure 8 is a diagram showing an example of experimental results showing the distribution of the value V civ varMD2 the CIV for the current value change amount distribution in an embodiment.
- the horizontal axis of FIG. 8 represents the CIV value V civ with respect to the distribution of the current value change amount.
- the vertical axis of FIG. 8 represents varMD2 with respect to the distribution of the current value change amount.
- Figure 8 shows the distribution of values V civ and varMD2 when operation of the motor 10 is normal, and a distribution of values V civ and varMD2 when operation of the motor 10 is normal. 8, the average value of the distribution of the values V civ and varMD2 when operation of the motor 10 is abnormal to have a value greater than the average value of the distribution of the values V civ and varMD2 when operation of the motor 10 is normal Indicates.
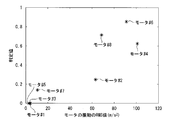
- FIG. 9 is a diagram illustrating an example of an experimental result of the determination value in the embodiment.
- the horizontal axis of FIG. 9 represents the motor 10 to be determined by the motor determination device 40.
- the vertical axis of FIG. 9 represents the judgment value.
- the determination threshold is 0.1.
- FIG. 9 shows experimental results of determination values for eight motors 10 of motors #1 to #8.
- FIG. 9 shows that the determination values of the motor #1, the motor #3, the motor #5, and the motor #7 are equal to or less than the determination threshold value.
- FIG. 9 shows that the determination values of the motor #2, the motor #4, the motor #6, and the motor #8 are larger than the determination threshold value.
- FIG. 10 is a figure which shows the 1st example of the experimental result of the RMS value of the electric current value in embodiment.
- FIG. 10A shows the experimental result of the RMS value of the current value when the operation of the motor #9 is normal.
- the motor #9 is an example of the motor 10.
- the horizontal axis of FIG. 10A represents time.
- the vertical axis of FIG. 10A represents the RMS value of the current value.
- FIG. 10B shows the experimental result of the RMS value of the current value when the operation of the motor #9 is abnormal. When the operation of the motor #9 is abnormal, it means that the amount of the lubricant is less than the predetermined amount.
- the horizontal axis of FIG. 10B represents time.
- 10B represents the RMS value of the current value.
- 10A and 10B when the operation of the motor #9 is abnormal, the RMS value of the current value is steeper than the RMS value of the current value when the operation of the motor #9 is normal. It indicates that there are time zones that show significant changes. Further, when the operation of the motor #9 is abnormal, it means that the RMS value of the current value is larger than the RMS value of the current value when the operation of the motor #9 is normal.
- FIG. 11 is a figure which shows the 2nd example of the experimental result of the RMS value of the electric current value in embodiment.
- FIG. 11A shows the experimental result of the RMS value of the current value when the operation of the motor #10 is normal.
- the motor #10 is an example of the motor 10.
- the horizontal axis of FIG. 11A represents time.
- the vertical axis in FIG. 11A represents the RMS value of the current value.
- FIG. 11B shows the experimental result of the RMS value of the current value when the operation of the motor #10 is abnormal. When the operation of the motor #10 is abnormal, it means the state of the motor #10 in which the amount of the lubricant is less than the predetermined amount.
- the horizontal axis of FIG. 11B represents time.
- the vertical axis of FIG. 11A shows the experimental result of the RMS value of the current value when the operation of the motor #10 is abnormal.
- 11B represents the RMS value of the current value.
- 11A and 11B when the operation of the motor #10 is abnormal, the RMS value of the current value is steeper than the RMS value of the current value when the operation of the motor #10 is normal. It indicates that there are time zones that show significant changes. Further, when the operation of the motor #10 is abnormal, it means that the RMS value of the current value is larger than the RMS value of the current value when the operation of the motor #10 is normal.
- FIG. 12 is a figure which shows the 3rd example of the experimental result of the RMS value of the electric current value in embodiment.
- FIG. 12A shows the experimental result of the RMS value of the current value when the operation of the motor #11 is normal.
- the motor #11 is an example of the motor 10.
- the horizontal axis of FIG. 12A represents time.
- the vertical axis of FIG. 12A represents the RMS value of the current value.
- FIG. 12B shows the experimental result of the RMS value of the current value when the operation of the motor #11 is abnormal. When the operation of the motor #11 is abnormal, it means the state of the motor #11 in which the amount of the lubricant is less than the predetermined amount.
- the horizontal axis of FIG. 12B represents time.
- 12B represents the RMS value of the current value. 12A and 12B show that when the operation of the motor #11 is abnormal, the RMS value of the current value is steeper than the RMS value of the current value when the operation of the motor #11 is normal. It indicates that there are time zones that show significant changes.
- FIG. 13 is a figure which shows the 4th example of the experimental result of the RMS value of the electric current value in embodiment.
- FIG. 13A shows the experimental result of the RMS value of the current value when the operation of the motor #12 is normal.
- the motor #12 is an example of the motor 10.
- the horizontal axis of FIG. 13A represents time.
- the vertical axis of FIG. 13A represents the RMS value of the current value.
- FIG. 13B shows the experimental result of the RMS value of the current value when the operation of the motor #12 is abnormal. When the operation of the motor #12 is abnormal, it means the state of the motor #12 in which the lubricant is less than the predetermined amount.
- the horizontal axis of FIG. 13B represents time.
- 13B represents the RMS value of the current value.
- 13A and 13B show that when the operation of the motor #12 is abnormal, the RMS value of the current value is steeper than the RMS value of the current value when the operation of the motor #12 is normal. It indicates that there are time zones that show significant changes. Further, when the operation of the motor #12 is abnormal, the RMS value of the current value is smaller than the RMS value of the current value when the operation of the motor #12 is normal.
- FIG. 14 is a figure which shows the 1st example of the experimental result of the electric current value change amount in embodiment.
- FIG. 14A shows the experimental result of the current value change amount when the operation of the motor #9 is normal.
- the horizontal axis of FIG. 14A represents time.
- the vertical axis of FIG. 14A represents the amount of change in current value.
- FIG. 14B shows the experimental result of the current value change amount when the operation of the motor #9 is abnormal.
- the horizontal axis of FIG. 14B represents time.
- the vertical axis of FIG. 14B represents the amount of change in current value.
- 14A and 14B show that when the operation of the motor #9 is abnormal, the change in the current value is steeper than the change in the current value when the operation of the motor #9 is normal. Indicates that there is a time zone that indicates.
- FIG. 15 is a diagram showing a second example of the experimental result of the current value change amount in the embodiment.
- FIG. 15A shows the experimental result of the current value change amount when the operation of the motor #10 is normal.
- the horizontal axis of FIG. 15A represents time.
- the vertical axis in FIG. 15A represents the amount of change in current value.
- FIG. 15B shows the experimental result of the current value change amount when the operation of the motor #10 is abnormal.
- the horizontal axis of FIG. 15B represents time.
- the vertical axis of FIG. 15B represents the amount of change in current value.
- FIGS. 15A and 15B show that when the operation of the motor #10 is abnormal, the change amount of the current value is steeper than the change amount of the current value when the operation of the motor #10 is normal. Indicates that there is a time zone that indicates.
- FIG. 16 is a diagram showing a third example of the experimental result of the current value change amount in the embodiment.
- FIG. 16A shows the experimental result of the current value change amount when the operation of the motor #11 is normal.
- the horizontal axis of FIG. 16A represents time.
- the vertical axis of FIG. 16A represents the amount of change in current value.
- FIG. 16B shows the experimental result of the current value change amount when the operation of the motor #11 is abnormal.
- the horizontal axis of FIG. 16B represents time.
- the vertical axis in FIG. 16B represents the amount of change in current value.
- 16A and 16B show that when the operation of the motor #11 is abnormal, the change amount of the current value is steeper than the change amount of the current value when the operation of the motor #11 is normal. Indicates that there is a time zone that indicates.
- FIG. 17 is a diagram showing a fourth example of the experiment result of the current value change amount in the embodiment.
- FIG. 17A shows the experimental result of the current value change amount when the operation of the motor #12 is normal.
- the horizontal axis of FIG. 17A represents time.
- the vertical axis in FIG. 17A represents the amount of change in current value.
- FIG. 17B shows the experimental result of the current value change amount when the operation of the motor #12 is abnormal.
- the horizontal axis of FIG. 17B represents time.
- the vertical axis in FIG. 17B represents the amount of change in current value.
- 17A and 17B show that when the operation of the motor #12 is abnormal, the change in the current value is steeper than the change in the current value when the operation of the motor #12 is normal. Indicates that there is a time zone that indicates.
- FIG. 18 is a diagram illustrating a first example of the determination result by the stable sub period determination processing unit 433 in the embodiment.
- FIG. 18A shows a determination result by the stable sub period determination processing unit 433 when the operation of the motor #9 is normal.
- the horizontal axis of FIG. 18A represents time.
- the vertical axis of FIG. 18A represents the RMS value of the current value.
- FIG. 18A shows that the stable sub-period determination processing unit 433 determines that the sub-period of 30 hours in 30 hours is the stable sub-period.
- FIG. 18B shows a determination result by the stable sub period determination processing unit 433 when the operation of the motor #9 is abnormal.
- the horizontal axis of FIG. 18B represents time.
- FIG. 18B represents the RMS value of the current value.
- FIG. 18B shows that the stable sub-period determination processing unit 433 determines that the sub-period of approximately 22 hours in 30 hours is an unstable sub-period and the sub-period of approximately 8 hours is a stable sub-period.
- Show. 18A and 18B show that when the operation of the motor #9 is abnormal, the unstable sub-period is determined by the stable sub-period determination processing unit 433 more than when the operation of the motor #9 is normal. It is shown that the frequency is judged to be high.
- FIG. 19 is a diagram showing a second example of the determination result by the stable sub period determination processing unit 433 in the embodiment.
- FIG. 19A shows a determination result by the stable sub period determination processing unit 433 when the operation of the motor #10 is normal.
- the horizontal axis of FIG. 19A represents time.
- the vertical axis of FIG. 19A represents the RMS value of the current value.
- FIG. 19A shows that the stable sub-period determination processing unit 433 determines that the 30-hour sub-period of 30 hours is the stable sub-period.
- FIG. 19B shows a determination result by the stable sub period determination processing unit 433 when the operation of the motor #10 is abnormal.
- the horizontal axis of FIG. 19B represents time.
- FIG. 19B represents the RMS value of the current value.
- FIG. 19B shows a period having a length of approximately 5 hours with the time origin being the start time of the period, and a period of approximately 10 hours having the time approximately 11 hours after the time origin as the period start time. Indicates that the stable sub-period is determined by the stable sub-period determination processing unit 433.
- a period is approximately 5 hours in length with a time approximately 5 hours after the time origin being a period start time, and a time approximately 25 hours after the time origin is a period start time.
- the period of approximately 5 hours indicates that the stable sub-period determination processing unit 433 has determined that the period is a stable sub-period.
- 19A and 19B show that when the operation of the motor #10 is abnormal, the unstable sub-period is determined by the stable sub-period determination processing unit 433 more than when the operation of the motor #10 is normal. It is shown that the frequency is judged to be high.
- FIG. 20 is a diagram showing a third example of the determination result by the stable sub period determination processing unit 433 in the embodiment.
- FIG. 20A shows the determination result by the stable sub period determination processing unit 433 when the operation of the motor #11 is normal.
- the horizontal axis of FIG. 20A represents time.
- the vertical axis in FIG. 20A represents the RMS value of the current value.
- FIG. 20A shows that the stable sub-period determination processing unit 433 determines that the 30-hour sub-period of 30 hours is the stable sub-period.
- FIG. 20B shows the determination result by the stable sub period determination processing unit 433 when the operation of the motor #11 is abnormal.
- the horizontal axis of FIG. 20B represents time.
- FIG. 20B represents the RMS value of the current value.
- FIG. 20B shows that the stable sub-period determination processing unit 433 determines that the 30-hour sub-period of 30 hours is an unstable sub-period.
- 20A and 20B show that when the operation of the motor #11 is abnormal, the unstable sub-period is determined by the stable sub-period determination processing unit 433 more than when the operation of the motor #11 is normal. It is shown that the frequency is judged to be high.
- FIG. 21 is a diagram illustrating a fourth example of the determination result by the stable sub period determination processing unit 433 in the embodiment.
- FIG. 21A shows the determination result by the stable sub period determination processing unit 433 when the operation of the motor #12 is normal.
- the horizontal axis of FIG. 21A represents time.
- the vertical axis in FIG. 21A represents the RMS value of the current value.
- FIG. 21A shows that the stable sub-period determination processing unit 433 determines that the sub-period of 30 hours in 30 hours is the stable sub-period.
- FIG. 21B shows the determination result by the stable sub period determination processing unit 433 when the operation of the motor #12 is abnormal.
- the horizontal axis of FIG. 21B represents time.
- FIG. 21B represents the RMS value of the current value.
- FIG. 21B shows a period having a length of about 8 hours with the time origin being the start time of the period, and a period having a length of about 15 hours having the time about 15 hours after the time origin as the start time of the period.
- Indicates that the stable sub-period is determined by the stable sub-period determination processing unit 433.
- the stable sub-period determination processing unit 433 determines that the period is a stable sub-period having a length of approximately 7 hours with the time approximately 8 hours after the time origin as the start time of the period.
- FIG. 22 is a figure which shows the 1st example of the experimental result which shows the relationship between the RMS value of the vibration of the motor 10 in an embodiment, and a determination value.
- the horizontal axis of FIG. 22 represents the RMS value of the vibration of the motor 10.
- the vertical axis of FIG. 22 represents the judgment value.
- FIG. 22 shows the relationship between the RMS value of the vibrations of the motors #1 to #8 and the determination value when the sub time is 2 hours.
- FIG. 22 shows that the magnitude of the RMS value of vibration and the magnitude of the determination value have a positive correlation.
- FIG. 23 is a diagram showing a second example of experimental results showing the relationship between the RMS value of vibration of the motor 10 and the determination value in the embodiment.
- the horizontal axis of FIG. 23 represents the RMS value of the vibration of the motor 10.
- the vertical axis of FIG. 23 represents the judgment value.
- FIG. 23 shows the relationship between the RMS value of the vibrations of the motors #1 to #8 and the determination value when the sub time is 4 hours.
- FIG. 23 shows that the magnitude of the RMS value of vibration and the magnitude of the determination value have a positive correlation.
- FIG. 24 is a diagram showing a third example of experimental results showing the relationship between the RMS value of vibration of the motor 10 and the determination value in the embodiment.
- the horizontal axis of FIG. 24 represents the RMS value of the vibration of the motor 10.
- the vertical axis of FIG. 24 represents the judgment value.
- FIG. 24 shows the relationship between the RMS value of the vibrations of the motors #1 to #8 and the determination value when the sub time is 6 hours.
- FIG. 24 shows that the magnitude of the RMS value of vibration and the magnitude of the determination value have a positive correlation.
- FIG. 25 is a diagram showing a first example of experimental results showing the sub-time dependency of the judgment value in the embodiment.
- the horizontal axis of FIG. 25 indicates the sub time.
- the vertical axis of FIG. 25 represents the judgment value.
- FIG. 25 shows experimental results of experiments performed on four motors 10 from motor #13 to motor #16.
- the motors #13 to #16 are fan motors having a fan size of 80 mm.
- the motor #13 and the motor #14 are the motor 10 that operates normally.
- the motor #15 and the motor #16 are the motors 10 in which the amount of the lubricant is a predetermined amount or less and the operation is abnormal.
- FIG. 25 shows that the determination values for the motor #13 and the motor #14 are substantially constant regardless of the sub time.
- FIG. 25 shows that the determination values for the motor #15 and the motor #16 become smaller as the sub time becomes longer.
- FIG. 26 is a diagram showing a second example of the experimental result showing the sub-time dependency of the judgment value in the embodiment.
- the horizontal axis of FIG. 26 represents the sub time.
- the vertical axis of FIG. 26 represents the judgment value.
- FIG. 26 shows experimental results of experiments conducted on ten motors 10 from motor #17 to motor #26.
- the motors #17 to #26 are fan motors having a fan size of 40 mm.
- the motor #25 is the motor 10 that operates normally.
- the motors #17 to #24 and #26 are the motors 10 in which the amount of the lubricant is a predetermined amount or less and the operation is abnormal.
- FIG. 26 shows that the determination value for the motor #25 is substantially constant regardless of the sub time.
- FIG. 26 shows that the determination values for the motors #17 to #24 and #26 become smaller as the sub time becomes longer.
- the motor device 1 of the embodiment configured in this way compares the distribution of the current value change amount with the normal distribution.
- the normal distribution is a distribution that represents the dispersion of a physical quantity that changes randomly and is a well-known distribution. Therefore, the motor device 1 of the embodiment configured as described above detects the abnormality of the motor 10 based on the distribution of the current value change amount without using the learning result previously learned regarding the value of the physical quantity indicating the abnormality of the motor. can do. Further, the motor device 1 of the embodiment configured as described above detects an abnormality of the motor 10 by comparing the distribution of the current value change amount and the predetermined distribution. Therefore, the motor device 1 of the embodiment configured as described above can detect the abnormality of the motor 10 even when the sampling frequency for acquiring the current value is low.
- the motor device 1 of the embodiment configured as described above does not detect the abnormality of the motor 10 even when it is determined whether or not the operation of the motor 10 is normal by a calculation device such as a microcomputer having a low calculation ability. This has the effect of being able to detect.
- the motor control device 30 and the motor determination device 40 in the above-described embodiment may be realized by a computer.
- the program for realizing this function may be recorded in a computer-readable recording medium, and the program recorded in this recording medium may be read by a computer system and executed.
- the “computer system” mentioned here includes an OS and hardware such as peripheral devices.
- the “computer-readable recording medium” refers to a portable medium such as a flexible disk, a magneto-optical disk, a ROM, a CD-ROM, or a storage device such as a hard disk built in a computer system.
- the "computer-readable recording medium” means to hold a program dynamically for a short time like a communication line when transmitting the program through a network such as the Internet or a communication line such as a telephone line.
- a volatile memory inside a computer system that serves as a server or a client in that case, which holds a program for a certain period of time may be included.
- the program may be for realizing a part of the functions described above, or may be a program that can realize the functions described above in combination with a program already recorded in a computer system, It may be realized using a programmable logic device such as FPGA (Field Programmable Gate Array).
- the motor determination device 40 may be implemented by using a plurality of information processing devices that are communicatively connected via a network.
- the functional units included in the motor determination device 40 may be distributed and implemented in a plurality of information processing devices.
- the current value acquisition unit 41, the RMS value acquisition unit 42, the current value change amount acquisition processing unit 431, and the determination unit 43 may be implemented in different information processing devices.
- the current value acquisition unit 41, the RMS value acquisition unit 42, the current value change amount acquisition processing unit 431, and the determination unit 43 may be implemented in different information processing devices.
- the predetermined CIV determined in advance is an example of the first value.
- the CIV threshold is an example of the second value.
Landscapes
- Physics & Mathematics (AREA)
- General Physics & Mathematics (AREA)
- Control Of Electric Motors In General (AREA)
- Testing Electric Properties And Detecting Electric Faults (AREA)
- Tests Of Circuit Breakers, Generators, And Electric Motors (AREA)
Abstract
本発明の一態様は、モータに電流が印加される期間である主期間内の各時刻における前記電流の電流値を示す電流値情報を取得する電流値取得部と、前記電流値情報が示す時刻tにおける前記電流値を電流値i(t)とし(tは実数)、前記電流値情報が示す前記時刻tの経過時間Δt時間後の時刻(t+Δt)における前記電流値を電流値i(t+Δt)とし、前記電流値i(t)と前記電流値i(t+Δt)との差を時刻tにおける電流値変化量として、前記電流値変化量の分布とランダムな変化をする物理量の分散を表す分布である正常分布との違いに基づいて、前記モータの動作が正常か否かを判定する判定部と、を備える判定装置である。
Description
本発明は、判定装置、モータ装置及びプログラムに関する。
これまで、ファンモータの異常を検知する技術が提案されている(米国特許出願公開第2008/0309366号明細書および米国特許出願公開第2014/0111218号明細書を参照)。これらの提案された技術は、ファンモータが異常である際に生じる振動や電流値等の物理量の値が検出されたか否かによってファンモータの異常を検知する技術である。
従来のモータの異常を検知する技術は、例えばファンモータが異常である際に生じる物理量の値を予め装置が学習しておく必要があり、学習の時間が必要という問題があった。また、このような問題はファンモータだけに限らずモータ全般に共通する問題であった。
上記事情に鑑み、本発明は、モータの異常を示す物理量の値の学習に要する時間を軽減するとともにモータの異常を検知する技術を提供することを目的としている。
本発明の一態様は、モータに電流が印加される期間である主期間内の各時刻における前記電流の電流値を示す電流値情報を取得する電流値取得部と、前記電流値情報が示す時刻tにおける前記電流値を電流値i(t)とし(tは実数)、前記電流値情報が示す前記時刻tの経過時間Δt時間後の時刻(t+Δt)における前記電流値を電流値i(t+Δt)とし、前記電流値i(t)と前記電流値i(t+Δt)との差を時刻tにおける電流値変化量として、前記電流値変化量の分布とランダムな変化をする物理量の分散を表す分布である正常分布との違いに基づいて、前記モータの動作が正常か否かを判定する判定部と、を備える判定装置である。
本発明の一態様は、上記の判定装置であって、前記判定部は、前記主期間内の期間である複数の副期間であって前記主期間の長さの半分以下の長さの期間である複数の副期間ごとに、前記副期間における前記電流値変化量の分布に対する所定の統計量の値を取得する統計量取得処理部と、前記正常分布と前記副期間における前記電流値変化量の分布との違いが所定の大きさ以下であることを前記所定の統計量の値が示すか否かを前記副期間ごとに判定する安定副期間判定処理部と、前記安定副期間判定処理部の判定結果に基づいて前記モータの動作が正常か否かを判定するモータ判定処理部と、を備える。
本発明の一態様は、上記の判定装置であって、前記正常分布と前記副期間における前記電流値変化量の分布との違いが所定の大きさ以下であることを前記所定の統計量の値が示すと前記安定副期間判定処理部によって判定された前記副期間を安定副期間とし、前記正常分布と前記副期間における前記電流値変化量の分布との違いが所定の大きさよりも大きいことを前記所定の統計量の値が示すと前記安定副期間判定処理部によって判定された前記副期間を不安定副期間として、前記モータ判定処理部は、前記安定副期間の数と前記不安定副期間の数との和に対する前記安定副期間の数が所定の値よりも大きい場合に前記モータの動作が正常であると判定し、前記モータ判定処理部は、前記安定副期間の数と前記不安定副期間の数との和に対する前記安定副期間の数が前記所定の値以下である場合に前記モータの動作が異常であると判定する。
本発明の一態様は、上記の判定装置であって、前記正常分布は、ガウス分布である。
本発明の一態様は、上記の判定装置であって、前記所定の統計量は、MD(Mahalanobis' Distance)の2乗の分布の分散をvarMD2として、varMD2である。
本発明の一態様は、上記の判定装置であって、前記安定副期間判定処理部は、さらに、前記電流値又は前記電流値変化量の乱雑さを示す値に基づいて、前記モータの動作が正常か否かを判定する。
本発明の一態様は、上記の判定装置であって、前記安定副期間判定処理部は、MD(Mahalanobis' Distance)の2乗の分布の分散をvarMD2として、前記副期間における前記電流値変化量の分布に対するvarMD2とガウス分布に対するvarMD2との差であるvarMD2差がvarMD2閾値よりも大きく、前記副期間における前記電流値変化量の分布に対するCIVの値と予め定められた第1の値との差であるCIV差が予め定められた第2の値よりも大きい場合に前記副期間は前記不安定副期間であると判定し、前記varMD2差が前記varMD2閾値よりも大きく、前記CIV差が前記第2の値以下である場合に前記副期間は前記安定副期間であると判定し、前記varMD2差が前記varMD2閾値以下であって、前記CIV差が前記第2の値より大きい場合に前記副期間は前記不安定副期間であると判定し、前記varMD2差が前記varMD2閾値以下であって、前記CIV差が前記第2の値以下である場合に前記副期間は前記安定副期間であると判定する。
本発明の一態様は、モータと、前記モータに電流が印加される期間である主期間内の各時刻における前記電流の電流値を示す電流値情報を取得する電流値取得部と、前記電流値情報が示す時刻tにおける前記電流値を電流値i(t)とし(tは実数)、前記電流値情報が示す前記時刻tの経過時間Δt時間後の時刻(t+Δt)における前記電流値を電流値i(t+Δt)とし、前記電流値i(t)と前記電流値i(t+Δt)との差を電流値変化量として、前記電流値変化量の分布と正常分布との違いに基づいて、前記モータの動作が正常か否かを判定する判定部と、を備えるモータ装置である。
本発明の一態様は、上記の判定装置としてコンピュータを機能させるためのプログラムである。
本発明により、本構成を有しない場合と比較し、モータの異常を示す物理量の値の学習に要する時間を軽減するとともにモータの異常を検知することが可能となる。
以下、実施形態の判定装置、モータ装置及びプログラムを、図面を参照して説明する。
図1は、実施形態のモータ装置1の機能構成の一例を示す図である。
モータ装置1は、モータ10、モータ制御回路20、モータ制御装置30、モータ判定装置40及び出力装置50を備える。
モータ10は、電力の供給を受けて回転することでトルクを発生する。すなわち、モータ10は、電気エネルギーを運動エネルギーに変換する。モータ10は、モータであればどのようなモータであってもよく、例えば、ブラシレスモータであってもよいし、ステッピングモータであってもよい。モータ10は、例えば、ファンモータであってもよい。
図1は、実施形態のモータ装置1の機能構成の一例を示す図である。
モータ装置1は、モータ10、モータ制御回路20、モータ制御装置30、モータ判定装置40及び出力装置50を備える。
モータ10は、電力の供給を受けて回転することでトルクを発生する。すなわち、モータ10は、電気エネルギーを運動エネルギーに変換する。モータ10は、モータであればどのようなモータであってもよく、例えば、ブラシレスモータであってもよいし、ステッピングモータであってもよい。モータ10は、例えば、ファンモータであってもよい。
モータ制御回路20は、半導体スイッチ等のスイッチを備えモータ10に接続された回路である。モータ制御回路20は、スイッチのオン/オフによって整形された所定の波形の電流をモータ10に印加することでモータ10を回転させる。
モータ制御装置30は、モータ制御回路20を制御することでモータ10の動作を制御する。モータ制御装置30は、例えば、モータ制御回路20が備えるスイッチのオン/オフを制御することで、モータ10の回転を制御する。
モータ判定装置40は、モータ10に印加される電流の各時刻における電流値に基づいてモータ10の動作が異常か否かを判定する。なお、モータ10の動作が異常であるとは、例えば、潤滑剤の固化や潤滑剤の減少やベアリングの変形等のモータ10の回転を阻害する要因によってモータ10の回転に要するエネルギーが所定の値以上であるようなモータ10の状態である。
出力装置50は、モータ判定装置40の判定結果を出力する。出力装置50は、モータ判定装置40の判定結果を出力可能であればどのようなものであってもよい。出力装置50は、CRT(Cathode Ray Tube)ディスプレイや液晶ディスプレイ、有機EL(Electro-Luminescence)ディスプレイ等の表示装置を含んで構成されてもよい。出力装置50は、これらの表示装置を自装置に接続するインタフェースとして構成されてもよい。出力装置50は例えば、LED(light emitting diode)であってもよい。モータ判定装置40がLEDである場合、出力装置50は、例えば、LEDの点滅のパターンによってモータ10の動作が異常か否かを示してもよい。
図2は、実施形態におけるモータ判定装置40の機能構成の一例を示す図である。
モータ判定装置40は、バスで接続されたCPU(Central Processing Unit)やメモリや補助記憶装置などを備え、プログラムを実行する。モータ判定装置40は、プログラムの実行によって電流値取得部41、RMS値取得部42及び判定部43を備える装置として機能する。
モータ判定装置40は、バスで接続されたCPU(Central Processing Unit)やメモリや補助記憶装置などを備え、プログラムを実行する。モータ判定装置40は、プログラムの実行によって電流値取得部41、RMS値取得部42及び判定部43を備える装置として機能する。
電流値取得部41は、電流値情報を取得する。電流値情報は、モータ10に印加される電流の主期間内の各時刻における電流値を示す情報である。主期間は、モータ10に電流が印加される期間であって予め定められた期間であればどのような期間であってもよく、例えば、モータ10に電流が印加され始めてから36時間であってもよい。
モータ判定装置40は、例えば、モータ制御回路20を流れる電流を取得することで、電流値情報を取得する。モータ制御回路20を流れる電流は、モータ制御回路20上の予め定められた測定箇所を流れる電流である。測定箇所は、例えば、抵抗値の小さな所定の抵抗が位置する箇所である。所定の抵抗は、例えば、シャント抵抗であってもよい。所定の抵抗は、例えば、モータ10に供給する電力の電力源(不図示)とアース線との間に配置されたシャント抵抗であってもよい。小さな抵抗値は、例えば0.1Ωである。
モータ判定装置40は、例えば、モータ制御回路20を流れる電流を取得することで、電流値情報を取得する。モータ制御回路20を流れる電流は、モータ制御回路20上の予め定められた測定箇所を流れる電流である。測定箇所は、例えば、抵抗値の小さな所定の抵抗が位置する箇所である。所定の抵抗は、例えば、シャント抵抗であってもよい。所定の抵抗は、例えば、モータ10に供給する電力の電力源(不図示)とアース線との間に配置されたシャント抵抗であってもよい。小さな抵抗値は、例えば0.1Ωである。
図3は、実施形態におけるモータ10に印加される電流の主期間内の各時刻における電流値の一例を示す図である。
図3の横軸は、時刻を表す。図3の縦軸は、電流値を表す。図3は、0秒から10秒までに、モータ制御回路20の測定箇所を流れる電流の電流値の変化を表す。
図3の横軸は、時刻を表す。図3の縦軸は、電流値を表す。図3は、0秒から10秒までに、モータ制御回路20の測定箇所を流れる電流の電流値の変化を表す。
図2の説明に戻る。
RMS値取得部42は、RMS値取得処理を実行する。RMS値取得処理は、電流値情報に基づいて、電流値情報が示す電流値のRMS時間におけるRMS(root mean square)値を取得する処理である。RMS時間は、予め定められた時間である。RMS時間は、主期間の長さ(以下「主時間」という。)の半分よりも短ければどのような時間であってもよい。例えば主時間が35時間である場合、RMS時間は、例えば、1分であってもよい。以下、説明の簡単のためRMS時間は、1分であると仮定する。以下、RMS値取得処理によって取得されたRMS値の各時刻における値を示す情報を、以下説明の簡単のため、電流値情報という。
RMS値取得部42は、RMS値取得処理を実行する。RMS値取得処理は、電流値情報に基づいて、電流値情報が示す電流値のRMS時間におけるRMS(root mean square)値を取得する処理である。RMS時間は、予め定められた時間である。RMS時間は、主期間の長さ(以下「主時間」という。)の半分よりも短ければどのような時間であってもよい。例えば主時間が35時間である場合、RMS時間は、例えば、1分であってもよい。以下、説明の簡単のためRMS時間は、1分であると仮定する。以下、RMS値取得処理によって取得されたRMS値の各時刻における値を示す情報を、以下説明の簡単のため、電流値情報という。
以下、電流値情報が示す電流値の変化量を電流値変化量という。具体的には、時刻tにおける電流値変化量は、電流値情報が示す時刻tにおける電流値i(t)と、電流値情報が示す電流値であって時刻tの経過時間Δt時間後の時刻(t+Δt)における電流値i(t+Δt)との差である。なお、時刻tは実数である。
以下、説明の簡単のため、時刻tにおける電流値変化量は、電流値i(t+Δt)から電流値i(t)を引き算した値であると仮定する。以下、i(t+Δt)-i(t)を電流値変化量d(t)という。
経過時間Δtは、RMS時間以上であって主時間の半分よりも短い時間であればどのような時間であってもよく、例えば、RMS時間であってもよい。以下、説明の簡単のため、経過時間ΔtはRMS時間であると仮定する。
経過時間Δtは、RMS時間以上であって主時間の半分よりも短い時間であればどのような時間であってもよく、例えば、RMS時間であってもよい。以下、説明の簡単のため、経過時間ΔtはRMS時間であると仮定する。
判定部43を説明する。
判定部43は、判定処理を実行する。判定処理は、電流値変化量の分布と正常分布との違いに基づいて、モータ10が異常な動作をしているか否かを判定部43が判定する処理である。
判定部43は、判定処理を実行する。判定処理は、電流値変化量の分布と正常分布との違いに基づいて、モータ10が異常な動作をしているか否かを判定部43が判定する処理である。
正常分布は、ランダムな変化をする物理量の分散を表す分布であって、電流値変化量の分布に対して定義可能な統計量が定義可能な分布である。なお、ランダムな変化をする物理量の分散を表す分布は、例えば、ガウス分布であってもよいし、F分布であってもよいし、カイ二乗分布であってもよい。
以下、経過時間Δtより長く主時間の半分以下の時間を副時間という。副時間の長さは、予め定められた長さである。副時間は、例えば、経過時間Δtが1分であって主時間が35時間である場合には、副時間は、例えば、6時間であってもよいし、5時間であってもよい。
以下説明の簡単のため、副時間は、6時間であると仮定する。
以下、副時間における電流値変化量の分布と正常分布との違いが所定の大きさより大きいという事象を異常電流事象という。
以下説明の簡単のため、副時間は、6時間であると仮定する。
以下、副時間における電流値変化量の分布と正常分布との違いが所定の大きさより大きいという事象を異常電流事象という。
判定処理によって判定部43は、主期間内において異常電流事象が生じる頻度が所定の値よりも大きい場合に、モータ10の動作が異常であると判定する。
以下、主期間内の期間であって長さが副時間である期間を副期間という。副期間の定義より、主期間内には少なくとも2つの副期間が含まれる。
以下、副期間における電流値変化量の分布を副期間内電流値変化量分布という。
以下、副期間における電流値変化量の分布を副期間内電流値変化量分布という。
図4は、実施形態における副期間の一例を示す図である。
図4の横軸は、時刻を表す。図4の縦軸は、電流値のRMS値を表す。図4は、35時間の間に4つの副期間が存在することを示す。図4において電流値のRMS値は、0.35A以上0.45A未満の値である。
図4の横軸は、時刻を表す。図4の縦軸は、電流値のRMS値を表す。図4は、35時間の間に4つの副期間が存在することを示す。図4において電流値のRMS値は、0.35A以上0.45A未満の値である。
図5は、実施形態の主期間内電流値変化量情報が示す各時刻における電流値変化量と副期間との関係の一例を示す図である。主期間内電流値変化量情報は、主期間内の各時刻における電流値変化量を示す情報である。
図5の横軸は、時刻を表す。図5の縦軸は、主期間内電流値変化量情報が示す電流値変化量を示す。図5は、35時間の間に4つの副期間が存在することを示す。図5において、電流値変化量は、約-0.01Aから約0.01Aの間の値である。
図5の横軸は、時刻を表す。図5の縦軸は、主期間内電流値変化量情報が示す電流値変化量を示す。図5は、35時間の間に4つの副期間が存在することを示す。図5において、電流値変化量は、約-0.01Aから約0.01Aの間の値である。
図2の説明に戻る。
判定部43は、電流値変化量取得処理部431、統計量取得処理部432、安定副期間判定処理部433及びモータ判定処理部434を備える。
判定部43は、電流値変化量取得処理部431、統計量取得処理部432、安定副期間判定処理部433及びモータ判定処理部434を備える。
電流値変化量取得処理部431は、電流値変化量取得処理を実行する。電流値変化量取得処理は、電流値情報に基づいて、電流値変化量取得処理部431が主期間内の各時刻における電流値変化量を取得する処理である。
統計量取得処理部432は、統計量取得処理を実行する。統計量取得処理は、所定の方式にしたがい、複数の副期間ごとに副期間内電流値変化量分布に対する所定の統計量の値を統計量取得処理部432が取得する処理である。
以下、所定の統計量を判定用統計量という。判定用統計量は必ずしも1つではなく、複数であってもよい。判定用統計量は、正常分布に対しても定義可能な統計量であって、副時間における副期間内電流値変化量分布に応じて値が変化する統計量であればどのような統計量であってもよい。判定用統計量は、例えば、MD(Mahalanobis' Distance;マハラノビス距離)の2乗の分布の分散であってもよい。以下、MDの2乗の分布の分散をvarMD2という。
所定の方式は、例えば、第1方式であってもよい。第1方式は、時刻t_(n)の副時間後の時刻を時刻t_(n+1)とし、時刻t_(n)を開始時刻とする副期間を第1方式第n副期間として、全ての第1方式第n副期間において判定用統計量の値を取得する方式である。なお、nは整数である。
所定の方式は、例えば、第2方式であってもよい。第2方式は、時刻t_(n)の第2方式時間後の時刻を時刻t_(n+1)として、時刻t_(n)を開始時刻とする副期間を第2方式第n副期間として、全ての第2方式第n副期間において判定用統計量の値を取得する方式である。
なお、第2方式時間は、副時間の半分の時間である。
以下、説明の簡単のため、所定の方式は第1方式であると仮定する。
所定の方式は、例えば、第2方式であってもよい。第2方式は、時刻t_(n)の第2方式時間後の時刻を時刻t_(n+1)として、時刻t_(n)を開始時刻とする副期間を第2方式第n副期間として、全ての第2方式第n副期間において判定用統計量の値を取得する方式である。
なお、第2方式時間は、副時間の半分の時間である。
以下、説明の簡単のため、所定の方式は第1方式であると仮定する。
安定副期間判定処理部433は、安定副期間判定処理を実行する。安定副期間判定処理は、各副期間の判定用統計量の値に基づいて、各副期間がそれぞれ安定条件を満たすか否かを安定副期間判定処理部433が判定する処理である。
安定条件は、正常分布と副期間における電流値変化量の分布との違いが所定の大きさ以下であることを判定用統計量の値が示すという条件であればどのような条件であってもよい。安定条件は、例えば、副期間における判定用統計量の値と正常分布に対する判定用統計量の値との差が閾値以下という条件である。
安定条件は、正常分布と副期間における電流値変化量の分布との違いが所定の大きさ以下であることを判定用統計量の値が示すという条件であればどのような条件であってもよい。安定条件は、例えば、副期間における判定用統計量の値と正常分布に対する判定用統計量の値との差が閾値以下という条件である。
なお、安定副期間判定処理部433は、安定副期間判定処理において、各副期間の判定用統計量の値だけでなく、さらに、電流値又は電流値変化量の乱雑さに関する所定の条件に基づいて、各副期間がそれぞれ安定条件を満たすか否かを判定してもよい。以下、このように動作する安定副期間判定処理部433を、変形判定処理部という。電流値又は電流値変化量の乱雑さに関する所定の条件は、例えば、乱雑値と予め定められた値である乱雑比較値との差が予め定められた値である乱雑差閾値以下という条件であってもよい。乱雑値は、電流値又は電流値変化量の乱雑さを示す値である。乱雑値は、例えば、電流値変化量に対するCV(Coefficient of Variation)であってもよい。乱雑値は、例えば、電流値変化量に対するCIV(Coefficient of Increment Variation)であってもよい。
CIVは、以下の式(1)によって表される値Vcivである。
CIVは、以下の式(1)によって表される値Vcivである。

式(1)において、s(di)は、副期間内電流値変化量分布の標準偏差を表す。式(1)において、<i>は、電流RMSの平均値を表す。
以下、安定副期間判定処理部433が変形判定処理部である場合、統計量取得処理部432が副期間ごとに乱雑値を取得してもよい。以下、安定副期間判定処理部433が変形判定処理部である場合、統計量取得処理部432が副期間ごとに乱雑値を取得すると仮定する。
以下、安定副期間判定処理部433によって安定条件を満たすと判定された副期間の数を安定副期間という。以下、安定副期間判定処理部433によって安定条件を満たさないと判定された副期間の数を不安定副期間という。
モータ判定処理部434は、モータ判定処理を実行する。モータ判定処理は、安定副期間判定処理部433による安定副期間判定処理の実行によって取得された判定結果に基づいて、モータ10が異常か否かをモータ判定処理部434が判定する処理である。
具体的には、モータ判定処理部434はモータ判定処理の実行によって、判定値が所定の値(以下「判定閾値」という。)より大きい場合に、モータ10の動作が異常であると判定する。モータ判定処理部434はモータ判定処理の実行によって、判定値が判定閾値以下である場合に、モータ10の動作が正常であると判定する。判定値は、不安定副期間の数と安定副期間の数との和に対する不安定副期間の数の比である。
具体的には、モータ判定処理部434はモータ判定処理の実行によって、判定値が所定の値(以下「判定閾値」という。)より大きい場合に、モータ10の動作が異常であると判定する。モータ判定処理部434はモータ判定処理の実行によって、判定値が判定閾値以下である場合に、モータ10の動作が正常であると判定する。判定値は、不安定副期間の数と安定副期間の数との和に対する不安定副期間の数の比である。
図6は、実施形態におけるモータ判定装置40が実行する判定処理の流れの一例を示す図である。
電流値取得部41は、電流値情報を取得する(ステップS101)。RMS値取得部42が、RMS値取得処理を実行する(ステップS102)。ステップS102の次に、ステップS102によってRMS値取得処理が実行された後の電流値情報に基づいて、統計量取得処理部432が、統計量取得処理を実行する(ステップS103)。安定副期間判定処理部433が、安定副期間判定処理を実行する(ステップS104)。モータ判定処理部434が、モータ判定処理を実行する(ステップS105)。
なお、ステップS102の処理は必ずしも実行されなくてもよい。ステップS102の処理が実行されない場合、ステップS103の処理において統計量取得処理部432は、ステップS101の処理において取得された電流値情報に基づいて、統計量取得処理を実行する。
ここで、図7を用いて、図6におけるステップS104において判定部43が実行する安定副期間判定処理の流れの一例をより具体的に説明する。図7においては、正常分布がガウス分布であると仮定する。図7においては、判定用統計量がvarMD2であると仮定する。図7においては、判定部43は、安定副期間判定処理において、varMD2だけでなく、さらに、電流値変化量に対するCIVに基づいて各副期間がそれぞれ安定条件を満たすか否かを判定すると仮定する。
図7は、実施形態における安定副期間判定処理の流れの一例を示す図である。図7に示すフローチャートにおいて、判定部43は、図6のステップS103によって既に統計量取得処理を実行済みである。また、図7に示すフローチャートにおいて、判定部43は、図6のステップS103において、既に副期間ごとの電流値変化量に対するCIVを取得済みである。すなわち、図7に示すフローチャートにおいて、判定部43は既に副期間内電流値変化量分布に対するvarMD2と各副期間における電流値変化量に対するCIVとを取得済みである。
また、説明の簡単のため、図7に示すフローチャートは、安定副期間判定処理部433が、ひとつの副期間に対して安定副期間であるか否かを判定する処理の流れを示すフローチャートであると仮定する。複数の副期間に対して安定副期間であるか否かを判定する場合には、安定副期間判定処理部433は、図7のフローチャートが示す処理の流れを各副期間に対して実行する。
以下、安定副期間判定処理部433が安定条件を満たすか否かを判定する判定対象の副期間を判定対象副期間という。
また、説明の簡単のため、図7に示すフローチャートは、安定副期間判定処理部433が、ひとつの副期間に対して安定副期間であるか否かを判定する処理の流れを示すフローチャートであると仮定する。複数の副期間に対して安定副期間であるか否かを判定する場合には、安定副期間判定処理部433は、図7のフローチャートが示す処理の流れを各副期間に対して実行する。
以下、安定副期間判定処理部433が安定条件を満たすか否かを判定する判定対象の副期間を判定対象副期間という。
安定副期間判定処理部433は、varMD2差がvarMD2に関する所定の閾値(以下「varMD2閾値」という。)より大きいか否かを判定する(ステップS201)。varMD2差は、副期間内電流値変化量分布に対するvarMD2と正常分布に対するvarMD2との差である。varMD2差がvarMD2閾値よりも大きい場合(ステップS201:YES)、安定副期間判定処理部433は、CIV差がVcivに関する所定の閾値(以下「CIV閾値」という。)より大きいか否かを判定する(ステップS202)。CIV差は、副期間内電流値変化量分布に対するVcivと予め定められた所定のCIVとの差である。予め定められた所定のCIVは、例えば、モータ10の動作が正常な場合における副期間内電流値変化量分布に対するCIVである。予め定められた所定のCIVは、乱雑比較値の一例である。CIV閾値は、乱雑差閾値の一例である。CIV差がCIV閾値よりも大きい場合(ステップS202:YES)、安定副期間判定処理部433は判定対象副期間が不安定副期間であると判定する(ステップS203)。
一方、ステップS202において、CIV差がCIV閾値以下である場合(ステップS202:NO)、安定副期間判定処理部433は判定対象副期間が安定副期間であると判定する(ステップS204)。
一方、ステップS201において、varMD2差がvarMD2閾値以下である場合(ステップS201:NO)、安定副期間判定処理部433はCIV差がCIV閾値より大きいか否かを判定する(ステップS205)。CIV差がCIV閾値より大きい場合(ステップS205:YES)、安定副期間判定処理部433は判定対象副期間が不安定副期間であると判定する(ステップS206)。
一方、ステップS205において、CIV差がCIV閾値以下である場合(ステップS205:NO)、安定副期間判定処理部433は判定対象副期間が安定副期間であると判定する(ステップS207)。
一方、ステップS205において、CIV差がCIV閾値以下である場合(ステップS205:NO)、安定副期間判定処理部433は判定対象副期間が安定副期間であると判定する(ステップS207)。
図8は、実施形態における電流値変化量の分布に対するCIVの値VcivvarMD2との分布を示す実験結果の一例を示す図である。 図8の横軸は、電流値変化量の分布に対するCIVの値Vcivを表す。図8の縦軸は、電流値変化量の分布に対するvarMD2を表す。図8は、モータ10の動作が正常な場合における値Vciv及びvarMD2の分布と、モータ10の動作が正常な場合における値Vciv及びvarMD2の分布とを示す。
図8は、モータ10の動作が異常な場合における値Vciv及びvarMD2の分布の平均値はモータ10の動作が正常な場合における値Vciv及びvarMD2の分布の平均値よりも大きな値を有することを示す。
図8は、モータ10の動作が異常な場合における値Vciv及びvarMD2の分布の平均値はモータ10の動作が正常な場合における値Vciv及びvarMD2の分布の平均値よりも大きな値を有することを示す。
図9は、実施形態における判定値の実験結果の一例を示す図である。
図9の横軸は、モータ判定装置40の判定対象のモータ10を表す。図9の縦軸は、判定値を表す。図9において、判定閾値は0.1である。
図9は、モータ#1~モータ#8の8つのモータ10に対する判定値の実験結果を示す。図9は、モータ#1、モータ#3、モータ#5及びモータ#7の判定値が判定閾値以下であることを示す。図9は、モータ#2、モータ#4、モータ#6及びモータ#8の判定値が判定閾値より大きいことを示す。
図9の横軸は、モータ判定装置40の判定対象のモータ10を表す。図9の縦軸は、判定値を表す。図9において、判定閾値は0.1である。
図9は、モータ#1~モータ#8の8つのモータ10に対する判定値の実験結果を示す。図9は、モータ#1、モータ#3、モータ#5及びモータ#7の判定値が判定閾値以下であることを示す。図9は、モータ#2、モータ#4、モータ#6及びモータ#8の判定値が判定閾値より大きいことを示す。
図10は、実施形態における電流値のRMS値の実験結果の第1の例を示す図である。
図10(A)は、モータ#9の動作が正常な場合における電流値のRMS値の実験結果を示す。モータ#9は、モータ10の一例である。図10(A)の横軸は時刻を表す。図10(A)の縦軸は、電流値のRMS値を表す。図10(B)は、モータ#9の動作が異常な場合における電流値のRMS値の実験結果を示す。モータ#9の動作が異常な場合は、潤滑剤が所定の量よりも減少しているモータ#9の状態である。図10(B)の横軸は時刻を表す。図10(B)の縦軸は、電流値のRMS値を表す。
図10(A)と図10(B)とは、モータ#9の動作が異常な場合には、モータ#9の動作が正常な場合における電流値のRMS値よりも電流値のRMS値が急峻な変化を示す時間帯があることを示す。また、モータ#9の動作が異常な場合には、電流値のRMS値が、モータ#9の動作が正常な場合における電流値のRMS値よりも大きいことを示す。
図10(A)は、モータ#9の動作が正常な場合における電流値のRMS値の実験結果を示す。モータ#9は、モータ10の一例である。図10(A)の横軸は時刻を表す。図10(A)の縦軸は、電流値のRMS値を表す。図10(B)は、モータ#9の動作が異常な場合における電流値のRMS値の実験結果を示す。モータ#9の動作が異常な場合は、潤滑剤が所定の量よりも減少しているモータ#9の状態である。図10(B)の横軸は時刻を表す。図10(B)の縦軸は、電流値のRMS値を表す。
図10(A)と図10(B)とは、モータ#9の動作が異常な場合には、モータ#9の動作が正常な場合における電流値のRMS値よりも電流値のRMS値が急峻な変化を示す時間帯があることを示す。また、モータ#9の動作が異常な場合には、電流値のRMS値が、モータ#9の動作が正常な場合における電流値のRMS値よりも大きいことを示す。
図11は、実施形態における電流値のRMS値の実験結果の第2の例を示す図である。
図11(A)は、モータ#10の動作が正常な場合における電流値のRMS値の実験結果を示す。モータ#10は、モータ10の一例である。図11(A)の横軸は時刻を表す。図11(A)の縦軸は、電流値のRMS値を表す。
図11(B)は、モータ#10の動作が異常な場合における電流値のRMS値の実験結果を示す。モータ#10の動作が異常な場合は、潤滑剤が所定の量よりも減少しているモータ#10の状態である。図11(B)の横軸は時刻を表す。図11(B)の縦軸は、電流値のRMS値を表す。
図11(A)と図11(B)とは、モータ#10の動作が異常な場合には、モータ#10の動作が正常な場合における電流値のRMS値よりも電流値のRMS値が急峻な変化を示す時間帯があることを示す。また、モータ#10の動作が異常な場合には、電流値のRMS値が、モータ#10の動作が正常な場合における電流値のRMS値よりも大きいことを示す。
図11(A)は、モータ#10の動作が正常な場合における電流値のRMS値の実験結果を示す。モータ#10は、モータ10の一例である。図11(A)の横軸は時刻を表す。図11(A)の縦軸は、電流値のRMS値を表す。
図11(B)は、モータ#10の動作が異常な場合における電流値のRMS値の実験結果を示す。モータ#10の動作が異常な場合は、潤滑剤が所定の量よりも減少しているモータ#10の状態である。図11(B)の横軸は時刻を表す。図11(B)の縦軸は、電流値のRMS値を表す。
図11(A)と図11(B)とは、モータ#10の動作が異常な場合には、モータ#10の動作が正常な場合における電流値のRMS値よりも電流値のRMS値が急峻な変化を示す時間帯があることを示す。また、モータ#10の動作が異常な場合には、電流値のRMS値が、モータ#10の動作が正常な場合における電流値のRMS値よりも大きいことを示す。
図12は、実施形態における電流値のRMS値の実験結果の第3の例を示す図である。
図12(A)は、モータ#11の動作が正常な場合における電流値のRMS値の実験結果を示す。モータ#11は、モータ10の一例である。図12(A)の横軸は時刻を表す。図12(A)の縦軸は、電流値のRMS値を表す。
図12(B)は、モータ#11の動作が異常な場合における電流値のRMS値の実験結果を示す。モータ#11の動作が異常な場合は、潤滑剤が所定の量よりも減少しているモータ#11の状態である。図12(B)の横軸は時刻を表す。図12(B)の縦軸は、電流値のRMS値を表す。
図12(A)と図12(B)とは、モータ#11の動作が異常な場合には、モータ#11の動作が正常な場合における電流値のRMS値よりも電流値のRMS値が急峻な変化を示す時間帯があることを示す。
図12(A)は、モータ#11の動作が正常な場合における電流値のRMS値の実験結果を示す。モータ#11は、モータ10の一例である。図12(A)の横軸は時刻を表す。図12(A)の縦軸は、電流値のRMS値を表す。
図12(B)は、モータ#11の動作が異常な場合における電流値のRMS値の実験結果を示す。モータ#11の動作が異常な場合は、潤滑剤が所定の量よりも減少しているモータ#11の状態である。図12(B)の横軸は時刻を表す。図12(B)の縦軸は、電流値のRMS値を表す。
図12(A)と図12(B)とは、モータ#11の動作が異常な場合には、モータ#11の動作が正常な場合における電流値のRMS値よりも電流値のRMS値が急峻な変化を示す時間帯があることを示す。
図13は、実施形態における電流値のRMS値の実験結果の第4の例を示す図である。
図13(A)は、モータ#12の動作が正常な場合における電流値のRMS値の実験結果を示す。モータ#12は、モータ10の一例である。図13(A)の横軸は時刻を表す。図13(A)の縦軸は、電流値のRMS値を表す。
図13(B)は、モータ#12の動作が異常な場合における電流値のRMS値の実験結果を示す。モータ#12の動作が異常な場合は、潤滑剤が所定の量よりも減少しているモータ#12の状態である。図13(B)の横軸は時刻を表す。図13(B)の縦軸は、電流値のRMS値を表す。
図13(A)と図13(B)とは、モータ#12の動作が異常な場合には、モータ#12の動作が正常な場合における電流値のRMS値よりも電流値のRMS値が急峻な変化を示す時間帯があることを示す。また、モータ#12の動作が異常な場合には、電流値のRMS値が、モータ#12の動作が正常な場合における電流値のRMS値よりも小さいことを示す。
図13(A)は、モータ#12の動作が正常な場合における電流値のRMS値の実験結果を示す。モータ#12は、モータ10の一例である。図13(A)の横軸は時刻を表す。図13(A)の縦軸は、電流値のRMS値を表す。
図13(B)は、モータ#12の動作が異常な場合における電流値のRMS値の実験結果を示す。モータ#12の動作が異常な場合は、潤滑剤が所定の量よりも減少しているモータ#12の状態である。図13(B)の横軸は時刻を表す。図13(B)の縦軸は、電流値のRMS値を表す。
図13(A)と図13(B)とは、モータ#12の動作が異常な場合には、モータ#12の動作が正常な場合における電流値のRMS値よりも電流値のRMS値が急峻な変化を示す時間帯があることを示す。また、モータ#12の動作が異常な場合には、電流値のRMS値が、モータ#12の動作が正常な場合における電流値のRMS値よりも小さいことを示す。
図14は、実施形態における電流値変化量の実験結果の第1の例を示す図である。
図14(A)は、モータ#9の動作が正常な場合における電流値変化量の実験結果を示す。図14(A)の横軸は、時刻を表す。図14(A)の縦軸は、電流値変化量を表す。
図14(B)は、モータ#9の動作が異常な場合における電流値変化量の実験結果を示す。図14(B)の横軸は、時刻を表す。図14(B)の縦軸は、電流値変化量を表す。
図14(A)と図14(B)とは、モータ#9の動作が異常な場合には、モータ#9の動作が正常な場合における電流値変化量よりも電流値変化量が急峻な変化を示す時間帯があることを示す。
図14(A)は、モータ#9の動作が正常な場合における電流値変化量の実験結果を示す。図14(A)の横軸は、時刻を表す。図14(A)の縦軸は、電流値変化量を表す。
図14(B)は、モータ#9の動作が異常な場合における電流値変化量の実験結果を示す。図14(B)の横軸は、時刻を表す。図14(B)の縦軸は、電流値変化量を表す。
図14(A)と図14(B)とは、モータ#9の動作が異常な場合には、モータ#9の動作が正常な場合における電流値変化量よりも電流値変化量が急峻な変化を示す時間帯があることを示す。
図15は、実施形態における電流値変化量の実験結果の第2の例を示す図である。
図15(A)は、モータ#10の動作が正常な場合における電流値変化量の実験結果を示す。図15(A)の横軸は、時刻を表す。図15(A)の縦軸は、電流値変化量を表す。
図15(B)は、モータ#10の動作が異常な場合における電流値変化量の実験結果を示す。図15(B)の横軸は、時刻を表す。図15(B)の縦軸は、電流値変化量を表す。
図15(A)と図15(B)とは、モータ#10の動作が異常な場合には、モータ#10の動作が正常な場合における電流値変化量よりも電流値変化量が急峻な変化を示す時間帯があることを示す。
図15(A)は、モータ#10の動作が正常な場合における電流値変化量の実験結果を示す。図15(A)の横軸は、時刻を表す。図15(A)の縦軸は、電流値変化量を表す。
図15(B)は、モータ#10の動作が異常な場合における電流値変化量の実験結果を示す。図15(B)の横軸は、時刻を表す。図15(B)の縦軸は、電流値変化量を表す。
図15(A)と図15(B)とは、モータ#10の動作が異常な場合には、モータ#10の動作が正常な場合における電流値変化量よりも電流値変化量が急峻な変化を示す時間帯があることを示す。
図16は、実施形態における電流値変化量の実験結果の第3の例を示す図である。
図16(A)は、モータ#11の動作が正常な場合における電流値変化量の実験結果を示す。図16(A)の横軸は、時刻を表す。図16(A)の縦軸は、電流値変化量を表す。
図16(B)は、モータ#11の動作が異常な場合における電流値変化量の実験結果を示す。図16(B)の横軸は、時刻を表す。図16(B)の縦軸は、電流値変化量を表す。
図16(A)と図16(B)とは、モータ#11の動作が異常な場合には、モータ#11の動作が正常な場合における電流値変化量よりも電流値変化量が急峻な変化を示す時間帯があることを示す。
図16(A)は、モータ#11の動作が正常な場合における電流値変化量の実験結果を示す。図16(A)の横軸は、時刻を表す。図16(A)の縦軸は、電流値変化量を表す。
図16(B)は、モータ#11の動作が異常な場合における電流値変化量の実験結果を示す。図16(B)の横軸は、時刻を表す。図16(B)の縦軸は、電流値変化量を表す。
図16(A)と図16(B)とは、モータ#11の動作が異常な場合には、モータ#11の動作が正常な場合における電流値変化量よりも電流値変化量が急峻な変化を示す時間帯があることを示す。
図17は、実施形態における電流値変化量の実験結果の第4の例を示す図である。
図17(A)は、モータ#12の動作が正常な場合における電流値変化量の実験結果を示す。図17(A)の横軸は、時刻を表す。図17(A)の縦軸は、電流値変化量を表す。
図17(B)は、モータ#12の動作が異常な場合における電流値変化量の実験結果を示す。図17(B)の横軸は、時刻を表す。図17(B)の縦軸は、電流値変化量を表す。
図17(A)と図17(B)とは、モータ#12の動作が異常な場合には、モータ#12の動作が正常な場合における電流値変化量よりも電流値変化量が急峻な変化を示す時間帯があることを示す。
図17(A)は、モータ#12の動作が正常な場合における電流値変化量の実験結果を示す。図17(A)の横軸は、時刻を表す。図17(A)の縦軸は、電流値変化量を表す。
図17(B)は、モータ#12の動作が異常な場合における電流値変化量の実験結果を示す。図17(B)の横軸は、時刻を表す。図17(B)の縦軸は、電流値変化量を表す。
図17(A)と図17(B)とは、モータ#12の動作が異常な場合には、モータ#12の動作が正常な場合における電流値変化量よりも電流値変化量が急峻な変化を示す時間帯があることを示す。
図18は、実施形態における安定副期間判定処理部433による判定結果の第1の例を示す図である。
図18(A)は、モータ#9の動作が正常な場合における安定副期間判定処理部433による判定結果を示す。図18(A)の横軸は、時刻を表す。図18(A)の縦軸は、電流値のRMS値を表す。図18(A)は、30時間中の30時間の副期間が安定副期間であると安定副期間判定処理部433によって判定されたことを示す。
図18(B)は、モータ#9の動作が異常な場合における安定副期間判定処理部433による判定結果を示す。図18(B)の横軸は、時刻を表す。図18(B)の縦軸は、電流値のRMS値を表す。図18(B)は、30時間中の略22時間の副期間が不安定副期間であり略8時間の副期間が安定副期間であると安定副期間判定処理部433によって判定されたことを示す。
図18(A)と図18(B)とは、モータ#9の動作が異常な場合には、モータ#9の動作が正常な場合よりも、安定副期間判定処理部433によって不安定副期間と判定される頻度が高いことを示す。
図18(A)は、モータ#9の動作が正常な場合における安定副期間判定処理部433による判定結果を示す。図18(A)の横軸は、時刻を表す。図18(A)の縦軸は、電流値のRMS値を表す。図18(A)は、30時間中の30時間の副期間が安定副期間であると安定副期間判定処理部433によって判定されたことを示す。
図18(B)は、モータ#9の動作が異常な場合における安定副期間判定処理部433による判定結果を示す。図18(B)の横軸は、時刻を表す。図18(B)の縦軸は、電流値のRMS値を表す。図18(B)は、30時間中の略22時間の副期間が不安定副期間であり略8時間の副期間が安定副期間であると安定副期間判定処理部433によって判定されたことを示す。
図18(A)と図18(B)とは、モータ#9の動作が異常な場合には、モータ#9の動作が正常な場合よりも、安定副期間判定処理部433によって不安定副期間と判定される頻度が高いことを示す。
図19は、実施形態における安定副期間判定処理部433による判定結果の第2の例を示す図である。
図19(A)は、モータ#10の動作が正常な場合における安定副期間判定処理部433による判定結果を示す。図19(A)の横軸は、時刻を表す。図19(A)の縦軸は、電流値のRMS値を表す。図19(A)は、30時間中の30時間の副期間が安定副期間であると安定副期間判定処理部433によって判定されたことを示す。
図19(B)は、モータ#10の動作が異常な場合における安定副期間判定処理部433による判定結果を示す。図19(B)の横軸は、時刻を表す。図19(B)の縦軸は、電流値のRMS値を表す。図19(B)は、時間原点を期間の開始時刻とする長さ略5時間を期間と、時間原点から略11時間後の時刻を期間の開始時刻とする長さ略10時間の期間と、が不安定副期間であると安定副期間判定処理部433によって判定されたことを示す。
また、図19(B)は、時間原点から略5時間後の時刻を期間の開始時刻とする長さ略5時間を期間と、時間原点から略25時間後の時刻を期間の開始時刻とする長さ略5時間の期間と、が安定副期間であると安定副期間判定処理部433によって判定されたことを示す。 図19(A)と図19(B)とは、モータ#10の動作が異常な場合には、モータ#10の動作が正常な場合よりも、安定副期間判定処理部433によって不安定副期間と判定される頻度が高いことを示す。
図19(A)は、モータ#10の動作が正常な場合における安定副期間判定処理部433による判定結果を示す。図19(A)の横軸は、時刻を表す。図19(A)の縦軸は、電流値のRMS値を表す。図19(A)は、30時間中の30時間の副期間が安定副期間であると安定副期間判定処理部433によって判定されたことを示す。
図19(B)は、モータ#10の動作が異常な場合における安定副期間判定処理部433による判定結果を示す。図19(B)の横軸は、時刻を表す。図19(B)の縦軸は、電流値のRMS値を表す。図19(B)は、時間原点を期間の開始時刻とする長さ略5時間を期間と、時間原点から略11時間後の時刻を期間の開始時刻とする長さ略10時間の期間と、が不安定副期間であると安定副期間判定処理部433によって判定されたことを示す。
また、図19(B)は、時間原点から略5時間後の時刻を期間の開始時刻とする長さ略5時間を期間と、時間原点から略25時間後の時刻を期間の開始時刻とする長さ略5時間の期間と、が安定副期間であると安定副期間判定処理部433によって判定されたことを示す。 図19(A)と図19(B)とは、モータ#10の動作が異常な場合には、モータ#10の動作が正常な場合よりも、安定副期間判定処理部433によって不安定副期間と判定される頻度が高いことを示す。
図20は、実施形態における安定副期間判定処理部433による判定結果の第3の例を示す図である。
図20(A)は、モータ#11の動作が正常な場合における安定副期間判定処理部433による判定結果を示す。図20(A)の横軸は、時刻を表す。図20(A)の縦軸は、電流値のRMS値を表す。図20(A)は、30時間中の30時間の副期間が安定副期間であると安定副期間判定処理部433によって判定されたことを示す。
図20(B)は、モータ#11の動作が異常な場合における安定副期間判定処理部433による判定結果を示す。図20(B)の横軸は、時刻を表す。図20(B)の縦軸は、電流値のRMS値を表す。図20(B)は、30時間中の30時間の副期間が不安定副期間であると安定副期間判定処理部433によって判定されたことを示す。
図20(A)と図20(B)とは、モータ#11の動作が異常な場合には、モータ#11の動作が正常な場合よりも、安定副期間判定処理部433によって不安定副期間と判定される頻度が高いことを示す。
図20(A)は、モータ#11の動作が正常な場合における安定副期間判定処理部433による判定結果を示す。図20(A)の横軸は、時刻を表す。図20(A)の縦軸は、電流値のRMS値を表す。図20(A)は、30時間中の30時間の副期間が安定副期間であると安定副期間判定処理部433によって判定されたことを示す。
図20(B)は、モータ#11の動作が異常な場合における安定副期間判定処理部433による判定結果を示す。図20(B)の横軸は、時刻を表す。図20(B)の縦軸は、電流値のRMS値を表す。図20(B)は、30時間中の30時間の副期間が不安定副期間であると安定副期間判定処理部433によって判定されたことを示す。
図20(A)と図20(B)とは、モータ#11の動作が異常な場合には、モータ#11の動作が正常な場合よりも、安定副期間判定処理部433によって不安定副期間と判定される頻度が高いことを示す。
図21は、実施形態における安定副期間判定処理部433による判定結果の第4の例を示す図である。
図21(A)は、モータ#12の動作が正常な場合における安定副期間判定処理部433による判定結果を示す。図21(A)の横軸は、時刻を表す。図21(A)の縦軸は、電流値のRMS値を表す。図21(A)は、30時間中の30時間の副期間が安定副期間であると安定副期間判定処理部433によって判定されたことを示す。
図21(B)は、モータ#12の動作が異常な場合における安定副期間判定処理部433による判定結果を示す。図21(B)の横軸は、時刻を表す。図21(B)の縦軸は、電流値のRMS値を表す。図21(B)は、時間原点を期間の開始時刻とする長さ略8時間を期間と、時間原点から略15時間後の時刻を期間の開始時刻とする長さ略15時間の期間と、が不安定副期間であると安定副期間判定処理部433によって判定されたことを示す。
また、図21(B)は、時間原点から略8時間後の時刻を期間の開始時刻とする長さ略7時間を期間、が安定副期間であると安定副期間判定処理部433によって判定されたことを示す。
図21(A)と図21(B)とは、モータ#11の動作が異常な場合には、モータ#11の動作が正常な場合よりも、安定副期間判定処理部433によって不安定副期間と判定される頻度が高いことを示す。
図21(A)は、モータ#12の動作が正常な場合における安定副期間判定処理部433による判定結果を示す。図21(A)の横軸は、時刻を表す。図21(A)の縦軸は、電流値のRMS値を表す。図21(A)は、30時間中の30時間の副期間が安定副期間であると安定副期間判定処理部433によって判定されたことを示す。
図21(B)は、モータ#12の動作が異常な場合における安定副期間判定処理部433による判定結果を示す。図21(B)の横軸は、時刻を表す。図21(B)の縦軸は、電流値のRMS値を表す。図21(B)は、時間原点を期間の開始時刻とする長さ略8時間を期間と、時間原点から略15時間後の時刻を期間の開始時刻とする長さ略15時間の期間と、が不安定副期間であると安定副期間判定処理部433によって判定されたことを示す。
また、図21(B)は、時間原点から略8時間後の時刻を期間の開始時刻とする長さ略7時間を期間、が安定副期間であると安定副期間判定処理部433によって判定されたことを示す。
図21(A)と図21(B)とは、モータ#11の動作が異常な場合には、モータ#11の動作が正常な場合よりも、安定副期間判定処理部433によって不安定副期間と判定される頻度が高いことを示す。
図22は、実施形態におけるモータ10の振動のRMS値と判定値との関係を示す実験結果の第1の例を示す図である。
図22の横軸は、モータ10の振動のRMS値を表す。図22の縦軸は、判定値を表す。図22は、副時間が2時間である場合におけるモータ#1~モータ#8の振動のRMS値と判定値との関係を示す。
図22は、振動のRMS値の大きさと判定値の大きさとは正の相関を有することを示す。
図22の横軸は、モータ10の振動のRMS値を表す。図22の縦軸は、判定値を表す。図22は、副時間が2時間である場合におけるモータ#1~モータ#8の振動のRMS値と判定値との関係を示す。
図22は、振動のRMS値の大きさと判定値の大きさとは正の相関を有することを示す。
図23は、実施形態におけるモータ10の振動のRMS値と判定値との関係を示す実験結果の第2の例を示す図である。
図23の横軸は、モータ10の振動のRMS値を表す。図23の縦軸は、判定値を表す。図23は、副時間が4時間である場合におけるモータ#1~モータ#8の振動のRMS値と判定値との関係を示す。
図23は、振動のRMS値の大きさと判定値の大きさとは正の相関を有することを示す。
図23の横軸は、モータ10の振動のRMS値を表す。図23の縦軸は、判定値を表す。図23は、副時間が4時間である場合におけるモータ#1~モータ#8の振動のRMS値と判定値との関係を示す。
図23は、振動のRMS値の大きさと判定値の大きさとは正の相関を有することを示す。
図24は、実施形態におけるモータ10の振動のRMS値と判定値との関係を示す実験結果の第3の例を示す図である。
図24の横軸は、モータ10の振動のRMS値を表す。図24の縦軸は、判定値を表す。図24は、副時間が6時間である場合におけるモータ#1~モータ#8の振動のRMS値と判定値との関係を示す。
図24は、振動のRMS値の大きさと判定値の大きさとは正の相関を有することを示す。
図24の横軸は、モータ10の振動のRMS値を表す。図24の縦軸は、判定値を表す。図24は、副時間が6時間である場合におけるモータ#1~モータ#8の振動のRMS値と判定値との関係を示す。
図24は、振動のRMS値の大きさと判定値の大きさとは正の相関を有することを示す。
図25は、実施形態における判定値の副時間依存性を示す実験結果の第1の例を示す図である。
図25の横軸は、副時間を示す。図25の縦軸は、判定値を示す。図25は、モータ#13~モータ#16までの4つのモータ10に対して実施された実験の実験結果を示す。モータ#13~モータ#16はファンサイズが80mmのファンモータである。モータ#13及びモータ#14は、動作が正常なモータ10である。モータ#15及びモータ#16は、潤滑剤の量が所定の量以下であって動作が異常なモータ10である。
図25は、モータ#13及びモータ#14に対する判定値は副時間によらず略一定であることを示す。図25は、モータ#15及びモータ#16に対する判定値は副時間が長くなるほど小さくなることを示す。
図25の横軸は、副時間を示す。図25の縦軸は、判定値を示す。図25は、モータ#13~モータ#16までの4つのモータ10に対して実施された実験の実験結果を示す。モータ#13~モータ#16はファンサイズが80mmのファンモータである。モータ#13及びモータ#14は、動作が正常なモータ10である。モータ#15及びモータ#16は、潤滑剤の量が所定の量以下であって動作が異常なモータ10である。
図25は、モータ#13及びモータ#14に対する判定値は副時間によらず略一定であることを示す。図25は、モータ#15及びモータ#16に対する判定値は副時間が長くなるほど小さくなることを示す。
図26は、実施形態における判定値の副時間依存性を示す実験結果の第2の例を示す図である。
図26の横軸は、副時間を示す。図26の縦軸は、判定値を示す。図26は、モータ#17~モータ#26までの10のモータ10に対して実施された実験の実験結果を示す。モータ#17~モータ#26はファンサイズが40mmのファンモータである。
モータ#25は、動作が正常なモータ10である。モータ#17~モータ#24及び#26は、潤滑剤の量が所定の量以下であって動作が異常なモータ10である。
図26は、モータ#25に対する判定値は副時間によらず略一定であることを示す。図26は、モータ#17~モータ#24及び#26に対する判定値は副時間が長くなるほど小さくなることを示す。
図26の横軸は、副時間を示す。図26の縦軸は、判定値を示す。図26は、モータ#17~モータ#26までの10のモータ10に対して実施された実験の実験結果を示す。モータ#17~モータ#26はファンサイズが40mmのファンモータである。
モータ#25は、動作が正常なモータ10である。モータ#17~モータ#24及び#26は、潤滑剤の量が所定の量以下であって動作が異常なモータ10である。
図26は、モータ#25に対する判定値は副時間によらず略一定であることを示す。図26は、モータ#17~モータ#24及び#26に対する判定値は副時間が長くなるほど小さくなることを示す。
このように構成された実施形態のモータ装置1は、電流値変化量の分布と正常分布とを比較する。正常分布は、ランダムな変化をする物理量の分散を表す分布であって一般によく知られた分布である。そのため、このように構成された実施形態のモータ装置1は、モータの異常を示す物理量の値に関して予め学習された学習結果を用いることなく電流値変化量の分布に基づいてモータ10の異常を検知することができる。
また、このように構成された実施形態のモータ装置1は、電流値変化量の分布と所定の分布とを比較によってモータ10の異常を検知する。そのため、このように構成された実施形態のモータ装置1は、電流値を取得するサンプリング周波数が低い場合であってもモータ10の異常を検知することできる。このため、このように構成された実施形態のモータ装置1は、演算能力の高くないマイコン等の演算装置によってモータ10の動作が正常か否かを判定する場合であってもモータ10の異常を検知することができるという効果を奏する。
また、このように構成された実施形態のモータ装置1は、電流値変化量の分布と所定の分布とを比較によってモータ10の異常を検知する。そのため、このように構成された実施形態のモータ装置1は、電流値を取得するサンプリング周波数が低い場合であってもモータ10の異常を検知することできる。このため、このように構成された実施形態のモータ装置1は、演算能力の高くないマイコン等の演算装置によってモータ10の動作が正常か否かを判定する場合であってもモータ10の異常を検知することができるという効果を奏する。
(変形例)
なお、上述した実施形態におけるモータ制御装置30及びモータ判定装置40をコンピュータで実現するようにしてもよい。その場合、この機能を実現するためのプログラムをコンピュータ読み取り可能な記録媒体に記録して、この記録媒体に記録されたプログラムをコンピュータシステムに読み込ませ、実行することによって実現してもよい。なお、ここでいう「コンピュータシステム」とは、OSや周辺機器等のハードウェアを含むものとする。また、「コンピュータ読み取り可能な記録媒体」とは、フレキシブルディスク、光磁気ディスク、ROM、CD-ROM等の可搬媒体、コンピュータシステムに内蔵されるハードディスク等の記憶装置のことをいう。さらに「コンピュータ読み取り可能な記録媒体」とは、インターネット等のネットワークや電話回線等の通信回線を介してプログラムを送信する場合の通信線のように、短時間の間、動的にプログラムを保持するもの、その場合のサーバやクライアントとなるコンピュータシステム内部の揮発性メモリのように、一定時間プログラムを保持しているものも含んでもよい。また上記プログラムは、前述した機能の一部を実現するためのものであってもよく、さらに前述した機能をコンピュータシステムにすでに記録されているプログラムとの組み合わせで実現できるものであってもよく、FPGA(Field Programmable Gate Array)等のプログラマブルロジックデバイスを用いて実現されるものであってもよい。
なお、上述した実施形態におけるモータ制御装置30及びモータ判定装置40をコンピュータで実現するようにしてもよい。その場合、この機能を実現するためのプログラムをコンピュータ読み取り可能な記録媒体に記録して、この記録媒体に記録されたプログラムをコンピュータシステムに読み込ませ、実行することによって実現してもよい。なお、ここでいう「コンピュータシステム」とは、OSや周辺機器等のハードウェアを含むものとする。また、「コンピュータ読み取り可能な記録媒体」とは、フレキシブルディスク、光磁気ディスク、ROM、CD-ROM等の可搬媒体、コンピュータシステムに内蔵されるハードディスク等の記憶装置のことをいう。さらに「コンピュータ読み取り可能な記録媒体」とは、インターネット等のネットワークや電話回線等の通信回線を介してプログラムを送信する場合の通信線のように、短時間の間、動的にプログラムを保持するもの、その場合のサーバやクライアントとなるコンピュータシステム内部の揮発性メモリのように、一定時間プログラムを保持しているものも含んでもよい。また上記プログラムは、前述した機能の一部を実現するためのものであってもよく、さらに前述した機能をコンピュータシステムにすでに記録されているプログラムとの組み合わせで実現できるものであってもよく、FPGA(Field Programmable Gate Array)等のプログラマブルロジックデバイスを用いて実現されるものであってもよい。
なお、モータ判定装置40は、ネットワークを介して通信可能に接続された複数台の情報処理装置を用いて実装されてもよい。この場合、モータ判定装置40が備える各機能部は、複数の情報処理装置に分散して実装されてもよい。例えば、電流値取得部41、RMS値取得部42及び電流値変化量取得処理部431と、判定部43とはそれぞれ異なる情報処理装置に実装されてもよい。例えば、電流値取得部41と、RMS値取得部42、電流値変化量取得処理部431及び判定部43とはそれぞれ異なる情報処理装置に実装されてもよい。
なお、予め定められた所定のCIVは、第1の値の一例である。なお、CIV閾値は、第2の値の一例である。
以上、この発明の実施形態について図面を参照して詳述してきたが、具体的な構成はこの実施形態に限られるものではなく、この発明の要旨を逸脱しない範囲の設計等も含まれる。
1…モータ装置、 10…モータ、 20…モータ制御回路、 30…モータ制御装置、 40…モータ判定装置、 41…電流値取得部、 42…RMS値取得部、 43…判定部、 431…電流値変化量取得処理部、 432…統計量取得処理部、 433…安定副期間判定処理部、 434…モータ判定処理部、 50…出力装置
Claims (9)
- モータに電流が印加される期間である主期間内の各時刻における前記電流の電流値を示す電流値情報を取得する電流値取得部と、
前記電流値情報が示す時刻tにおける前記電流値を電流値i(t)とし(tは実数)、前記電流値情報が示す前記時刻tの経過時間Δt時間後の時刻(t+Δt)における前記電流値を電流値i(t+Δt)とし、前記電流値i(t)と前記電流値i(t+Δt)との差を時刻tにおける電流値変化量として、前記電流値変化量の分布とランダムな変化をする物理量の分散を表す分布である正常分布との違いに基づいて、前記モータの動作が正常か否かを判定する判定部と、
を備える判定装置。 - 前記判定部は、前記主期間内の期間である複数の副期間であって前記主期間の長さの半分以下の長さの期間である複数の副期間ごとに、前記副期間における前記電流値変化量の分布に対する所定の統計量の値を取得する統計量取得処理部と、
前記正常分布と前記副期間における前記電流値変化量の分布との違いが所定の大きさ以下であることを前記所定の統計量の値が示すか否かを前記副期間ごとに判定する安定副期間判定処理部と、
前記安定副期間判定処理部の判定結果に基づいて前記モータの動作が正常か否かを判定するモータ判定処理部と、
を備える、
請求項1に記載の判定装置。 - 前記正常分布と前記副期間における前記電流値変化量の分布との違いが所定の大きさ以下であることを前記所定の統計量の値が示すと前記安定副期間判定処理部によって判定された前記副期間を安定副期間とし、前記正常分布と前記副期間における前記電流値変化量の分布との違いが所定の大きさよりも大きいことを前記所定の統計量の値が示すと前記安定副期間判定処理部によって判定された前記副期間を不安定副期間として、前記モータ判定処理部は、前記安定副期間の数と前記不安定副期間の数との和に対する前記安定副期間の数が所定の値よりも大きい場合に前記モータの動作が正常であると判定し、前記モータ判定処理部は、前記安定副期間の数と前記不安定副期間の数との和に対する前記安定副期間の数が前記所定の値以下である場合に前記モータの動作が異常であると判定する、
請求項2に記載の判定装置。 - 前記正常分布は、ガウス分布である、
請求項1から3のいずれか一項に記載の判定装置。 - 前記所定の統計量は、MD(Mahalanobis' Distance)の2乗の分布の分散をvarMD2として、varMD2である、
請求項2又は請求項3に記載の判定装置。 - 前記安定副期間判定処理部は、さらに、前記電流値又は前記電流値変化量の乱雑さを示す値に基づいて、前記モータの動作が正常か否かを判定する、
請求項3に記載の判定装置。 - 前記安定副期間判定処理部は、MD(Mahalanobis' Distance)の2乗の分布の分散をvarMD2として、前記副期間における前記電流値変化量の分布に対するvarMD2とガウス分布に対するvarMD2との差であるvarMD2差がvarMD2閾値よりも大きく、前記副期間における前記電流値変化量の分布に対するCIVの値と予め定められた第1の値との差であるCIV差が予め定められた第2の値よりも大きい場合に前記副期間は前記不安定副期間であると判定し、
前記varMD2差が前記varMD2閾値よりも大きく、前記CIV差が前記第2の値以下である場合に前記副期間は前記安定副期間であると判定し、
前記varMD2差が前記varMD2閾値以下であって、前記CIV差が前記第2の値より大きい場合に前記副期間は前記不安定副期間であると判定し、
前記varMD2差が前記varMD2閾値以下であって、前記CIV差が前記第2の値以下である場合に前記副期間は前記安定副期間であると判定する、
請求項6に記載の判定装置。 - モータと、
前記モータに電流が印加される期間である主期間内の各時刻における前記電流の電流値を示す電流値情報を取得する電流値取得部と、
前記電流値情報が示す時刻tにおける前記電流値を電流値i(t)とし(tは実数)、前記電流値情報が示す前記時刻tの経過時間Δt時間後の時刻(t+Δt)における前記電流値を電流値i(t+Δt)とし、前記電流値i(t)と前記電流値i(t+Δt)との差を電流値変化量として、前記電流値変化量の分布とランダムな変化をする物理量の分散を表す分布である正常分布との違いに基づいて、前記モータの動作が正常か否かを判定する判定部と、
を備えるモータ装置。 - 請求項1から7のいずれか一項に記載の判定装置としてコンピュータを機能させるためのプログラム。
Priority Applications (1)
| Application Number | Priority Date | Filing Date | Title |
|---|---|---|---|
| JP2020562979A JPWO2020137362A1 (ja) | 2018-12-26 | 2019-12-02 | 判定装置、モータ装置及びプログラム |
Applications Claiming Priority (2)
| Application Number | Priority Date | Filing Date | Title |
|---|---|---|---|
| JP2018-242575 | 2018-12-26 | ||
| JP2018242575 | 2018-12-26 |
Publications (1)
| Publication Number | Publication Date |
|---|---|
| WO2020137362A1 true WO2020137362A1 (ja) | 2020-07-02 |
Family
ID=71127960
Family Applications (1)
| Application Number | Title | Priority Date | Filing Date |
|---|---|---|---|
| PCT/JP2019/046950 Ceased WO2020137362A1 (ja) | 2018-12-26 | 2019-12-02 | 判定装置、モータ装置及びプログラム |
Country Status (2)
| Country | Link |
|---|---|
| JP (1) | JPWO2020137362A1 (ja) |
| WO (1) | WO2020137362A1 (ja) |
Citations (8)
| Publication number | Priority date | Publication date | Assignee | Title |
|---|---|---|---|---|
| JPS5733913B2 (ja) * | 1974-09-09 | 1982-07-20 | ||
| JPH0319908B2 (ja) * | 1984-05-19 | 1991-03-18 | Aisan Kogyo Kk | |
| JP2006046955A (ja) * | 2004-07-30 | 2006-02-16 | Takata Corp | 流体回転機械の診断方法 |
| JP2012220485A (ja) * | 2011-04-08 | 2012-11-12 | Toenec Corp | 電気設備の良否診断システム |
| WO2016092871A1 (ja) * | 2014-12-10 | 2016-06-16 | 三菱電機株式会社 | 電動機の診断装置 |
| JP2016195524A (ja) * | 2015-04-02 | 2016-11-17 | 三菱電機株式会社 | 電動機の診断装置 |
| JP2017181437A (ja) * | 2016-03-31 | 2017-10-05 | 株式会社高田工業所 | 回転機械系の異常検知方法、その異常検知方法を用いた回転機械系の異常監視方法、及びその異常監視方法を用いた回転機械系の異常監視装置 |
| WO2018020545A1 (ja) * | 2016-07-25 | 2018-02-01 | 三菱電機株式会社 | 電動機の診断装置 |
-
2019
- 2019-12-02 JP JP2020562979A patent/JPWO2020137362A1/ja active Pending
- 2019-12-02 WO PCT/JP2019/046950 patent/WO2020137362A1/ja not_active Ceased
Patent Citations (8)
| Publication number | Priority date | Publication date | Assignee | Title |
|---|---|---|---|---|
| JPS5733913B2 (ja) * | 1974-09-09 | 1982-07-20 | ||
| JPH0319908B2 (ja) * | 1984-05-19 | 1991-03-18 | Aisan Kogyo Kk | |
| JP2006046955A (ja) * | 2004-07-30 | 2006-02-16 | Takata Corp | 流体回転機械の診断方法 |
| JP2012220485A (ja) * | 2011-04-08 | 2012-11-12 | Toenec Corp | 電気設備の良否診断システム |
| WO2016092871A1 (ja) * | 2014-12-10 | 2016-06-16 | 三菱電機株式会社 | 電動機の診断装置 |
| JP2016195524A (ja) * | 2015-04-02 | 2016-11-17 | 三菱電機株式会社 | 電動機の診断装置 |
| JP2017181437A (ja) * | 2016-03-31 | 2017-10-05 | 株式会社高田工業所 | 回転機械系の異常検知方法、その異常検知方法を用いた回転機械系の異常監視方法、及びその異常監視方法を用いた回転機械系の異常監視装置 |
| WO2018020545A1 (ja) * | 2016-07-25 | 2018-02-01 | 三菱電機株式会社 | 電動機の診断装置 |
Also Published As
| Publication number | Publication date |
|---|---|
| JPWO2020137362A1 (ja) | 2021-11-11 |
Similar Documents
| Publication | Publication Date | Title |
|---|---|---|
| ES2865438T3 (es) | Método y dispositivo de identificación del estado de formación de hielo en las palas de un aerogenerador | |
| US11415976B2 (en) | Diagnosis device, learning device, and diagnosis system | |
| US11115295B2 (en) | Methods and systems for online monitoring using a variable data | |
| CN107438547B (zh) | 用于预测驾驶车辆的驾驶员的速度的方法 | |
| EP3068095A3 (en) | Monitoring apparatus and method | |
| WO2022048228A1 (zh) | 风电机组的载荷控制方法和装置 | |
| CN105450716A (zh) | 动态业务分发方法及系统 | |
| US20150309559A1 (en) | Voltage regulator stress reducing system | |
| CN112240828B (zh) | 用于检测转动设备的缺陷的装置 | |
| US8607133B2 (en) | Data processing device and method for checking parameter values of the data processing device | |
| JP2019060901A (ja) | 構造体の余寿命を推定する方法 | |
| CN111213162B (zh) | 数据处理装置、数据处理系统、数据处理方法及存储介质 | |
| WO2024003755A1 (en) | Priority-based load shedding for computing systems | |
| JPWO2020137362A1 (ja) | 判定装置、モータ装置及びプログラム | |
| US8024606B2 (en) | Power restoration to blade servers | |
| US11372049B2 (en) | Method and system to determine power values of a battery | |
| US9465659B2 (en) | Dynamic task completion scaling of system resources for a battery operated device | |
| CN110224750A (zh) | 光模块工作状态的确定方法及装置、设备及存储介质 | |
| CN116066392B (zh) | 散热风扇监测方法、装置、设备及存储介质 | |
| US9881156B2 (en) | Detecting heap spraying on a computer | |
| US20220067458A1 (en) | Smart metadata mapping for sensor data | |
| CN109835283B (zh) | 双交流发电机车辆的电力管理 | |
| US20180123973A1 (en) | System and method for forecasting and expanding software workload boundaries | |
| JP2018005393A (ja) | 故障予兆判定方法、故障予兆判定装置および故障予兆判定プログラム | |
| US20140289262A1 (en) | Generating an ordered list of managed targets |
Legal Events
| Date | Code | Title | Description |
|---|---|---|---|
| 121 | Ep: the epo has been informed by wipo that ep was designated in this application |
Ref document number: 19904953 Country of ref document: EP Kind code of ref document: A1 |
|
| ENP | Entry into the national phase |
Ref document number: 2020562979 Country of ref document: JP Kind code of ref document: A |
|
| NENP | Non-entry into the national phase |
Ref country code: DE |
|
| 122 | Ep: pct application non-entry in european phase |
Ref document number: 19904953 Country of ref document: EP Kind code of ref document: A1 |