WO2020113725A1 - 一种手性化合物的检测方法 - Google Patents
一种手性化合物的检测方法 Download PDFInfo
- Publication number
- WO2020113725A1 WO2020113725A1 PCT/CN2018/124284 CN2018124284W WO2020113725A1 WO 2020113725 A1 WO2020113725 A1 WO 2020113725A1 CN 2018124284 W CN2018124284 W CN 2018124284W WO 2020113725 A1 WO2020113725 A1 WO 2020113725A1
- Authority
- WO
- WIPO (PCT)
- Prior art keywords
- chiral
- detecting
- chiral compound
- spectrometer
- sample
- Prior art date
- Legal status (The legal status is an assumption and is not a legal conclusion. Google has not performed a legal analysis and makes no representation as to the accuracy of the status listed.)
- Ceased
Links
Images
Classifications
-
- G—PHYSICS
- G01—MEASURING; TESTING
- G01N—INVESTIGATING OR ANALYSING MATERIALS BY DETERMINING THEIR CHEMICAL OR PHYSICAL PROPERTIES
- G01N21/00—Investigating or analysing materials by the use of optical means, i.e. using sub-millimetre waves, infrared, visible or ultraviolet light
- G01N21/62—Systems in which the material investigated is excited whereby it emits light or causes a change in wavelength of the incident light
- G01N21/63—Systems in which the material investigated is excited whereby it emits light or causes a change in wavelength of the incident light optically excited
- G01N21/65—Raman scattering
- G01N21/658—Raman scattering enhancement Raman, e.g. surface plasmons
-
- G—PHYSICS
- G01—MEASURING; TESTING
- G01N—INVESTIGATING OR ANALYSING MATERIALS BY DETERMINING THEIR CHEMICAL OR PHYSICAL PROPERTIES
- G01N21/00—Investigating or analysing materials by the use of optical means, i.e. using sub-millimetre waves, infrared, visible or ultraviolet light
- G01N21/62—Systems in which the material investigated is excited whereby it emits light or causes a change in wavelength of the incident light
-
- G—PHYSICS
- G01—MEASURING; TESTING
- G01N—INVESTIGATING OR ANALYSING MATERIALS BY DETERMINING THEIR CHEMICAL OR PHYSICAL PROPERTIES
- G01N21/00—Investigating or analysing materials by the use of optical means, i.e. using sub-millimetre waves, infrared, visible or ultraviolet light
- G01N21/62—Systems in which the material investigated is excited whereby it emits light or causes a change in wavelength of the incident light
- G01N21/63—Systems in which the material investigated is excited whereby it emits light or causes a change in wavelength of the incident light optically excited
- G01N21/65—Raman scattering
Definitions
- the invention relates to a method for detecting chiral compounds.
- Chiral compounds refer to a class of compounds that have the same molecular structure but mirror each other in configuration.
- a mirror image of a chiral compound usually has different characteristics.
- thalidomide has two mirror image enantiomer configurations, S and R, of which R type has central sedation. Function, S type has a strong teratogenic effect. Therefore, in the R&D and production process involving chiral compounds, the distinction between enantiomers and content detection are crucial steps.
- the analysis and detection methods of chiral compounds mainly include two types, that is, spectrum types and chromatography types.
- the detection of chiral compounds must be distinguished by matching chiral structures to chiral structures.
- Spectroscopy uses chiral compounds to identify chiral circular polarized light
- chromatographic techniques uses chiral fixed relative chiral compounds.
- Spectroscopic methods mostly use the optical rotation and circular dichroism of chiral compounds (that is, the characteristics of deflecting polarized light and the interaction characteristics different from the left and right circular polarized light), which cannot detect racemization
- the latter is susceptible to the interference of linearly polarized light generated during the process of switching between left and right circularly polarized light, and cannot detect molecules without chromophoric groups.
- Chromatographic methods mainly rely on the adsorption capacity of chromatographic column packing for different configurations of chiral compounds for separation and content detection.
- chromatographic methods can be applied in a limited range, and commonly used chiral chromatographic columns can only be applied to some Chiral compounds with adsorption characteristics cannot detect compounds with too large molecular weight, too small molecular weight, or non-polarity.
- the inventors of the present invention conducted research on the characteristics of chiral recognition, and found that chiral recognition and detection of the following characteristics: when materials with chiral characteristics interact with chiral compounds, due to the electromagnetic field Sexual characteristics, unichiral materials have different strengths for the interaction of different enantiomers of chiral compounds. Not only that, the inventors also found that this difference in interaction strength can be characterized by the optical properties of materials and compounds. Moreover, its interaction strength is linearly related to the content ratio (ee value) of enantiomers in the chiral compound system to be tested. Therefore, based on the performance of the optical properties of the interaction between the chiral material and the chiral compound, the content ratio can be deduced, thereby realizing the detection of the chiral compound.
- ee value content ratio
- the present invention provides a method for detecting chiral compounds, which is characterized in that a material with chiral characteristics is used as a base material to cooperate with a spectrometer to detect chiral compounds.
- the method includes the following steps: Step S1: The test sample is placed on the substrate material; Step S2, the spectrometer is used to detect the sample to be tested to obtain the characteristic spectrum of the sample to be tested, wherein both the light source and the detection light of the spectrometer are unpolarized light.
- the method for detecting chiral compounds provided by the present invention may also have such technical characteristics, wherein the material with chiral characteristics in step S1 is a micro-nano powder or micro-nano film material with a chiral structure.
- the method for detecting chiral compounds provided by the present invention may also have such technical characteristics, wherein the material with chiral characteristics is composed of an inorganic material, an organic material or an organic-inorganic composite material.
- the method for detecting chiral compounds provided by the present invention may also have such technical characteristics, wherein the inorganic material is a plasmon resonance material and the spectrometer is a Raman spectrometer.
- the method for detecting chiral compounds provided by the present invention may also have such technical characteristics, wherein the plasmon resonance material is a metal, a metal oxide, or a mixture of both.
- the method for detecting chiral compounds provided by the present invention may also have such technical characteristics, wherein the metal is one or a combination of gold, silver, copper and platinum, and the metal oxide is copper oxide or titanium oxide , Zinc oxide, tin oxide, iron oxide, cobalt oxide one or a combination of several.
- the method for detecting chiral compounds provided by the present invention may also have such technical characteristics, wherein the chiral structure is any one of a spiral fiber structure, a flower-shaped structure, a fan-shaped structure, and a propeller-shaped structure.
- step S3 the characteristic spectrum obtained in step S2 is analyzed to obtain the enantiomeric content in the chiral compound.
- step S3 includes the following steps: step S3-1, preparing multiple standards of chiral compounds, each of which contains Enantiomers of different amounts of chiral compounds; Step S3-2, the standards are placed on the base material, and the standards are detected by spectrometers to obtain the characteristic spectra of the standards; Step S3-3, The characteristic spectra of the standard product and the test sample are compared and analyzed to obtain the enantiomeric content of the chiral compound in the test sample.
- the detection method of the chiral compound provided by the present invention may also have such technical characteristics, wherein the comparative analysis is to draw a standard curve according to the characteristic peak intensity and enantiomeric content relationship in the standard product, according to the standard curve and the sample to be tested The characteristic peak intensity of gives the enantiomeric content of the chiral compound.
- the detection method of the present invention since materials with chiral qualities are used as the base materials for the spectrometer detection, they can produce different strength interactions of different enantiomers of the chiral compound. The detection of this effect can obtain the content ratio of the enantiomers to achieve the detection of chiral compounds. Compared with the chiral compound detection method in the prior art, the detection method of the present invention has the advantages of simple operation and accurate results.
- Example 1 is a flowchart of a method for detecting chiral compounds according to Example 1 of the present invention
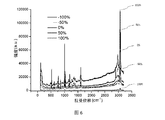
- Example 2 is a characteristic spectrum chart obtained by detecting the mixture of R-limonene and S-limonene by using the detection method in Example 1 of the present invention
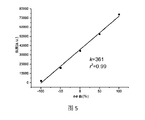
- Example 3 is a linear fitting diagram of the characteristic peak intensity and the percentage of chiral molecular content obtained by detecting the mixture of R-limonene and S-limonene using the detection method in Example 1 of the present invention
- Example 4 is a characteristic spectrum diagram obtained by detecting the mixture of L-cyclohexylglycine and D-cyclohexylglycine by using the detection method in Example 1 of the present invention
- Example 5 is a linear fitting diagram of the characteristic peak intensity and the percentage of chiral enantiomeric content obtained by performing characteristic spectrum detection on a mixture of L-cyclohexylglycine and D-cyclohexylglycine using the detection method in Example 1 of the present invention;
- Example 6 is a characteristic spectrum diagram obtained by detecting the mixture of L-phenylglycine and D-phenylglycine by using the detection method in Example 1 of the present invention
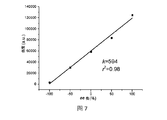
- Example 7 is a linear fitting diagram of the characteristic peak intensity and the percentage of chiral enantiomer content obtained by detecting the mixture of L-phenylglycine and D-phenylglycine using the detection method of Example 1 of the present invention
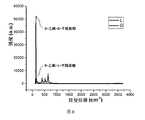
- Example 8 is a characteristic spectrum chart obtained by respectively detecting N-acetyl-L-cysteine and N-acetyl-D-cysteine at the same concentration by using the detection method in Example 4 of the present invention;
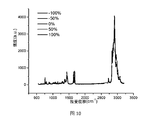
- FIG. 10 is a Raman spectrogram of a conventional example of the present invention for detecting limonene using a common Raman spectrometer;
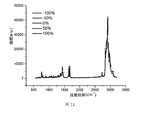
- FIG. 11 is a Raman spectrum diagram of a comparative example of the present invention for detecting limonene using a common Raman spectrometer and a substrate material without chirality.
- the gold nanospiral fiber array is used as a base material, which is combined with a Raman spectrometer to detect chiral compounds.
- the above-mentioned base material has the following characteristics: 1) Gold is a metal-based plasmon resonance material, which can enhance the Raman signal of the sample when used as the base material in the Raman spectroscopy detection process; 2) Gold nanospiral fibers
- the array is a film material formed on a silicon substrate by a growth method, and is composed of a plurality of single-stranded gold spiral fibers arranged neatly.
- the spiral fiber structure is a single chiral structure.
- this gold nanospiral fiber Arrays are materials with chiral qualities.
- the Raman spectrometer used in this embodiment is a general Raman spectrometer, that is, both the light source and the detection light of the Raman spectrometer are unpolarized light.
- the light emitted by the light source is unpolarized light
- the photodetection unit that detects the detection light is also Ordinary detection unit for unpolarized light.
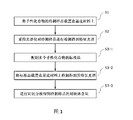
- FIG. 1 is a flowchart of a chiral compound detection method according to Embodiment 1 of the present invention.
- the first embodiment of the present invention uses the above-mentioned gold nanospiral fiber array as a base material, combined with a Raman spectrometer to detect chiral compounds, specifically including the following steps:
- Step S1 placing the test sample of the chiral compound on the base material
- Step S2 a spectrometer is used to detect the sample to be tested to obtain a characteristic spectrum (ie, Raman spectrum) of the sample to be tested;
- a characteristic spectrum ie, Raman spectrum
- step S3 the characteristic spectrum obtained in step S2 is analyzed to obtain the enantiomeric content in the chiral compound.
- the standard curve analysis method is used to quantify the content of the enantiomer in the sample to be tested.
- the analysis process in step S3 further includes the following steps:
- Step S3-1 preparing a plurality of standards of chiral compounds, each of which contains different amounts of enantiomers of the chiral compounds;
- Step S3-2 placing the standard products on the base material respectively, and respectively detecting the standard products with a characteristic spectrometer to obtain the characteristic spectrum of each standard product;
- step S3-3 the characteristic spectra of the standard product and the test sample are compared and analyzed to obtain the enantiomeric content of the chiral compound in the test sample.
- This example uses limonene as the chiral compound to be tested, which has two configurations, namely R-limonene and S-limonene.
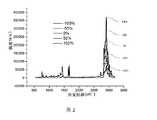
- FIG. 2 is a characteristic spectrum chart obtained by detecting the mixture of R-limonene and S-limonene by using the detection method in Example 1 of the present invention.
- -100% is a sample containing only R-limonene
- 100% is a sample containing only S-limonene
- -50% is a sample with a content ratio of R-limonene to S-limonene of 75:25
- 0% It is a sample with an R-limonene to S-limonene content ratio of 50:50
- 50% is a R-limonene to S-limonene content ratio of 25:75.
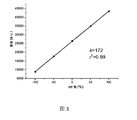
- FIG. 3 is a linear fitting diagram of the characteristic peak intensity and the percentage of chiral molecular content obtained by detecting the mixture of R-limonene and S-limonene using the detection method in Example 1 of the present invention.
- the abscissa is the percentage of chiral molecules (ee value)
- the ordinate is the characteristic peak intensity (that is, the characteristic peak intensity in the Raman spectrum).
- the detection method of this embodiment is used to perform characteristic spectrum detection, and then the test result of the sample to be tested is compared with the test result of the standard product (for example, The characteristic peak intensity of the sample to be tested is compared with the fitting curve of the characteristic peak intensity of the standard product), and the content ratio of S-limonene and R-limonene in the sample to be tested can be calculated.
- cyclohexylglycine has two configurations, namely L-cyclohexylglycine and D-cyclohexylglycine.
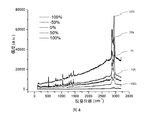
- FIG. 4 is a characteristic spectrum diagram obtained by detecting the mixture of L-cyclohexylglycine and D-cyclohexylglycine by using the detection method in Example 1 of the present invention.
- -100% is a sample containing only L-cyclohexylglycine
- 100% is a sample containing only D-cyclohexylglycine
- -50% is the content ratio of L-cyclohexylglycine to D-cyclohexylglycine is
- 75:25 samples 0% is a sample with a 50:50 ratio of L-cyclohexylglycine and D-cyclohexylglycine
- 50% is a 25:25 ratio with L-cyclohexylglycine and D-cyclohexylglycine: 75 samples.
- FIG. 5 is a linear fitting diagram of the characteristic peak intensity and the percentage of chiral enantiomer content obtained by performing characteristic spectrum detection on a mixture of L-cyclohexylglycine and D-cyclohexylglycine by using the detection method in Example 1 of the present invention.
- the abscissa is the percentage of chiral molecule content (ee value)
- the ordinate is the characteristic peak intensity.
- the detection method of the chiral compound cyclohexylglycine when the detection method of the chiral compound cyclohexylglycine is detected by the detection method of the gold nanohelical fiber array combined with the Raman spectrometer, the signal intensity is positively proportional to the chiral enantiomer in the sample Than relationship.
- the detection method of this embodiment when it is necessary to detect two samples of cyclohexylglycine with unknown enantiomer content, the detection method of this embodiment is used to perform characteristic spectrum detection, and then the test result of the sample to be tested is compared with the test result of the standard product, namely The content ratio of D-cyclohexylglycine and L-cyclohexylglycine in the sample to be tested can be calculated.
- Example 1 the inventors also used the detection method of Example 1 to detect a variety of other chiral compounds, and found that this detection method can achieve the enantiomeric content ratio detection of different chiral compounds.
- FIG. 6 is a characteristic spectrum chart obtained by detecting the mixture of L-phenylglycine and D-phenylglycine using the detection method of Embodiment 1 of the present invention
- FIG. 7 is a detection method of L using the detection method of Embodiment 1 of the present invention.
- the characteristic peak intensity is proportional to the ratio of chiral enantiomers in the sample.
- the chiral compounds that can be detected by the detection method of the present invention in the ratio of enantiomeric content are close to one hundred pairs, and these chiral compounds have different characteristics.
- Table 1 For example, according to the number of chiral centers, single-chiral center compounds and multi-chiral center compounds are included in Table 1; by polar classification, polar compounds and non-polar compounds are included in Table 1; in addition, in Table 1 It also contains many different kinds of chiral compounds such as chromophore molecules, non-chromophore molecules, macromolecules, small molecules and biological molecules. It can be seen that as long as the compound has Raman scattering properties, the enantiomeric content ratio can be detected by the detection method of the gold nanohelical fiber array of Example 1 combined with the Raman spectrometer.
- gold-silver nanohelical wire array is used as the base material, and chiral compound detection is carried out in combination with Raman spectrometer.
- the gold-silver nanospiral fiber array is formed by attaching silver again on the basis of the gold nanospiral fiber array of the first embodiment.
- the gold-silver nanospiral fiber array is composed of a plurality of neatly arranged single-strand gold-silver composite spiral fibers, and its characteristics are similar to those of the gold nanospiral fiber array of the first embodiment, and also belong to the plasmon resonance material, and also With chiral characteristics.
- the above-mentioned gold-silver nanospiral array can also exhibit the same characteristics as the gold nanospiral fiber array of Example 1.
- the gold-silver nanospiral array can also be used as a base material in conjunction with a Raman spectrometer to achieve the detection of the content ratio of chiral compounds with different configurations in the sample to be tested.
- flower-shaped nano titanium oxide powder was used as the base material, and chiral compound detection was carried out in combination with a Raman spectrometer.
- Titanium oxide is a metal oxide plasma resonance material, which can enhance the Raman signal of the sample when used as the base material in the Raman spectrum detection process
- Flower shape Nano titanium oxide powder is a material composed of nano titanium oxide particles, wherein the titanium oxide particles have a flower-shaped structure. Similar to the gold nanospiral fiber array and the gold-silver nanospiral array, this flower-shaped nanometer titanium oxide powder has a single-chiral structure and is also a material with chiral characteristics.
- this example uses N-acetylcysteine as the chiral compound to be tested, which has two configurations, namely N-acetyl-L-cysteine and N-acetyl-D-cysteine .
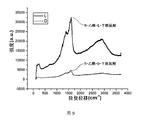
- Example 8 is a characteristic spectrum diagram obtained by respectively detecting N-acetyl-L-cysteine and N-acetyl-D-cysteine at the same concentration by using the detection method in Example 4 of the present invention.
- fan-shaped nano silver powder is used as the base material, and chiral compound detection is carried out in combination with a Raman spectrometer.
- the fan-shaped nano silver powder is also a material with chiral characteristics.
- silver is also a metal-based plasma resonance material.
- Example 9 is a characteristic spectrum diagram obtained by detecting the same concentration of N-acetyl-L-cysteine and N-acetyl-D-cysteine respectively by using the detection method in Example 5 of the present invention.
- the detection method using fan-shaped nano silver powder as the base material can also make the two The samples exhibit different signal intensities.
- the fingerprint characteristics in this Raman spectrum are not obvious enough, the peak height of the highest peak is analyzed (for example, comparing the peak height of the highest peak in the sample spectrum with the peak height of a standard that combines different proportions of enantiomeric content. ), the enantiomeric content ratio in the sample can also be calculated.
- the inventors also used ordinary plasmon resonance materials and ordinary Raman spectrometers to detect the two limonenes in the first embodiment.
- Fig. 10 is a Raman spectrum diagram of a conventional example of the present invention for detecting limonene using a common Raman spectrometer.
- FIG. 11 is a Raman spectrum diagram of a comparative example of the present invention for detecting limonene using a common Raman spectrometer and a substrate material without chirality.
- an ordinary Raman spectrometer and a plasmon resonance material without chirality are used (this comparative example uses gold nanoparticles, which are plasmon resonance materials, but the structure is a conventional structure and therefore does not have Chiral characteristics)
- this comparative example uses gold nanoparticles, which are plasmon resonance materials, but the structure is a conventional structure and therefore does not have Chiral characteristics
- the characteristic peak intensity of each limonene sample is stronger overall, but the five kinds of Raman spectra are also completely the same, indicating the combination of ordinary Raman spectrometers Materials without chiral qualities can achieve good qualitative and quantitative results, but they cannot distinguish between enantiomers and cannot detect content ratios of different configurations.
- Example 1 Comparative Example 1
- the chiral trait material of the present invention when used as a base material and a Raman spectrometer for detection, limonene samples with different ee values show different characteristic peak intensities, while ordinary The base material does not have this characteristic.
- the inventor speculates that the reason for this phenomenon may be that the electromagnetic field generated by the material with chiral characteristics under the detection light irradiation also has chiral characteristics, which can specifically enhance the Raman signal of a certain chiral conformation (For example, it has a stronger enhancement effect on the S-limonene molecule) and has little enhancement effect on another chiral conformation.
- Example 2 to Example 5 1.
- the chiral qualities of the present invention and the detection method of the Raman spectrometer can detect hundreds of chiral compounds; 2. Even if other For the kind of materials with chiral characteristics, the detection method of the present invention can also realize the detection of chiral compounds.
- the substrate material is a material with chiral characteristics (especially a plasmon resonance material with a chiral structure), it can more or less Raman signal of the chiral compound With specific enhancement, it can also be combined with Raman spectrometer to detect the ratio of enantiomeric content of chiral compounds.
- the detection method of the present invention has low cost and simple operation , Low interference, accurate results, simple operation and wide application.
- the material with chiral characteristics is a nano metal film material having a single chiral structure, a nano metal powder material, a nano metal oxide powder material and the like.
- the material with chiral characteristics can also be other types of materials, including micro-nano material powders or micro-materials with chiral structure composed of other types of organic substances, inorganic substances, or organic substance-inorganic substance mixtures. Nano film material.
- the inorganic substance may include a metal and a metal oxide
- the metal may be one or a combination of gold, silver, copper, platinum
- the metal oxide may be copper oxide, titanium oxide, zinc oxide, tin oxide, One or a combination of iron oxide and cobalt oxide
- the chiral structure may also be a variety of chiral structures such as a propeller-shaped structure.
- the spectrometer used in the examples is a Raman spectrometer.
- it can also be another kind of spectrometer as long as it can detect the interaction between the base material and the compound to be tested.
Landscapes
- Health & Medical Sciences (AREA)
- Nuclear Medicine, Radiotherapy & Molecular Imaging (AREA)
- Physics & Mathematics (AREA)
- Life Sciences & Earth Sciences (AREA)
- Chemical & Material Sciences (AREA)
- Analytical Chemistry (AREA)
- Biochemistry (AREA)
- General Health & Medical Sciences (AREA)
- General Physics & Mathematics (AREA)
- Immunology (AREA)
- Pathology (AREA)
- Investigating, Analyzing Materials By Fluorescence Or Luminescence (AREA)
Abstract
Description


Claims (10)
- 一种手性化合物的检测方法,其特征在于,采用具有手性特质的材料作为基底材料与光谱仪配合从而对所述手性化合物进行检测,包括如下步骤:步骤S1,将手性化合物的待测样品载置在所述基底材料上;步骤S2,采用光谱仪对所述待测样品进行检测从而得到所述待测样品的特征光谱,其中,所述光谱仪的光源和检测光都为非偏振光。
- 根据权利要求1所述的手性化合物的检测方法,其特征在于:其中,步骤S1中的所述具有手性特质的材料为具有手性结构的微纳米粉末或微纳米膜材料。
- 根据权利要求2所述的手性化合物的检测方法,其特征在于:其中,所述具有手性特质的材料由无机材料、有机材料或有机-无机复合材料构成。
- 根据权利要求3所述的手性化合物的检测方法,其特征在于:其中,所述无机材料为等离子体共振材料,所述光谱仪为拉曼光谱仪。
- 根据权利要求4所述的手性化合物的检测方法,其特征在于:其中,所述等离子体共振材料为金属、金属氧化物或二者的混合物。
- 根据权利要求5所述的手性化合物的检测方法,其特征在于:其中,所述金属为金、银、铜、铂中的一种或几种的组合物,所述金属氧化物为氧化铜、氧化钛、氧化锌、氧化锡、氧化铁、氧化钴中的一种或几种的组合物。
- 根据权利要求2-6中任一项所述的手性化合物的检测方法,其特征在于:其中,所述手性结构为螺旋纤维结构、花形结构、扇形结构、螺旋桨形结构中的任意一种。
- 根据权利要求1所述的手性化合物的检测方法,其特征在于,还包括如下步骤:步骤S3,对步骤S2得到的所述特征光谱进行分析,从而得到所述手性化合物中的对映体含量。
- 根据权利要求8所述的手性化合物的检测方法,其特征在于:其中,步骤S3的所述分析包括如下步骤:步骤S3-1,配制多个所述手性化合物的标准品,每个所述标准品中含有不同量的所述手性化合物的对映体;步骤S3-2,分别将所述标准品载置在所述基底材料上,并分别采用所述光谱仪对所述标准品进行检测从而得到各个所述标准品的特征光谱;步骤S3-3,将所述标准品和所述待测样品的特征光谱进行对比分析,得到所述待测样品中的所述手性化合物的对映体含量。
- 根据权利要求9所述的手性化合物的检测方法,其特征在于:其中,所述对比分析为根据所述标准品中的特征峰强度及对映体含量关系绘制标准曲线,根据该标准曲线以及所述待测样品的特征峰强度得出所述手性化合物的对映体含量。
Applications Claiming Priority (2)
| Application Number | Priority Date | Filing Date | Title |
|---|---|---|---|
| CN201811479015.5A CN111272728B (zh) | 2018-12-05 | 2018-12-05 | 一种手性化合物的检测方法 |
| CN201811479015.5 | 2018-12-05 |
Publications (1)
| Publication Number | Publication Date |
|---|---|
| WO2020113725A1 true WO2020113725A1 (zh) | 2020-06-11 |
Family
ID=70975251
Family Applications (1)
| Application Number | Title | Priority Date | Filing Date |
|---|---|---|---|
| PCT/CN2018/124284 Ceased WO2020113725A1 (zh) | 2018-12-05 | 2018-12-27 | 一种手性化合物的检测方法 |
Country Status (2)
| Country | Link |
|---|---|
| CN (1) | CN111272728B (zh) |
| WO (1) | WO2020113725A1 (zh) |
Families Citing this family (2)
| Publication number | Priority date | Publication date | Assignee | Title |
|---|---|---|---|---|
| CN116375982A (zh) * | 2022-12-28 | 2023-07-04 | 山东大学 | 在红外波段和可见光波段具有圆二色特性的有机手性高聚物pcdtpt的制备方法 |
| CN117607123B (zh) * | 2023-12-04 | 2024-05-03 | 海南大学 | 一种分辨低浓度手性物质对映体的方法 |
Citations (2)
| Publication number | Priority date | Publication date | Assignee | Title |
|---|---|---|---|---|
| WO2007134446A1 (en) * | 2006-05-23 | 2007-11-29 | The University Of Western Ontario | High-throughput screening of enantiomeric excess (ee) |
| CN101323964A (zh) * | 2008-07-01 | 2008-12-17 | 南京大学 | 负载型花状银纳米结构材料的合成方法 |
Family Cites Families (8)
| Publication number | Priority date | Publication date | Assignee | Title |
|---|---|---|---|---|
| WO2003029790A1 (en) * | 2001-10-01 | 2003-04-10 | Georgia Tech Research Corporation | High-throughput chiral detector and methods for using same |
| US7191070B2 (en) * | 2003-12-03 | 2007-03-13 | Baylor University | Methods for determining enantiomeric purity |
| CN102864493B (zh) * | 2012-10-12 | 2015-03-18 | 江南大学 | 一种基于有机小分子盐的金纳米棒手性自组装材料的制备方法 |
| CN103896846B (zh) * | 2014-03-05 | 2016-05-25 | 上海师范大学 | 一种以壳聚糖修饰的金纳米通道膜分离组氨酸对映体的方法及其检测方法 |
| CN104132900A (zh) * | 2014-08-08 | 2014-11-05 | 厦门大学 | 一种晶型手性药物的固体手性光谱测试方法 |
| WO2017123926A1 (en) * | 2016-01-13 | 2017-07-20 | Nxgen Partners Ip, Llc | System and method for multi-parameter spectroscopy |
| CN106053810A (zh) * | 2016-05-10 | 2016-10-26 | 江南大学 | 一种基于手性纳米组装体的循环肿瘤细胞检测新方法 |
| CN107036971B (zh) * | 2016-11-14 | 2019-06-25 | 四川大学 | 手性传感元件、设备,手性表征方法,浓度表征方法 |
-
2018
- 2018-12-05 CN CN201811479015.5A patent/CN111272728B/zh not_active Expired - Fee Related
- 2018-12-27 WO PCT/CN2018/124284 patent/WO2020113725A1/zh not_active Ceased
Patent Citations (2)
| Publication number | Priority date | Publication date | Assignee | Title |
|---|---|---|---|---|
| WO2007134446A1 (en) * | 2006-05-23 | 2007-11-29 | The University Of Western Ontario | High-throughput screening of enantiomeric excess (ee) |
| CN101323964A (zh) * | 2008-07-01 | 2008-12-17 | 南京大学 | 负载型花状银纳米结构材料的合成方法 |
Non-Patent Citations (2)
| Title |
|---|
| 袁旭寒 (YUAN, XUHAN): "基于表面增强拉曼散射的手性传感器及其机理研究 (A Chiral Sensor Based on Surface Enhanced Raman Scattering and Its Mechanism Research)", 中国优秀硕士学位论文全文数据库信息科技辑 (CHINESE MASTER’S THESES FULL-TEXT DATABASE (INFORMATION SCIENCE & TECHNOLOGY)), no. 06, 15 June 2018 (2018-06-15), DOI: 20190826111045X * |
| 钟铜生等 (ZHONG, TONGSHENG ET AL.): "基于纳米通道表面增强拉曼散射光谱分离检测组氨酸对映体的研究(Chiral Separation and Identification of D,L-Histidine Based on Nanochannels Membrane Coupling with Surface Enhanced Raman Scattering Spectroscopy)", 分析化学 (CHINESE JOURNAL OF ANALYTICAL CHEMISTRY), vol. 43, no. 11, 30 November 2015 (2015-11-30), pages 1695 - 1700, DOI: 20190826111224X * |
Also Published As
| Publication number | Publication date |
|---|---|
| CN111272728B (zh) | 2021-09-03 |
| CN111272728A (zh) | 2020-06-12 |
Similar Documents
| Publication | Publication Date | Title |
|---|---|---|
| US8891081B1 (en) | Raman spectroscopy method of measuring melamine contents in dairy products having different matrixes | |
| Wang et al. | Coffee-ring effect-based simultaneous SERS substrate fabrication and analyte enrichment for trace analysis | |
| Lang et al. | Integration of colorimetric and SERS detection for rapid screening and validation of melamine in milk | |
| JP5852245B2 (ja) | 金属ナノ粒子ならびにその調製および使用のための方法 | |
| Vo-Dinh et al. | Analysis of a workplace air particulate sample by synchronous luminescence and room-temperature phosphorescence | |
| Ruan et al. | Surface-enhanced Raman scattering for perchlorate detection using cystamine-modified gold nanoparticles | |
| Nuntawong et al. | Detection of methamphetamine/amphetamine in human urine based on surface-enhanced Raman spectroscopy and acidulation treatments | |
| Chen et al. | Ag‐nanoparticle‐modified single Ag nanowire for detection of melamine by surface‐enhanced Raman spectroscopy | |
| Pallipurath et al. | Multivariate analysis of combined Raman and fibre‐optic reflectance spectra for the identification of binder materials in simulated medieval paints | |
| CN111948191B (zh) | 一种多光源拉曼光谱分析方法及其应用 | |
| CN108254352A (zh) | 一种用于表面增强拉曼光谱的液液界面检测方法 | |
| CN109557071A (zh) | 一种危险液体混合物的拉曼光谱定性定量识别方法 | |
| Liu et al. | Analytical separation of Au/Ag core/shell nanoparticles by capillary electrophoresis | |
| Nguyen et al. | Synthesis of wool roll-like silver nanoflowers in an ethanol/water mixture and their application to detect traces of the fungicide carbendazim by SERS technique | |
| CN112240881A (zh) | 使用拉曼光谱法快速检测痕量芬太尼的方法 | |
| CN106814130B (zh) | 一种用于质谱检测的新型纳米芯片及其制备与应用 | |
| CN106323938A (zh) | 基于表面增强拉曼光谱技术的甲基硫菌灵残留的测定方法 | |
| WO2020113725A1 (zh) | 一种手性化合物的检测方法 | |
| CN111272729B (zh) | 一种手性化合物的检测系统 | |
| CN111272727B (zh) | 用于对手性化合物进行检测的基底材料 | |
| Di Filippo et al. | Chiral porphyrin-SiO 2 nano helices-based sensors for vapor enantiomers recognition | |
| Dao et al. | Detection of a Sudan dye at low concentrations by surface-enhanced Raman spectroscopy using silver nanoparticles | |
| CN109781694A (zh) | 一种葡萄酒中金属离子的快速检测方法 | |
| Roy et al. | Observing atomically precise nanocluster aggregates in solution by mass photometry | |
| US20230349763A1 (en) | Raman detecting chip, method of fabricating the same and raman spetroscopy detecting system using such raman detecting chip |
Legal Events
| Date | Code | Title | Description |
|---|---|---|---|
| 121 | Ep: the epo has been informed by wipo that ep was designated in this application |
Ref document number: 18942028 Country of ref document: EP Kind code of ref document: A1 |
|
| NENP | Non-entry into the national phase |
Ref country code: DE |
|
| 122 | Ep: pct application non-entry in european phase |
Ref document number: 18942028 Country of ref document: EP Kind code of ref document: A1 |
|
| 122 | Ep: pct application non-entry in european phase |
Ref document number: 18942028 Country of ref document: EP Kind code of ref document: A1 |
|
| 32PN | Ep: public notification in the ep bulletin as address of the adressee cannot be established |
Free format text: NOTING OF LOSS OF RIGHTS PURSUANT TO RULE 112(1) EPC (EPO FORM 1205A DATED 27.01.2022) |
|
| 122 | Ep: pct application non-entry in european phase |
Ref document number: 18942028 Country of ref document: EP Kind code of ref document: A1 |