WO2020110787A1 - 光伝送システムおよび光伝送システムの故障診断方法 - Google Patents
光伝送システムおよび光伝送システムの故障診断方法 Download PDFInfo
- Publication number
- WO2020110787A1 WO2020110787A1 PCT/JP2019/044972 JP2019044972W WO2020110787A1 WO 2020110787 A1 WO2020110787 A1 WO 2020110787A1 JP 2019044972 W JP2019044972 W JP 2019044972W WO 2020110787 A1 WO2020110787 A1 WO 2020110787A1
- Authority
- WO
- WIPO (PCT)
- Prior art keywords
- series data
- optical
- node
- deterioration
- time
- Prior art date
- Legal status (The legal status is an assumption and is not a legal conclusion. Google has not performed a legal analysis and makes no representation as to the accuracy of the status listed.)
- Ceased
Links
Images






Classifications
-
- H—ELECTRICITY
- H04—ELECTRIC COMMUNICATION TECHNIQUE
- H04B—TRANSMISSION
- H04B10/00—Transmission systems employing electromagnetic waves other than radio-waves, e.g. infrared, visible or ultraviolet light, or employing corpuscular radiation, e.g. quantum communication
- H04B10/07—Arrangements for monitoring or testing transmission systems; Arrangements for fault measurement of transmission systems
- H04B10/075—Arrangements for monitoring or testing transmission systems; Arrangements for fault measurement of transmission systems using an in-service signal
- H04B10/079—Arrangements for monitoring or testing transmission systems; Arrangements for fault measurement of transmission systems using an in-service signal using measurements of the data signal
-
- H—ELECTRICITY
- H04—ELECTRIC COMMUNICATION TECHNIQUE
- H04B—TRANSMISSION
- H04B10/00—Transmission systems employing electromagnetic waves other than radio-waves, e.g. infrared, visible or ultraviolet light, or employing corpuscular radiation, e.g. quantum communication
- H04B10/07—Arrangements for monitoring or testing transmission systems; Arrangements for fault measurement of transmission systems
- H04B10/075—Arrangements for monitoring or testing transmission systems; Arrangements for fault measurement of transmission systems using an in-service signal
- H04B10/079—Arrangements for monitoring or testing transmission systems; Arrangements for fault measurement of transmission systems using an in-service signal using measurements of the data signal
- H04B10/0793—Network aspects, e.g. central monitoring of transmission parameters
-
- H—ELECTRICITY
- H04—ELECTRIC COMMUNICATION TECHNIQUE
- H04B—TRANSMISSION
- H04B10/00—Transmission systems employing electromagnetic waves other than radio-waves, e.g. infrared, visible or ultraviolet light, or employing corpuscular radiation, e.g. quantum communication
- H04B10/27—Arrangements for networking
Definitions
- the present invention relates to an optical transmission system for diagnosing its own failure and a failure diagnosis method for the optical transmission system.
- the optical transmission system includes an optical transmission layer in which a plurality of nodes are mutually connected by links.
- optical physical characteristics and analog control characteristics interact in a complicated manner, and a failure (abnormality) in which failure (abnormality) position identification and cause identification are difficult occurs.
- the non-linear characteristics of optical fibers cause interactions between wavelength channels.
- WSS wavelength selective switch
- an optical amplifier perform level/gain control for equalizing the signal quality of all wavelength channels, an interaction occurs between wavelength channels. Therefore, the abnormality of the predetermined wavelength channel affects the signal quality of other wavelength channels, and it becomes difficult to identify the position or cause of the failure (abnormality) or performance deterioration.
- Non-Patent Document 1 describes current and future technologies regarding optical performance monitoring.
- the network controller of the optical transmission system collects statistical data of performance information from transponders and various monitoring devices at predetermined sampling intervals.
- the sampling interval is limited to about 15 minutes in order to avoid a tight processing of the network controller. Therefore, the network controller cannot detect a failure (abnormality) or a performance deterioration that shows a response shorter than this sampling interval. If the sampling interval is shortened in order to detect such a failure (abnormality) that shows a short response or performance deterioration, the processing of the network controller will be tight and the congestion of the data communication network (DCN: Data Communication Network) may occur. is there.
- DCN Data Communication Network
- performance information collected by conventional network controllers includes optical power at the input and output of optical devices, parameter values that control optical power (e.g., optical attenuation of wavelength selective switch, laser bias current, etc.), device temperature. and so on.
- the network controller can detect only a failure (abnormality) or performance deterioration indicating temporal fluctuations in optical signal power and device temperature. Therefore, in the optical transmission system, it is difficult to specify the failure position and the cause of most of the failures that occur due to the optical physical characteristics and the analog control characteristics. Therefore, it is an object of the present invention to specify the location and cause of a failure in an optical transmission system while avoiding the processing pressure on the network controller side and the congestion of the data communication network.
- a plurality of nodes mutually connected by an optical transmission path and a plurality of the respective nodes are respectively detected for signal quality deterioration, and the signal quality
- a network controller that identifies a node or a component in which a failure or performance degradation has occurred, based on information on a network topology configured from each of the nodes and information on an optical path set between the nodes.
- the determination means determines the correlation between the optical physical characteristics and the signal quality in a predetermined period before and after the detected timing.
- the optical transmission system according to claim 1 or 2 wherein the determination means is a node controller that manages a node or a component part that has detected the deterioration of the signal quality.
- the cause of the failure is diagnosed via each node controller, so that distributed processing can be performed regardless of the transponder performance.
- the optical transmission system according to claim 1 or 2 wherein the determination means is a transponder provided in a node that has detected the deterioration of the signal quality.
- the transponders it is possible to cause the transponders to perform distributed processing without providing a node controller.
- a failure occurs in the node or the component based on the time-series data of the optical attenuation amount or the time-series data of the optical power given to the optical signal forming each optical path passing through the node.
- each of the nodes is an optical cross-connect that allows optical signals of a plurality of frequency slots to pass
- the network controller is an optical cross-connect from the determination means that manages the node at the end of each optical bus.
- the time-series data of physical characteristics is collected, the correlation coefficient matrix between each optical path is calculated, and the most upstream node common to the combination of optical paths whose correlation coefficient exceeds the threshold is the failure or performance degradation.
- the optical transmission system can mechanically determine the node at the suspicious location related to the failure or the performance deterioration.
- the time series data of the optical physical characteristics correlated with the time series data of the signal quality is time series data of the chromatic dispersion compensation amount, time series data of the polarization mode dispersion compensation amount, and SOP. (State of Polarization) time series data, signal to noise ratio time series data, polarization dependent loss time series data, crosstalk time series data, fiber nonlinear effect time series data, intersymbol interference time series data 7.
- a failure executed by an optical transmission system including a plurality of nodes mutually connected by an optical transmission path, a management unit that manages each of the nodes, and a network controller that collectively manages the management unit
- a diagnostic method wherein the management unit detects deterioration of signal quality in the node, specifies time series data of optical physical characteristics correlated with time series data of the signal quality, and determines deterioration modes respectively.
- the network controller has detected the deterioration of the signal quality, the deterioration mode, the network topology composed of a plurality of each of the nodes, the information of the optical path set between the nodes Based on the above, the failure diagnosis method is characterized in that a node or a component part in which a failure or performance deterioration occurs is specified.
- the present invention it is possible to identify the location and cause of the failure while avoiding the processing pressure on the network controller side and the congestion of the data communication network.
- FIG. 6 is a graph showing time-series data of a bit error rate before error correction and time-series data of a DSP monitor feature amount in normal times, and time-series data of a correlation coefficient thereof.
- 7 is a graph showing time-series data of a bit error rate before error correction and time-series data of a DSP monitor feature amount at the time of abnormality, and time-series data of a correlation coefficient thereof. It is a flowchart which shows an abnormality/change detection process.
- DSP digital signal processing
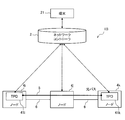
- FIG. 1 is a conceptual diagram of an optical transmission system 1 according to the first embodiment.
- the optical transmission system 1 is configured by connecting a plurality of nodes 4i to 4k to each other by an optical fiber 6 which is an optical transmission path, and further includes node controllers 3i to 3k and a network controller 2.
- the transponders 41i and 41k are described as "TPD" in each figure.
- the transponder 41i included in the node 4i and the transponder 41k included in the node 4k are communicably connected by the optical path 5.
- the optical path 5 is a logical communication path that connects the transponder 41i and the transponder 41k via the optical fiber 6 which is a physical communication path and the node 4j.
- the nodes 4i to 4k and the like are simply referred to as the node 4.
- the transponders 41i, 41k, etc. are not distinguished, they are simply referred to as the transponder 41.
- the node controller 3i controls the transponder 41i, monitors the transponder 41i, detects the deterioration of the signal quality, and determines the deterioration mode having a correlation with the signal quality.
- the node controller 3j controls the node 4j and monitors the node 4j to detect the deterioration of the signal quality, and determine the deterioration mode correlated with the signal quality.
- the node controller 3k controls the transponder 41k and monitors the transponder 41k to detect the deterioration of the signal quality, identify the optical physical characteristics correlated with the time-series data of the signal quality, and determine the deterioration mode. ..
- node controllers 3i to 3k are determination means for detecting the deterioration of the signal quality in each of the nodes 4i to 4k, specifying the photophysical characteristics correlated with the time-series data of the signal quality, and determining the deterioration modes, respectively. ..
- the node controllers 3i to 3k and the like are simply referred to as the node controller 3.
- the network controller 2 is connected to the node controllers 3i to 3k via a data communication network.
- the network controller 2 controls the node controllers 3i to 3k and monitors them.
- the network controller 2 is based on the node in which the node controllers 3i to 3k have detected the deterioration of the signal quality, the deterioration mode, the network topology composed of a plurality of nodes 4, and the optical path 5 set between the nodes 4. , Identify the node or component where the failure (abnormality) or performance degradation has occurred.
- the terminal 21 is connected to the network controller 2 to notify the user of, for example, the failure position and the cause.
- FIG. 2 is a schematic flowchart showing the failure diagnosis process.
- Steps S10 to S12 are processing executed by the node controller 3 located at the end of the optical path 5.
- the node controller 3 located at the end of the optical path 5 corresponds to the node controllers 3i and 3k in FIG.
- the Pre-FEC BER Pre-Forward Error Correction Bit Error Rate
- the Pre- The deterioration mode is specified based on the correlation analysis between the time-series data of FEC BER and the time-series data of the analog information regarding the optical physical characteristics monitored by the digital signal processing (DSP) (S11).
- DSP digital signal processing
- the analog information regarding the optical physical characteristics will be referred to as DSP-based OPM (Digital Signal Processing based Optical Performance Monitoring).
- DSP-based OPM Digital Signal Processing based Optical Performance Monitoring
- the abnormality in the pre-FEC BER time series data indicates that the quality of the signal flowing through the optical path 5 is deteriorated.
- the node controller 3 further notifies the network controller 2 of the specified deterioration mode (S12).
- Steps S13 and S14 are processes executed by the network controller 2 that integrally controls the optical transmission system 1.
- the network controller 2 collects the time-series data of the DSP-based OPM corresponding to the deterioration mode from each node controller 3 which is the terminal end of the optical path 5 (S13), it is based on the information of the network topology, the optical path route and the wavelength setting information.
- the position of the node 4 or the optical fiber 6 where the failure or the performance deterioration occurs is specified (S14).
- Step S15 is a process executed by the node controller 3 that manages the node 4 when the location where the failure has occurred is the node 4.
- the node controller 3 diagnoses a failure based on the topology information and PM (Performance Monitoring) information in the node, and identifies the failure component and cause in the node (S15).
- Step S16 is a process executed by the network controller 2 and the terminal 21.
- the network controller 2 collects the faulty component information and cause information identified from the node controller 3, informs the terminal 21 of the faulty component and the cause (S16), and ends the process of FIG.
- FIG. 3 is a diagram showing that an abnormality has occurred in the optical transmission system 1A.
- optical cross-connects 4a to 4h are connected to each other by optical fibers of sections 6p to 6v, and node controllers 3a to 3h are connected to these optical cross-connects 4a to 4h.
- These sections 6p to 6v are optical transmission lines that connect the nodes to each other.
- the optical cross connect 4a includes transponders 41a and 41b, and is mutually connected to the optical cross connect 4c by the optical fiber of the section 6p.
- the optical cross connect 4a and the transponders 41a and 41b are hardware configuring the node 4.
- the node controller 3a of the first embodiment monitors the time series data of the correlation coefficient between the signal quality and the DSP-based OPM in order to execute the software that controls the optical cross connect 4a and the transponders 41a and 41b. It is a server provided with a computing resource that realizes a function of determining a deterioration mode.
- the network controller 2 and the node controller 3a identify the optical cross connect 4a as "OXC-A" and the section 6p as "section P".
- the optical cross connect 4b includes a transponder 41c and is interconnected with the optical cross connect 4c by the optical fiber of the section 6q.
- the optical cross connect 4b and the transponder 41c are hardware configuring the node 4.
- the node controller 3b of the first embodiment monitors the time series data of the correlation coefficient between the signal quality and the DSP-based OPM in order to execute the software that controls the optical cross connect 4b and the transponder 41c, and the deterioration mode. It is a server equipped with a calculation resource that realizes the function of determining.
- the network controller 2 and the node controller 3b identify the optical cross connect 4b as "OXC-B" and the section 6q as "section Q".
- the optical cross connect 4c is mutually connected to the optical cross connect 4a by the optical fiber of the section 6p, and is mutually connected to the optical cross connect 4b by the optical fiber of the section 6q.
- the optical cross connect 4c is further interconnected with the optical cross connect 4d by the optical fiber of the section 6r, and is interconnected with the optical cross connect 4g by the optical fiber of the section 6s.
- the optical cross connect 4d is hardware that configures the node 4.
- the node controller 3d of the first embodiment executes the software for controlling the optical cross connect 4d, and therefore monitors the time series data of the correlation coefficient between the signal quality and the DSP-based OPM to determine the deterioration mode. It is a server equipped with computing resources that realize the functions.
- the network controller 2 and the node controller 3c identify the optical cross connect 4c as "OXC-C", the section 6r as "section R", and the section 6s as "section S”.
- the optical cross connect 4d is mutually connected to the optical cross connect 4e by the optical fiber of the section 6u, and is mutually connected to the optical cross connect 4f by the optical fiber of the section 6v.
- the network controller 2 and the node controller 3d identify the optical cross connect 4d as "OXC-D". Further, the network controller 2 and the node controller 3d identify the section 6u as "section U” and the section 6v as “section V”.
- the optical cross connect 4e includes a transponder 41d and is interconnected with the optical cross connect 4d by an optical fiber of the section 6u.
- the optical cross connect 4e and the transponder 41d are hardware configuring the node 4.
- the node controller 3e of the first embodiment monitors the time series data of the correlation coefficient between the signal quality and the DSP-based OPM in order to execute the software that controls the optical cross connect 4e and the transponder 41d, and the deterioration mode. It is a server equipped with a calculation resource that realizes the function of determining.
- the network controller 2 and the node controller 3e identify the optical cross connect 4e as "OXC-E". Further, the network controller 2 and the node controller 3e identify the section 6u as "section U”.
- the optical cross connect 4f includes transponders 41e and 41f, and is mutually connected to the optical cross connect 4d by the optical fiber of the section 6v.
- the optical cross connect 4f and the transponders 41e and 41f are hardware configuring the node 4.
- the node controller 3f of the first embodiment monitors the time series data of the correlation coefficient between the signal quality and the DSP-based OPM in order to execute the software that controls the optical cross connect 4f and the transponders 41e and 41f.
- the network controller 2 and the node controller 3f identify the optical cross connect 4f as "OXC-F". Further, the network controller 2 and the node controller 3f identify the section 6v as "section V”.
- the optical cross connect 4g includes a transponder 41g and is interconnected with the optical cross connect 4c by the optical fiber of the section 6s.
- the optical cross connect 4g and the transponder 41g are hardware configuring the node 4.
- the node controller 3g of the first embodiment monitors the time series data of the correlation coefficient between the signal quality and the DSP-based OPM in order to execute the software that controls the optical cross-connect 4g and the transponder 41g, and determines the deterioration mode. It is a server equipped with a calculation resource that realizes the function of determining.
- the network controller 2 and the node controller 3g identify the optical cross connect 4g as "OXC-G". Further, the network controller 2 and the node controller 3g identify the section 6s as "section S".
- the optical cross connect 4h includes a transponder 41h and is interconnected with the optical cross connect 4d by an optical fiber of the section 6t.
- the optical cross connect 4h and the transponder 41h are hardware configuring the node 4.
- the node controller 3h of the first embodiment monitors the time series data of the correlation coefficient between the signal quality and the DSP-based OPM in order to execute the software for controlling the optical cross connect 4h and the transponder 41h, and the deterioration mode. It is a server equipped with a calculation resource that realizes the function of determining.
- the network controller 2 and the node controller 3h identify the optical cross connect 4h as "OXC-H". Further, the network controller 2 and the node controller 3h identify the section 6t as "section T".
- the optical path 5-1 is a logical communication path connecting one end to the other end of the optical transmission system 1A, and is terminated by the transponder 41a of the optical cross connect 4a and further terminated by the transponder 41d of the optical cross connect 4d. ..
- the optical path 5-1 is connected from the optical cross-connect 4a to the optical cross-connect 4d via the section 6p, the optical cross-connect 4c and the section 6r, and further to the optical cross-connect 4d via the section 6u.
- the optical path 5-2 is a logical communication path connecting one end to the other end of the optical transmission system 1A, and is terminated by the transponder 41c of the optical cross connect 4b and further terminated by the transponder 41e of the optical cross connect 4f. ..
- the optical path 5-2 is connected from the optical cross connect 4b to the optical cross connect 4d via the section 6q, the optical cross connect 4c and the section 6r, and further to the optical cross connect 4f via the section 6v.
- the optical path 5-1 and the optical path 5-2 are communication paths of different wavelength channels, and share the optical cross connect 4c, the section 6r, and the optical cross connect 4d.
- the optical path 5-3 is a logical communication path that connects one end to the other end of the optical transmission system 1A, is terminated by the transponder 41b of the optical cross connect 4a, and is further terminated by the transponder 41g of the optical cross connect 4g. ..
- the optical path 5-3 is connected from the optical cross connect 4a to the transponder 41 of the optical cross connect 4g ahead through the section 6p, the optical cross connect 4c, and the section 6s.
- the optical path 5-1 and the optical path 5-3 are communication paths of different wavelength channels, and share the optical cross connect 4a, the section 6p, and the optical cross connect 4c.
- the optical path 5-2 and the optical path 5-3 are communication paths of different wavelength channels and share the optical cross connect 4c.
- the optical path 5-4 is a logical communication path that connects one end to the other end of the optical transmission system 1A, is terminated by the transponder 41f of the optical cross connect 4f, and is further terminated by the transponder 41h of the optical cross connect 4h. It The optical path 5-4 is connected from the optical cross connect 4f to the transponder 41h of the optical cross connect 4h ahead via the section 6v, the optical cross connect 4d, and the section 6t.
- the optical path 5-1 and the optical path 5-4 are communication paths of different wavelength channels and share the optical cross connect 4d.
- the optical path 5-2 and the optical path 5-4 are communication paths of different wavelength channels, and share the optical cross connect 4d, the section 6v, and the optical cross connect 4f.
- the network controller 2 and the node controller 3 recognize the optical path 5-1 as “optical path #1”, the optical path 5-2 as “optical path #2”, and the optical path
- the optical path 5-3 is recognized as “optical path #3”, and the optical path 5-4 is recognized as "optical path #4".
- the node controller 3 that monitors the transponder 41 that is the end point of each optical path 5-1 to 5-4 uses the Pre-FEC BER.
- the correlation coefficient between the time series data of and the time series data of various DSP-based OPM is monitored.
- the DSP-based OPM with a large correlation coefficient is extracted and the deterioration mode is specified.
- FIG. 4 is a graph showing time-series data of bit error rate before normal error correction, time-series data of DSP-based OPM, and time-series data of their correlation coefficient.
- Three of these graphs on the left side are pre-FEC BER time series data, and the middle three are time series data of various DSP-based OPMs.
- the three on the right side of these graphs show the correlation coefficient between the time series data of Pre-FEC BER shown in the graph on the right side of each row and the time series data of various DSP-based OPMs shown in the intermediate graph. ..
- the first line shows the time series data of Pre-FEC BER, the time series data of ACF (Auto Correlation Function), and the time series data of the correlation coefficient which is the result of calculating these correlations.
- Pre-FEC BER time-series data does not fluctuate at the specified value.
- the ACF time-series data remains unchanged at the prescribed value. Therefore, the time-series data of these correlation coefficients remains unchanged at 1.
- the second line shows the time series data of Pre-FEC BER, the time series data of OSNR (Optical Signal to Noise Ratio), and the time series data of the correlation coefficient which is the result of calculating the correlation between them.
- Pre-FEC BER time-series data does not fluctuate at the specified value.
- OSNR time-series data remains unchanged at the predetermined value. Therefore, the time-series data of these correlation coefficients remains unchanged at 1.
- time series data of Pre-FEC BER, time series data of Spectrum Symmetry (spectrum symmetry), and time series data of a correlation coefficient which is the result of calculating the correlation between them are shown. ..
- Pre-FEC BER time-series data does not fluctuate at the specified value.
- the time series data of Spectrum Symmetry does not fluctuate with the predetermined value. Therefore, the time-series data of these correlation coefficients remains unchanged at 1.
- FIG. 5 is a graph showing the time series data of the bit error rate before error correction at the time of abnormality, the time series data of DSP-based OPM, and the time series data of the correlation coefficient thereof.
- the time series data of Pre-FEC BER and the time series data of ACF, and the time series data of the correlation coefficient which is the result of calculating the correlation between them are shown.
- Pre-FEC BER time-series data increases at a predetermined timing, indicating that the signal quality is degraded.
- ACF time series data also increases at this predetermined timing. Therefore, the time-series data of these correlation coefficients remains unchanged at 1.
- the second line shows time series data of Pre-FEC BER, time series data of OSNR, and time series data of a correlation coefficient which is the result of calculating the correlation between them.
- Pre-FEC BER time-series data increases at a predetermined timing, indicating that the signal quality is degraded.
- the OSNR time-series data remains unchanged at the specified value. Therefore, the time series data of these correlation coefficients gradually decreases from 1 after a predetermined timing.
- the third line shows the time series data of Pre-FEC BER, the time series data of Spectrum Symmetry, and the time series data of the correlation coefficient which is the result of calculating the correlation between these.
- Pre-FEC BER time-series data increases at a predetermined timing, indicating that the signal quality is degraded.
- the time-series data of Spectrum Symmetry does not fluctuate with the predetermined value. Therefore, the time-series data of these correlation coefficients gradually decreases from 1 after a predetermined timing.
- the failure factor and the failure location can be specified to be related to the increase in ACF.
- FIG. 6 and 7 are flowcharts showing the abnormality/change detection processing. Although there are various algorithms for the abnormality/change detection processing, the cumulative sum method, which is a classical change point algorithm, is described here. Other algorithms may be applied.
- the node controller 3 sets the entire series as a section to be processed (S20), and performs cumulative summation processing on the set section (S21). This cumulative sum processing is the recursive processing shown in FIG. 7.
- the node controller 3 calculates an average value (sample average) in the section to be processed (S30).
- the node controller 3 obtains the average value and the difference for each point, and calculates the cumulative sum of the difference from the average value (S31).
- the node controller 3 compares the maximum absolute value of the cumulative sum with a predetermined value (threshold value) (S32). If the maximum absolute value of the cumulative sum is less than or equal to the predetermined value (No), the node controller 3 ends this detection process.
- the maximum absolute value of the cumulative sum exceeds the predetermined value (Yes) the node controller 3 proceeds to the process of step S33.
- step S33 the node controller 3 sets a point (timing) at which the absolute value of the cumulative sum is maximum as a new change point.
- step S34 the node controller 3 recursively calls the cumulative summation process with the first half of the section to be processed, which is divided by the change point detected in step S33, as a new section.
- step S35 the node controller 3 recursively calls this cumulative summation process with the latter half of the processing target section divided by the change point detected in step S33 as a new section, and then, as shown in FIG. Ends the process.
- FIG. 8 is a flowchart showing an analysis process when an abnormality/change is detected.
- the node controller 3 calculates the logarithmic change rate (difference from the previous sample) in N samples before and after the detection time in the time-series data of various DSP-based OPMs (S40), and multivariate correlation analysis processing (Fig. 9) is called (S41).
- the node controller 3 extracts a DSP-based OPM that is significant and highly correlated with the Pre-FECBER (the absolute value of the correlation coefficient is greater than or equal to the reference value) (S42).
- This extraction processing is the operation described in FIGS. 5 and 6 described above.
- the node controller 3 determines the deterioration mode and then ends the processing in FIG.
- FIG. 9 is a flowchart showing the multivariate correlation analysis process.
- the node controller 3 repeats each process for the logarithmic change rate of time series data of various DSP-based OPMs.
- the node controller 3 calculates the correlation coefficient matrix with the logarithmic change rate of the time-series data of the DSP-based OPM with respect to the time-series data of Pre-FEC BER.
- the node controller 3 calculates the p-value of the correlation with the logarithmic change rate of the time-series data of the DSP-based OPM with respect to the time-series data of Pre-FEC BER.
- step S53 the node controller 3 calculates the partial correlation coefficient matrix of the time series data of the DSP-based OPM for the Pre-FEC BER time series data.
- this partial correlation coefficient matrix it is possible to prevent the pseudo correlation and the pseudo decorrelation from being caused by the influence of the third variable. If the node controller 3 has not processed any of the DSP-based OPM time-series data in step S54, the process returns to step S50.
- the node controller 3 ends the process of FIG. 9.
- the node controller 3 calculates the correlation coefficient using the time-series data of the time width before and after the detection only when the change is detected, and thus the detection processing load can be suppressed.
- FIG. 10 is a flowchart showing the fault location identifying process.
- the network controller 2 collects the time-series data of the DSP-based OPM corresponding to the deterioration mode from each node controller that manages the node that is the end of the optical path (S13). After that, the network controller 2 calculates the correlation coefficient matrix between the optical paths (S60), and determines whether the correlation coefficient exceeds the threshold value (S61).
- FIG. 13 shows a calculation example of the correlation coefficient matrix. The numerical value of each cell shows the correlation between the optical paths of the row and the column of the time series data of the DSP-based OPM related to the deterioration mode. For example, when the threshold value is set to 0.8, it is determined that the correlation coefficient between the optical path #2 and the optical path #3 exceeds the threshold value. If the correlation coefficient does not exceed the threshold value, the processing illustrated in FIG. 10 ends.
- the network controller 2 sets the frequency slot number and section number in which a combination of a plurality of optical paths for which the correlation coefficient is determined to exceed the threshold is set on the two-dimensional map of the section/device information and the frequency slot number. And a mark is given to the corresponding cell of the OXC number (S62).
- An example of the two-dimensional map is shown in FIG. In FIG. 14, it is assumed that the optical path #2 corresponds to the frequency slot number #3 and the optical path #3 corresponds to the frequency slot number #4.
- the network controller 2 gives a mark (“ ⁇ ” in this example) to the corresponding cells of the section number and the OXC number in which the optical path #2 and the optical path #3 are set.
- the network controller 2 identifies the section or OXC located on the most upstream side among the section numbers or OXC numbers common to the combination of a plurality of optical paths whose correlation coefficient exceeds the threshold as a failure point (S63), The process of FIG. 10 is ended.
- the section numbers common to the optical paths #2 and #3 are R, and the OXC numbers are C, D, and F.
- the OXC-C is located on the most upstream side, so the network controller 2 identifies OXC-C as the suspected place. This makes it possible to easily determine in which section or in which node the malfunction has occurred.
- FIG. 11 is a diagram showing various DSP-based OPMs.
- Various DSP-based OPMs are roughly classified into transmission line characteristics, device/device characteristics, and transponder characteristics. This is described in the item of "major classification” in the figure. The right side of the item of "major classification” shows the minor classification belonging to each characteristic.
- the transmission line characteristics belong to three subclasses: chromatic dispersion, polarization mode dispersion, and SOP (state of polarization).
- the chromatic dispersion is monitored as a chromatic dispersion compensation amount.
- the polarization mode dispersion is monitored as a polarization mode dispersion compensation amount.
- the SOP State Of Polarization
- fluctuation is monitored by the Stokes vector calculated based on the coefficient matrix of Multi-Input Multi-Output in 2 rows and 2 columns.
- Equipment/device characteristics include OSNR (Optical Signal to Noise Ratio), PDL (Polarization Dependent Loss), crosstalk including reflected light, fiber nonlinear effect, ISI (Inter-Symbol) Interference: Intersymbol interference) belongs to a small classification.
- OSNR is monitored as Error Vector Magnitude (EVM).
- PDL polarization dependent loss
- Crosstalk including reflected light and ISI are monitored as Tap values (coefficients) of FIR (Finite Impulse Response) filters.
- Fiber nonlinear effects are monitored as an Auto Correlation Function between symbols.
- the transponder characteristics belong to three subclasses: constellation distortion, light source frequency, and Spectrum Symmetry.
- Constellation distortion is monitored as an index value based on the constellation geometry.
- the light source frequency is monitored as a frequency offset amount.
- Spectrum Symmetry is monitored as an index value based on spectral symmetry.
- FIG. 12 is a diagram showing an operation in which the network controller 2 collects abnormality information that has occurred in the optical transmission system 1A.
- the network controller 2 and its operation are added to the optical transmission system 1A shown in FIG.
- the node controller 3e which monitors the optical cross-connect 4e serving as the optical path termination, extracts the time-series data of the DSP-based OPM relating to the deterioration mode from the transponder 41d and transfers it to the network controller 2.
- the node controller 3f which monitors the optical cross-connect 4f serving as the optical path termination, extracts the time-series data of the DSP-based OPM relating to the deterioration mode from the transponders 41e and 41f and transfers it to the network controller 2.
- the node controller 3g that monitors the transponder 41g connected to the outside from the optical cross connect 4g also extracts the time series data of the DSP-based OPM relating to the deterioration mode and transfers it to the network controller 2.
- the network controller 2 shares a section showing a large correlation based on section information, path route information, used frequency information managed by itself, and DSP-based OPM time series data collected from each node controller. Determine the section and the occupied frequency slot position. Thereby, the network controller 2 can specify that the influence of the fiber nonlinear effect in the section 6r has changed due to the power setting abnormality in the optical cross connect 4c.
- FIG. 15 is a diagram showing internal components of the node 4.
- the node 4 includes a pre-stage amplifier 71 and a photodetector (PD) 70, a coupler (CPL:Coupler) 72 and a wavelength selective switch 73, a post-stage amplifier 76 and a photodetector 77, and a selector (SEL:Selector). )74, and an optical channel monitor (OCM: Optical Channel Monitor) 75.
- the photodetector 70 is connected to the input side of the pre-stage amplifier 71.
- the output side of the front stage amplifier 71 is connected to the input side of the rear stage amplifier 76 via the coupler 72 and the wavelength selective switch 73.
- the selector 74 selects any one of the output of the pre-stage amplifier 71, the output of the coupler 72, and the output of the wavelength selective switch 73 and outputs it to the optical channel monitor 75.
- the photodetector 77 is connected to the output side of the latter stage amplifier 76.
- the node controller 3 acquires PM information only from the corresponding node. This is different from the conventional method in which the network controller 2 collects PM information of all nodes. By this method, the load on the network controller 2 side and the congestion of the data communication network can be avoided, and the sampling interval in the acquisition of the time series data of PM information can be shortened.
- the node controller 3 acquires optical power from the photodetectors 70 and 77.
- the node controller 3 acquires the temperature and the laser bias current value from the pre-stage amplifier 71 and the post-stage amplifier 76.
- the node controller 3 acquires the optical power of each channel from the optical channel monitor 75, and acquires the temperature and the optical attenuation amount from the wavelength selective switch 73.
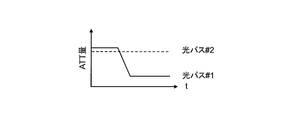
- FIG. 16 is a graph showing the optical attenuation amount of each optical path in the suspected device. In the case assumed this time, the attenuation amount of the optical path #1 of the wavelength selective switch 73 has an abnormal value at a predetermined timing.
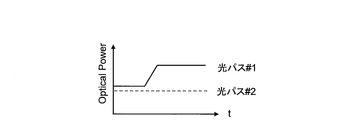
- FIG. 17 is a graph showing the optical power of each optical path in the suspected device.
- the power of the optical path #1 for each channel in the optical channel monitor 75 is also an abnormal value at the above-mentioned predetermined timing.
- the node controller 3 can determine that there is an abnormality in the package (component) of the wavelength selective switch in the optical cross connect 4c. Further, not each network controller 2 but each node controller 3 determines a failure, so that the data resolution can be improved and the tight processing of the network controller 2 can be avoided.
- FIG. 18 is a conceptual diagram of the optical transmission system 1B in the second embodiment.
- the optical transmission system 1 is configured by connecting a plurality of nodes 4i to 4k to each other by an optical fiber 6 which is an optical transmission path, and further includes a network controller 2.
- the transponder 41i included in the node 4i and the transponder 41k included in the node 4k are communicably connected by the optical path 5.
- the optical path 5 is a logical communication path that connects the transponder 41i and the transponder 41k via the optical fiber 6 which is a physical communication path and the node 4j.
- Each of the transponders 41i and 41k includes a digital signal processing (DSP) chip therein, and utilizes the surplus resource to realize a function of monitoring time-series data of a correlation coefficient and identifying a failure mode.
- the transponders 41i, 41k execute a program embodying a controller function for monitoring the nodes, thereby monitoring themselves to detect the deterioration of the signal quality, and the optical physics correlating with the time-series data of the signal quality.
- the time series data of the characteristic is specified and the deterioration mode is determined.
- the node 4j monitors itself to detect the deterioration of the signal quality, specifies the time-series data of the optical physical characteristics correlated with the time-series data of the signal quality, and determines the respective deterioration modes.
- the transponders 41i and 41k and the node 4j respectively detect deterioration of signal quality, specify time series data of optical physical characteristics correlated with time series data of this signal quality, and determine the deterioration modes respectively.
- the network controller 2 is connected to the transponders 41i and 41k and the node 4j via a data communication network.
- the network controller 2 controls the transponders 41i and 41k and the node 4j and monitors them.
- the network controller 2 has a failure or a performance deterioration based on the node in which the transponders 41i, 41k and the node 4j detect the deterioration of the signal quality, the deterioration mode, the topology of each node, and the information of the optical path set between the nodes 4. Identify the node or component where the occurred.
- the terminal 21 is connected to the network controller 2 to notify the user of, for example, the failure position and the cause.
- each transponder 41 or each node 4 is caused to execute a program embodying the node controller function without providing a node controller as hardware, thereby autonomously degrading the signal quality. Can be detected.
- the present invention is not limited to the above-described embodiment, and various modifications can be made without departing from the spirit of the present invention.
- the following (a) to (c) are available.
- the topology of the optical transmission system is not limited to that shown in FIGS.
- the method of detecting the deterioration of the quality of the signal flowing through the optical path is not limited to detecting the abnormality of the time series data of Pre-FEC BER, but it is the method of detecting the abnormality by digitally measuring the signal quality. I wish I had it.
- the feature amount detected by the node controller is not limited to the ones enumerated in the embodiments, and any feature amount that correlates with a failure of the node (device) or the optical transmission line may be used.
Landscapes
- Engineering & Computer Science (AREA)
- Physics & Mathematics (AREA)
- Electromagnetism (AREA)
- Computer Networks & Wireless Communication (AREA)
- Signal Processing (AREA)
- Computing Systems (AREA)
- Optical Communication System (AREA)
- Data Exchanges In Wide-Area Networks (AREA)
Abstract
【課題】光伝送システムにおいて、ネットワークコントローラ側の処理の逼迫を回避しつつ、故障の位置と原因とを特定する。 【解決手段】光伝送システム1は、光伝送路によって相互に接続された複数のノード4i~4kと、ノード4i~4kにおける信号品質の劣化をそれぞれ検知し、この信号品質と相関する劣化モードをそれぞれ判定する複数のノードコントローラ3i~3kと、ノードコントローラ3i~3kが信号品質の劣化を検知したノードおよび、劣化モード、各ノードから構成されるネットワークトポロジ、各ノード間に設定される光パスに基づき、故障が発生したノードまたは構成部品を特定するネットワークコントローラ2とを備える。
Description
本発明は、自身の故障を診断する光伝送システム、および光伝送システムの故障診断方法に関する。
光伝送システムは、複数のノードがリンクによって相互に接続された光伝送レイヤを備える。この光伝送レイヤでは、光物理特性、および、アナログ制御特性が複雑に相互作用し、故障(異常)位置特定や原因特定が困難な故障(異常)が発生する。
具体的にいうと、光ファイバの非線形の特性により、波長チャネル間で相互作用が発生する。また波長選択スイッチ(WSS:Wavelength selective switch)や光増幅器は、全波長チャネルの信号品質を均一化するレベル/利得制御を行うため、波長チャネル間で相互作用が発生する。よって、所定の波長チャネルの異常が他の波長チャネルにおける信号品質に波及し、故障(異常)や性能劣化の位置特定や原因特定が困難となる。光物理特性、および、アナログ制御特性に起因する故障(異常)や性能劣化の位置特定や原因特定を容易に実現するには、光物理特性・アナログ制御特性の監視箇所の増加、監視する性能情報の種類の増加、および、性能情報の時系列データにおける時間分解能の向上などの対策が必要となる。
具体的にいうと、光ファイバの非線形の特性により、波長チャネル間で相互作用が発生する。また波長選択スイッチ(WSS:Wavelength selective switch)や光増幅器は、全波長チャネルの信号品質を均一化するレベル/利得制御を行うため、波長チャネル間で相互作用が発生する。よって、所定の波長チャネルの異常が他の波長チャネルにおける信号品質に波及し、故障(異常)や性能劣化の位置特定や原因特定が困難となる。光物理特性、および、アナログ制御特性に起因する故障(異常)や性能劣化の位置特定や原因特定を容易に実現するには、光物理特性・アナログ制御特性の監視箇所の増加、監視する性能情報の種類の増加、および、性能情報の時系列データにおける時間分解能の向上などの対策が必要となる。
非特許文献1には、光パフォーマンスモニタリングに関する現在および将来の技術が記載されている。
Zhenhua Dong, Faisal Nadeem Khan, Qi Sui, Kangping Zhong, Chao Lu, and Alan Pak Tao Lau,"Optical Performance Monitoring: A Review of Current and Future Technologies",JOURNAL OF LIGHTWAVE TECHNOLOGY,IEEE, JANUARY 15, 2016,VOL. 34,NO. 2
光伝送システムのネットワークコントローラは、トランスポンダや各種モニタリングデバイスからの性能情報の統計データを、所定のサンプリング間隔で収集する。例えば、サンプリング間隔は、ネットワークコントローラの処理の逼迫を回避するため、15分程度に制約される。このため、ネットワークコントローラは、このサンプリング間隔よりも短い応答を示す故障(異常)や性能劣化を検知することはできない。
このような短い応答を示す故障(異常)や性能劣化を検知するためにサンプリング間隔を短くすると、ネットワークコントローラの処理が逼迫すると共に、データ通信ネットワーク(DCN:Data Communication Network)の輻輳を招くおそれがある。
このような短い応答を示す故障(異常)や性能劣化を検知するためにサンプリング間隔を短くすると、ネットワークコントローラの処理が逼迫すると共に、データ通信ネットワーク(DCN:Data Communication Network)の輻輳を招くおそれがある。
一方、従来のネットワークコントローラが収集する性能情報には、光デバイスの入出力での光パワー、光パワーを制御するパラメータ値(例:波長選択スイッチの光減衰量やレーザバイアス電流など)、デバイス温度などがある。この場合、ネットワークコントローラは、光信号パワーにおける時間的変動とデバイス温度における時間的変動を示す故障(異常)や性能劣化しか検知できない。従って、光伝送システムにおいて、光物理特性・アナログ制御特性に起因して発生する故障のうち殆どは、故障位置の特定や原因の特定が困難となる。
そこで、本発明は、光伝送システムにおいて、ネットワークコントローラ側の処理の逼迫やデータ通信ネットワークの輻輳を回避しつつ、故障の位置と原因とを特定することを課題とする。
そこで、本発明は、光伝送システムにおいて、ネットワークコントローラ側の処理の逼迫やデータ通信ネットワークの輻輳を回避しつつ、故障の位置と原因とを特定することを課題とする。
前記した課題を解決するため、請求項1に記載の発明では、光伝送路によって相互に接続された複数のノードと、複数の各前記ノードにおける信号品質の劣化をそれぞれ検知し、前記信号品質の時系列データと相関のある光物理特性の時系列データを特定し、劣化モードをそれぞれ判定する複数の判定手段と、前記判定手段が前記信号品質の劣化を検知したノードおよび、前記劣化モード、複数の各前記ノードから構成されるネットワークトポロジ、各前記ノード間に設定される光パスの情報に基づき、故障または性能劣化が発生したノードまたは構成部品を特定するネットワークコントローラと、を備えることを特徴とする光伝送システムとした。
このようにすることで、本発明によれば、ネットワークコントローラ側の処理の逼迫やデータ通信ネットワークの輻輳を回避しつつ、故障の位置と原因とを特定することができる。
請求項2に記載の発明では、前記判定手段は、前記信号品質の劣化を検知すると、検知したタイミングの前後の所定期間における光物理特性と前記信号品質との相関を判定する、ことを特徴とする請求項1に記載の光伝送システムとした。
このようにすることで、本発明によれば、判定手段の計算量を抑制することができる。
請求項3に記載の発明では、前記判定手段は、前記信号品質の劣化を検知したノードまたは構成部品を管理するノードコントーラである、ことを特徴とする請求項1または2に記載の光伝送システムとした。
このようにすることで、本発明によれば、各ノードコントローラを介して故障原因を診断するので、トランスポンダの性能によらず分散処理を行わせることができる。
請求項4に記載の発明では、前記判定手段は、前記信号品質の劣化を検知したノードに設けられたトランスポンダである、ことを特徴とする請求項1または2に記載の光伝送システムとした。
このようにすることで、本発明によれば、ノードコントローラを設けることなく、トランスポンダに分散処理を行わせることができる。
請求項5に記載の発明では、前記ノードを通過する各光パスを構成する光信号に付与する光減衰量の時系列データまたは光パワーの時系列データに基づき、前記ノードまたは前記構成部品における故障原因を診断する、ことを特徴とする請求項3または4に記載の光伝送システムとした。
このようにすることで、本発明によれば、ノードを構成する部品の故障原因を診断することができる。
請求項6に記載の発明では、各前記ノードは、複数の周波数スロットの光信号を通過させる光クロスコネクトであり、前記ネットワークコントローラは、各光バスの終端にあたるノードを管理する前記判定手段から光物理特性の時系列データを収集して各光パス間の相関係数行列を計算し、相関係数が閾値を超える光パスの組合せに共通するノードのうち最も上流のものを、故障または性能劣化にかかる被疑箇所として特定する、ことを特徴とする請求項1に記載の光伝送システムとした。
このようにすることで、本発明によれば、光伝送システムは、故障または性能劣化にかかる被疑箇所のノードを機械的に判定できる。
請求項7に記載の発明では、前記信号品質の時系列データと相関のある光物理特性の時系列データは、波長分散補償量の時系列データ、偏波モード分散補償量の時系列データ、SOP(State Of Polarization)の時系列データ、信号対ノイズ比の時系列データ、偏波依存損失の時系列データ、クロストークの時系列データ、ファイバ非線形効果の時系列データ、符号間干渉の時系列データ、コンスタレーション歪みの時系列データ、光源周波数の時系列データ、スペクトル対称性の時系列データうち何れかを少なくとも含む、ことを特徴とする請求項1ないし6のうち何れか1項に記載の光伝送システムとした。
このようにすることで、本発明によれば、装置や光伝送路の故障を容易に判定することができる。
請求項8に記載の発明では、光伝送路によって相互に接続された複数のノード、各前記ノードをそれぞれ管理する管理手段、前記管理手段を統括管理するネットワークコントローラを含む光伝送システムが実行する故障診断方法であって、前記管理手段は、前記ノードにおける信号品質の劣化をそれぞれ検知し、前記信号品質の時系列データと相関のある光物理特性の時系列データを特定し、劣化モードをそれぞれ判定し、前記ネットワークコントローラは、前記管理手段が前記信号品質の劣化を検知したノードおよび、前記劣化モード、複数の各前記ノードから構成されるネットワークトポロジ、各前記ノード間に設定される光パスの情報に基づき、故障または性能劣化が発生したノードまたは構成部品を特定する、ことを特徴とする故障診断方法とした。
このようにすることで、本発明によれば、ネットワークコントローラ側の処理の逼迫やデータ通信ネットワークの輻輳を回避しつつ、故障の位置と原因とを特定することができる。
本発明によれば、ネットワークコントローラ側の処理の逼迫やデータ通信ネットワークの輻輳を回避しつつ、故障の位置と原因とが特定可能となる。
以降、本発明を実施するための形態を、各図を参照して詳細に説明する。
図1は、第1の実施形態における光伝送システム1の概念図である。
光伝送システム1は、複数のノード4i~4kが、光伝送路である光ファイバ6によって相互に接続されて構成され、更にノードコントローラ3i~3kと、ネットワークコントローラ2とを備える。
トランスポンダ41i,41kは、各図において“TPD”と記載している。ノード4iが備えるトランスポンダ41iと、ノード4kが備えるトランスポンダ41kとは、光パス5によって通信可能に接続される。光パス5は、物理的な通信路である光ファイバ6とノード4jとを介して、トランスポンダ41iとトランスポンダ41kとを接続する論理的な通信路である。以下、ノード4i~4kなどを区別しないときには、単にノード4と記載する。トランスポンダ41i,41kなどを区別しないときには、単にトランスポンダ41と記載する。
図1は、第1の実施形態における光伝送システム1の概念図である。
光伝送システム1は、複数のノード4i~4kが、光伝送路である光ファイバ6によって相互に接続されて構成され、更にノードコントローラ3i~3kと、ネットワークコントローラ2とを備える。
トランスポンダ41i,41kは、各図において“TPD”と記載している。ノード4iが備えるトランスポンダ41iと、ノード4kが備えるトランスポンダ41kとは、光パス5によって通信可能に接続される。光パス5は、物理的な通信路である光ファイバ6とノード4jとを介して、トランスポンダ41iとトランスポンダ41kとを接続する論理的な通信路である。以下、ノード4i~4kなどを区別しないときには、単にノード4と記載する。トランスポンダ41i,41kなどを区別しないときには、単にトランスポンダ41と記載する。
ノードコントローラ3iは、トランスポンダ41iを制御し、かつこれを監視して信号品質の劣化をそれぞれ検知し、この信号品質と相関のある劣化モードをそれぞれ判定する。
ノードコントローラ3jは、ノード4jを制御し、かつこれを監視して信号品質の劣化をそれぞれ検知し、この信号品質と相関する劣化モードをそれぞれ判定する。
ノードコントローラ3kは、トランスポンダ41kを制御し、かつこれを監視して信号品質の劣化をそれぞれ検知し、この信号品質の時系列データと相関のある光物理特性を特定し、劣化モードをそれぞれ判定する。これらノードコントローラ3i~3kは、各ノード4i~4kにおける信号品質の劣化をそれぞれ検知し、信号品質の時系列データと相関のある光物理特性を特定し、劣化モードをそれぞれ判定する判定手段である。以下、各ノードコントローラ3i~3kなどを区別しないときには、単にノードコントローラ3と記載する。
ノードコントローラ3jは、ノード4jを制御し、かつこれを監視して信号品質の劣化をそれぞれ検知し、この信号品質と相関する劣化モードをそれぞれ判定する。
ノードコントローラ3kは、トランスポンダ41kを制御し、かつこれを監視して信号品質の劣化をそれぞれ検知し、この信号品質の時系列データと相関のある光物理特性を特定し、劣化モードをそれぞれ判定する。これらノードコントローラ3i~3kは、各ノード4i~4kにおける信号品質の劣化をそれぞれ検知し、信号品質の時系列データと相関のある光物理特性を特定し、劣化モードをそれぞれ判定する判定手段である。以下、各ノードコントローラ3i~3kなどを区別しないときには、単にノードコントローラ3と記載する。
ネットワークコントローラ2は、ノードコントローラ3i~3kとデータ通信ネットワークを介して接続される。ネットワークコントローラ2は、ノードコントローラ3i~3kを制御し、かつこれらを監視する。ネットワークコントローラ2は、ノードコントローラ3i~3kが前記信号品質の劣化を検知したノードおよび、劣化モード、複数の各ノード4から構成されるネットワークトポロジ、各ノード4間に設定される光パス5に基づき、故障(異常)または性能劣化が発生したノードまたは構成部品を特定する。端末21は、ネットワークコントローラ2に接続して、例えば故障位置や原因をユーザに報知する。
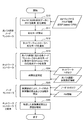
図2は、故障診断処理を示す概略のフローチャートである。
ステップS10~S12は、光パス5の終端に位置するノードコントローラ3が実行する処理である。光パス5の終端に位置するノードコントローラ3とはとは、図1においてはノードコントローラ3i,3kに相当する。
光パス5の終端に位置するノードコントローラ3は、監視対象のノード4のPre-FEC BER(Pre-Forward Error Correction Bit Error Rate)の時系列データに対する異常や変化を検知すると(S10)、Pre-FEC BERの時系列データとデジタル信号処理(DSP)でモニタする光物理特性に関するアナログ情報の時系列データとの相関解析に基づき、その劣化モードを特定する(S11)。以下、この光物理特性に関するアナログ情報のことを、DSP-based OPM(Digital Signal Processing based Optical Performance Monitoring)と記載する。ここでPre-FEC BERの時系列データに対する異常は、光パス5を流れる信号の品質が劣化していることを示している。
ステップS10~S12は、光パス5の終端に位置するノードコントローラ3が実行する処理である。光パス5の終端に位置するノードコントローラ3とはとは、図1においてはノードコントローラ3i,3kに相当する。
光パス5の終端に位置するノードコントローラ3は、監視対象のノード4のPre-FEC BER(Pre-Forward Error Correction Bit Error Rate)の時系列データに対する異常や変化を検知すると(S10)、Pre-FEC BERの時系列データとデジタル信号処理(DSP)でモニタする光物理特性に関するアナログ情報の時系列データとの相関解析に基づき、その劣化モードを特定する(S11)。以下、この光物理特性に関するアナログ情報のことを、DSP-based OPM(Digital Signal Processing based Optical Performance Monitoring)と記載する。ここでPre-FEC BERの時系列データに対する異常は、光パス5を流れる信号の品質が劣化していることを示している。
ノードコントローラ3は更に、特定した劣化モードをネットワークコントローラ2へ通知する(S12)。
ステップS13,S14は、この光伝送システム1を統括制御するネットワークコントローラ2が実行する処理である。
ネットワークコントローラ2は、光パス5の終端にあたる各ノードコントローラ3から劣化モードに該当するDSP-based OPMの時系列データを収集すると(S13)、ネットワークトポロジの情報や光パス経路や波長設定情報に基づき、故障または性能劣化が発生しているノード4または光ファイバ6の位置を特定する(S14)。
ステップS13,S14は、この光伝送システム1を統括制御するネットワークコントローラ2が実行する処理である。
ネットワークコントローラ2は、光パス5の終端にあたる各ノードコントローラ3から劣化モードに該当するDSP-based OPMの時系列データを収集すると(S13)、ネットワークトポロジの情報や光パス経路や波長設定情報に基づき、故障または性能劣化が発生しているノード4または光ファイバ6の位置を特定する(S14)。
ステップS15は、故障が発生している箇所がノード4であった場合、そのノード4を管理するノードコントローラ3が実行する処理である。ノードコントローラ3は、ノード内のトポロジ情報やPM(Performance Monitoring)情報に基づいて故障を診断し、ノード内の故障構成部品および原因を特定する(S15)。
ステップS16は、ネットワークコントローラ2および端末21が実行する処理である。ネットワークコントローラ2は、ノードコントローラ3から特定した故障構成部品情報と原因情報とを収集し、故障構成部品と原因を端末21に報知させ(S16)、図2の処理を終了する。
ステップS16は、ネットワークコントローラ2および端末21が実行する処理である。ネットワークコントローラ2は、ノードコントローラ3から特定した故障構成部品情報と原因情報とを収集し、故障構成部品と原因を端末21に報知させ(S16)、図2の処理を終了する。
以下、図3から図17を参照しつつ、光クロスコネクトが備える波長選択スイッチの出力異常により、対象チャネルおよび他チャネルの信号品質に影響が出た故障に対して、迅速な故障位置の特定と原因の特定を実現する具体的手段を説明する。
図3は、光伝送システム1Aにて異常が発生していることを示す図である。
この光伝送システム1Aは、光クロスコネクト4a~4hが、セクション6p~6vの光ファイバによって相互に接続され、ノードコントローラ3a~3hがこれら光クロスコネクト4a~4hに接続されて構成される。これらセクション6p~6vは、各ノードを相互に接続する光伝送路である。
光クロスコネクト4aは、トランスポンダ41a,41bを備え、セクション6pの光ファイバによって光クロスコネクト4cと相互に接続される。これら光クロスコネクト4aやトランスポンダ41a,41bは、ノード4を構成するハードウェアである。第1の実施形態のノードコントローラ3aは、光クロスコネクト4aやトランスポンダ41a,41bを制御するソフトウエアを実行するため、信号品質とDSP-based OPMとの相関係数の時系列データを監視し、劣化モードを判定する機能を実現する演算リソースを備えたサーバである。
なお、ネットワークコントローラ2やノードコントローラ3aは、光クロスコネクト4aを“OXC-A”として識別し、セクション6pを“セクションP”として識別する。
この光伝送システム1Aは、光クロスコネクト4a~4hが、セクション6p~6vの光ファイバによって相互に接続され、ノードコントローラ3a~3hがこれら光クロスコネクト4a~4hに接続されて構成される。これらセクション6p~6vは、各ノードを相互に接続する光伝送路である。
光クロスコネクト4aは、トランスポンダ41a,41bを備え、セクション6pの光ファイバによって光クロスコネクト4cと相互に接続される。これら光クロスコネクト4aやトランスポンダ41a,41bは、ノード4を構成するハードウェアである。第1の実施形態のノードコントローラ3aは、光クロスコネクト4aやトランスポンダ41a,41bを制御するソフトウエアを実行するため、信号品質とDSP-based OPMとの相関係数の時系列データを監視し、劣化モードを判定する機能を実現する演算リソースを備えたサーバである。
なお、ネットワークコントローラ2やノードコントローラ3aは、光クロスコネクト4aを“OXC-A”として識別し、セクション6pを“セクションP”として識別する。
光クロスコネクト4bは、トランスポンダ41cを備え、セクション6qの光ファイバによって光クロスコネクト4cと相互に接続される。これら光クロスコネクト4bやトランスポンダ41cは、ノード4を構成するハードウェアである。第1の実施形態のノードコントローラ3bは、光クロスコネクト4bやトランスポンダ41cを制御するソフトウエアを実行するため、信号品質とDSP-based OPMとの相関係数の時系列データを監視し、劣化モードを判定する機能を実現する演算リソースを備えたサーバである。なお、ネットワークコントローラ2やノードコントローラ3bは、光クロスコネクト4bを“OXC-B”として識別し、セクション6qを“セクションQ”として識別する。
光クロスコネクト4cは、セクション6pの光ファイバによって光クロスコネクト4aと相互に接続され、セクション6qの光ファイバによって光クロスコネクト4bと相互に接続される。
光クロスコネクト4cは、セクション6pの光ファイバによって光クロスコネクト4aと相互に接続され、セクション6qの光ファイバによって光クロスコネクト4bと相互に接続される。
光クロスコネクト4cは更に、セクション6rの光ファイバによって光クロスコネクト4dと相互に接続され、セクション6sの光ファイバによって光クロスコネクト4gと相互に接続される。光クロスコネクト4dは、ノード4を構成するハードウェアである。第1の実施形態のノードコントローラ3dは、光クロスコネクト4dを制御するソフトウエアを実行するため、信号品質とDSP-based OPMとの相関係数の時系列データを監視し、劣化モードを判定する機能を実現する演算リソースを備えたサーバである。なお、ネットワークコントローラ2やノードコントローラ3cは、光クロスコネクト4cを“OXC-C”として識別し、セクション6rを“セクションR”として識別し、セクション6sを“セクションS”として識別する。
光クロスコネクト4dは、セクション6uの光ファイバによって光クロスコネクト4eと相互に接続され、セクション6vの光ファイバによって光クロスコネクト4fと相互に接続される。
光クロスコネクト4dは、セクション6uの光ファイバによって光クロスコネクト4eと相互に接続され、セクション6vの光ファイバによって光クロスコネクト4fと相互に接続される。
なお、ネットワークコントローラ2やノードコントローラ3dは、光クロスコネクト4dを“OXC-D”として識別する。更にネットワークコントローラ2やノードコントローラ3dは、セクション6uを“セクションU”として識別し、セクション6vを“セクションV”として識別する。
光クロスコネクト4eは、トランスポンダ41dを備え、セクション6uの光ファイバによって光クロスコネクト4dと相互に接続される。これら光クロスコネクト4eやトランスポンダ41dは、ノード4を構成するハードウェアである。第1の実施形態のノードコントローラ3eは、光クロスコネクト4eやトランスポンダ41dを制御するソフトウエアを実行するため、信号品質とDSP-based OPMとの相関係数の時系列データを監視し、劣化モードを判定する機能を実現する演算リソースを備えたサーバである。
光クロスコネクト4eは、トランスポンダ41dを備え、セクション6uの光ファイバによって光クロスコネクト4dと相互に接続される。これら光クロスコネクト4eやトランスポンダ41dは、ノード4を構成するハードウェアである。第1の実施形態のノードコントローラ3eは、光クロスコネクト4eやトランスポンダ41dを制御するソフトウエアを実行するため、信号品質とDSP-based OPMとの相関係数の時系列データを監視し、劣化モードを判定する機能を実現する演算リソースを備えたサーバである。
なお、ネットワークコントローラ2やノードコントローラ3eは、光クロスコネクト4eを“OXC-E”として識別する。更にネットワークコントローラ2やノードコントローラ3eは、セクション6uを“セクションU”として識別する。
光クロスコネクト4fは、トランスポンダ41e,41fを備え、セクション6vの光ファイバによって光クロスコネクト4dと相互に接続される。これら光クロスコネクト4fやトランスポンダ41e,41fは、ノード4を構成するハードウェアである。第1の実施形態のノードコントローラ3fは、光クロスコネクト4fやトランスポンダ41e,41fを制御するソフトウエアを実行するため、信号品質とDSP-based OPMとの相関係数の時系列データを監視し、劣化モードを判定する機能を実現する演算リソースを備えたサーバである。
なお、ネットワークコントローラ2やノードコントローラ3fは、光クロスコネクト4fを“OXC-F”として識別する。更にネットワークコントローラ2やノードコントローラ3fは、セクション6vを“セクションV”として識別する。
光クロスコネクト4fは、トランスポンダ41e,41fを備え、セクション6vの光ファイバによって光クロスコネクト4dと相互に接続される。これら光クロスコネクト4fやトランスポンダ41e,41fは、ノード4を構成するハードウェアである。第1の実施形態のノードコントローラ3fは、光クロスコネクト4fやトランスポンダ41e,41fを制御するソフトウエアを実行するため、信号品質とDSP-based OPMとの相関係数の時系列データを監視し、劣化モードを判定する機能を実現する演算リソースを備えたサーバである。
なお、ネットワークコントローラ2やノードコントローラ3fは、光クロスコネクト4fを“OXC-F”として識別する。更にネットワークコントローラ2やノードコントローラ3fは、セクション6vを“セクションV”として識別する。
光クロスコネクト4gは、トランスポンダ41gを備え、セクション6sの光ファイバによって光クロスコネクト4cと相互に接続される。これら光クロスコネクト4gやトランスポンダ41gは、ノード4を構成するハードウェアである。第1の実施形態のノードコントローラ3gは、光クロスコネクト4gやトランスポンダ41gを制御するソフトウエアを実行するため、信号品質とDSP-based OPMとの相関係数の時系列データを監視し、劣化モードを判定する機能を実現する演算リソースを備えたサーバである。
なお、ネットワークコントローラ2やノードコントローラ3gは、光クロスコネクト4gを“OXC-G”として識別する。更にネットワークコントローラ2やノードコントローラ3gは、セクション6sを“セクションS”として識別する。
光クロスコネクト4hは、トランスポンダ41hを備え、セクション6tの光ファイバによって光クロスコネクト4dと相互に接続される。これら光クロスコネクト4hやトランスポンダ41hは、ノード4を構成するハードウェアである。第1の実施形態のノードコントローラ3hは、光クロスコネクト4hやトランスポンダ41hを制御するソフトウエアを実行するため、信号品質とDSP-based OPMとの相関係数の時系列データを監視し、劣化モードを判定する機能を実現する演算リソースを備えたサーバである。
なお、ネットワークコントローラ2やノードコントローラ3gは、光クロスコネクト4gを“OXC-G”として識別する。更にネットワークコントローラ2やノードコントローラ3gは、セクション6sを“セクションS”として識別する。
光クロスコネクト4hは、トランスポンダ41hを備え、セクション6tの光ファイバによって光クロスコネクト4dと相互に接続される。これら光クロスコネクト4hやトランスポンダ41hは、ノード4を構成するハードウェアである。第1の実施形態のノードコントローラ3hは、光クロスコネクト4hやトランスポンダ41hを制御するソフトウエアを実行するため、信号品質とDSP-based OPMとの相関係数の時系列データを監視し、劣化モードを判定する機能を実現する演算リソースを備えたサーバである。
なお、ネットワークコントローラ2やノードコントローラ3hは、光クロスコネクト4hを“OXC-H”として識別する。更にネットワークコントローラ2やノードコントローラ3hは、セクション6tを“セクションT”として識別する。
光パス5-1は、光伝送システム1Aの一端から他端までを繋ぐ論理的な通信路であり、光クロスコネクト4aのトランスポンダ41aで終端され、更に光クロスコネクト4dのトランスポンダ41dで終端される。光パス5-1は、光クロスコネクト4aから、セクション6pと光クロスコネクト4cとセクション6rを介して光クロスコネクト4dに繋がり、更にセクション6uを介して光クロスコネクト4dに繋がる。
光パス5-1は、光伝送システム1Aの一端から他端までを繋ぐ論理的な通信路であり、光クロスコネクト4aのトランスポンダ41aで終端され、更に光クロスコネクト4dのトランスポンダ41dで終端される。光パス5-1は、光クロスコネクト4aから、セクション6pと光クロスコネクト4cとセクション6rを介して光クロスコネクト4dに繋がり、更にセクション6uを介して光クロスコネクト4dに繋がる。
光パス5-2は、光伝送システム1Aの一端から他端までを繋ぐ論理的な通信路であり、光クロスコネクト4bのトランスポンダ41cで終端され、更に光クロスコネクト4fのトランスポンダ41eで終端される。光パス5-2は、光クロスコネクト4bから、セクション6qと光クロスコネクト4cとセクション6rを介して光クロスコネクト4dに繋がり、更にセクション6vを介して光クロスコネクト4fに繋がる。
光パス5-1と光パス5-2とは、異なる波長チャネルの通信路であり、光クロスコネクト4cとセクション6rと光クロスコネクト4dを共用している。
光パス5-1と光パス5-2とは、異なる波長チャネルの通信路であり、光クロスコネクト4cとセクション6rと光クロスコネクト4dを共用している。
光パス5-3は、光伝送システム1Aの一端から他端までを繋ぐ論理的な通信路であり、光クロスコネクト4aのトランスポンダ41bで終端され、更に光クロスコネクト4gのトランスポンダ41gで終端される。光パス5-3は、光クロスコネクト4aから、セクション6pと光クロスコネクト4cとセクション6sを介して、その先の光クロスコネクト4gのトランスポンダ41に繋がる。
光パス5-1と光パス5-3とは、異なる波長チャネルの通信路であり、光クロスコネクト4aとセクション6pと光クロスコネクト4cを共用している。光パス5-2と光パス5-3とは、異なる波長チャネルの通信路であり、光クロスコネクト4cを共用している。
光パス5-1と光パス5-3とは、異なる波長チャネルの通信路であり、光クロスコネクト4aとセクション6pと光クロスコネクト4cを共用している。光パス5-2と光パス5-3とは、異なる波長チャネルの通信路であり、光クロスコネクト4cを共用している。
光パス5-4は、光伝送システム1Aの一端から他端までを繋ぐ論理的な通信路であり、光クロスコネクト4fのトランスポンダ41fで終端され、更に、光クロスコネクト4hのトランスポンダ41hで終端される。光パス5-4は、光クロスコネクト4fから、セクション6vと光クロスコネクト4dとセクション6tを介して、その先の光クロスコネクト4hのトランスポンダ41hに繋がる。
光パス5-1と光パス5-4とは、異なる波長チャネルの通信路であり、光クロスコネクト4dを共用している。光パス5-2と光パス5-4とは、異なる波長チャネルの通信路であり、光クロスコネクト4dとセクション6vと光クロスコネクト4fを共用している。
光パス5-1と光パス5-4とは、異なる波長チャネルの通信路であり、光クロスコネクト4dを共用している。光パス5-2と光パス5-4とは、異なる波長チャネルの通信路であり、光クロスコネクト4dとセクション6vと光クロスコネクト4fを共用している。
なお、ネットワークコントローラ2やノードコントローラ3(図1参照)は、光パス5-1を“光パス#1”として認識し、光パス5-2を“光パス#2”として認識し、光パス5-3を“光パス#3”として認識し、光パス5-4を“光パス#4”として認識する。
図3に示すように、光クロスコネクト4cが備える波長選択スイッチの出力パワー異常が発生すると、光パス5-1に対する波長選択スイッチの設定が異常となる。すると、該当する光パス5-1のファイバ入力パワーが増加し、Self Phase Modulation(自己位相変調)による非線形効果の影響が大きくなる。同時に、同一のセクション6rを通過し、かつ、隣接する波長の光パス5-2は、Cross Phase Modulation(相互位相変調)による非線形効果の影響が大きくなる。これにより、光パス5-1と光パス5-2の終端で、それぞれ信号品質の劣化が発生する。
このような信号品質の劣化を検知し、かつ信号品質の劣化モードを特定するため、各光パス5-1~5-4の終点となるトランスポンダ41を監視するノードコントローラ3は、Pre-FEC BERの時系列データと各種DSP-based OPMの時系列データとの相関係数を監視する。そして、相関係数の大きいDSP-based OPMを抽出して劣化モードを特定する。これらの監視処理は、トランスポンダ41を監視するノードコントローラ3の内部で行われる。これにより、ネットワークコントローラ2側の負荷を下げ、データ通信ネットワークの輻輳を回避することができる。
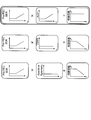
図4は、通常時のエラー訂正前のビットエラー率の時系列データとDSP-based OPMの時系列データ、および、それらの相関係数の時系列データを示すグラフである。
これらグラフのうち左側の3個は、何れもPre-FEC BERの時系列データであり、中間の3個は、各種DSP-based OPMの時系列データである。これらグラフのうち右側の3個は、各行の右側グラフに示したPre-FEC BERの時系列データと、中間グラフに示した各種DSP-based OPMの時系列データとの相関係数を示している。
1行目には、Pre-FEC BERの時系列データとACF(Auto Correlation Function:自己相関関数)の時系列データと、これらの相関を演算した結果である相関係数の時系列データとが示されている。Pre-FEC BERの時系列データは、所定値のまま変動していない。ACFの時系列データも同様に所定値のまま変動していない。よって、これらの相関係数の時系列データも1のまま変動しない。
これらグラフのうち左側の3個は、何れもPre-FEC BERの時系列データであり、中間の3個は、各種DSP-based OPMの時系列データである。これらグラフのうち右側の3個は、各行の右側グラフに示したPre-FEC BERの時系列データと、中間グラフに示した各種DSP-based OPMの時系列データとの相関係数を示している。
1行目には、Pre-FEC BERの時系列データとACF(Auto Correlation Function:自己相関関数)の時系列データと、これらの相関を演算した結果である相関係数の時系列データとが示されている。Pre-FEC BERの時系列データは、所定値のまま変動していない。ACFの時系列データも同様に所定値のまま変動していない。よって、これらの相関係数の時系列データも1のまま変動しない。
2行目には、Pre-FEC BERの時系列データとOSNR(Optical Signal to Noise Ratio)の時系列データと、これらの相関を演算した結果である相関係数の時系列データとが示されている。Pre-FEC BERの時系列データは、所定値のまま変動していない。OSNRの時系列データも同様に所定値のまま変動していない。よって、これらの相関係数の時系列データも1のまま変動しない。
3行目には、Pre-FEC BERの時系列データとSpectrum Symmetry(スペクトル対称性)の時系列データと、これらの相関を演算した結果である相関係数の時系列データとが示されている。Pre-FEC BERの時系列データは、所定値のまま変動していない。Spectrum Symmetryの時系列データも同様に所定値のまま変動していない。よって、これらの相関係数の時系列データも1のまま変動しない。
3行目には、Pre-FEC BERの時系列データとSpectrum Symmetry(スペクトル対称性)の時系列データと、これらの相関を演算した結果である相関係数の時系列データとが示されている。Pre-FEC BERの時系列データは、所定値のまま変動していない。Spectrum Symmetryの時系列データも同様に所定値のまま変動していない。よって、これらの相関係数の時系列データも1のまま変動しない。
図5は、異常時のエラー訂正前のビットエラー率の時系列データとDSP-based OPMの時系列データ、および、それらの相関係数の時系列データを示すグラフである。
1行目には、Pre-FEC BERの時系列データとACFの時系列データと、これらの相関を演算した結果である相関係数の時系列データとが示されている。Pre-FEC BERの時系列データは、所定タイミングで増加しており、信号品質が劣化していることを示している。ACFの時系列データも、この所定タイミングで増加している。よって、これらの相関係数の時系列データも1のまま変動しない。
1行目には、Pre-FEC BERの時系列データとACFの時系列データと、これらの相関を演算した結果である相関係数の時系列データとが示されている。Pre-FEC BERの時系列データは、所定タイミングで増加しており、信号品質が劣化していることを示している。ACFの時系列データも、この所定タイミングで増加している。よって、これらの相関係数の時系列データも1のまま変動しない。
2行目には、Pre-FEC BERの時系列データとOSNRの時系列データと、これらの相関を演算した結果である相関係数の時系列データとが示されている。Pre-FEC BERの時系列データは、所定タイミングで増加しており、信号品質が劣化していることを示している。OSNRの時系列データは、所定値のまま変動していない。よって、これらの相関係数の時系列データは、所定タイミングの後、1から次第に減少する。
3行目には、Pre-FEC BERの時系列データとSpectrum Symmetryの時系列データと、これらの相関を演算した結果である相関係数の時系列データとが示されている。Pre-FEC BERの時系列データは、所定タイミングで増加しており、信号品質が劣化していることを示している。Spectrum Symmetryの時系列データは、所定値のまま変動していない。よって、これらの相関係数の時系列データは所定タイミングの後、1から次第に減少する。
3行目には、Pre-FEC BERの時系列データとSpectrum Symmetryの時系列データと、これらの相関を演算した結果である相関係数の時系列データとが示されている。Pre-FEC BERの時系列データは、所定タイミングで増加しており、信号品質が劣化していることを示している。Spectrum Symmetryの時系列データは、所定値のまま変動していない。よって、これらの相関係数の時系列データは所定タイミングの後、1から次第に減少する。
ここでは、各種DSP-based OPMの時系列データのうち、異常発生前後においてPre-FEC BERの時系列データとの相関を有しているのは、ACFの時系列データである。よって、故障要因と故障箇所は、ACFの増加に係るものであると特定できる。
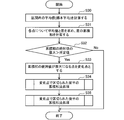
図6と図7は、異常/変化検知処理を示すフローチャートである。
異常/変化検知処理には様々なアルゴリズムがあるが、ここでは古典的な変化点アルゴリズムである累積和法を記載する。なお、その他のアルゴリズムを適用してもよい。
最初、ノードコントローラ3(図1参照)は、系列全体を処理対象の区間として設定し(S20)、設定した区間に対する累積和法処理を行う(S21)。この累積和法処理は、図7に示される再帰処理である。
異常/変化検知処理には様々なアルゴリズムがあるが、ここでは古典的な変化点アルゴリズムである累積和法を記載する。なお、その他のアルゴリズムを適用してもよい。
最初、ノードコントローラ3(図1参照)は、系列全体を処理対象の区間として設定し(S20)、設定した区間に対する累積和法処理を行う(S21)。この累積和法処理は、図7に示される再帰処理である。
図7に示すように、ノードコントローラ3は、処理対象である区間内の平均値(標本平均)を計算する(S30)。ノードコントローラ3は、各点について平均値と差を求める、平均値との差の累積和を計算する(S31)。その後、ノードコントローラ3は、累積和の絶対値の最大と、所定値(閾値)とを比較する(S32)。ノードコントローラ3は、累積和の絶対値の最大が所定値以下ならば(No)、この検知処理を終了する。ノードコントローラ3は、累積和の絶対値の最大が所定値を超えていたならば(Yes)、ステップS33の処理に進む。
ステップS33において、ノードコントローラ3は、累積和の絶対値が最大になる点(タイミング)を新たな変化点とする。
ステップS34において、ノードコントローラ3は、処理対象である区間のうち、ステップS33で検知した変化点によって区切られた前半を新たな区間として、この累積和法処理を再帰的に呼び出す。
ステップS35において、ノードコントローラ3は、処理対象である区間のうち、ステップS33で検知した変化点によって区切られた後半を新たな区間として、この累積和法処理を再帰的に呼び出したのち、図7の処理を終了する。
ステップS34において、ノードコントローラ3は、処理対象である区間のうち、ステップS33で検知した変化点によって区切られた前半を新たな区間として、この累積和法処理を再帰的に呼び出す。
ステップS35において、ノードコントローラ3は、処理対象である区間のうち、ステップS33で検知した変化点によって区切られた後半を新たな区間として、この累積和法処理を再帰的に呼び出したのち、図7の処理を終了する。
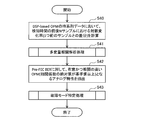
図8は、異常/変化を検知した場合の分析処理を示すフローチャートである。
ノードコントローラ3は、各種DSP-based OPMの時系列データにおいて、検知時間の前後Nサンプルにおける対数変化率(1つ前のサンプルとの差分)を計算し(S40)、多変量相関解析処理(図9参照)を呼び出す(S41)。
ノードコントローラ3は、各種DSP-based OPMの時系列データにおいて、検知時間の前後Nサンプルにおける対数変化率(1つ前のサンプルとの差分)を計算し(S40)、多変量相関解析処理(図9参照)を呼び出す(S41)。
その後、ノードコントローラ3は、Pre-FEC BERに対して、有意かつ相関の高い(相関係数の絶対値が基準値以上となる)DSP-based OPMを抽出する(S42)。この抽出処理は、前記した図5と図6で説明した動作である。これにより、ノードコントローラ3は、劣化モードを判定したのち、図8の処理を終了する。
図9は、多変量相関解析処理を示すフローチャートである。
ステップS50~S54において、ノードコントローラ3は、各種DSP-based OPMの時系列データの対数変化率について、各処理を繰り返す。
ステップS51において、ノードコントローラ3は、Pre-FEC BERの時系列データに対する当該DSP-based OPMの時系列データの対数変化率との相関係数行列を計算する。
ステップS52において、ノードコントローラ3は、Pre-FEC BERの時系列データに対する当該DSP-based OPMの時系列データの対数変化率との相関のp値を計算する。このp値を有意水準αと比較することにより、相関が有意かどうかを判断することができる。例えば、有意水準αが0.05の場合、実際には相関が存在しないにもかかわらず相関が存在すると結論付けるリスクが5%あることを示す。
ステップS50~S54において、ノードコントローラ3は、各種DSP-based OPMの時系列データの対数変化率について、各処理を繰り返す。
ステップS51において、ノードコントローラ3は、Pre-FEC BERの時系列データに対する当該DSP-based OPMの時系列データの対数変化率との相関係数行列を計算する。
ステップS52において、ノードコントローラ3は、Pre-FEC BERの時系列データに対する当該DSP-based OPMの時系列データの対数変化率との相関のp値を計算する。このp値を有意水準αと比較することにより、相関が有意かどうかを判断することができる。例えば、有意水準αが0.05の場合、実際には相関が存在しないにもかかわらず相関が存在すると結論付けるリスクが5%あることを示す。
ステップS53において、ノードコントローラ3は、Pre-FEC BER時系列データに対する当該DSP-based OPMの時系列データの偏相関係数行列を計算する。この偏相関係数行列を参照することにより、第三の変数の影響により疑似相関・疑似無相関になることを回避することができる。
ステップS54において、ノードコントローラ3は、何れかのDSP-based OPMの時系列データについて処理していなかったならば、ステップS50に戻る。ノードコントローラ3は、全てのDSP-based OPMの時系列データについて処理したならば、図9の処理を終了する。
ノードコントローラ3は、変化を検知した場合に限り、検知の前後の時間幅の時系列データを利用して相関係数を算出するので、検知の処理負荷を抑制することができる。
ステップS54において、ノードコントローラ3は、何れかのDSP-based OPMの時系列データについて処理していなかったならば、ステップS50に戻る。ノードコントローラ3は、全てのDSP-based OPMの時系列データについて処理したならば、図9の処理を終了する。
ノードコントローラ3は、変化を検知した場合に限り、検知の前後の時間幅の時系列データを利用して相関係数を算出するので、検知の処理負荷を抑制することができる。
図10は、故障位置特定処理を示すフローチャートである。
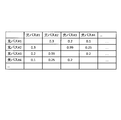
図1に示したように、ネットワークコントローラ2は、光パス終端にあたるノードを管理する各ノードコントローラから劣化モードに該当するDSP-based OPMの時系列データを収集する(S13)。その後、ネットワークコントローラ2は、各光パス間の相関係数行列を計算し(S60)、相関係数が閾値を超えているか否かを判定する(S61)。相関係数行列の計算例を図13に示す。各セルの数値は、セルの数値は、劣化モードに係るDSP-based OPMの時系列データの、当該行および当該列の光パス間における相関を示している。例えば、閾値を0.8と設定する場合は、光パス#2と光パス#3の相関係数が閾値を超えていると判定される。相関係数が閾値を超えていないならば、図10に記載の処理を終了する。
図1に示したように、ネットワークコントローラ2は、光パス終端にあたるノードを管理する各ノードコントローラから劣化モードに該当するDSP-based OPMの時系列データを収集する(S13)。その後、ネットワークコントローラ2は、各光パス間の相関係数行列を計算し(S60)、相関係数が閾値を超えているか否かを判定する(S61)。相関係数行列の計算例を図13に示す。各セルの数値は、セルの数値は、劣化モードに係るDSP-based OPMの時系列データの、当該行および当該列の光パス間における相関を示している。例えば、閾値を0.8と設定する場合は、光パス#2と光パス#3の相関係数が閾値を超えていると判定される。相関係数が閾値を超えていないならば、図10に記載の処理を終了する。
次にネットワークコントローラ2は、セクション・装置情報と周波数スロット番号の2次元マップ上に、相関係数が閾値を超えたと判定された複数の光パスの組合せが設定されている周波数スロット番号、セクション番号およびOXC番号の該当セルにマークを付与する(S62)。2次元マップの例を図14に示す。図14において光パス#2は周波数スロット番号#3に該当し、光パス#3は周波数スロット番号#4に該当すると想定している。ステップS62において、ネットワークコントローラ2は、光パス#2および光パス#3が設定されているセクション番号とOXC番号の該当セルにマーク(この例では“〇”)を付与する。
更にネットワークコントローラ2は、相関係数が閾値を超えた複数の光パスの組合せで共通するセクション番号またはOXC番号のうち、最も上流側に位置するセクションまたはOXCを故障箇所として特定し(S63)、図10の処理を終了する。
図14の場合、光パス#2と光パス#3で共通するセクション番号はR、OXC番号はC、D、Fである。これらのうち、最も上流側に位置するのはOXC-Cであるため、ネットワークコントローラ2は、OXC-Cを被疑箇所として特定する。これにより、どのセクションやどのノードで不具合が発生しているかを容易に判定可能である。
図14の場合、光パス#2と光パス#3で共通するセクション番号はR、OXC番号はC、D、Fである。これらのうち、最も上流側に位置するのはOXC-Cであるため、ネットワークコントローラ2は、OXC-Cを被疑箇所として特定する。これにより、どのセクションやどのノードで不具合が発生しているかを容易に判定可能である。
図11は、各種DSP-based OPMを示す図である。
各種DSP-based OPMは、伝送路特性と装置・デバイス特性とトランスポンダ特性に大別される。これを図の「大分類」の項目に記載している。
「大分類」の項目の右側は、各特性に属する小分類を示している。伝送路特性には、波長分散と偏波モード分散とSOP(偏波状態:State Of Polarization)の3個の小分類が属している。波長分散は、波長分散補償量としてモニタされる。偏波モード分散は、偏波モード分散補償量としてモニタされる。SOP(偏波状態:State Of Polarization)変動は、2行2列のMulti-Input Multi-Outputの係数行列に基づき算出されるストークスベクトルによりモニタされる。
各種DSP-based OPMは、伝送路特性と装置・デバイス特性とトランスポンダ特性に大別される。これを図の「大分類」の項目に記載している。
「大分類」の項目の右側は、各特性に属する小分類を示している。伝送路特性には、波長分散と偏波モード分散とSOP(偏波状態:State Of Polarization)の3個の小分類が属している。波長分散は、波長分散補償量としてモニタされる。偏波モード分散は、偏波モード分散補償量としてモニタされる。SOP(偏波状態:State Of Polarization)変動は、2行2列のMulti-Input Multi-Outputの係数行列に基づき算出されるストークスベクトルによりモニタされる。
装置・デバイス特性には、OSNR(Optical Signal to Noise Ratio:光信号対雑音比)、PDL(Polarization Dependent Loss:偏波依存損失)、反射光を含むクロストーク、ファイバ非線形効果、ISI(Inter-Symbol Interference:符号間干渉)の小分類が属している。OSNRは、Error Vector Magnitude(EVM:エラー・ベクトル振幅)としてモニタされる。PDL(偏波依存損失)は、X/Y間のOSNR差分としてモニタされる。反射光を含むクロストークとISIは、FIR(Finite Impulse Response)フィルタのTap値(係数)としてモニタされる。ファイバ非線形効果は、シンボル間のAuto Correlation Function(自己相関関数)としてモニタされる。
トランスポンダ特性には、コンスタレーション歪みと光源周波数とSpectrum Symmetryの3個の小分類が属している。コンスタレーション歪みは、コンスタレーションの幾何学的形状に基づく指標値としてモニタされる。光源周波数は、周波数オフセット量としてモニタされる。Spectrum Symmetryは、スペクトル対称性に基づく指標値としてモニタされる。
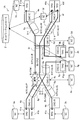
図12は、ネットワークコントローラ2が、光伝送システム1Aで発生した異常情報を収集する動作を示す図である。この図12は、図3に示した光伝送システム1Aに対してネットワークコントローラ2とその動作を追記している。
光パス終端となる光クロスコネクト4eを監視するノードコントローラ3eは、劣化モードに係わるDSP-based OPMの時系列データをトランスポンダ41dから抽出して、ネットワークコントローラ2に転送する。光パス終端となる光クロスコネクト4fを監視するノードコントローラ3fは、劣化モードに係わるDSP-based OPMの時系列データをトランスポンダ41e,41fから抽出して、ネットワークコントローラ2に転送する。
光パス終端となる光クロスコネクト4eを監視するノードコントローラ3eは、劣化モードに係わるDSP-based OPMの時系列データをトランスポンダ41dから抽出して、ネットワークコントローラ2に転送する。光パス終端となる光クロスコネクト4fを監視するノードコントローラ3fは、劣化モードに係わるDSP-based OPMの時系列データをトランスポンダ41e,41fから抽出して、ネットワークコントローラ2に転送する。
更に光クロスコネクト4gから外部に接続されるトランスポンダ41gを監視するノードコントローラ3gも同様に、劣化モードに係わるDSP-based OPMの時系列データを抽出して、ネットワークコントローラ2に転送する。
ネットワークコントローラ2は、自身が管理している、セクション情報、パス経路情報、使用周波数情報と、各ノードコントローラから収集したDSP-based OPMの時系列データに基づき、大きい相関を示したパスが共用するセクション、および、占有する周波数スロット位置を判定する。これにより、ネットワークコントローラ2は、光クロスコネクト4cでのパワー設定異常によりセクション6rでのファイバ非線形効果による影響が変化したと特定できる。
ネットワークコントローラ2は、自身が管理している、セクション情報、パス経路情報、使用周波数情報と、各ノードコントローラから収集したDSP-based OPMの時系列データに基づき、大きい相関を示したパスが共用するセクション、および、占有する周波数スロット位置を判定する。これにより、ネットワークコントローラ2は、光クロスコネクト4cでのパワー設定異常によりセクション6rでのファイバ非線形効果による影響が変化したと特定できる。
以下、ネットワークコントローラ2が何れかのノードで不具合が発生していることを判定した場合、故障診断によりノード内の故障構成部品および原因特定について図15から図17により説明する。
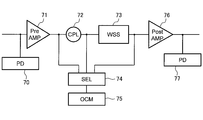
図15は、ノード4の内部の構成部品を示す図である。
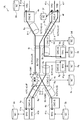
ノード4は、前段アンプ71および光検出器(PD:Photo Detector)70と、カプラ(CPL:Coupler)72および波長選択スイッチ73と、後段アンプ76および光検出器77と、選択器(SEL:Selector)74と、光チャネルモニタ(OCM:Optical Channel Monitor)75などの構成部品を備えている。
前段アンプ71の入力側には、光検出器70が接続される。この前段アンプ71の出力側は、カプラ72および波長選択スイッチ73を介して、後段アンプ76の入力側に接続される。選択器74は、前段アンプ71の出力と、カプラ72の出力と、波長選択スイッチ73の出力のうち何れかを選択して光チャネルモニタ75に出力するものである。
ノード4は、前段アンプ71および光検出器(PD:Photo Detector)70と、カプラ(CPL:Coupler)72および波長選択スイッチ73と、後段アンプ76および光検出器77と、選択器(SEL:Selector)74と、光チャネルモニタ(OCM:Optical Channel Monitor)75などの構成部品を備えている。
前段アンプ71の入力側には、光検出器70が接続される。この前段アンプ71の出力側は、カプラ72および波長選択スイッチ73を介して、後段アンプ76の入力側に接続される。選択器74は、前段アンプ71の出力と、カプラ72の出力と、波長選択スイッチ73の出力のうち何れかを選択して光チャネルモニタ75に出力するものである。
後段アンプ76の出力側は、光検出器77が接続される。
ノードコントローラ3は、該当ノードからのみPM情報の取得を実施する。これは、従来のように全てのノードのPM情報をネットワークコントローラ2が収集する方法とは異なる。この方法により、ネットワークコントローラ2側の負荷やデータ通信ネットワークの輻輳を回避でき、PM情報の時系列データの取得におけるサンプリング間隔を小さくすることができる。
ノードコントローラ3は、光検出器70,77から光パワーを取得する。ノードコントローラ3は、前段アンプ71や後段アンプ76から温度やレーザバイアス電流値を取得する。ノードコントローラ3は、光チャネルモニタ75からチャネル単位の光パワーを取得し、波長選択スイッチ73から温度や光減衰量を取得する。
ノードコントローラ3は、該当ノードからのみPM情報の取得を実施する。これは、従来のように全てのノードのPM情報をネットワークコントローラ2が収集する方法とは異なる。この方法により、ネットワークコントローラ2側の負荷やデータ通信ネットワークの輻輳を回避でき、PM情報の時系列データの取得におけるサンプリング間隔を小さくすることができる。
ノードコントローラ3は、光検出器70,77から光パワーを取得する。ノードコントローラ3は、前段アンプ71や後段アンプ76から温度やレーザバイアス電流値を取得する。ノードコントローラ3は、光チャネルモニタ75からチャネル単位の光パワーを取得し、波長選択スイッチ73から温度や光減衰量を取得する。
図16は、被疑装置における各光パスの光減衰量を示すグラフである。
今回想定するケースでは、所定タイミングにおいて、波長選択スイッチ73の光パス#1の減衰量が異常値になっている。
今回想定するケースでは、所定タイミングにおいて、波長選択スイッチ73の光パス#1の減衰量が異常値になっている。
図17は、被疑装置における各光パスの光パワーを示すグラフである。
今回想定するケースでは、上記した所定タイミングにおいて、光チャネルモニタ75でのチャネル単位の光パス#1のパワーも異常値になっている。これら図17や図18を参照することで、ノードコントローラ3は、光クロスコネクト4c内の波長選択スイッチのパッケージ(構成部品)に異常があることを判定できる。更にネットワークコントローラ2ではなく、各ノードコントローラ3が故障判定することにより、データ分解能を向上させ、かつネットワークコントローラ2の処理の逼迫を回避することができる。
今回想定するケースでは、上記した所定タイミングにおいて、光チャネルモニタ75でのチャネル単位の光パス#1のパワーも異常値になっている。これら図17や図18を参照することで、ノードコントローラ3は、光クロスコネクト4c内の波長選択スイッチのパッケージ(構成部品)に異常があることを判定できる。更にネットワークコントローラ2ではなく、各ノードコントローラ3が故障判定することにより、データ分解能を向上させ、かつネットワークコントローラ2の処理の逼迫を回避することができる。
図18は、第2の実施形態における光伝送システム1Bの概念図である。
光伝送システム1は、複数のノード4i~4kが、光伝送路である光ファイバ6によって相互に接続されて構成され、更にネットワークコントローラ2とを備える。
ノード4iが備えるトランスポンダ41iと、ノード4kが備えるトランスポンダ41kとは、光パス5によって通信可能に接続される。光パス5は、物理的な通信路である光ファイバ6とノード4jとを介して、トランスポンダ41iとトランスポンダ41kとを接続する論理的な通信路である。
光伝送システム1は、複数のノード4i~4kが、光伝送路である光ファイバ6によって相互に接続されて構成され、更にネットワークコントローラ2とを備える。
ノード4iが備えるトランスポンダ41iと、ノード4kが備えるトランスポンダ41kとは、光パス5によって通信可能に接続される。光パス5は、物理的な通信路である光ファイバ6とノード4jとを介して、トランスポンダ41iとトランスポンダ41kとを接続する論理的な通信路である。
トランスポンダ41i,41kは、内部にデジタル信号処理(DSP)のチップが含まれており、その余剰リソースを活用して、相関係数の時系列データを監視し故障モードを特定する機能を実現する。トランスポンダ41i,41kは、ノードを監視するコントローラ機能を具現化するプログラムを実行することで、自身を監視して信号品質の劣化をそれぞれ検知し、この信号品質の時系列データと相関のある光物理特性の時系列データを特定し、劣化モードをそれぞれ判定する。ノード4jは、自身を監視して信号品質の劣化をそれぞれ検知し、この信号品質の時系列データと相関のある光物理特性の時系列データを特定し、劣化モードをそれぞれ判定する。これらトランスポンダ41i,41kやノード4jは、信号品質の劣化をそれぞれ検知し、この信号品質の時系列データと相関のある光物理特性の時系列データを特定し、劣化モードをそれぞれ判定する判定手段として機能する。
ネットワークコントローラ2は、トランスポンダ41i,41kやノード4jとデータ通信ネットワークを介して接続される。ネットワークコントローラ2は、トランスポンダ41i,41kやノード4jを制御し、かつこれらを監視する。ネットワークコントローラ2は、トランスポンダ41i,41kやノード4jが信号品質の劣化を検知したノードおよび、劣化モード、各ノードのトポロジ、各ノード4間に設定される光パスの情報に基づき、故障または性能劣化が発生したノードまたは構成部品を特定する。端末21は、ネットワークコントローラ2に接続して、例えば故障位置や原因をユーザに報知する。
ネットワークコントローラ2は、トランスポンダ41i,41kやノード4jとデータ通信ネットワークを介して接続される。ネットワークコントローラ2は、トランスポンダ41i,41kやノード4jを制御し、かつこれらを監視する。ネットワークコントローラ2は、トランスポンダ41i,41kやノード4jが信号品質の劣化を検知したノードおよび、劣化モード、各ノードのトポロジ、各ノード4間に設定される光パスの情報に基づき、故障または性能劣化が発生したノードまたは構成部品を特定する。端末21は、ネットワークコントローラ2に接続して、例えば故障位置や原因をユーザに報知する。
第2の実施形態によれば、ハードウェアとしてのノードコントローラを設けることなく、各トランスポンダ41や各ノード4に、ノードコントローラ機能を具現化するプログラムを実行させることで、自律的に信号品質の劣化を検知させることができる。
(変形例)
本発明は、上記実施形態に限定されることなく、本発明の趣旨を逸脱しない範囲で、変更実施が可能であり、例えば、次の(a)~(c)のようなものがある。
(a) 光伝送システムのトポロジは、図3や図12に示したものに限定されない。
(b) 光パスを流れる信号の品質劣化を検知する方法は、Pre-FEC BERの時系列データに対する異常を検知することに限定されず、信号品質をデジタルで測定して異常を検知するものであればよい。
(c) ノードコントローラが検知する特徴量は、実施形態で列挙したものに限定されず、ノード(装置)や光伝送路の故障と相関性を有するものであればよい。
本発明は、上記実施形態に限定されることなく、本発明の趣旨を逸脱しない範囲で、変更実施が可能であり、例えば、次の(a)~(c)のようなものがある。
(a) 光伝送システムのトポロジは、図3や図12に示したものに限定されない。
(b) 光パスを流れる信号の品質劣化を検知する方法は、Pre-FEC BERの時系列データに対する異常を検知することに限定されず、信号品質をデジタルで測定して異常を検知するものであればよい。
(c) ノードコントローラが検知する特徴量は、実施形態で列挙したものに限定されず、ノード(装置)や光伝送路の故障と相関性を有するものであればよい。
1,1A 光伝送システム
2 ネットワークコントローラ
21 端末
3,3i~3k ノードコントローラ
4,4i~4k ノード
4a~4f 光クロスコネクト
41,41a~41k トランスポンダ
5,5-1~5-4 光パス
6 光ファイバ
6p~6v セクション (光伝送路)
2 ネットワークコントローラ
21 端末
3,3i~3k ノードコントローラ
4,4i~4k ノード
4a~4f 光クロスコネクト
41,41a~41k トランスポンダ
5,5-1~5-4 光パス
6 光ファイバ
6p~6v セクション (光伝送路)
Claims (8)
- 光伝送路によって相互に接続された複数のノードと、
複数の各前記ノードにおける信号品質の劣化をそれぞれ検知し、前記信号品質の時系列データと相関のある光物理特性の時系列データを特定し、劣化モードをそれぞれ判定する複数の判定手段と、
前記判定手段が前記信号品質の劣化を検知したノードおよび、前記劣化モード、複数の各前記ノードから構成されるネットワークトポロジ、各前記ノード間に設定される光パスの情報に基づき、故障または性能劣化が発生したノードまたは構成部品を特定するネットワークコントローラと、
を備えることを特徴とする光伝送システム。 - 前記判定手段は、前記信号品質の劣化を検知すると、検知したタイミングの前後の所定期間における光物理特性と前記信号品質との相関を判定する、
ことを特徴とする請求項1に記載の光伝送システム。 - 前記判定手段は、前記信号品質の劣化を検知したノードまたは構成部品を管理するノードコントーラである、
ことを特徴とする請求項1または2に記載の光伝送システム。 - 前記判定手段は、前記信号品質の劣化を検知したノードに設けられたトランスポンダである、
ことを特徴とする請求項1または2に記載の光伝送システム。 - 前記ノードを通過する各光パスを構成する光信号に付与する光減衰量の時系列データまたは光パワーの時系列データに基づき、前記ノードまたは前記構成部品における故障原因を診断する、
ことを特徴とする請求項3または4に記載の光伝送システム。 - 各前記ノードは、複数の周波数スロットの光信号を通過させる光クロスコネクトであり、
前記ネットワークコントローラは、各光バスの終端にあたるノードを管理する前記判定手段から前記劣化モードに該当する光物理特性の時系列データを収集して各光パス間の相関係数行列を計算し、相関係数が閾値を超える光パスの組合せに共通するノードのうち最も上流のものを、故障または性能劣化にかかる被疑箇所として特定する、
ことを特徴とする請求項1に記載の光伝送システム。 - 前記信号品質の時系列データと相関のある光物理特性の時系列データは、波長分散補償量の時系列データ、偏波モード分散補償量の時系列データ、SOP(State Of Polarization)の時系列データ、信号対ノイズ比の時系列データ、偏波依存損失の時系列データ、クロストークの時系列データ、ファイバ非線形効果の時系列データ、符号間干渉の時系列データ、コンスタレーション歪みの時系列データ、光源周波数の時系列データ、スペクトル対称性の時系列データうち何れかを少なくとも含む、
ことを特徴とする請求項1ないし6のうち何れか1項に記載の光伝送システム。 - 光伝送路によって相互に接続された複数のノード、各前記ノードをそれぞれ管理する管理手段、前記管理手段を統括管理するネットワークコントローラを含む光伝送システムが実行する故障診断方法であって、
前記管理手段は、前記ノードにおける信号品質の劣化をそれぞれ検知し、前記信号品質の時系列データと相関のある光物理特性の時系列データを特定し、劣化モードをそれぞれ判定し、
前記ネットワークコントローラは、前記管理手段が前記信号品質の劣化を検知したノードおよび、前記劣化モード、複数の各前記ノードから構成されるネットワークトポロジ、各前記ノード間に設定される光パスの情報に基づき、故障または性能劣化が発生したノードまたは構成部品を特定する、
ことを特徴とする故障診断方法。
Priority Applications (1)
| Application Number | Priority Date | Filing Date | Title |
|---|---|---|---|
| US17/295,533 US11528080B2 (en) | 2018-11-27 | 2019-11-15 | Optical transmission system and failure diagnosis method for optical transmission system |
Applications Claiming Priority (2)
| Application Number | Priority Date | Filing Date | Title |
|---|---|---|---|
| JP2018221023A JP7176373B2 (ja) | 2018-11-27 | 2018-11-27 | 光伝送システムおよび光伝送システムの故障診断方法 |
| JP2018-221023 | 2018-11-27 |
Publications (1)
| Publication Number | Publication Date |
|---|---|
| WO2020110787A1 true WO2020110787A1 (ja) | 2020-06-04 |
Family
ID=70852991
Family Applications (1)
| Application Number | Title | Priority Date | Filing Date |
|---|---|---|---|
| PCT/JP2019/044972 Ceased WO2020110787A1 (ja) | 2018-11-27 | 2019-11-15 | 光伝送システムおよび光伝送システムの故障診断方法 |
Country Status (3)
| Country | Link |
|---|---|
| US (1) | US11528080B2 (ja) |
| JP (1) | JP7176373B2 (ja) |
| WO (1) | WO2020110787A1 (ja) |
Cited By (3)
| Publication number | Priority date | Publication date | Assignee | Title |
|---|---|---|---|---|
| JPWO2022009293A1 (ja) * | 2020-07-06 | 2022-01-13 | ||
| WO2025203181A1 (ja) * | 2024-03-25 | 2025-10-02 | 日本電気株式会社 | 異常検知装置、異常検知方法、プログラム |
| WO2026042237A1 (ja) * | 2024-08-22 | 2026-02-26 | Ntt株式会社 | 光伝送システムおよび故障箇所特定方法 |
Families Citing this family (9)
| Publication number | Priority date | Publication date | Assignee | Title |
|---|---|---|---|---|
| JP7010171B2 (ja) * | 2018-08-10 | 2022-01-26 | 日本電信電話株式会社 | 保守管理システムおよびデータ処理方法 |
| JP7548295B2 (ja) * | 2020-03-27 | 2024-09-10 | 日本電気株式会社 | 光通信システム、故障原因推定装置、故障解析装置及び光通信システムの故障解析方法 |
| US11742978B2 (en) | 2020-12-25 | 2023-08-29 | Fujitsu Limited | Optical network device and method for monitoring transmission line |
| US12355563B2 (en) * | 2022-01-24 | 2025-07-08 | Cisco Technology, Inc. | Correlating transceiver parameters for insight into transceiver health |
| WO2023139914A1 (ja) * | 2022-01-24 | 2023-07-27 | 住友電気工業株式会社 | 車載装置、管理装置、伝送路認証システム、伝送路認証方法および管理方法 |
| WO2023226477A1 (zh) * | 2022-05-26 | 2023-11-30 | 华为技术有限公司 | 一种光模块、电子设备、通信系统及相关处理方法 |
| WO2025165376A2 (en) * | 2023-02-10 | 2025-08-07 | The Regents Of The University Of California | Integrated microlens coupler for photonic integrated circuits |
| WO2025027662A1 (en) * | 2023-08-03 | 2025-02-06 | Jio Platforms Limited | System and method for determining a single point of failure (spof) in fiber networks |
| CN120454842B (zh) * | 2025-07-04 | 2025-09-09 | 国网甘肃省电力公司陇南供电公司 | 光路故障的智能诊断与快速恢复方法、系统、设备及介质 |
Citations (3)
| Publication number | Priority date | Publication date | Assignee | Title |
|---|---|---|---|---|
| EP2854306A1 (en) * | 2013-09-25 | 2015-04-01 | Alcatel Lucent | Optical receiver and method of operating an optical receiver |
| US20160204856A1 (en) * | 2015-01-08 | 2016-07-14 | Nec Laboratories America, Inc. | Survivable Hybrid Optical/Electrical Data Center Networks Using Loss of Light Detection |
| US20180220210A1 (en) * | 2017-02-02 | 2018-08-02 | Infinera Corporation | Multi-layer mechanisms to optimize optical transport network margin allocation |
Family Cites Families (4)
| Publication number | Priority date | Publication date | Assignee | Title |
|---|---|---|---|---|
| US7870440B2 (en) * | 2008-03-14 | 2011-01-11 | Oracle America, Inc. | Method and apparatus for detecting multiple anomalies in a cluster of components |
| US11741114B2 (en) * | 2017-12-19 | 2023-08-29 | ExxonMobil Technology and Engineering Company | Data analysis platform |
| US10621141B2 (en) * | 2018-01-31 | 2020-04-14 | Oracle International Corporation | Multivariate memory vectorization technique to facilitate intelligent caching in time-series databases |
| US10496084B2 (en) * | 2018-04-06 | 2019-12-03 | Oracle International Corporation | Dequantizing low-resolution IoT signals to produce high-accuracy prognostic indicators |
-
2018
- 2018-11-27 JP JP2018221023A patent/JP7176373B2/ja active Active
-
2019
- 2019-11-15 WO PCT/JP2019/044972 patent/WO2020110787A1/ja not_active Ceased
- 2019-11-15 US US17/295,533 patent/US11528080B2/en active Active
Patent Citations (3)
| Publication number | Priority date | Publication date | Assignee | Title |
|---|---|---|---|---|
| EP2854306A1 (en) * | 2013-09-25 | 2015-04-01 | Alcatel Lucent | Optical receiver and method of operating an optical receiver |
| US20160204856A1 (en) * | 2015-01-08 | 2016-07-14 | Nec Laboratories America, Inc. | Survivable Hybrid Optical/Electrical Data Center Networks Using Loss of Light Detection |
| US20180220210A1 (en) * | 2017-02-02 | 2018-08-02 | Infinera Corporation | Multi-layer mechanisms to optimize optical transport network margin allocation |
Non-Patent Citations (1)
| Title |
|---|
| DONG, ZHENHUA ET AL.: "Optical Performance Monitoring: A Review of Current and Future Technologies", JOURNAL OF LIGHTWAVE TECHNOLOGY, vol. 34, no. 2, 15 January 2016 (2016-01-15), pages 525 - 543, XP011598997, DOI: 10.1109/JLT.2015.2480798 * |
Cited By (5)
| Publication number | Priority date | Publication date | Assignee | Title |
|---|---|---|---|---|
| JPWO2022009293A1 (ja) * | 2020-07-06 | 2022-01-13 | ||
| WO2022009293A1 (ja) * | 2020-07-06 | 2022-01-13 | 日本電信電話株式会社 | 光ノード装置、光トランスポートネットワークシステム、光パストレース方法及びプログラム |
| JP7517421B2 (ja) | 2020-07-06 | 2024-07-17 | 日本電信電話株式会社 | 光ノード装置、光トランスポートネットワークシステム、光パストレース方法及びプログラム |
| WO2025203181A1 (ja) * | 2024-03-25 | 2025-10-02 | 日本電気株式会社 | 異常検知装置、異常検知方法、プログラム |
| WO2026042237A1 (ja) * | 2024-08-22 | 2026-02-26 | Ntt株式会社 | 光伝送システムおよび故障箇所特定方法 |
Also Published As
| Publication number | Publication date |
|---|---|
| JP7176373B2 (ja) | 2022-11-22 |
| US20220021449A1 (en) | 2022-01-20 |
| JP2020088628A (ja) | 2020-06-04 |
| US11528080B2 (en) | 2022-12-13 |
Similar Documents
| Publication | Publication Date | Title |
|---|---|---|
| JP7176373B2 (ja) | 光伝送システムおよび光伝送システムの故障診断方法 | |
| Wang et al. | A review of machine learning-based failure management in optical networks | |
| CN111971909B (zh) | 用于监测光通信系统的方法 | |
| US6952529B1 (en) | System and method for monitoring OSNR in an optical network | |
| Delezoide et al. | Marginless operation of optical networks | |
| US7151875B2 (en) | Method and apparatus for balancing the power of optical channels traversing an optical add drop multiplexer | |
| US9660755B2 (en) | Automated node level fibre audit | |
| US20040120706A1 (en) | Fault isolation in agile transparent networks | |
| JP2011091806A (ja) | プロテクションスイッチングのための方法及びシステム | |
| CN101309123A (zh) | 光分插复用装置 | |
| Delezoide et al. | Leveraging field data for the joint optimization of capacity and availability in low-margin optical networks | |
| US20020141009A1 (en) | Performance monitoring for multi-port optical devices and systems | |
| US7327954B2 (en) | Optical signaling to share active channel information | |
| EP1685663B1 (en) | Flash optical performance monitor | |
| US9008509B2 (en) | Measurement of optical performance for passive WDM systems | |
| JP7548298B2 (ja) | 監視装置、監視方法及びプログラム | |
| Sartzetakis et al. | On reducing optical monitoring uncertainties and localizing soft failures | |
| WO2023162187A1 (ja) | 光伝送システムおよび故障箇所特定方法 | |
| US6580498B1 (en) | Optical return loss detector for optical transmission systems | |
| Zhuge et al. | DSP-aided telemetry in monitoring linear and nonlinear optical transmission impairments | |
| CN120185723B (zh) | 基于互增强环形器的分布式光纤光调制系统 | |
| Díaz-Montiel et al. | Real-Time Control Plane Operations for gOSNR QoT Estimation through OSNR Monitoring | |
| JP2009296336A (ja) | 光受信装置、遠隔監視装置および遠隔監視プログラム | |
| EP2237453B1 (en) | Method and equipment for managing optical channel monitoring in an optical network | |
| US12126376B2 (en) | Alien wave interoperability system |
Legal Events
| Date | Code | Title | Description |
|---|---|---|---|
| 121 | Ep: the epo has been informed by wipo that ep was designated in this application |
Ref document number: 19888336 Country of ref document: EP Kind code of ref document: A1 |
|
| NENP | Non-entry into the national phase |
Ref country code: DE |
|
| 122 | Ep: pct application non-entry in european phase |
Ref document number: 19888336 Country of ref document: EP Kind code of ref document: A1 |