EP1685663B1 - Flash optical performance monitor - Google Patents
Flash optical performance monitor Download PDFInfo
- Publication number
- EP1685663B1 EP1685663B1 EP03778204.2A EP03778204A EP1685663B1 EP 1685663 B1 EP1685663 B1 EP 1685663B1 EP 03778204 A EP03778204 A EP 03778204A EP 1685663 B1 EP1685663 B1 EP 1685663B1
- Authority
- EP
- European Patent Office
- Prior art keywords
- data
- quality
- optical
- optical signal
- signal
- Prior art date
- Legal status (The legal status is an assumption and is not a legal conclusion. Google has not performed a legal analysis and makes no representation as to the accuracy of the status listed.)
- Expired - Lifetime
Links
- 230000003287 optical effect Effects 0.000 title claims abstract description 84
- 238000000034 method Methods 0.000 claims abstract description 47
- 238000001228 spectrum Methods 0.000 claims abstract description 26
- 238000012544 monitoring process Methods 0.000 claims abstract description 24
- 230000005540 biological transmission Effects 0.000 claims abstract description 21
- 230000003595 spectral effect Effects 0.000 claims abstract description 15
- 238000012545 processing Methods 0.000 claims abstract description 13
- 238000000354 decomposition reaction Methods 0.000 claims abstract description 6
- 238000004458 analytical method Methods 0.000 claims abstract description 4
- 230000001131 transforming effect Effects 0.000 claims abstract 2
- 238000013528 artificial neural network Methods 0.000 claims description 11
- 230000008569 process Effects 0.000 claims description 6
- 238000010183 spectrum analysis Methods 0.000 claims description 3
- 238000010586 diagram Methods 0.000 description 11
- 238000005259 measurement Methods 0.000 description 10
- 238000012360 testing method Methods 0.000 description 10
- 238000013459 approach Methods 0.000 description 7
- 239000013598 vector Substances 0.000 description 7
- 238000004891 communication Methods 0.000 description 4
- 238000001514 detection method Methods 0.000 description 4
- 238000000926 separation method Methods 0.000 description 4
- 238000013144 data compression Methods 0.000 description 3
- 230000001965 increasing effect Effects 0.000 description 3
- 230000010354 integration Effects 0.000 description 3
- 230000008901 benefit Effects 0.000 description 2
- 238000007906 compression Methods 0.000 description 2
- 230000006835 compression Effects 0.000 description 2
- 230000000694 effects Effects 0.000 description 2
- 239000000835 fiber Substances 0.000 description 2
- 238000007726 management method Methods 0.000 description 2
- 239000013307 optical fiber Substances 0.000 description 2
- 238000010079 rubber tapping Methods 0.000 description 2
- 238000012549 training Methods 0.000 description 2
- 108010076504 Protein Sorting Signals Proteins 0.000 description 1
- 230000032683 aging Effects 0.000 description 1
- 230000003466 anti-cipated effect Effects 0.000 description 1
- 230000000295 complement effect Effects 0.000 description 1
- 230000003247 decreasing effect Effects 0.000 description 1
- 230000001419 dependent effect Effects 0.000 description 1
- 238000013461 design Methods 0.000 description 1
- 239000006185 dispersion Substances 0.000 description 1
- 238000005516 engineering process Methods 0.000 description 1
- 230000002708 enhancing effect Effects 0.000 description 1
- 238000011065 in-situ storage Methods 0.000 description 1
- 230000004807 localization Effects 0.000 description 1
- 238000004519 manufacturing process Methods 0.000 description 1
- 238000012986 modification Methods 0.000 description 1
- 230000004048 modification Effects 0.000 description 1
- 238000010606 normalization Methods 0.000 description 1
- NJPPVKZQTLUDBO-UHFFFAOYSA-N novaluron Chemical compound C1=C(Cl)C(OC(F)(F)C(OC(F)(F)F)F)=CC=C1NC(=O)NC(=O)C1=C(F)C=CC=C1F NJPPVKZQTLUDBO-UHFFFAOYSA-N 0.000 description 1
- 230000010287 polarization Effects 0.000 description 1
- 238000000513 principal component analysis Methods 0.000 description 1
- 238000001303 quality assessment method Methods 0.000 description 1
- 230000009467 reduction Effects 0.000 description 1
- 230000001172 regenerating effect Effects 0.000 description 1
- 230000004044 response Effects 0.000 description 1
- 238000012546 transfer Methods 0.000 description 1
- 230000009466 transformation Effects 0.000 description 1
- 230000000007 visual effect Effects 0.000 description 1
Images


Classifications
-
- H—ELECTRICITY
- H04—ELECTRIC COMMUNICATION TECHNIQUE
- H04B—TRANSMISSION
- H04B10/00—Transmission systems employing electromagnetic waves other than radio-waves, e.g. infrared, visible or ultraviolet light, or employing corpuscular radiation, e.g. quantum communication
- H04B10/07—Arrangements for monitoring or testing transmission systems; Arrangements for fault measurement of transmission systems
- H04B10/075—Arrangements for monitoring or testing transmission systems; Arrangements for fault measurement of transmission systems using an in-service signal
- H04B10/079—Arrangements for monitoring or testing transmission systems; Arrangements for fault measurement of transmission systems using an in-service signal using measurements of the data signal
- H04B10/0795—Performance monitoring; Measurement of transmission parameters
- H04B10/07953—Monitoring or measuring OSNR, BER or Q
-
- H—ELECTRICITY
- H04—ELECTRIC COMMUNICATION TECHNIQUE
- H04B—TRANSMISSION
- H04B10/00—Transmission systems employing electromagnetic waves other than radio-waves, e.g. infrared, visible or ultraviolet light, or employing corpuscular radiation, e.g. quantum communication
- H04B10/07—Arrangements for monitoring or testing transmission systems; Arrangements for fault measurement of transmission systems
- H04B10/075—Arrangements for monitoring or testing transmission systems; Arrangements for fault measurement of transmission systems using an in-service signal
- H04B10/079—Arrangements for monitoring or testing transmission systems; Arrangements for fault measurement of transmission systems using an in-service signal using measurements of the data signal
- H04B10/0795—Performance monitoring; Measurement of transmission parameters
- H04B10/07957—Monitoring or measuring wavelength
Definitions
- the present invention relates to the field of optical performance monitoring as currently applied in dense wavelength-division multiplexing.
- An OPM consists of a spectrometric transducer and a computing means.
- the spectrometric transducer converts an optical signal into a digital signal representative of the spectrum of the input optical signal.
- the computing means processes that digital signal in such a way as to provide the final result of measurement, i.e. an estimate of the parameters of the optical signal being monitored in a DWDM system.
- a fractional portion of optical power typically 2%, is tapped from the mainstream optical signal running through the optical fibre, using a tap coupler. The purpose of tapping is monitoring the optical signal while keeping the properties of the main traffic unchanged. Since the tapped signal will not be added back to the mainstream signal, there is little effect on the properties of the transmitted data, and the OPM thus provides an almost non-invasive measurement.
- the weak signal tapped from the mainstream optical signal is then directed to an optical unit, by which the channelized wavelength components are separated.
- the optical unit therefore performs a spectral decomposition of the optical signal; the results of that decomposition are detected by a detector.
- the detector converts optical signals into electrical signals.
- the electrical signals are transmitted to the electronics circuitry for processing and digital output.
- the principle of operation of a spectrometric transducer may refer to various physical phenomena that make possible separation of spectral components of the input optical signal.
- the following devices are examples of technical means used for this purpose:
- a conventional optical network performance monitor typically contains a detection element that is responsive to the combination of all signal channels carried by a main signal stream, and that is operative to generate data containing information of a collective power level provided by all channels. Such data generated in the electrical domain are not sufficient to provide detailed information of channel performance. For instance, if a power level of one of a plurality of channels of the mainstream signal is decreased while a power level of another channel is increased, a total power level measured by such device typically remains constant, thereby providing an inaccurate indication of a monitored network performance.
- performance monitoring is preferably carried out in the optical layer.
- An OPM constitutes an integrated spectrometric device at a module level operating in the optical layer, the device which is capable of monitoring the performance of all individual channels, and of providing rapid channel identification, i.e. the estimates of power (P), central wavelength ( ⁇ ), and optical signal-to-noise ratio (OSNR) for each channel.
- P power
- ⁇ central wavelength
- OSNR optical signal-to-noise ratio
- OPMs may be classified into three groups: Type-I OPMs, Type-II OPMs, and Type-III OPMs.
- a Type-I OPM is a monitor capable of providing real-time measurements of power for each DWDM channel.
- a Type-II OPM is a monitor capable of providing real-time measurements of power, central wavelength, and optical signal-to-noise ratio for each channel.
- a Type-III OPM is able, moreover, to predict indicators of the service quality provided by a DWDM system such as the bit-error rate (BER) and Q-factor (Q).
- BER bit-error rate
- Q Q-factor
- the Type-I OPM commonly uses demultiplexing-type spectrometric transducers. Since a demultiplexing-type component, e.g. an AWG, gives a set of fixed discrete channels with a pre-defined frequency interval, i.e. channel spacing, such OPM is only able to provide power measurements at the wavelength positions corresponding to the DWDM channels. It is obvious that the measurements will be biased when there is thermal drift of some wavelength-related properties of the optical part of the OPM. A type-II OPM is able to provide more network information than a type-I OPM since it not only measures power, but also wavelength variation and OSNR.
- a demultiplexing-type component e.g. an AWG
- BER or Q is influenced by the receiver noise.
- the tunable filter introduces signal distortions contributing to an increase in BER (decrease in Q) or a reduction in reliability.
- BER is determined by counting bits, a process which takes place in the time domain. Assuming a regular BER value in the order of 10 -12 , and assuming a transmission bit rate of 2.5 Gb/s, it is to be expected that-on average- every 400 s of data flow one faulty bit is to be detected. To determine BER estimate with an acceptable accuracy, a testing time of several hours is necessary.
- WO 01/052451 shows a system in which a measure of in-band cross-talk is made using DSP and a spectrum analyser to obtain an estimate of BER.
- WO 00/71980 shows a method of calibrating a spectrometer using a reference signal to obtain calibratum data
- an optical performance monitor as defined by claim 9.
- Figure 1 is a schematic diagram of an embodiment of an OPM.
- Figure 2 is a plot of the representation of two signals provided by an auxiliary transceiver included in the OPM of Figure 1 .
- Figure 3 is a schematic diagram of the auxiliary transducer included in the OPM of Figure 1 .
- Figure 4 is a flow diagram illustrating the operation of the Flash of Figure 1 .
- Figure 5 is a schematic diagram illustrating the methodology of quasi-dynamic measurand reconstruction.
- Figure 6 is a schematic diagram illustrating the methodology of quasi-dynamic system calibration.
- Figure 7 is a flow diagram illustrating the functionality of a neural network to be used for the determination of BER and/or Q.
- Figure 8 shows a schematic diagram of another embodiment of the FLASH of Figure 1 .
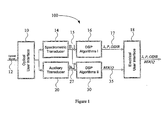
- the Flash OPM 100 includes an optical user interface 10 that receives an optical input signal 12, and directs the received signal 12 to a spectrometric transducer 14.
- the spectrometric transducer 14 separates the input signal 12 into its spectral components and converts those components into corresponding electrical signals.
- the resultant data set ⁇ ⁇ n ⁇ 15 is representative of the spectrum of the optical signal 12.
- the spectrometric transducer 14 may utilise an optical element, such as a grating or a variable linear filter, to provide a spatial separation of the components of the signal 12 and direct them to a sensor array where they are converted into corresponding electrical signals.
- Such transducers are well known in the optical art and need not be described in further detail.
- the data set ⁇ ⁇ n ⁇ 15 is directed to a processing function 16 that implements one or more of a first set of DSP algorithms (DSP Algorithms I) for signal reconstruction and enhancement.
- the processor 16 may be a general purpose computer implementing algorithms contained as software instructions resident in a memory device such as a data carrier. Alternatively, the processor may be a dedicated device configured to process the data set in accordance with the selected algorithm.
- the DSP Algorithms I, executed by the processor 16, will typically be chosen to perform reconstruction of spectrum parameters, using a non-linear and non-stationary approach, and provides estimates 17 for P, ⁇ , and OSNR.
- the processor 16 may also implement procedures that compensate for variations in temperature, wavelength drifts, aging of the optical components, and the like to enhance the information provided by the processor.
- the output from the processor 16 provides estimates 17 of the power P, wavelength ⁇ and signal to noise ratio OSNR which are sent to an electrical user interface 18. These outputs based on the spectral analysis quality of the data signal by using one or more of the parameters. For example the channel power may be used as an indicator of quality, or the central wavelength of the channel or by the OSNR.
- BER or Q depends on all the elements of a telecommunication link.
- the spectrum of the transmitted signal contains more information on BER or Q than the estimates 17 of P, ⁇ , OSNR that are possibly determined on the basis of the data ⁇ ⁇ n ⁇ 15 representative of said spectrum, but - as a rule - it does not contain sufficient information on chromatic dispersion and polarization-related effects such as PMD.
- PMD chromatic dispersion and polarization-related effects
- the received signal 12 is also directed to an auxiliary transducer 20 in parallel to the spectrometric transducer 14.
- the auxiliary transducer 20 processes the received signal 12 to obtain a data set ⁇ p ⁇ k,m ⁇ 27 that represents time-domain parameters ⁇ p k,m ⁇ of the signal 12.
- t ⁇ - ⁇ , + ⁇ and k 1 , ... , K , sup s k t
- Figures 2a and 2b show how the signal distortion is reflected in the parameters ⁇ p ⁇ k,m ⁇ defined in the above described way. More specifically, in Figure 2a there are shown two demodulated signals 201 and 202, signal 201 being an undistorted square pulse signal while signal 202 is the same signal after distortion. Figure 2b shows the dependence of the time-domain parameters ⁇ p ⁇ k,m ⁇ on the threshold value s m th for the undistorted and distorted signals 201 and 202, respectively.
- the time-domain parameter ⁇ p ⁇ k,m ⁇ of distorted signal 202 may be viewed, as shown on Figure 2a , as the area 204 under curve (signal) 202 which is above line 203 (threshold).
- the distorted signal 202 results in time-domain parameters ⁇ p ⁇ k,m ⁇ that vary in a non-linear fashion as a consequence of the presence of distortion, which may be seen in Figure 2b by the difference between the time-domain parameters for the undistorted signal 201 and the distorted signal 202 for a given threshold value s m th .
- the differences 211, 214 and 217 between the time-domain parameters 212, 215 and 218 of the undistorted signal 201 and the time-domain parameters 213, 216 and 219 of the distorted signal 202, respectively, are not equal.
- the non linearities may be used to provide an indication of the nature and degree of distortion to which the signal has been subjected.
- signal 202 is processed so as to identify non-linearities relative to an ideal signal 201, and from these non-linearities provide an assessment of the degree or type of the distortion.
- the time-domain parameters ⁇ p ⁇ k,m ⁇ form a function that recognizes the shape of the distorted signal 202 and is indicative of the distortion, which may not be as readily apparent from the spectrum data set ⁇ ⁇ n ⁇ .
- the estimates ⁇ p ⁇ k,m ⁇ 27 may be obtained by an auxiliary transducer 20, shown in Figure 3 , composed of a tunable filter 22 followed by a high-speed photodiode 24.
- the output of the diode 24 is processed by an integration circuit 26 to provide the output ⁇ p ⁇ k,m ⁇ 27.
- the tunable filter 22 is used to select a channel so that the associated photodiode 24 reproduces s k ( t ) by demodulation, and the integration circuit performs the operation such as that defined by Equation 1 for each of the selected thresholds.
- the output 27 and 15 of the auxiliary transducer 20 and the spectrometric transducer 14, respectively, are provided to a processor 30 that implements selected ones of a second set of DSP algorithms (DSP Algorithms II) to extract further information from the received signal 12.
- the processor 30 may be a specific hardware implementation structured to perform a specific selected algorithm or may be a general-purpose computing device that operates upon the data sets 15 and 27 in accordance with programmed instructions contained on a memory device.
- the processor 30 executes one or more of the second set of selected DSP algorithms (DSP Algorithms II) to analyse the data ⁇ ⁇ n ⁇ 15 and ⁇ p ⁇ k,m ⁇ 27, and provide an estimate 35 for BER or Q.
- the estimate 35 is next transferred to the electrical user interface 18.
- the electrical user interface 18 transfers the estimates 17 and 35 of P, ⁇ , OSNR, and BER or Q to the user that is assessing the performance of a particular channel, and to monitor the quality of a signal transmitted on said channel
- the interface 18 may function to provide readouts of the parameters being monitored but preferably operates to provide a visual indication of the departure of the parameters from predetermined acceptable levels.
- the interface may monitor over a period of time the quality factor Q of the respective channels for a period of time and provide a signal indicating if the quality on one or more channels has varied from an acceptable value to an unacceptable value.
- each channel may be monitored for BER and an indication provided if the BER has varied from an acceptable to an unacceptable value.
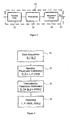
- a first step 41 the data ⁇ ⁇ n
- n 1, ..., N ⁇ representative of the spectrum of a total DWDM signal are acquired, as well as the estimates ⁇ p ⁇ k,m
- the first set of DSP algorithms (DSP Algorithms I), which will be described further below, is used to determine the estimates 17 of the parameters P , ⁇ , and OSNR for each channel - on the basis of the data ⁇ ⁇ n ⁇ 15, step 42.
- step 43 those data ⁇ ⁇ n ⁇ 15 are used again, this time together with the estimates ⁇ p ⁇ k,m ⁇ 27 of the time-domain parameters, to determine the estimate 35 of BER or Q.
- the second set of algorithms (DSP Algorithms II), which will be described further below, is used.
- a last step 44 there are reported the estimates 17 and 35 of P , ⁇ , OSNR and BER or Q, useful for a network monitoring system.
- the method provides a number of advantages compared to traditional out-of-service BER-test techniques.
- the method is an optical-layer testing method, which is also an in-service method.
- a BER test of all channels is performed in parallel and thus simultaneously.
- the method provides a low-cost solution as well as a fast solution to the problem of in-service monitoring of DWDM networks.
- Test times, according to the method described in Figure 4 remain substantially constant as channel counts increase. Also, the described method does not depend on the transmission protocol, on the data format or on the generation of complex test signals.
- the first subset of algorithms (DSP Algorithms I), used for determination of the estimates 17 of the parameters P , ⁇ , and OSNR, contains the algorithms for spectrum reconstruction and estimation of spectrum parameters that are well known in the art, for example those described in detail in US Pat. No. 5,991,023 to Morawski et al., issued November 23, 1999 , and in US Pat. No. 6,002,479 to Barwicz et al., issued December 14, 1999 .
- the estimates 17 of the channel parameters P, ⁇ , OSNR may be calculated directly from the estimates of a 1 , a 2 , and l .
- the second set of DSP algorithms (DSP Algorithms II), used for extracting useful BER and Q information, may be constructed according to the following principles.
- a spectrometric transducer 14 converts input optical signal into a set of data ⁇ ⁇ n ⁇ 15 representative of the spectrum of this signal.
- the spectrometric transducer 14 is, for example, part of a Type-II FLASH device, but it is not restricted to such devices and applications.
- N represents a number of photodiodes in the detector array.
- ⁇ ⁇ ( ⁇ max - ⁇ min )/( N - 1). It is assumed that the data ⁇ ⁇ n ⁇ 15 represent a spectrum of K channels combined in a DWDM system under consideration.
- the length of this subsequence is variable, and amounts for example to 3, 4, 5, 6 or more elements.
- considerations are limited to one channel only, and the symbol ⁇ ⁇ n ⁇ is used for denoting this subsequence.
- a person of skill in the art is able to extend the concept with ease to any other number of channels.
- the problem of determining BER or Q may be solved in a broad context of algorithmic options, which are derived from ideas of quasi-dynamic measurand reconstruction that is a well-established and well-recognised methodology in digital signal processing, as for example illustrated in the paper " The Role of Digital Signal Processing in Measurement Science”, published in “Measurement Science - A Discussion” (Ohmsha Press Pub., Tokyo 2000, pp. 77-102 ). High redundancy of measurement information in raw measurement data is the main distinctive feature of any problem of quasi-dynamic measurand reconstruction. Consequently, implicit or explicit compression of data is present in any procedure for solving such a problem.
- the value of a scalar measurand x , BER or Q, is estimated on the basis of a subsequence of data ⁇ ⁇ n ⁇ 15 representative of the channel spectrum and the parameters ⁇ p ⁇ k,m ⁇ 27 to which the measurand is approximately related..
- a large family of DSP methods for estimation of BER or Q may be derived from the general methodology for solving problems of quasi-dynamic measurand reconstruction.
- This methodology consists of two steps: compression of the data ⁇ ⁇ n ⁇ 15 and ⁇ p ⁇ k,m ⁇ 27, i.e. transformation of the data ⁇ ⁇ n ⁇ 15 and ⁇ p ⁇ k,m ⁇ 27 into an estimate p ⁇ 32 of a vector of informative parameters p, ⁇ ⁇ n ⁇ , ⁇ p ⁇ k m ⁇ ⁇ p ⁇ , and subsequent estimation of x on the basis of p ⁇ , p ⁇ ⁇ x ⁇ .
- This methodology is illustrated in the schematic diagram shown in Figure 5 .
- Inputs containing the subsequence ⁇ ⁇ n ⁇ 15 and ⁇ p ⁇ k,m ⁇ 27 are provided to a data compressor 31.
- the data compressor 31 compresses the subsequence ⁇ ⁇ n ⁇ 15 and ⁇ p ⁇ k,m ⁇ 27 to obtain a set containing an estimate p 32, which is provided to a BER or Q estimator 33.
- the BER or Q estimator 33 responds with an output set 35 containing an estimate35 x ⁇ of x, i.e. of BER or Q.
- a complexity of the method illustrated in Figure 5 depends on a number of informative parameters, i.e. the dimension of the vector p 32. The greater the number of informative parameters, the more time is required both for calibration and for BER or Q estimation.
- v 1 , ... , N cal .
- a schematic diagram for a method of calibration is outlined. An input containing the subsequence y ⁇ n , v cal 61 and p ⁇ m , v cal 62 is provided to a data compressor 63.
- the set 64 containing the parameters p ⁇ v cal is provided to a BER or Q estimator 65.
- the BER or Q estimator 65 responds with an output set 66 containing a datum x ⁇ n , v cal 66.
- a data adjustor 67 the data x ⁇ n , v cal 66 and x ⁇ n , v cal are compared. The result of this comparison is provided as feedback to the data compressor 62 and the BER or Q estimator 65, where in turn this information is utilized in constructing an approximation of the relationship p ⁇ x using a set of input-output pairs: p ⁇ v cal , x ⁇ v cal
- v 1 , ... , N cal .
- a large variety of algorithms is possibly generated by combining various techniques of data compression with various types of approximators.
- the following techniques of data compression are optionally used: principal component analysis, computation of inner products of the data ⁇ ⁇ n ⁇ 15 and ⁇ p ⁇ k,m ⁇ 27 and linearly independent sequences ⁇ e j,n
- j 1,..., J ⁇ , approximation of the spectrum y ( ⁇ ) on the basis of ⁇ ⁇ n ⁇ 15 and ⁇ p ⁇ k,m ⁇ 27 using a parameterised function ⁇ ( ⁇ n ; a ) with a being a vector of parameters, and computation of the moments of the spectrum y ( ⁇ ) on the basis of ⁇ ⁇ n ⁇ 15.
- an application-specific vector of informative parameters could contain estimates 17 of P , ⁇ , and OSNR, the estimates determined on the basis of ⁇ ⁇ n ⁇ 15 and ⁇ p ⁇ k,m ⁇ 27.
- the most evident candidate for the measurand estimator i.e. the BER or Q estimator, is a neural network being a universal approximator.
- B-splines are to be considered as measurand estimators.
- a person of skill in art will be able to suggest further methods of data compression and final measurand estimation.
- a Radial Basis Functions (RBF) neural network 34 is designed as illustrated in the schematic diagram shown in Figure 7 .
- This particular network performs both the function of data compressor and of BER/Q estimator.
- the neural network 34 receives as inputs data sets ⁇ ⁇ n ⁇ 15 and ⁇ p ⁇ k,m ⁇ 27.
- the neural network 34 is trained to respond with an estimate x ⁇ 35 of x (BER or Q) on the basis of ⁇ ⁇ n ⁇ and ⁇ p ⁇ k,m ⁇ .
- the data set ⁇ ⁇ n ⁇ 15 stem from a low-resolution spectrometric transducer and the parameters ⁇ p ⁇ k,m ⁇ 27 from an auxiliary transducer.
- the sets of data used for training preferably represent a telecommunication signal distorted in various ways by its propagation through optical elements such as fibers, amplifiers, and filters.
- any other universal approximator may be used, e.g. another type of neural network or a multi-dimensional spline function.
- a cascade of two neural networks may be designed: the first to perform the function of data compressor, the second - of BER/Q estimator.
- the Flash OPM 100a includes an optical user interface 10a, that provides received signal 12a to a spectrometric transducer 14a.
- a processor 16a implements a first set of DSP algorithms (DSP Algorithms I).
- the output of the processor 16a is applied to the electrical user interface 18a and to a further processor 50 that implements a further set of DSP algorithms (DSP Algorithms III).
- the received signal 12a is also fed to an auxiliary transducer 20a and to the processor 30a for implementing the second set of DSP algorithms (DSP Algorithms II) as described above to obtain estimate 35a of BER or Q.
- the processor 50 utilises the DSP algorithms (DSP Algorithms II) to process the estimates 17a of P, ⁇ , and OSNR according to information suitable for control of DGE.
- DSP Algorithms II DSP Algorithms II
- a person of skill in the art easily envisions further applications of DSP-type processing units. These applications are feasible, since the spectrum retrieved by the spectrometric transducer, such as 14,14a, and processed by the processors 16,16a, inherently contain relevant and significant information characterizing the input optical signal.
- optical performance monitors such as 100 and 100a takes place within a time range of 50-200 milliseconds. This allows for in situ monitoring of an optical signal transmitted on a given channel, and for immediate undertaking of measures to reroute an optical signal to an alternative channel, once a too high value of BER or too low value of Q is detected. Assuming a response time of the monitor of 50 milliseconds, and a transmission bit rate of 2.5 Gb/s, a data buffer of 1.6 MB is sufficient to ensure that no data are lost during the detection of a fault-signalling BER or Q value and rerouting of an optical signal. By shifting the determination of BER or Q values from the electrical domain into the optical domain, a continuous, real-time quality assessment of an optical channel is possible, and it is further possible to route data transmission without a significant loss of information.
Landscapes
- Physics & Mathematics (AREA)
- Electromagnetism (AREA)
- Engineering & Computer Science (AREA)
- Computer Networks & Wireless Communication (AREA)
- Signal Processing (AREA)
- Optical Communication System (AREA)
Abstract
Description
- The present invention relates to the field of optical performance monitoring as currently applied in dense wavelength-division multiplexing.
- The recent expansion of telecommunications and computer communications, especially in the area of the Internet, has created a dramatic increase in the volume of worldwide data traffic that has placed an increasing demand for communication networks providing increased bandwidth. To meet this demand, fiber-optic networks and dense wavelength-division multiplexing (DWDM) communication systems have been developed to provide high-capacity transmission of multi-carrier signals over a single optical fiber. In accordance with the DWDM technology, a plurality of superimposed concurrent optical signals is transmitted on a single fiber, each signal having a different central wavelength. In DWDM optical networks, optical transmitters and optical receivers are tuned to transmit and receive on a specific wavelength.
- With the widespread deployment of DWDM optical networks, knowing precisely what is happening at the optical layer of the network is quickly becoming a real-time issue for network management. Stable and protected DWDM links cannot be realized without real-time optical monitoring at each channel. For example, as the number of channels deployed in a DWDM optical network increases, say from 40 to 80 or 160, wavelength drifts and power variations are more likely to cause data errors or transmission failures. It is therefore becoming important for network management to dynamically monitor the performance of the communication channels in order to supply the corresponding decision-support systems with information necessary for fault detection and identification, as well as for undertaking efficient restoration actions. To achieve this goal, a new type of fiber-optic products has been developed, the so-called optical performance monitors (OPM).
- An OPM consists of a spectrometric transducer and a computing means. The spectrometric transducer converts an optical signal into a digital signal representative of the spectrum of the input optical signal. The computing means processes that digital signal in such a way as to provide the final result of measurement, i.e. an estimate of the parameters of the optical signal being monitored in a DWDM system. A fractional portion of optical power, typically 2%, is tapped from the mainstream optical signal running through the optical fibre, using a tap coupler. The purpose of tapping is monitoring the optical signal while keeping the properties of the main traffic unchanged. Since the tapped signal will not be added back to the mainstream signal, there is little effect on the properties of the transmitted data, and the OPM thus provides an almost non-invasive measurement. The weak signal tapped from the mainstream optical signal is then directed to an optical unit, by which the channelized wavelength components are separated. The optical unit therefore performs a spectral decomposition of the optical signal; the results of that decomposition are detected by a detector. The detector converts optical signals into electrical signals. The electrical signals are transmitted to the electronics circuitry for processing and digital output.
- The principle of operation of a spectrometric transducer may refer to various physical phenomena that make possible separation of spectral components of the input optical signal. The following devices are examples of technical means used for this purpose:
- a grating or a linear variable filter that enables separation of spectral components in space;
- a tunable filter that enables separation of spectral components in time;
- an optical heterodyne that enables shifting the spectrum in a wavelength range where its analysis is easier.
- A conventional optical network performance monitor typically contains a detection element that is responsive to the combination of all signal channels carried by a main signal stream, and that is operative to generate data containing information of a collective power level provided by all channels. Such data generated in the electrical domain are not sufficient to provide detailed information of channel performance. For instance, if a power level of one of a plurality of channels of the mainstream signal is decreased while a power level of another channel is increased, a total power level measured by such device typically remains constant, thereby providing an inaccurate indication of a monitored network performance. Thus, in order to monitor a condition of an individual channel in a DWDM network, performance monitoring is preferably carried out in the optical layer. An OPM constitutes an integrated spectrometric device at a module level operating in the optical layer, the device which is capable of monitoring the performance of all individual channels, and of providing rapid channel identification, i.e. the estimates of power (P), central wavelength (λ), and optical signal-to-noise ratio (OSNR) for each channel. In order to respond to higher channel counts and transmission speed, the efforts of improving the performance of OPM have been often focused on enhancing the performance of the optical part of the spectrometric transducer which in turn resulted in a high design complexity and high manufacturing risks.
- Following an RHK report ("Vendors Must Adapt Products, Strategies to Stake a Claim in Crowded OPM Market", Insight, January 2002), OPMs may be classified into three groups: Type-I OPMs, Type-II OPMs, and Type-III OPMs. A Type-I OPM is a monitor capable of providing real-time measurements of power for each DWDM channel. A Type-II OPM is a monitor capable of providing real-time measurements of power, central wavelength, and optical signal-to-noise ratio for each channel. A Type-III OPM is able, moreover, to predict indicators of the service quality provided by a DWDM system such as the bit-error rate (BER) and Q-factor (Q). Currently, those indicators can be correctly measured only with out-of-service test equipment, using a known test sequence in place of the real signal. The determination of BER and Q therefore takes place in the electrical domain, after a signal received by the DWDM receiver is passed on to the electronic circuit. Obviously, this is an expensive, time-consuming and cumbersome method.
- The Type-I OPM commonly uses demultiplexing-type spectrometric transducers. Since a demultiplexing-type component, e.g. an AWG, gives a set of fixed discrete channels with a pre-defined frequency interval, i.e. channel spacing, such OPM is only able to provide power measurements at the wavelength positions corresponding to the DWDM channels. It is obvious that the measurements will be biased when there is thermal drift of some wavelength-related properties of the optical part of the OPM. A type-II OPM is able to provide more network information than a type-I OPM since it not only measures power, but also wavelength variation and OSNR.
- It is not only P, λ, and OSNR of each channel that is of interest of in-service monitoring of a DWDM system, but also the bit error rate, BER, and Q, an indicator of overall quality of the signal. The conventional approach in determining BER makes use of out-of-service test equipment, and is time consuming and expensive. An obvious approach to in-service BER or Q reporting is an electrical-domain approach. It consists of tapping off a part of an optical signal, demultiplexing it through a tunable filter, detecting and then electrically regenerating it through a DWDM-type receiver. However, this approach presents various drawbacks. It is an expensive and time-consuming method since it operates in a serial manner - channel by channel - using serial channel scanning and BER or Q processing. Further, BER or Q is influenced by the receiver noise. Also, the tunable filter introduces signal distortions contributing to an increase in BER (decrease in Q) or a reduction in reliability.
- Typically, in conventional applications, BER is determined by counting bits, a process which takes place in the time domain. Assuming a regular BER value in the order of 10-12, and assuming a transmission bit rate of 2.5 Gb/s, it is to be expected that-on average- every 400 s of data flow one faulty bit is to be detected. To determine BER estimate with an acceptable accuracy, a testing time of several hours is necessary.
-
WO 01/052451 -
WO 00/71980 - It would be highly advantageous to have at one's disposal alternative, and simpler monitoring methods for faster fault detection and localization. Optical-domain methods, even if less accurate than electrical ones, can provide a fast, a simple, and an economical approach to reach this goal.
- It would be of further advantage to have at hand a system that allows for real-time estimation of OSNR and BER or Q from the data representative of a real-world signal without the need for specific test signal sequences.
- It is an object of this invention to provide a transducer and a method for processing signals in which the above-mentioned disadvantages are obviated or mitigated.
- In accordance with an aspect of the instant invention, there is provided a method for monitoring a quality of data transmission as defined by
claim 1. Optional features are defined in the dependent claims. - In accordance with another aspect of the instant invention, there is provided an optical performance monitor as defined by claim 9.
- Embodiments of the present invention will now be described by way of example only with reference to the accompanying drawings, in which:
-
Figure 1 is a schematic diagram of an embodiment of an OPM. -
Figure 2 is a plot of the representation of two signals provided by an auxiliary transceiver included in the OPM ofFigure 1 . -
Figure 3 is a schematic diagram of the auxiliary transducer included in the OPM ofFigure 1 . -
Figure 4 is a flow diagram illustrating the operation of the Flash ofFigure 1 . -
Figure 5 is a schematic diagram illustrating the methodology of quasi-dynamic measurand reconstruction. -
Figure 6 is a schematic diagram illustrating the methodology of quasi-dynamic system calibration. -
Figure 7 is a flow diagram illustrating the functionality of a neural network to be used for the determination of BER and/or Q. -
Figure 8 shows a schematic diagram of another embodiment of the FLASH ofFigure 1 . - The instant invention will now be described with reference to specific embodiments thereof. Of course, the invention is not restricted to a specific hardware device, but is to be utilized in connection with various hardware solutions. Various modifications to the disclosed embodiments will be readily apparent to those skilled in the art, and the general principles defined herein may be applied to other embodiments and applications without departing from the spirit and the scope of the invention. Thus, the instant invention is not intended to be limited to the embodiments disclosed, but is to be accorded the widest scope consistent with the principles and features disclosed herein.
- Referring now to
Figure 1 , a schematic representation of an embodiment of a Flash OPM is shown. TheFlash OPM 100 includes anoptical user interface 10 that receives anoptical input signal 12, and directs the receivedsignal 12 to aspectrometric transducer 14. Thespectrometric transducer 14 separates theinput signal 12 into its spectral components and converts those components into corresponding electrical signals. The resultant data set {ỹn } 15 is representative of the spectrum of theoptical signal 12. Thespectrometric transducer 14 may utilise an optical element, such as a grating or a variable linear filter, to provide a spatial separation of the components of thesignal 12 and direct them to a sensor array where they are converted into corresponding electrical signals. Such transducers are well known in the optical art and need not be described in further detail. - The data set {ỹn } 15 is directed to a
processing function 16 that implements one or more of a first set of DSP algorithms (DSP Algorithms I) for signal reconstruction and enhancement. Theprocessor 16 may be a general purpose computer implementing algorithms contained as software instructions resident in a memory device such as a data carrier. Alternatively, the processor may be a dedicated device configured to process the data set in accordance with the selected algorithm. The DSP Algorithms I, executed by theprocessor 16, will typically be chosen to perform reconstruction of spectrum parameters, using a non-linear and non-stationary approach, and providesestimates 17 for P, λ, and OSNR. Optionally, theprocessor 16 may also implement procedures that compensate for variations in temperature, wavelength drifts, aging of the optical components, and the like to enhance the information provided by the processor. - The output from the
processor 16 providesestimates 17 of the power P, wavelength λ and signal to noise ratio OSNR which are sent to anelectrical user interface 18. These outputs based on the spectral analysis quality of the data signal by using one or more of the parameters. For example the channel power may be used as an indicator of quality, or the central wavelength of the channel or by the OSNR. - BER or Q depends on all the elements of a telecommunication link. The spectrum of the transmitted signal contains more information on BER or Q than the
estimates 17 of P, λ, OSNR that are possibly determined on the basis of the data {ỹn } 15 representative of said spectrum, but - as a rule - it does not contain sufficient information on chromatic dispersion and polarization-related effects such as PMD. In order to provide a meaningful estimate of BER or Q, it is necessary to complement spectral information with some time-domain parameters {pk,m } of theoptical signal 12, sensitive to those phenomena. They may be next processed using a number of algorithmic solutions, based both on statistical means of inference and on various methods of multidimensional approximation, including artificial neural networks. To this end, the receivedsignal 12 is also directed to anauxiliary transducer 20 in parallel to thespectrometric transducer 14. Theauxiliary transducer 20 processes the receivedsignal 12 to obtain a data set {p̂k,m } 27 that represents time-domain parameters {pk,m } of thesignal 12. - For example, the time domain parameters of a signal sk (t) transmitted by the kth channel, may be defined as:


auxiliary transducer 20 constructed accordingly to produce the data set {p̂k,m } 27. -
Figures 2a and 2b show how the signal distortion is reflected in the parameters {p̂k,m } defined in the above described way. More specifically, inFigure 2a there are shown two demodulatedsignals signal 202 is the same signal after distortion.Figure 2b shows the dependence of the time-domain parameters {p̂k,m } on the threshold value
distorted signals Equation 1 with a threshold value of 0.2, the time-domain parameter {p̂k,m } of distortedsignal 202 may be viewed, as shown onFigure 2a , as thearea 204 under curve (signal) 202 which is above line 203 (threshold). Thedistorted signal 202 results in time-domain parameters {p̂k,m } that vary in a non-linear fashion as a consequence of the presence of distortion, which may be seen inFigure 2b by the difference between the time-domain parameters for theundistorted signal 201 and thedistorted signal 202 for a given threshold value
differences domain parameters undistorted signal 201 and the time-domain parameters signal 202, respectively, are not equal. The non linearities may be used to provide an indication of the nature and degree of distortion to which the signal has been subjected. As such, signal 202 is processed so as to identify non-linearities relative to anideal signal 201, and from these non-linearities provide an assessment of the degree or type of the distortion. Thus, the time-domain parameters {p̂k,m } form a function that recognizes the shape of the distortedsignal 202 and is indicative of the distortion, which may not be as readily apparent from the spectrum data set {ỹn }. - In using the parameters defined above, the estimates {p̂k,m } 27 may be obtained by an
auxiliary transducer 20, shown inFigure 3 , composed of atunable filter 22 followed by a high-speed photodiode 24. The output of thediode 24 is processed by anintegration circuit 26 to provide the output {p̂k,m } 27. Thetunable filter 22 is used to select a channel so that the associatedphotodiode 24 reproduces sk (t) by demodulation, and the integration circuit performs the operation such as that defined byEquation 1 for each of the selected thresholds. - The
output auxiliary transducer 20 and thespectrometric transducer 14, respectively, are provided to aprocessor 30 that implements selected ones of a second set of DSP algorithms (DSP Algorithms II) to extract further information from the receivedsignal 12. Theprocessor 30 may be a specific hardware implementation structured to perform a specific selected algorithm or may be a general-purpose computing device that operates upon the data sets 15 and 27 in accordance with programmed instructions contained on a memory device. Theprocessor 30 executes one or more of the second set of selected DSP algorithms (DSP Algorithms II) to analyse the data {ỹn } 15 and {p̂k,m } 27, and provide anestimate 35 for BER or Q. Theestimate 35 is next transferred to theelectrical user interface 18. Theelectrical user interface 18 transfers theestimates - The
interface 18 may function to provide readouts of the parameters being monitored but preferably operates to provide a visual indication of the departure of the parameters from predetermined acceptable levels. Thus the interface may monitor over a period of time the quality factor Q of the respective channels for a period of time and provide a signal indicating if the quality on one or more channels has varied from an acceptable value to an unacceptable value. Similarly, each channel may be monitored for BER and an indication provided if the BER has varied from an acceptable to an unacceptable value. By implementing the monitoring with the auxiliary transducer and processor, it is anticipated that the changes value may detected within one second. - The processing of the received
signal 12 is depicted in the flow diagram ofFigure 4 . In afirst step 41, the data {ỹn | n = 1, ..., N} representative of the spectrum of a total DWDM signal are acquired, as well as the estimates {p̂k,m | k = 1, ..., K; m = 1, ..., M} of some time-domain parameters {p̂k,m | k = 1, ..., K; m = 1, ..., M} of that signal, that are provided by theauxiliary transducer 20 and carry auxiliary information about signal distortion. The first set of DSP algorithms (DSP Algorithms I), which will be described further below, is used to determine theestimates 17 of the parameters P, λ, and OSNR for each channel - on the basis of the data {ỹn } 15,step 42. Instep 43, those data {ỹn } 15 are used again, this time together with the estimates {p̂k,m } 27 of the time-domain parameters, to determine theestimate 35 of BER or Q. In this step, the second set of algorithms (DSP Algorithms II), which will be described further below, is used. In alast step 44, there are reported theestimates - The method, as illustrated in
Figure 4 , provides a number of advantages compared to traditional out-of-service BER-test techniques. The method is an optical-layer testing method, which is also an in-service method. A BER test of all channels is performed in parallel and thus simultaneously. The method provides a low-cost solution as well as a fast solution to the problem of in-service monitoring of DWDM networks. Test times, according to the method described inFigure 4 , remain substantially constant as channel counts increase. Also, the described method does not depend on the transmission protocol, on the data format or on the generation of complex test signals. - The first subset of algorithms (DSP Algorithms I), used for determination of the
estimates 17 of the parameters P, λ, and OSNR, contains the algorithms for spectrum reconstruction and estimation of spectrum parameters that are well known in the art, for example those described in detail inUS Pat. No. 5,991,023 to Morawski et al., issued November 23, 1999 , and inUS Pat. No. 6,002,479 to Barwicz et al., issued December 14, 1999 . These may be, in particular, the algorithms of spectrum reconstruction based on the parameterization of the spectrum of the form:
- a1 = [a 1,1...a 1,K ] T , a 2 = [a 2,1... a 2,K ] T , l=[l 1...l K] T are the vectors of parameters to be estimated;
- l= [l 1...lK ] T is the vector of ITU-recommended channel wavelength values;
- v(λ) is a function modelling the normalized spectrum of a monitored telecommunication channel;
- v π (λ) is a function modelling a normalized pedestal, accompanying the spectrum monitored telecommunication channel, in the simplest case:

- In this case, the
estimates 17 of the channel parameters P, λ, OSNR may be calculated directly from the estimates of a 1, a 2, and l. - The second set of DSP algorithms (DSP Algorithms II), used for extracting useful BER and Q information, may be constructed according to the following principles. A
spectrometric transducer 14 converts input optical signal into a set of data {ỹn } 15 representative of the spectrum of this signal. Thespectrometric transducer 14 is, for example, part of a Type-II FLASH device, but it is not restricted to such devices and applications. An output-related discretisation of a wavelength axis is defined by a sequence {λn } Such that λ min = λ 1 < λ 2 < ... < λ N-1 < λN = λ max, where N is a number of data. For example, in a Type-II Flash OPM having a detector array, such as the one described inFigure 1 , N represents a number of photodiodes in the detector array. Thus, the average interval between wavelengths, in the given example equivalent to the distance two neighbouring photodiodes are adjusted to each other, is given by Δλ = (λ max - λ min )/(N - 1). It is assumed that the data {ỹn } 15 represent a spectrum of K channels combined in a DWDM system under consideration. A subsequence of data {ỹ n | n = N k,min, ..., N k,max} is used, together with the information indicative of the signal distortion within the time-domain parameters {p̂k,m } 27 provided by theauxiliary transducer 20, for estimation of BER or Q. Further, the length of this subsequence is variable, and amounts for example to 3, 4, 5, 6 or more elements. In the following, for the sake of simplicity, considerations are limited to one channel only, and the symbol {ỹn } is used for denoting this subsequence. A person of skill in the art is able to extend the concept with ease to any other number of channels. - The problem of determining BER or Q may be solved in a broad context of algorithmic options, which are derived from ideas of quasi-dynamic measurand reconstruction that is a well-established and well-recognised methodology in digital signal processing, as for example illustrated in the paper "The Role of Digital Signal Processing in Measurement Science", published in "Measurement Science - A Discussion" (Ohmsha Press Pub., Tokyo 2000, pp. 77-102). High redundancy of measurement information in raw measurement data is the main distinctive feature of any problem of quasi-dynamic measurand reconstruction. Consequently, implicit or explicit compression of data is present in any procedure for solving such a problem. The value of a scalar measurand x , BER or Q, is estimated on the basis of a subsequence of data {ỹn } 15 representative of the channel spectrum and the parameters {p̂k,m } 27 to which the measurand is approximately related..
- A large family of DSP methods for estimation of BER or Q may be derived from the general methodology for solving problems of quasi-dynamic measurand reconstruction. This methodology consists of two steps: compression of the data {ỹn } 15 and {p̂k,m } 27, i.e. transformation of the data {ỹn } 15 and {p̂k,m } 27 into an
estimate p̂ 32 of a vector of informative parameters p, {ỹn }, {p̂km } → p̂, and subsequent estimation of x on the basis of p̂, p̂ → x̂. This methodology is illustrated in the schematic diagram shown inFigure 5 . Inputs containing the subsequence {ỹn } 15 and {p̂k,m } 27 are provided to adata compressor 31. Thedata compressor 31 compresses the subsequence {ỹn } 15 and {p̂k,m } 27 to obtain a set containing anestimate p 32, which is provided to a BER orQ estimator 33. When properly calibrated, the BER orQ estimator 33 responds with an output set 35 containing an estimate35 x̂ of x, i.e. of BER or Q. A complexity of the method illustrated inFigure 5 depends on a number of informative parameters, i.e. the dimension of thevector p 32. The greater the number of informative parameters, the more time is required both for calibration and for BER or Q estimation. - The calibration of the
Flash OPM 100 is an important step in the methodology described above. It is to be performed on the basis of reference data, which are structured as
Figure 6 , a schematic diagram for a method of calibration is outlined. An input containing the subsequence

data compressor 63. Thedata compressor 63 compresses the subsequence


Q estimator 65. The BER orQ estimator 65 responds with an output set 66 containing a datum
data adjustor 67, the data

data compressor 62 and the BER orQ estimator 65, where in turn this information is utilized in constructing an approximation of the relationship p → x using a set of input-output pairs:
- A large variety of algorithms is possibly generated by combining various techniques of data compression with various types of approximators. For example, the following techniques of data compression are optionally used: principal component analysis, computation of inner products of the data {ỹn } 15 and {p̂k,m } 27 and linearly independent sequences {ej,n | j = 1,..., J}, approximation of the spectrum y(λ) on the basis of {ỹn } 15 and {p̂k,m } 27 using a parameterised function ŷ(λn ; a) with a being a vector of parameters, and computation of the moments of the spectrum y(λ) on the basis of {ỹn } 15. In the considered case, an application-specific vector of informative parameters could contain
estimates 17 of P , λ, and OSNR, the estimates determined on the basis of {ỹn } 15 and {p̂k,m } 27. The most evident candidate for the measurand estimator, i.e. the BER or Q estimator, is a neural network being a universal approximator. Alternatively, B-splines are to be considered as measurand estimators. A person of skill in art will be able to suggest further methods of data compression and final measurand estimation. - For example, following a straightforward approach, a Radial Basis Functions (RBF)
neural network 34 is designed as illustrated in the schematic diagram shown inFigure 7 . This particular network performs both the function of data compressor and of BER/Q estimator. Theneural network 34 receives as inputs data sets {ỹn } 15 and {p̂k,m } 27. Theneural network 34 is trained to respond with anestimate x̂ 35 of x (BER or Q) on the basis of {ỹn } and {p̂k,m }. It is important for training the network that the data set {ỹn } 15 stem from a low-resolution spectrometric transducer and the parameters {p̂k,m } 27 from an auxiliary transducer. The sets of data used for training preferably represent a telecommunication signal distorted in various ways by its propagation through optical elements such as fibers, amplifiers, and filters. Instead of a RBF neural network, any other universal approximator may be used, e.g. another type of neural network or a multi-dimensional spline function. Instead of one neural network a cascade of two neural networks may be designed: the first to perform the function of data compressor, the second - of BER/Q estimator. - Referring now to
Figure 8 , a schematic representation of another embodiment of theFlash OPM 100a is shown, in which theFlash OPM 100a is adapted so as to provide data suitable for use in a special application related to performance monitoring, viz. controlling a Digital Gain Equalizer (DGE). Like components will be described with like reference numerals with a suffix "a" added for clarity. TheFlash OPM 100a includes anoptical user interface 10a, that provides receivedsignal 12a to aspectrometric transducer 14a. Aprocessor 16a implements a first set of DSP algorithms (DSP Algorithms I). The output of theprocessor 16a is applied to theelectrical user interface 18a and to afurther processor 50 that implements a further set of DSP algorithms (DSP Algorithms III). The receivedsignal 12a is also fed to anauxiliary transducer 20a and to theprocessor 30a for implementing the second set of DSP algorithms (DSP Algorithms II) as described above to obtainestimate 35a of BER or Q. Theprocessor 50 utilises the DSP algorithms (DSP Algorithms II) to process theestimates 17a of P, λ, and OSNR according to information suitable for control of DGE. A person of skill in the art easily envisions further applications of DSP-type processing units. These applications are feasible, since the spectrum retrieved by the spectrometric transducer, such as 14,14a, and processed by theprocessors - The data processing performed by optical performance monitors, such as 100 and 100a takes place within a time range of 50-200 milliseconds. This allows for in situ monitoring of an optical signal transmitted on a given channel, and for immediate undertaking of measures to reroute an optical signal to an alternative channel, once a too high value of BER or too low value of Q is detected. Assuming a response time of the monitor of 50 milliseconds, and a transmission bit rate of 2.5 Gb/s, a data buffer of 1.6 MB is sufficient to ensure that no data are lost during the detection of a fault-signalling BER or Q value and rerouting of an optical signal. By shifting the determination of BER or Q values from the electrical domain into the optical domain, a continuous, real-time quality assessment of an optical channel is possible, and it is further possible to route data transmission without a significant loss of information.
Claims (9)
- A method for monitoring a quality of data transmission of at least one optical channel 12, the method comprising the steps of :directing an optical signal to a spectrometric transducer 14 to determine a data set {ỹn} representative of a spectrum of said optical signal 12, said optical signal 12 transmitted on said at least one optical channel 12 at an instance in time;also directing said optical signal 12 to an auxiliary transducer 20 in parallel to said spectrometric transducer 14 to obtain another data set {Pkm} from said optical signal 12 indicative of time domain parameters of said optical signal 12;performing an analysis on both of said data sets {ỹn} {Pkm} to determine an estimate of a predetermined parameter "x" of said optical signal.
- A method for monitoring a quality of data transmission according to claim 1, wherein said predetermined parameter of said the data transmission is selected from the group comprising a bit-error rate of the data transmission, wavelength, optical signal to noise ratio (OSNR) and a quality factor Q of the data transmission.
- A method for monitoring a quality of data transmission according to any one of claims 1 to 2, wherein the step of spectrum analysis to determine a quality of the optical signal comprises the steps of : performing a spectral decomposition of the optical signal; determining a set of data representative of a result of said spectral decomposition; and obtaining an estimate "x" of a predetermined parameter "x", "x" being either one of bite error rate and quality factor, from the set of data the predetermined parameter "x" describing a quality of the optical signal.
- A method for monitoring a quality of data transmission according to claim 3; wherein the estimate "x" is determined by a comparison of the set of data with an ideal set of data.
- A method for monitoring a quality of data transmission according to claim 4, wherein the comparison is performed using a processor for computing the estimate from an identified correlation of the predetermined parameter "x" and the set of data.
- A method for monitoring a quality of data transmission according to claim 5, wherein the processor for computing the estimate "x" from an identified correlation of the predetermined parameter "x" and the set of data is a neural network.
- A method for monitoring a quality of data transmission according to any one of claims 1 to 6, wherein the quality of more than one optical channel is monitored by a same process of spectrum analysis.
- A method for monitoring a quality of data transmission according to any one of claims 1 to 7, wherein said predetermined parameter of at least one optical channel is monitored over a period of time, and wherein an indication signal is provided, the indication signal indicative of at least one optical channel on which the value of said parameter has varied from an acceptable value to an unacceptable value.
- An optical performance monitor (100) for monitoring an optical signal (12) and providing an estimate of a predetermined parameter "x" of that signal (12), the optical performance monitor (100) comprising:a spectrometric transducer (14) for performing a spectral decomposition of the incident optical signal (12), and for transforming the decomposed optical signal into a first data set {ỹn} representative of the spectrum of said optical signal (12);an auxiliary transducer (20) to also receive said optical signal (12) in parallel to said spectrometric transducer (14) and provide as an output a second data set {Pkm} representative of time-domain parameters of said signal (12); and,a processor to receive each of said data sets and to apply thereto digital signal processing routines (16, 30) to obtain estimates of said predetermined parameter.
Applications Claiming Priority (2)
| Application Number | Priority Date | Filing Date | Title |
|---|---|---|---|
| CA2413218A CA2413218C (en) | 2002-11-29 | 2002-11-29 | Flash optical performance monitor |
| PCT/CA2003/001874 WO2004051889A2 (en) | 2002-11-29 | 2003-12-01 | Flash optical performance monitor |
Publications (2)
| Publication Number | Publication Date |
|---|---|
| EP1685663A2 EP1685663A2 (en) | 2006-08-02 |
| EP1685663B1 true EP1685663B1 (en) | 2013-10-16 |
Family
ID=32399904
Family Applications (1)
| Application Number | Title | Priority Date | Filing Date |
|---|---|---|---|
| EP03778204.2A Expired - Lifetime EP1685663B1 (en) | 2002-11-29 | 2003-12-01 | Flash optical performance monitor |
Country Status (5)
| Country | Link |
|---|---|
| US (1) | US7315370B2 (en) |
| EP (1) | EP1685663B1 (en) |
| AU (1) | AU2003285255A1 (en) |
| CA (1) | CA2413218C (en) |
| WO (1) | WO2004051889A2 (en) |
Families Citing this family (11)
| Publication number | Priority date | Publication date | Assignee | Title |
|---|---|---|---|---|
| ATE313175T1 (en) * | 2003-08-18 | 2005-12-15 | Cit Alcatel | METHOD FOR OPTICAL TRANSMISSION AND OPTICAL RECEIVER |
| US20050276601A1 (en) * | 2004-03-02 | 2005-12-15 | Morawski Roman Z | Nonlinear data processing dedicated to an optical spectrum analyzer |
| US8111988B1 (en) * | 2008-06-10 | 2012-02-07 | Lockheed Martin Corporation | Method for monitoring wavelength-division multiplexed signal |
| GB2498336A (en) * | 2012-01-04 | 2013-07-17 | Oclaro Technology Plc | Monitoring multiple optical channels |
| US9124363B2 (en) * | 2012-06-04 | 2015-09-01 | Cisco Technology, Inc. | Digital frequency offset monitor for coherently detected optical superchannels |
| US9515726B2 (en) | 2012-10-04 | 2016-12-06 | Afl Telecommunications Llc | Providing channel health for a WDM system |
| US9553663B1 (en) * | 2015-09-21 | 2017-01-24 | Inphi Corporation | System and method for calibration of an optical module |
| US10236982B1 (en) * | 2017-12-21 | 2019-03-19 | Ciena Corporation | Fiber parameter identification |
| US10404362B1 (en) * | 2018-02-22 | 2019-09-03 | Subcom, Llc | Fault detection and reporting in line monitoring systems |
| CN108957125A (en) * | 2018-03-20 | 2018-12-07 | 北京邮电大学 | Smart frequency spectrum figure analysis method based on machine learning |
| CN113177074B (en) * | 2021-04-02 | 2023-09-29 | 北京科技大学 | Optical performance monitoring system and method for improving environmental adaptability |
Family Cites Families (45)
| Publication number | Priority date | Publication date | Assignee | Title |
|---|---|---|---|---|
| US5296956A (en) * | 1992-07-17 | 1994-03-22 | At&T Bell Laboratories | Performance monitoring and fault location for optical equipment, systems and networks |
| WO1994006052A1 (en) * | 1992-09-10 | 1994-03-17 | Fujitsu Limited | Optical circuit system and its constituents |
| US5513029A (en) * | 1994-06-16 | 1996-04-30 | Northern Telecom Limited | Method and apparatus for monitoring performance of optical transmission systems |
| CA2155693C (en) * | 1994-08-25 | 1999-12-14 | Daniel A. Fishman | Performance monitoring and fault location in optical transmission systems |
| JP2950190B2 (en) * | 1995-03-28 | 1999-09-20 | 株式会社田村電機製作所 | Card issuing device |
| UA46054C2 (en) * | 1995-09-15 | 2002-05-15 | Пллб Елеттроніка С.П.А. | SYSTEM, METHOD AND DEVICE FOR MONITORING FIBER CABLE CABLE |
| JP2848440B2 (en) * | 1995-11-22 | 1999-01-20 | 日本電気株式会社 | Line quality monitoring circuit |
| US5745616A (en) * | 1996-11-27 | 1998-04-28 | Lucent Technologies Inc. | Waveguide grating router and method of making same having relatively small dimensions |
| WO1999067609A1 (en) | 1998-06-23 | 1999-12-29 | Ditech Corporation | Optical network monitor |
| US6215565B1 (en) * | 1998-07-27 | 2001-04-10 | Mci Communications Corporation | Method of and system for diagnosing optical system failures |
| AU5367399A (en) * | 1998-08-28 | 2000-03-21 | E-Tek Electrophotonics Solutions Corporation | Method and apparatus for optical performance monitoring in wavelength division multiplexed fiber optical systems |
| US6317231B1 (en) * | 1998-09-04 | 2001-11-13 | Lucent Technologies Inc. | Optical monitoring apparatus and method for network provisioning and maintenance |
| US6816681B2 (en) * | 1998-09-24 | 2004-11-09 | Nortel Networks Limited | Analogous channel method for performance monitoring and equalization in optical networks |
| KR100303324B1 (en) * | 1999-05-12 | 2001-09-26 | 윤종용 | Reference wavelength supply apparatus for performance monitor of wavelength division multiplex optical transmission system |
| JP2003500639A (en) | 1999-05-21 | 2003-01-07 | ブックハム テクノロジィ パブリック リミテッドカンパニー | Applicability determination method and system for spectroscopic data combined with continuous recalibration |
| US6473210B1 (en) * | 1999-08-20 | 2002-10-29 | Anritsu Company | Method for measuring the performance of broadband dense wavelength division multiplexer (DWDM) using non-linear iterative algorithm |
| US6344910B1 (en) * | 1999-09-23 | 2002-02-05 | Avanex Corporation | Optical performance monitor |
| WO2001052451A2 (en) | 2000-01-14 | 2001-07-19 | Corning Incorporated | System and method for measuring in-band cross-talk in optical communication systems |
| US6407376B1 (en) * | 2000-03-03 | 2002-06-18 | Axsun Technologies, Inc. | Optical channel monitoring system with self-calibration |
| US6377730B1 (en) * | 2000-03-24 | 2002-04-23 | Agere Systems Guardian Corp. | Waveguide based component optical signal power and wavelength detector |
| US20010031107A1 (en) * | 2000-04-26 | 2001-10-18 | Bradshaw Scott H. | Wavelength selector for optical performance monitor |
| GB0012701D0 (en) * | 2000-05-24 | 2000-07-19 | Geary Michael D | Automated astrological data retrieval and analysis |
| US20020063923A1 (en) * | 2000-06-02 | 2002-05-30 | Lightchip, Inc. | System and method for improving optical signal-to-noise ratio measurement range of a monitoring device |
| US6577786B1 (en) * | 2000-06-02 | 2003-06-10 | Digital Lightwave, Inc. | Device and method for optical performance monitoring in an optical communications network |
| US6396051B1 (en) * | 2000-06-07 | 2002-05-28 | Sycamore Networks, Inc. | High resolution optical performance monitor for DWDM system |
| US6912359B2 (en) * | 2000-09-08 | 2005-06-28 | The Regents Of The University Of California | Methods for monitoring performance in optical networks |
| KR100340203B1 (en) * | 2000-09-19 | 2002-06-15 | 오길록 | Optical Performance Monitoring Apparatus for WDM Optical Communication Systems |
| US6922532B2 (en) * | 2000-12-07 | 2005-07-26 | Frederic Simard | Optical performance monitoring for D/WDM networks |
| CA2328748C (en) * | 2000-12-18 | 2005-03-01 | Saeid Seydnejad | Srs pilot tone interaction and higher order effects in optical performance monitoring |
| US6714743B2 (en) * | 2001-03-02 | 2004-03-30 | Optoplex Corporation | Wide range tunable filter |
| US20020141010A1 (en) * | 2001-03-16 | 2002-10-03 | Dave Rodgers | Coupled data and wavelength reference for optical performance monitoring in fiber optic systems |
| US20020130256A1 (en) * | 2001-03-16 | 2002-09-19 | David Macki | Spectrum, time and protocol domain optical performance monitor |
| US20020138796A1 (en) * | 2001-03-23 | 2002-09-26 | Jacob John M. | Intelligent performance monitoring in optical networks using FEC statistics |
| US20020141009A1 (en) * | 2001-03-28 | 2002-10-03 | Jin Yu | Performance monitoring for multi-port optical devices and systems |
| US20020172458A1 (en) * | 2001-04-06 | 2002-11-21 | Downie John D. | Optical system that improves spectrally distorted signals |
| US7068944B2 (en) * | 2001-04-16 | 2006-06-27 | Agilent Technologies, Inc. | Multi-function optical performance monitor |
| US6671434B2 (en) * | 2001-04-17 | 2003-12-30 | Jds Uniphase Corporation | Optical performance monitor |
| US7460785B2 (en) * | 2001-05-23 | 2008-12-02 | Lucent Technologies Inc. | Performance monitoring in an optical communication system |
| CA2357226A1 (en) * | 2001-09-12 | 2003-03-12 | Optenia Inc. | Optical performance monitor |
| KR100419424B1 (en) * | 2001-09-22 | 2004-02-19 | 삼성전자주식회사 | Apparatus for optical signal performance monitoring in wavelength division multiplexing system |
| US20030138251A1 (en) | 2001-10-12 | 2003-07-24 | Harish Jayaram | Method and system for performance monitoring in an optical network |
| FR2832274B1 (en) * | 2001-11-15 | 2006-08-25 | Alcatel Optronics | METHOD FOR DYNAMICALLY CONTROLLING AN OPTICAL MODULE |
| US7031606B2 (en) * | 2001-11-23 | 2006-04-18 | Tropic Networks Inc. | Method and system for monitoring performance of optical network |
| US6836349B2 (en) * | 2001-12-07 | 2004-12-28 | Jds Uniphase Corporation | Optical performance monitoring device |
| KR100445905B1 (en) * | 2001-12-13 | 2004-08-25 | 한국전자통신연구원 | Optical signal performance monitoring apparatus and method for multi-channel optical transmission systems |
-
2002
- 2002-11-29 CA CA2413218A patent/CA2413218C/en not_active Expired - Fee Related
-
2003
- 2003-12-01 EP EP03778204.2A patent/EP1685663B1/en not_active Expired - Lifetime
- 2003-12-01 AU AU2003285255A patent/AU2003285255A1/en not_active Abandoned
- 2003-12-01 US US10/724,356 patent/US7315370B2/en not_active Expired - Fee Related
- 2003-12-01 WO PCT/CA2003/001874 patent/WO2004051889A2/en not_active Application Discontinuation
Also Published As
| Publication number | Publication date |
|---|---|
| US20040165886A1 (en) | 2004-08-26 |
| AU2003285255A1 (en) | 2004-06-23 |
| EP1685663A2 (en) | 2006-08-02 |
| CA2413218C (en) | 2015-01-27 |
| WO2004051889A2 (en) | 2004-06-17 |
| CA2413218A1 (en) | 2004-05-29 |
| WO2004051889A3 (en) | 2004-08-19 |
| US7315370B2 (en) | 2008-01-01 |
Similar Documents
| Publication | Publication Date | Title |
|---|---|---|
| US6907197B2 (en) | Method and apparatus for measuring and estimating optical signal to noise ratio in photonic networks | |
| US20210058154A1 (en) | Method for monitoring an optical communications system | |
| EP2174113B1 (en) | System and method using differential loop gain for fault identification in line monitoring equipment | |
| EP2475113B1 (en) | Method and device for detecting in-band optical signal to noise ratio | |
| CN105577272B (en) | The in-band noise of optic communication signal determines | |
| JP7176373B2 (en) | Optical transmission system and fault diagnosis method for optical transmission system | |
| EP1685663B1 (en) | Flash optical performance monitor | |
| CN102946275A (en) | Method and device for monitoring OSNR (optical signal to noise ratio) in high-speed DWDM (dense wavelength division multiplexing) system | |
| CN108966687A (en) | Channel OSNR and channel OSNR nargin are determined under real network conditions | |
| US7457032B2 (en) | Arrangement, system, and method for accurate power measurements using an optical performance monitor (OPM) | |
| CN110178320B (en) | High resolution line monitoring method and optical communication system using the same | |
| EP2903182B1 (en) | Diagnosing faults in optical networks | |
| US20080075457A1 (en) | Methods and systems for optical performance monitoring | |
| US9917639B2 (en) | Optical signal quality monitoring apparatus, optical signal quality monitoring method and optical repeater | |
| US6714741B1 (en) | Method and apparatus for monitoring an optical WDM network | |
| US7969561B2 (en) | Apparatus and method for monitoring extinction ratio of optical signals | |
| EP1517459B1 (en) | Method and device of analyzing a signal transmitted via a communication link | |
| CN114759981B (en) | OSNR measuring method, device, equipment and readable storage medium | |
| US20040126109A1 (en) | Method for estimating bit-error-ratios within an optical communications network | |
| Lobzov et al. | Channel Performance Criteria in Optical Transport Systems with Forward Error Correcting Codes | |
| CN117692061A (en) | Real-time monitoring device and dense wavelength division transmission system |
Legal Events
| Date | Code | Title | Description |
|---|---|---|---|
| PUAI | Public reference made under article 153(3) epc to a published international application that has entered the european phase |
Free format text: ORIGINAL CODE: 0009012 |
|
| 17P | Request for examination filed |
Effective date: 20051021 |
|
| AK | Designated contracting states |
Kind code of ref document: A2 Designated state(s): AT BE BG CH CY CZ DE DK EE ES FI FR GB GR HU IE IT LI LU MC NL PT RO SE SI SK TR |
|
| 17Q | First examination report despatched |
Effective date: 20070209 |
|
| REG | Reference to a national code |
Ref country code: DE Ref legal event code: R079 Ref document number: 60345101 Country of ref document: DE Free format text: PREVIOUS MAIN CLASS: H04B0010080000 Ipc: H04B0010079000 |
|
| RIC1 | Information provided on ipc code assigned before grant |
Ipc: H04B 10/079 20130101AFI20130318BHEP |
|
| GRAP | Despatch of communication of intention to grant a patent |
Free format text: ORIGINAL CODE: EPIDOSNIGR1 |
|
| INTG | Intention to grant announced |
Effective date: 20130502 |
|
| GRAS | Grant fee paid |
Free format text: ORIGINAL CODE: EPIDOSNIGR3 |
|
| GRAA | (expected) grant |
Free format text: ORIGINAL CODE: 0009210 |
|
| AK | Designated contracting states |
Kind code of ref document: B1 Designated state(s): AT BE BG CH CY CZ DE DK EE ES FI FR GB GR HU IE IT LI LU MC NL PT RO SE SI SK TR |
|
| REG | Reference to a national code |
Ref country code: GB Ref legal event code: FG4D |
|
| REG | Reference to a national code |
Ref country code: CH Ref legal event code: EP |
|
| REG | Reference to a national code |
Ref country code: IE Ref legal event code: FG4D |
|
| REG | Reference to a national code |
Ref country code: AT Ref legal event code: REF Ref document number: 636925 Country of ref document: AT Kind code of ref document: T Effective date: 20131115 |
|
| REG | Reference to a national code |
Ref country code: DE Ref legal event code: R096 Ref document number: 60345101 Country of ref document: DE Effective date: 20131212 |
|
| REG | Reference to a national code |
Ref country code: NL Ref legal event code: VDEP Effective date: 20131016 |
|
| REG | Reference to a national code |
Ref country code: AT Ref legal event code: MK05 Ref document number: 636925 Country of ref document: AT Kind code of ref document: T Effective date: 20131016 |
|
| PG25 | Lapsed in a contracting state [announced via postgrant information from national office to epo] |
Ref country code: SE Free format text: LAPSE BECAUSE OF FAILURE TO SUBMIT A TRANSLATION OF THE DESCRIPTION OR TO PAY THE FEE WITHIN THE PRESCRIBED TIME-LIMIT Effective date: 20131016 Ref country code: FI Free format text: LAPSE BECAUSE OF FAILURE TO SUBMIT A TRANSLATION OF THE DESCRIPTION OR TO PAY THE FEE WITHIN THE PRESCRIBED TIME-LIMIT Effective date: 20131016 Ref country code: NL Free format text: LAPSE BECAUSE OF FAILURE TO SUBMIT A TRANSLATION OF THE DESCRIPTION OR TO PAY THE FEE WITHIN THE PRESCRIBED TIME-LIMIT Effective date: 20131016 Ref country code: BE Free format text: LAPSE BECAUSE OF FAILURE TO SUBMIT A TRANSLATION OF THE DESCRIPTION OR TO PAY THE FEE WITHIN THE PRESCRIBED TIME-LIMIT Effective date: 20131016 |
|
| PG25 | Lapsed in a contracting state [announced via postgrant information from national office to epo] |
Ref country code: ES Free format text: LAPSE BECAUSE OF FAILURE TO SUBMIT A TRANSLATION OF THE DESCRIPTION OR TO PAY THE FEE WITHIN THE PRESCRIBED TIME-LIMIT Effective date: 20131016 Ref country code: AT Free format text: LAPSE BECAUSE OF FAILURE TO SUBMIT A TRANSLATION OF THE DESCRIPTION OR TO PAY THE FEE WITHIN THE PRESCRIBED TIME-LIMIT Effective date: 20131016 Ref country code: CY Free format text: LAPSE BECAUSE OF FAILURE TO SUBMIT A TRANSLATION OF THE DESCRIPTION OR TO PAY THE FEE WITHIN THE PRESCRIBED TIME-LIMIT Effective date: 20131016 |
|
| PG25 | Lapsed in a contracting state [announced via postgrant information from national office to epo] |
Ref country code: PT Free format text: LAPSE BECAUSE OF FAILURE TO SUBMIT A TRANSLATION OF THE DESCRIPTION OR TO PAY THE FEE WITHIN THE PRESCRIBED TIME-LIMIT Effective date: 20140217 |
|
| REG | Reference to a national code |
Ref country code: DE Ref legal event code: R097 Ref document number: 60345101 Country of ref document: DE |
|
| PG25 | Lapsed in a contracting state [announced via postgrant information from national office to epo] |
Ref country code: EE Free format text: LAPSE BECAUSE OF FAILURE TO SUBMIT A TRANSLATION OF THE DESCRIPTION OR TO PAY THE FEE WITHIN THE PRESCRIBED TIME-LIMIT Effective date: 20131016 |
|
| REG | Reference to a national code |
Ref country code: CH Ref legal event code: PL |
|
| PLBE | No opposition filed within time limit |
Free format text: ORIGINAL CODE: 0009261 |
|
| STAA | Information on the status of an ep patent application or granted ep patent |
Free format text: STATUS: NO OPPOSITION FILED WITHIN TIME LIMIT |
|
| PG25 | Lapsed in a contracting state [announced via postgrant information from national office to epo] |
Ref country code: LU Free format text: LAPSE BECAUSE OF FAILURE TO SUBMIT A TRANSLATION OF THE DESCRIPTION OR TO PAY THE FEE WITHIN THE PRESCRIBED TIME-LIMIT Effective date: 20131201 Ref country code: CZ Free format text: LAPSE BECAUSE OF FAILURE TO SUBMIT A TRANSLATION OF THE DESCRIPTION OR TO PAY THE FEE WITHIN THE PRESCRIBED TIME-LIMIT Effective date: 20131016 Ref country code: SK Free format text: LAPSE BECAUSE OF FAILURE TO SUBMIT A TRANSLATION OF THE DESCRIPTION OR TO PAY THE FEE WITHIN THE PRESCRIBED TIME-LIMIT Effective date: 20131016 Ref country code: IT Free format text: LAPSE BECAUSE OF FAILURE TO SUBMIT A TRANSLATION OF THE DESCRIPTION OR TO PAY THE FEE WITHIN THE PRESCRIBED TIME-LIMIT Effective date: 20131016 Ref country code: RO Free format text: LAPSE BECAUSE OF FAILURE TO SUBMIT A TRANSLATION OF THE DESCRIPTION OR TO PAY THE FEE WITHIN THE PRESCRIBED TIME-LIMIT Effective date: 20131016 Ref country code: MC Free format text: LAPSE BECAUSE OF FAILURE TO SUBMIT A TRANSLATION OF THE DESCRIPTION OR TO PAY THE FEE WITHIN THE PRESCRIBED TIME-LIMIT Effective date: 20131016 |
|
| 26N | No opposition filed |
Effective date: 20140717 |
|
| REG | Reference to a national code |
Ref country code: IE Ref legal event code: MM4A |
|
| PG25 | Lapsed in a contracting state [announced via postgrant information from national office to epo] |
Ref country code: DK Free format text: LAPSE BECAUSE OF FAILURE TO SUBMIT A TRANSLATION OF THE DESCRIPTION OR TO PAY THE FEE WITHIN THE PRESCRIBED TIME-LIMIT Effective date: 20131016 |
|
| REG | Reference to a national code |
Ref country code: DE Ref legal event code: R097 Ref document number: 60345101 Country of ref document: DE Effective date: 20140717 |
|
| PG25 | Lapsed in a contracting state [announced via postgrant information from national office to epo] |
Ref country code: IE Free format text: LAPSE BECAUSE OF NON-PAYMENT OF DUE FEES Effective date: 20131201 Ref country code: LI Free format text: LAPSE BECAUSE OF NON-PAYMENT OF DUE FEES Effective date: 20131231 Ref country code: CH Free format text: LAPSE BECAUSE OF NON-PAYMENT OF DUE FEES Effective date: 20131231 |
|
| PG25 | Lapsed in a contracting state [announced via postgrant information from national office to epo] |
Ref country code: SI Free format text: LAPSE BECAUSE OF FAILURE TO SUBMIT A TRANSLATION OF THE DESCRIPTION OR TO PAY THE FEE WITHIN THE PRESCRIBED TIME-LIMIT Effective date: 20131016 |
|
| PG25 | Lapsed in a contracting state [announced via postgrant information from national office to epo] |
Ref country code: TR Free format text: LAPSE BECAUSE OF FAILURE TO SUBMIT A TRANSLATION OF THE DESCRIPTION OR TO PAY THE FEE WITHIN THE PRESCRIBED TIME-LIMIT Effective date: 20131016 |
|
| PG25 | Lapsed in a contracting state [announced via postgrant information from national office to epo] |
Ref country code: HU Free format text: LAPSE BECAUSE OF FAILURE TO SUBMIT A TRANSLATION OF THE DESCRIPTION OR TO PAY THE FEE WITHIN THE PRESCRIBED TIME-LIMIT; INVALID AB INITIO Effective date: 20031201 Ref country code: BG Free format text: LAPSE BECAUSE OF FAILURE TO SUBMIT A TRANSLATION OF THE DESCRIPTION OR TO PAY THE FEE WITHIN THE PRESCRIBED TIME-LIMIT Effective date: 20131016 |
|
| PG25 | Lapsed in a contracting state [announced via postgrant information from national office to epo] |
Ref country code: GR Free format text: LAPSE BECAUSE OF NON-PAYMENT OF DUE FEES Effective date: 20131016 |
|
| REG | Reference to a national code |
Ref country code: FR Ref legal event code: PLFP Year of fee payment: 13 |
|
| PGFP | Annual fee paid to national office [announced via postgrant information from national office to epo] |
Ref country code: GB Payment date: 20151229 Year of fee payment: 13 |
|
| PGFP | Annual fee paid to national office [announced via postgrant information from national office to epo] |
Ref country code: FR Payment date: 20151217 Year of fee payment: 13 |
|
| PGFP | Annual fee paid to national office [announced via postgrant information from national office to epo] |
Ref country code: DE Payment date: 20151229 Year of fee payment: 13 |
|
| PG25 | Lapsed in a contracting state [announced via postgrant information from national office to epo] |
Ref country code: GR Free format text: LAPSE BECAUSE OF FAILURE TO SUBMIT A TRANSLATION OF THE DESCRIPTION OR TO PAY THE FEE WITHIN THE PRESCRIBED TIME-LIMIT Effective date: 20140117 |
|
| REG | Reference to a national code |
Ref country code: DE Ref legal event code: R119 Ref document number: 60345101 Country of ref document: DE |
|
| GBPC | Gb: european patent ceased through non-payment of renewal fee |
Effective date: 20161201 |
|
| REG | Reference to a national code |
Ref country code: FR Ref legal event code: ST Effective date: 20170831 |
|
| PG25 | Lapsed in a contracting state [announced via postgrant information from national office to epo] |
Ref country code: FR Free format text: LAPSE BECAUSE OF NON-PAYMENT OF DUE FEES Effective date: 20170102 |
|
| PG25 | Lapsed in a contracting state [announced via postgrant information from national office to epo] |
Ref country code: DE Free format text: LAPSE BECAUSE OF NON-PAYMENT OF DUE FEES Effective date: 20170701 Ref country code: GB Free format text: LAPSE BECAUSE OF NON-PAYMENT OF DUE FEES Effective date: 20161201 |