WO2020096038A1 - 粒子群計測装置 - Google Patents
粒子群計測装置 Download PDFInfo
- Publication number
- WO2020096038A1 WO2020096038A1 PCT/JP2019/043850 JP2019043850W WO2020096038A1 WO 2020096038 A1 WO2020096038 A1 WO 2020096038A1 JP 2019043850 W JP2019043850 W JP 2019043850W WO 2020096038 A1 WO2020096038 A1 WO 2020096038A1
- Authority
- WO
- WIPO (PCT)
- Prior art keywords
- light intensity
- scattered light
- wavelength
- theoretical value
- measurement
- Prior art date
- Legal status (The legal status is an assumption and is not a legal conclusion. Google has not performed a legal analysis and makes no representation as to the accuracy of the status listed.)
- Ceased
Links
Images



Classifications
-
- G—PHYSICS
- G01—MEASURING; TESTING
- G01N—INVESTIGATING OR ANALYSING MATERIALS BY DETERMINING THEIR CHEMICAL OR PHYSICAL PROPERTIES
- G01N15/00—Investigating characteristics of particles; Investigating permeability, pore-volume or surface-area of porous materials
- G01N15/02—Investigating particle size or size distribution
-
- G—PHYSICS
- G01—MEASURING; TESTING
- G01N—INVESTIGATING OR ANALYSING MATERIALS BY DETERMINING THEIR CHEMICAL OR PHYSICAL PROPERTIES
- G01N15/00—Investigating characteristics of particles; Investigating permeability, pore-volume or surface-area of porous materials
- G01N15/06—Investigating concentration of particle suspensions
Definitions
- the present invention relates to a particle swarm measuring device.
- fine particles contained in the exhaust gas of automobiles and aerosols such as yellow sand flying from the continent contain many submicron particles with a particle size of less than 1 ⁇ m. Also, with the recent development of liquid atomization technology, it has become possible to generate fine sprays having an arithmetic average particle size of the order of several ⁇ m, and it is estimated that the lower limit of the particle size distribution is no longer than 1 ⁇ m. It In order to understand such behavior of submicron particles, establishment of a particle size measurement method is essential.
- Patent Document 1 discloses a particle size measuring device and a particle size measuring method, which are the basic technology of the present invention by the inventor of the present application.
- Non-Patent Document 1 describes a particle size measuring method for a particle size range including a submicron region on the order of 1 nm to 10 ⁇ m, and describes the characteristics of the measuring method according to each particle size range. is there.
- the particle size measuring method is roughly classified into a non-contact type and a sampling type.
- the non-contact type particle size measuring method mainly uses laser light, and uses a laser diffraction method using a scattering pattern, a light scattering method using scattered light intensity, and a frequency fluctuation of scattered light due to particle motion.
- the dynamic light scattering method and the like are known. Since these use laser light as a probe, non-contact measurement is possible, and there is a great advantage that two-dimensional measurement is possible depending on the method.
- the laser diffraction method and the light scattering method have a particle size measuring range on the order of 100 nm to 100 ⁇ m, and are widely used for measuring the particle size of fuel sprays and powders.
- a particle size measuring range on the order of 100 nm to 100 ⁇ m, and are widely used for measuring the particle size of fuel sprays and powders.
- the dynamic light scattering method is capable of measuring extremely small particle diameters on the order of 1 nm to 1 ⁇ m, and has been applied to observation of fine particle formation processes in flames, and has produced great results.
- a powerful laser light source and complicated signal processing are required, and since two-dimensional data acquisition requires many experiments because it is based on point measurement, many experiments are required before its practical use. There was difficulty.
- sampling type particle size measuring method for collecting and analyzing particles
- there are many methods such as a measuring method using an optical / electron microscope, an inertial collision method, a gravity sedimentation / centrifugal sedimentation method, an electrical detection zone method, an electrostatic classification method, and the like.
- the method is known.
- According to such a sampling type particle size measuring method depending on the method, it is possible to measure an extremely minute particle size on the order of 1 nm.
- valuable information such as the spatial distribution of the particle size and the temporal change is lost.
- the polarization ratio method is known as a submicron particle size measurement method using laser light.
- the polarization ratio method is a method that has been developed as a method for measuring the particle size of aerosols, and has been applied to the observation of the particle formation process in flames, and has made great results.
- the polarization ratio method utilizes the property that the intensity ratio of the two polarization components contained in the scattered light from the particles depends on the particle size.
- the particle size measurement method using the polarization ratio method has a great advantage that particle size smaller than the laser wavelength can be measured and particle size can be measured in a non-contact manner.
- the measurable particle size range is narrow, and is currently limited to 1 nm to 100 nm.
- the polarization ratio method does not overlap the particle size measurement range with the laser diffraction method and scattered light method described above, and it is necessary to develop a particle size measurement method that fills the gap between the two.
- Patent Document 1 the inventor realizes a particle size measuring device and a particle size measuring method capable of measuring the particle size in a non-contact manner with particles to be measured and expanding the measurable particle size range did.
- the measurable particle size range in Patent Document 1 is about several hundred nm to 10 ⁇ m, and for the particles having an extremely small particle size up to about several nm below 10 nm, the technique described in Patent Document 1 is used. Has not been applied.
- soot When fuel burns in the cylinder of an engine such as a passenger car, soot is momentarily generated inside the piston, and soot grows in a very short time.
- These soot particles have a very small particle size of several nm to several tens nm. It is naturally impossible to measure the particle size of such ultra-fine particles generated and grown in an extremely short time, and it is naturally impossible without contact, and there has been no method that can be realized so far.
- the soot generated inside the flame is not composed of a single particle size. It roughly follows a lognormal distribution, and has a mean value and a variance. It also has a refractive index, which is a unique optical constant determined by the constituent elements of the particle and its bonding structure. In order to measure soot particles, it is necessary to grasp not only the particle size but also the average value of particle sizes, the dispersion of particle sizes, the number of particles, the refractive index, and the like.
- the present invention has been made in view of the above situation, and estimates the particle size of the particles to be measured, the average value of the particle sizes, the particle size dispersion, the number of particles, and the refractive index in a non-contact and extremely short time.
- An object of the present invention is to provide a particle swarm measuring device capable of performing the above.
- the particle swarm measuring apparatus of the present invention is a first light source for irradiating a first light having a first wavelength to an optical path passing through a measurement target, and an optical path having a first wavelength.
- a second light source that emits a second light having a different second wavelength, and is arranged at a predetermined scattering angle + ⁇ in a direction parallel to the observation surface including the optical path from the optical path with the measurement target as the center.
- the first polarized camera that receives the light from the first light source and outputs the first scattered light intensity data, and the predetermined scattering from the optical path in the direction parallel to the observation surface centering on the measurement target.
- a second polarization camera which is arranged at a position of the angle ⁇ and which receives the light of the second light source and outputs the second scattered light intensity data.
- a light intensity field in which a theoretical value of scattered light intensity is stored a refractive index field in which a refractive index is stored, a standard deviation field in which a standard deviation is stored, and an average particle size are stored.
- the scattered light intensity theoretical value table having an average particle size field and a particle number field in which the number of particles is stored is compared with the scattered light intensity data and the scattered light intensity theoretical value, and the record with the highest degree of similarity is obtained. From the refractive index, the standard deviation, the average particle size, and the number of particles.
- the present invention it is possible to estimate the particle size of the particles to be measured, the average value of the particle sizes, the dispersion of the particle sizes, the number of particles, and the refractive index in a non-contact and extremely short time.
- a device can be provided. Problems, configurations, and effects other than those described above will be clarified by the following description of the embodiments.
- FIG. 3 is a schematic diagram showing an internal configuration of a polarization camera used in the particle swarm measuring apparatus and measurement values used. It is a block diagram which shows the hardware constitutions of a particle swarm measuring device. It is a block diagram which shows the software function of a particle swarm measuring apparatus. It is a table showing a field configuration of a scattered value intensity theoretical value table. It is a graph which shows the model of the particle group represented by the record recorded on the scattered value intensity theoretical value table. It is a graph which shows the particle size of a particle group, and the relationship of polarization ratio in the light of a certain wavelength.
- FIG. 1 is a schematic diagram showing the overall configuration of a particle swarm measuring apparatus 101 according to an embodiment of the present invention.
- a flame 102 is a measurement target of the particle group measuring device 101.
- An approximately horizontal plane that passes through the measurement target with respect to the flame 102 that is the measurement target is referred to as an observation plane D103.
- B109 is formed.
- the first light source 104 is a laser light source that outputs light having a first wavelength (first light).
- the laser wavelength is, for example, 405 nm and is a violet laser.
- the second light source 105 is a laser light source that outputs light of the second wavelength (second light).
- the laser wavelength is, for example, 488 nm and is a blue laser. These purple and blue are colors selected to remove as much noise as possible from the orange light emitted by the flame 102 that is the measurement target.
- the photosynthetic body 106 aligns the optical axes of the two laser lights of the violet laser emitted from the first light source 104 and the blue laser emitted from the second light source 105, and outputs them in one direction.
- the polarization filter 107 is provided so as to transmit the polarized light of 45 ° at an angle. This is to obtain polarized light with uniform output in the vertical and horizontal directions.
- the convex lens 108 is provided to converge the light flux of the laser light.
- the linearly polarized light B109 passes through the flame 102 to be measured and is irradiated on the beam stop 110 which is also called a beam trap or a beam block. Since the beam stop 110 is provided for safety, any structure may be used as long as it does not diffuse the laser light.
- the linearly polarized light B109 passes through the flame 102 to be measured, the linearly polarized light B109 is diffused at a predetermined scattering angle ⁇ ⁇ in a direction parallel to the observation plane D103.
- the first polarization camera 111 is installed on one side + ⁇ of the scattering angle ⁇ ⁇ .
- the first polarization camera 111 detects the intensity of the light of the first light source 104 through the first color filter 112 that transmits only the wavelength 405 nm of the light of the first light source 104.
- a second polarization camera 113 is installed on the other side ⁇ of the scattering angles ⁇ ⁇ .
- the second polarization camera 113 detects the intensity of the light of the second light source 105 through the second color filter 114 that transmits only the wavelength of 488 nm of the light of the second light source 105.
- of the scattering angle ⁇ ⁇ can be set to approximately 30 ° to 80 ° and 100 ° to 150 °.
- the ranges of 60 ° -80 ° and 100 ° -120 ° are preferred.
- 90 ° is a singular point.
- the intensity of the second scattered light becomes zero and measurement becomes impossible. Therefore, it is preferable to avoid a position of 90 ° and not be too close to 0 ° and 180 °.
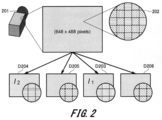
- FIG. 2 is a schematic diagram showing the internal configuration of the polarization camera 201 used in the particle swarm measuring apparatus 101 and the measurement values used.
- the polarization camera 201 has an image pickup device having pixels of, for example, 648 ⁇ 488 pixels. Then, the image pickup device is provided with a minute polarizing plate 202 for each image pickup pixel.
- the micro-polarizing plate 202 is provided with four kinds of polarization filters aligned in each image pickup pixel: horizontal polarization, right diagonal polarization, vertical polarization, and left diagonal polarization. Then, the polarization camera 201 outputs image data corresponding to each polarization.
- the particle swarm measuring device 101 of the present invention uses image data D203 of vertically polarized light and image data D204 (324 ⁇ 244 pixels) of horizontally polarized light, and uses image data D205 of vertically polarized light and diagonally left direction.
- the image data D206 of the polarized light of is not used.
- the first polarized camera 111 and the second polarized camera 113 are connected to an information processing device 115 such as a personal computer.
- the information processing device 115 performs an arithmetic process described below to estimate and calculate the refractive index, standard deviation, average particle size, and particle number of soot, that is, a particle group, contained in the flame 102 at a predetermined moment.
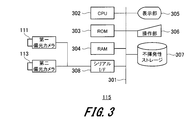
- FIG. 3 is a block diagram showing the hardware configuration of the information processing device 115.
- the information processing device 115 includes a CPU 302, a ROM 303, a RAM 304, a display unit 305, an operation unit 306, a non-volatile storage 307, and a serial interface (hereinafter, abbreviated as “serial I / F”) 308 such as a USB, which is connected to the bus 301.
- serial I / F serial interface
- FIG. 4 is a block diagram showing software functions of the information processing device 115.
- the first polarization camera 111 measures the first polarization first scattered light intensity data (I 1 ⁇ 1 ) which is the vertical polarization intensity value derived from the violet laser output from the first light source 104 and the first measurement horizontal polarization intensity value.
- the wavelength second scattered light intensity data (I 2 ⁇ 1 ) is output.
- the second polarization camera 113 measures the second polarization first scattered light intensity data (I 1 ⁇ 2 ) which is the vertical polarization intensity value derived from the blue laser output from the second light source 105 and the second measurement intensity which is the horizontal polarization intensity value.
- the wavelength second scattered light intensity data (I 2 ⁇ 2 ) is output.
- the measured second wavelength second scattered light intensity data (I 2 ⁇ 2 ) is input to the distance minimum value calculation unit 401.
- Distance minimum value calculation unit 401 reads the scattered light intensity theoretical value table 402, the measurement first wavelength first scattered light intensity data (I 1 ⁇ 1), measuring the first wavelength second scattered light intensity data (I 2 ⁇ 1), measuring the A record closest to the two-wavelength first scattered light intensity data (I 1 ⁇ 2 ) and the measured second wavelength second scattered light intensity data (I 2 ⁇ 2 ) is searched for. Then, the minimum distance value calculation unit 401 outputs the refractive index of the particle group, the standard deviation, the average particle size, and the number of particles stored in the closest record.
- the exposure control unit 403 outputs shutter pulses to the first polarization camera 111 and the second polarization camera 113 at the same time, and sets the exposure time required for shooting. Although omitted in FIG. 4, the exposure control unit 403 outputs a shutter pulse to the first polarization camera 111 and the second polarization camera 113 in response to a predetermined control signal obtained from the outside.
- the predetermined control signal obtained from the outside is, for example, a timing pulse obtained from an engine model or the like (not shown).
- the exposure control unit 403 makes it possible to measure the soot state at a desired instant in the combustion cycle of the engine by giving a predetermined time delay to the control signal or strictly controlling the exposure time.
- FIG. 5 is a table showing a field configuration of the scattered light intensity theoretical value table 402.
- the scattered light intensity theoretical value table 402 includes a first wavelength first scattered light intensity field, a first wavelength second scattered light intensity field, a second wavelength first scattered light intensity field, a second wavelength second scattered light intensity field, and refraction. It has a rate field, a standard deviation field, an average particle size field, and a particle number field.
- the theoretical value of the first wavelength first scattered light intensity (I 1 ⁇ 1 ) is stored in the first wavelength first scattered light intensity field.
- the theoretical value of the first wavelength second scattered light intensity (I 2 ⁇ 1 ) is stored in the first wavelength second scattered light intensity field.
- the theoretical value of the second wavelength first scattered light intensity (I 1 ⁇ 2 ) is stored in the second wavelength first scattered light intensity field.
- the second wavelength second scattered light intensity (I 2 ⁇ 2 ) theoretical value is stored in the second wavelength second scattered light intensity field. That is, the fields of these scattered light intensity theoretical values are the same as the data of the same name output by the first polarization camera 111 and the second polarization camera 113, respectively, and the theoretical values of the particle groups assumed by the preliminary calculation processing described later are performed. (Scalar value) is stored.
- an assumed refractive index (scalar value) of the particle group which is calculated by a preliminary calculation process described later
- the standard deviation field stores a standard deviation (scalar value) of an assumed particle group, which is calculated by preliminary calculation processing described later.
- the average particle size field the expected average particle size (scalar value) of the particle group, which is calculated by the preliminary calculation process described later, is stored.
- the particle number field an assumed particle number (scalar value) of the particle group, which is calculated by preliminary calculation processing described later, is stored.
- FIG. 6 is a graph showing a model of a particle group represented by a record recorded in the scattered light intensity theoretical value table 402.
- a particle group of fine particles having a dispersed particle size which is generated due to a natural phenomenon, substantially agrees with a Gaussian curve having a logarithmic scale on the horizontal axis, as shown in FIG.
- the horizontal axis represents the particle size on a logarithmic scale
- the vertical axis represents the number of particles (frequency of appearance).
- the form of the graph is uniquely determined by the mean and standard deviation. Therefore, the four parameters of the average particle diameter, standard deviation, number, and refractive index are set, and the wavelength of the violet laser output by the first light source 104, the wavelength of the blue laser output by the second light source 105, the first polarization camera 111, and By giving an angle ⁇ with respect to the optical axis at which the second polarization camera 113 is installed and performing calculation, the first wavelength first scattered light intensity (I 1 ⁇ 1 ), the first wavelength second scattered light intensity (I 2 ⁇ 1 ), The theoretical values of the second wavelength first scattered light intensity (I 1 ⁇ 2 ) and the second wavelength second scattered light intensity (I 2 ⁇ 2 ) can be calculated.
- the theoretical value of I 2 ⁇ 2 is a search key for searching the refractive index, standard deviation, average particle size, and number of particles.
- the degree of similarity between the theoretical value that serves as the search key and the value actually measured by the polarization camera is calculated, and the most similar record is estimated to substantially match the measured parameter group of the particle group.
- the distance between the theoretical value and the actually measured value is calculated. That is, the minimum distance value calculation unit 401 calculates the distance DS by adding the square of the difference for each parameter as shown below, and searches for the record with the smallest value of the distance DS.
- Distance DS (Theoretical value of the first scattered light intensity of the first wavelength-Measured data of the first scattered light intensity of the first wavelength) 2 + (Theoretical value of first wavelength second scattered light intensity-measured first wavelength second scattered light intensity data) 2 + (Theoretical value of the first scattered light intensity of the second wavelength-Measured data of the first scattered light intensity of the second wavelength) 2 + (Theoretical value of second wavelength second scattered light intensity-measured second wavelength second scattered light intensity data) 2
- FIG. 7 is a graph showing the relationship between the average particle size of the particle group and the polarization ratio for light of a certain wavelength.
- the solid line graphs of FIGS. 7 and 8 represent blue laser light, that is, the second light, and the dotted line graph of FIG. 8 described later represents purple laser light, that is, the first light.
- the standard deviations are different, even the particle groups having the same average particle size show completely different polarization ratios. Therefore, the particle group cannot be specified with only a single light because different particle diameters correspond to a certain polarization ratio.
- FIG. 8 is a graph showing the relationship between the particle size of the particle group and the polarization ratio for light of two different wavelengths. Therefore, when the relationship between the particle size of the particle group and the polarization ratio is plotted in the graph for light of two different wavelengths, the wavelengths are different, so even if different particle sizes correspond to a certain polarization ratio, different wavelengths are used. By superimposing it on the graph of, it can be estimated that the value with the smallest error in particle size is the target particle size.
- the theoretical scattered light intensity is calculated by the following formula.
- f is the Mie scattering theory equation
- ⁇ is the incident light wavelength
- ⁇ is the scattering angle
- ⁇ ⁇ is the exposure time
- m is the complex index of refraction
- ⁇ g is the geometric standard deviation
- D g is the geometrical standard deviation.
- C ⁇ is an optical constant
- n is the number of particles.
- ⁇ , ⁇ , ⁇ ⁇ are default values
- m, ⁇ g , D g , C ⁇ , and n are unknowns.
- ⁇ 1 is the first light
- ⁇ 2 is the second light.
- One particle having a certain particle diameter D outputs scattered light of a predetermined intensity at a scattering angle ⁇ with a complex refractive index m and an optical constant C ⁇ for a certain incident light wavelength ⁇ . Since there is not only one particle, the scattered light intensities are cumulatively added for the number of particles. Also, since the particle size of the particles is not limited to one, it is necessary to perform the same calculation for particles having different particle sizes. The appearance frequency of the particle size of the particles substantially follows a normal distribution on a logarithmic scale. If the average value of the particle diameters, the standard deviation of the particle diameters, and the number of particles are known, the intensity of scattered light output from the particle group can be calculated.
- the incident light wavelength ⁇ , the scattering angle ⁇ , and the exposure time ⁇ ⁇ are fixed in advance, while varying the complex refractive index m, the geometric standard deviation ⁇ g , the geometric mean particle diameter D g , and the optical constant C ⁇ .
- First wavelength first scattered light intensity theoretical value (I 1 ⁇ 1 ), first wavelength second scattered light intensity theoretical value (I 2 ⁇ 1 ), second wavelength first scattered light intensity theoretical value (I 1 ⁇ 2 ), second wavelength first Calculating the theoretical value of the two-scattered light intensity (I 2 ⁇ 2 ) is a preliminary calculation process. Then, the calculation result of the preliminary calculation processing is recorded in the table as the scattered light intensity theoretical value table 402.
- the scattering angle ⁇ is set to an appropriate value. Therefore, when the particle swarm measuring device 101 actually performs the measurement, the first polarization camera 111 and the second polarization camera 113 must be arranged at a scattering angle ⁇ ⁇ with respect to the measurement target.
- FIG. 9 is a graph of an experimental result of an experiment for measuring the soot of a flame using the PAMS method which is a conventional technique and the particle swarm measuring apparatus 101 according to the embodiment of the present invention.
- the form of the graph is almost the same as that of FIG. 6, the horizontal axis is the particle size on a logarithmic scale, and the vertical axis is the normalized particle density (appearance frequency).
- the PAMS method which is a conventional technique, is an abbreviation for Portable aerosol mobility spectrometer. Particles of the source are directly collected from a sampling port opened next to the pipe and classified by sieving and then the number of particles of each particle size is measured. Is a method of counting. Since soot in the flame is the object of measurement, in order to freeze the oxidation reaction due to the flame and to suppress the agglomeration of soot particles, nitrogen gas is passed through the pipe to cool and dilute the soot. It was collected. It can be seen from FIG.
- the particle swarm measuring apparatus 101 is disclosed.
- the particle swarm measuring apparatus 101 creates the scattered light intensity theoretical value table 402 in advance by preliminary calculation processing. Then, the first polarization camera 111 and the second polarization camera 113 are installed at the positions of the scattering angle ⁇ ⁇ determined at the time of the preliminary calculation processing.
- the minimum distance calculation unit 401 measures the measured first wavelength first scattered light intensity (I 1 ⁇ 1 ), the measured first wavelength second scattered light intensity (I 2 ⁇ 1 ) output from the first polarized camera 111, and the second polarized camera.
- the record of the scattered light intensity theoretical value table 402 having the highest similarity to the measured second wavelength first scattered light intensity (I 1 ⁇ 2 ) and the measured second wavelength second scattered light intensity (I 2 ⁇ 2 ) output from 113 is specified.
- the refractive index m, the standard deviation ⁇ g , the average particle diameter D g , and the particle number n are output.
- the particle group measuring apparatus 101 can estimate and calculate the refractive index m, the standard deviation ⁇ g , the average particle diameter D g , and the number n of particles of the particle group in a non-contact and extremely short time.
Landscapes
- Chemical & Material Sciences (AREA)
- Dispersion Chemistry (AREA)
- Physics & Mathematics (AREA)
- Health & Medical Sciences (AREA)
- Life Sciences & Earth Sciences (AREA)
- Analytical Chemistry (AREA)
- Biochemistry (AREA)
- General Health & Medical Sciences (AREA)
- General Physics & Mathematics (AREA)
- Immunology (AREA)
- Pathology (AREA)
- Investigating Or Analysing Materials By Optical Means (AREA)
Abstract
非接触かつ極短時間で、被計測粒子の粒径と、粒径の平均値、粒径の分散、粒子の数、屈折率を推定することが可能な、粒子群計測装置を提供する。粒子群計測装置は、予め予備演算処理によって散乱光強度理論値テーブルを作成しておく。そして、予備演算処理の時点で定めた散乱角度±θの位置に、第一偏光カメラ、第二偏光カメラを設置する。距離極小値演算部は、第一偏光カメラから出力される計測第一波長第一散乱光強度(I1λ1)、計測第一波長第二散乱光強度(I2λ1)と、第二偏光カメラから出力される計測第二波長第一散乱光強度(I1λ2)、計測第二波長第二散乱光強度(I2λ2)に最も類似度が高い、散乱光強度理論値テーブルのレコードを特定し、屈折率m、標準偏差σg、平均粒径Dg、粒子数nを出力する。
Description
本発明は、粒子群計測装置に関する。
自動車の排気ガスに含まれる微粒子や、大陸から飛来する黄砂のようなエアロゾルは、粒径が1μmを下回るサブミクロン粒子を多く含むことが知られている。また、近年の液体微粒化技術の発展と共に、算術平均粒径が数μmオーダの微細噴霧生成が可能となってきており、その粒径分布の下限は、もはや1μm以下の領域にあると推定される。このようなサブミクロン粒子の振る舞いを把握するためには、その粒径計測法の確立が必須の課題である。
本発明の技術分野に近い先行技術文献を特許文献1及び非特許文献1に示す。
特許文献1には、本願発明者による本願発明の基礎技術である、粒径計測装置及び粒径計測方法が開示されている。
非特許文献1には、1nm~10μmオーダのサブミクロン領域を含む粒径範囲を対象とした粒径計測法について記載されており、それぞれの粒径範囲に応じた計測法の特性についての記載がある。なお、粒径計測法は、主に非接触式と採取式に大別される。
特許文献1には、本願発明者による本願発明の基礎技術である、粒径計測装置及び粒径計測方法が開示されている。
非特許文献1には、1nm~10μmオーダのサブミクロン領域を含む粒径範囲を対象とした粒径計測法について記載されており、それぞれの粒径範囲に応じた計測法の特性についての記載がある。なお、粒径計測法は、主に非接触式と採取式に大別される。
非接触式粒径計測法は、主にレーザ光を用いたものであり、散乱パターンを用いたレーザ回折法、散乱光強度を用いた光散乱法、粒子運動による散乱光の周波数変動を用いた動的光散乱法などが知られている。これらは、プローブとしてレーザ光を用いるため、非接触計測が可能であり、手法によっては2次元計測が可能という大きな利点を有する。
レーザ回折法及び光散乱法は、100nm~100μmオーダの粒径計測範囲を有し、燃料噴霧、粉体などの粒径計測に幅広く用いられている。しかしながら現状では、平均粒径が1μm以下の粒子にそのまま適用するには多くの困難を伴う。
動的光散乱法は、1nm~1μmオーダと極めて微小な粒径計測が可能であり、火炎中の微粒子生成過程の観察に適用されて大きな成果を挙げている。しかしながら、強力なレーザ光源と複雑な信号処理が必要なため、また点計測を基本とするため2次元データ取得には、数多くの実験を必要とするため、その実用に至るまでには、多くの困難があった。
粒子を採取して分析する採取式粒径計測法としては、光学・電子顕微鏡を用いた計測法、慣性衝突法、重力沈降・遠心沈降法、電気的検知帯法、静電分級法など数多くの手法が知られている。このような採取式粒径計測法では、手法によっては1nmオーダと極めて微小な粒径計測が可能である。しかしながら、粒子を採取して分析する必要があるため、粒径の空間分布や時間変化といった貴重な情報が失われてしまうという問題がある。
一方、レーザ光を用いたサブミクロン粒径計測法として、偏光比法が知られている。偏光比法は、エアロゾルの粒径計測法として発展してきた手法であり、火炎中の微粒子生成過程の観察に適用され、大きな成果をあげている。偏光比法は、粒子からの散乱光に含まれる2つの偏光成分の強度比がその粒径に依存する性質を利用したものである。
偏光比法を用いた粒径計測方法は、レーザ波長よりも小さい粒子でも計測が可能であり、非接触での粒径計測が可能であるという大きな利点を有する。しかしながら、計測可能な粒径範囲が狭く、現状では1nm~100nmに限定される。
このため、偏光比法は先述のレーザ回折法や散乱光法などと粒径計測範囲が重複しておらず、両者の間を埋める粒径計測法の開発が求められている。
櫻井博、粒子の気中個数濃度と粒径分布の計測技術と標準、産総研計量標準報告、産業技術総合研究所、Vol.4、No.1、53-63。
特許文献1に示す特許では、発明者は、被計測粒子に非接触で粒径を計測でき、かつ、計測可能な粒径範囲の拡大を可能とする粒径計測装置及び粒径計測方法を実現した。但し、特許文献1で計測可能な粒径範囲は、数百nm~10μm程度であり、10nmを下回る数nm程度までの、極めて極小な粒径を有する粒子には、特許文献1に記載の技術も適用できていない。
乗用車等のエンジンのシリンダ内で燃料が燃焼する際、ピストン内部では瞬間的にすすが発生し、極僅かな時間の間にすすが成長する。これらのすす粒子は、数nmから数10nm程度の極めて極小な粒径を持つ。このような、極めて短時間の間に発生し成長する極小微粒子の粒径を計測することは、当然に非接触でないと不可能であり、これまで実現できる手法が存在しなかった。
また、炎の内部で発生するすすは、単一の粒径で構成されない。概ね対数正規分布に従い、平均値と分散を有する。また、粒子の構成元素とその結合構造から決まる特有の光学定数である屈折率を呈する。すす粒子の計測には、単に粒径を求めるだけでなく、粒径の平均値、粒径の分散、粒子の数、屈折率等を併せて把握する必要がある。
本発明は係る状況に鑑みてなされたものであり、非接触かつ極短時間で、被計測粒子の粒径と、粒径の平均値、粒径の分散、粒子の数、屈折率を推定することが可能な、粒子群計測装置を提供することを目的とする。
上記課題を解決するために、本発明の粒子群計測装置は、計測対象を通過する光路に第一の波長を有する第一の光を照射する第一光源と、光路に、第一の波長と異なる第二の波長を有する第二の光を照射する第二光源と、光路から、計測対象を中心として、光路を含む観測面に平行な方向に予め定められた散乱角度+θの位置に配置される、第一光源の光を受光して第一の散乱光強度データを出力する出力する第一偏光カメラと、光路から、計測対象を中心として、観測面に平行な方向に予め定められた散乱角度-θの位置に配置される、第二光源の光を受光して、第二の散乱光強度データを出力する第二偏光カメラとを具備する。
更に、想定される粒子群における、散乱光強度理論値が格納される光強度フィールドと、屈折率が格納される屈折率フィールドと、標準偏差が格納される標準偏差フィールドと、平均粒径が格納される平均粒径フィールドと、粒子数が格納される粒子数フィールドとを有する散乱光強度理論値テーブルと、散乱光強度データと散乱光強度理論値とを比較して、最も類似度が高いレコードから屈折率、標準偏差、平均粒径、粒子数を出力する距離極小値演算部とを具備する。
本発明によれば、非接触かつ極短時間で、被計測粒子の粒径と、粒径の平均値、粒径の分散、粒子の数、屈折率を推定することが可能な、粒子群計測装置を提供することができる。
上記した以外の課題、構成及び効果は、以下の実施形態の説明により明らかにされる。
上記した以外の課題、構成及び効果は、以下の実施形態の説明により明らかにされる。
[粒子群計測装置:全体構成]
図1は、本発明の実施形態に係る粒子群計測装置101の全体構成を示す概略図である。
図1において、炎102が粒子群計測装置101の計測対象である。
計測対象である炎102に対し、計測対象を通過する、概ね水平の面を観測面D103とする。
この観測面D103に平行な方向に、第一光源104と第二光源105、プリズム等の光合成体106、そして偏光フィルタ107と凸レンズ108によって、観測面D103に形成される光路D116を直進する直線偏光B109が形成される。
図1は、本発明の実施形態に係る粒子群計測装置101の全体構成を示す概略図である。
図1において、炎102が粒子群計測装置101の計測対象である。
計測対象である炎102に対し、計測対象を通過する、概ね水平の面を観測面D103とする。
この観測面D103に平行な方向に、第一光源104と第二光源105、プリズム等の光合成体106、そして偏光フィルタ107と凸レンズ108によって、観測面D103に形成される光路D116を直進する直線偏光B109が形成される。
第一光源104は第一の波長の光(第一の光)を出力するレーザ光源である。レーザの波長は例えば405nmの、紫色のレーザである。
第二光源105は第二の波長の光(第二の光)を出力するレーザ光源である。レーザの波長は例えば488nmの、青色のレーザである。
これら紫色及び青色は、計測対象である炎102が発するオレンジ色の光に由来するノイズをできる限り除去するために選択される色である。
第二光源105は第二の波長の光(第二の光)を出力するレーザ光源である。レーザの波長は例えば488nmの、青色のレーザである。
これら紫色及び青色は、計測対象である炎102が発するオレンジ色の光に由来するノイズをできる限り除去するために選択される色である。
光合成体106は、第一光源104が発する紫色レーザと、第二光源105が発する青色レーザの、2個のレーザ光の光軸を揃えて一方向に出力する。
偏光フィルタ107は、斜め45°の偏光を透過させるべく設けられている。これは、縦方向と横方向に均等な出力の偏光を得るためである。
凸レンズ108は、レーザ光の光束を収束させるために設けられている。
偏光フィルタ107は、斜め45°の偏光を透過させるべく設けられている。これは、縦方向と横方向に均等な出力の偏光を得るためである。
凸レンズ108は、レーザ光の光束を収束させるために設けられている。
直線偏光B109は計測対象である炎102を通過し、ビームトラップあるいはビームブロックとも呼ばれるビームストップ110に照射される。ビームストップ110は安全のために設けられているので、レーザ光が拡散しない構成であれば何を使用してもよい。
直線偏光B109が計測対象である炎102を通過する際、直線偏光B109は観測面D103に平行な方向に所定の散乱角度±θで拡散される。
直線偏光B109が計測対象である炎102を通過する際、直線偏光B109は観測面D103に平行な方向に所定の散乱角度±θで拡散される。
散乱角度±θの一方の側+θには、第一偏光カメラ111が設置される。第一偏光カメラ111は、第一光源104の光の波長405nmのみを透過する第一色フィルタ112を通じて、第一光源104の光の強度を検出する。
また、散乱角度±θの他方の側-θには、第二偏光カメラ113が設置される。第二偏光カメラ113は、第二光源105の光の波長488nmのみを透過する第二色フィルタ114を通じて、第二光源105の光の強度を検出する。
なお、散乱角度±θの絶対値|θ|は、概ね30°~80°および100°~150°程度で設定が可能である。理想的には、60°~80°および100°~120°の範囲が好ましい。
なお、10nm程度の粒子の場合、90°は特異点である。90°にすると、第二散乱光強度がゼロとなり計測できなくなる。よって、90°を避け、かつ0°と180°に近すぎない位置が好適である。
また、散乱角度±θの他方の側-θには、第二偏光カメラ113が設置される。第二偏光カメラ113は、第二光源105の光の波長488nmのみを透過する第二色フィルタ114を通じて、第二光源105の光の強度を検出する。
なお、散乱角度±θの絶対値|θ|は、概ね30°~80°および100°~150°程度で設定が可能である。理想的には、60°~80°および100°~120°の範囲が好ましい。
なお、10nm程度の粒子の場合、90°は特異点である。90°にすると、第二散乱光強度がゼロとなり計測できなくなる。よって、90°を避け、かつ0°と180°に近すぎない位置が好適である。
[偏光カメラ]
図2を参照して、偏光カメラ201の構成と、後述する情報処理装置115にて使用するデータの種類を説明する。
図2は、粒子群計測装置101にて使用される偏光カメラ201の内部構成と、使用する測定値を示す概略図である。
偏光カメラ201は例えば648×488ピクセルの画素の撮像素子を有する。そして、この撮像素子には、各々の撮像ピクセルに微小偏光板202が設けられている。
図2を参照して、偏光カメラ201の構成と、後述する情報処理装置115にて使用するデータの種類を説明する。
図2は、粒子群計測装置101にて使用される偏光カメラ201の内部構成と、使用する測定値を示す概略図である。
偏光カメラ201は例えば648×488ピクセルの画素の撮像素子を有する。そして、この撮像素子には、各々の撮像ピクセルに微小偏光板202が設けられている。
微小偏光板202には、横方向の偏光、右斜め方向の偏光、縦方向の偏光、左斜め方向の偏光の、4種類の偏光フィルタが各々の撮像ピクセルに整列して設けられている。そして、偏光カメラ201は、各々の偏光に対応した画像データを出力する。
本発明の粒子群計測装置101は、縦方向の偏光の画像データD203及び横方向の偏光の画像データD204(324×244ピクセル)を使用し、右斜め方向の偏光の画像データD205及び左斜め方向の偏光の画像データD206は使用しない。
本発明の粒子群計測装置101は、縦方向の偏光の画像データD203及び横方向の偏光の画像データD204(324×244ピクセル)を使用し、右斜め方向の偏光の画像データD205及び左斜め方向の偏光の画像データD206は使用しない。
図1に戻って、粒子群計測装置101の説明を続ける。
第一偏光カメラ111と第二偏光カメラ113は、パソコン等よりなる情報処理装置115に接続される。情報処理装置115は、後述する演算処理を行うことで、所定の瞬間における炎102に含まれるすす、すなわち粒子群の、屈折率、標準偏差、平均粒径及び粒子数を推定演算する。
第一偏光カメラ111と第二偏光カメラ113は、パソコン等よりなる情報処理装置115に接続される。情報処理装置115は、後述する演算処理を行うことで、所定の瞬間における炎102に含まれるすす、すなわち粒子群の、屈折率、標準偏差、平均粒径及び粒子数を推定演算する。
[情報処理装置115]
図3は、情報処理装置115のハードウェア構成を示すブロック図である。
情報処理装置115は、バス301に接続された、CPU302、ROM303、RAM304、表示部305、操作部306、不揮発性ストレージ307、USB等のシリアルインターフェース(以下「シリアルI/F」と略)308を備える。
シリアルI/F308には、第一偏光カメラ111と第二偏光カメラ113が接続されている。
図3は、情報処理装置115のハードウェア構成を示すブロック図である。
情報処理装置115は、バス301に接続された、CPU302、ROM303、RAM304、表示部305、操作部306、不揮発性ストレージ307、USB等のシリアルインターフェース(以下「シリアルI/F」と略)308を備える。
シリアルI/F308には、第一偏光カメラ111と第二偏光カメラ113が接続されている。
図4は、情報処理装置115のソフトウェア機能を示すブロック図である。
第一偏光カメラ111は、第一光源104が出力する紫色レーザに由来する縦偏光強度値である計測第一波長第一散乱光強度データ(I1λ1)と、横偏光強度値である計測第一波長第二散乱光強度データ(I2λ1)を出力する。
第二偏光カメラ113は、第二光源105が出力する青色レーザに由来する縦偏光強度値である計測第二波長第一散乱光強度データ(I1λ2)と、横偏光強度値である計測第二波長第二散乱光強度データ(I2λ2)を出力する。
第一偏光カメラ111は、第一光源104が出力する紫色レーザに由来する縦偏光強度値である計測第一波長第一散乱光強度データ(I1λ1)と、横偏光強度値である計測第一波長第二散乱光強度データ(I2λ1)を出力する。
第二偏光カメラ113は、第二光源105が出力する青色レーザに由来する縦偏光強度値である計測第二波長第一散乱光強度データ(I1λ2)と、横偏光強度値である計測第二波長第二散乱光強度データ(I2λ2)を出力する。
各々がスカラ値である計測第一波長第一散乱光強度データ(I1λ1)、計測第一波長第二散乱光強度データ(I2λ1)、計測第二波長第一散乱光強度データ(I1λ2)及び計測第二波長第二散乱光強度データ(I2λ2)は、距離極小値演算部401に入力される。
距離極小値演算部401は、散乱光強度理論値テーブル402を読み込み、計測第一波長第一散乱光強度データ(I1λ1)、計測第一波長第二散乱光強度データ(I2λ1)、計測第二波長第一散乱光強度データ(I1λ2)及び計測第二波長第二散乱光強度データ(I2λ2)に最も近いレコードを探し出す。そして、距離極小値演算部401は、最も近いレコードに記憶されている、粒子群の屈折率、標準偏差、平均粒径及び粒子数を出力する。
距離極小値演算部401は、散乱光強度理論値テーブル402を読み込み、計測第一波長第一散乱光強度データ(I1λ1)、計測第一波長第二散乱光強度データ(I2λ1)、計測第二波長第一散乱光強度データ(I1λ2)及び計測第二波長第二散乱光強度データ(I2λ2)に最も近いレコードを探し出す。そして、距離極小値演算部401は、最も近いレコードに記憶されている、粒子群の屈折率、標準偏差、平均粒径及び粒子数を出力する。
露光制御部403は、第一偏光カメラ111と第二偏光カメラ113に対し、同時にシャッターパルスを出力すると共に、撮影に必要な露光時間を設定する。図4では省略しているが、露光制御部403は、外部から得られる所定の制御信号を受けて、第一偏光カメラ111と第二偏光カメラ113に対するシャッターパルスを出力する。
ここで、外部から得られる所定の制御信号とは、例えば、不図示のエンジンモデル等から得られるタイミングパルスである。露光制御部403は、制御信号に所定の時間遅延を与えたり、露光時間を厳密に制御することで、エンジンの燃焼サイクルにおける所望の瞬間のすすの状態を計測することを可能とする。
ここで、外部から得られる所定の制御信号とは、例えば、不図示のエンジンモデル等から得られるタイミングパルスである。露光制御部403は、制御信号に所定の時間遅延を与えたり、露光時間を厳密に制御することで、エンジンの燃焼サイクルにおける所望の瞬間のすすの状態を計測することを可能とする。
[散乱光強度理論値テーブル402]
図5は、散乱光強度理論値テーブル402のフィールド構成を示す表である。
散乱光強度理論値テーブル402は、第一波長第一散乱光強度フィールド、第一波長第二散乱光強度フィールド、第二波長第一散乱光強度フィールド、第二波長第二散乱光強度フィールド、屈折率フィールド、標準偏差フィールド、平均粒径フィールド、粒子数フィールドを有する。
図5は、散乱光強度理論値テーブル402のフィールド構成を示す表である。
散乱光強度理論値テーブル402は、第一波長第一散乱光強度フィールド、第一波長第二散乱光強度フィールド、第二波長第一散乱光強度フィールド、第二波長第二散乱光強度フィールド、屈折率フィールド、標準偏差フィールド、平均粒径フィールド、粒子数フィールドを有する。
第一波長第一散乱光強度フィールドには、第一波長第一散乱光強度(I1λ1)の理論値が格納される。第一波長第二散乱光強度フィールドには、第一波長第二散乱光強度(I2λ1)の理論値が格納される。第二波長第一散乱光強度フィールドには、第二波長第一散乱光強度(I1λ2)の理論値が格納される。第二波長第二散乱光強度フィールドには、第二波長第二散乱光強度(I2λ2)理論値が格納される。
すなわち、これら散乱光強度理論値のフィールドは、それぞれ第一偏光カメラ111及び第二偏光カメラ113が出力する同名のデータと同じものであり、後述する予備演算処理によって想定される粒子群の理論値(スカラ値)が格納される。
すなわち、これら散乱光強度理論値のフィールドは、それぞれ第一偏光カメラ111及び第二偏光カメラ113が出力する同名のデータと同じものであり、後述する予備演算処理によって想定される粒子群の理論値(スカラ値)が格納される。
屈折率フィールドには、後述する予備演算処理によって算出された、想定される粒子群の屈折率(スカラ値)が格納される。標準偏差フィールドには、後述する予備演算処理によって算出された、想定される粒子群の標準偏差(スカラ値)が格納される。
平均粒径フィールドには、後述する予備演算処理によって算出された、想定される粒子群の平均粒径(スカラ値)が格納される。粒子数フィールドには、後述する予備演算処理によって算出された、想定される粒子群の粒子数(スカラ値)が格納される。
平均粒径フィールドには、後述する予備演算処理によって算出された、想定される粒子群の平均粒径(スカラ値)が格納される。粒子数フィールドには、後述する予備演算処理によって算出された、想定される粒子群の粒子数(スカラ値)が格納される。
[粒子群のモデル]
図6は、散乱光強度理論値テーブル402に記録されるレコードによって表現される粒子群のモデルを示すグラフである。
様々な研究等によって、自然現象に由来して発生する、粒径が分散している微粒子の粒子群は、図6に示すように、横軸を対数目盛とするガウス曲線に概ね一致することが知られている。なお、図6において、横軸は対数目盛による粒径であり、縦軸は粒子の数(出現頻度)である。
図6は、散乱光強度理論値テーブル402に記録されるレコードによって表現される粒子群のモデルを示すグラフである。
様々な研究等によって、自然現象に由来して発生する、粒径が分散している微粒子の粒子群は、図6に示すように、横軸を対数目盛とするガウス曲線に概ね一致することが知られている。なお、図6において、横軸は対数目盛による粒径であり、縦軸は粒子の数(出現頻度)である。
ガウス曲線、つまり正規分布は、平均と標準偏差でグラフの形態が一意に定まる。そこで、平均粒径、標準偏差、個数、屈折率の4パラメータを定めて、第一光源104が出力する紫色レーザの波長、第二光源105が出力する青色レーザの波長、第一偏光カメラ111及び第二偏光カメラ113が設置される、光軸に対する角度θを与えて計算を行うことにより、第一波長第一散乱光強度(I1λ1)、第一波長第二散乱光強度(I2λ1)、第二波長第一散乱光強度(I1λ2)及び第二波長第二散乱光強度(I2λ2)の理論値を算出することができる。
つまり、第一波長第一散乱光強度(I1λ1)、第一波長第二散乱光強度(I2λ1)、第二波長第一散乱光強度(I1λ2)及び第二波長第二散乱光強度(I2λ2)の理論値は、屈折率、標準偏差、平均粒径、粒子数を探索するための検索キーである。これら検索キーとなる理論値と、偏光カメラで実測した値との類似度を計算して、最も類似するレコードを、計測した粒子群のパラメータ群に概ね合致するものとして推定する。
類似度の計算では、理論値と実測値との距離が計算される。すなわち、距離極小値演算部401は、以下に示すように、各パラメータ毎に差の二乗を加算して距離DSを算出し、距離DSの値が最も小さいレコードを探す。
類似度の計算では、理論値と実測値との距離が計算される。すなわち、距離極小値演算部401は、以下に示すように、各パラメータ毎に差の二乗を加算して距離DSを算出し、距離DSの値が最も小さいレコードを探す。
距離DS=
(第一波長第一散乱光強度理論値-計測第一波長第一散乱光強度データ)2+
(第一波長第二散乱光強度理論値-計測第一波長第二散乱光強度データ)2+
(第二波長第一散乱光強度理論値-計測第二波長第一散乱光強度データ)2+
(第二波長第二散乱光強度理論値-計測第二波長第二散乱光強度データ)2
(第一波長第一散乱光強度理論値-計測第一波長第一散乱光強度データ)2+
(第一波長第二散乱光強度理論値-計測第一波長第二散乱光強度データ)2+
(第二波長第一散乱光強度理論値-計測第二波長第一散乱光強度データ)2+
(第二波長第二散乱光強度理論値-計測第二波長第二散乱光強度データ)2
[粒径と偏光比]
図7は、ある波長の光における、粒子群の平均の粒径と偏光比の関係を示すグラフである。なお、図7及び図8の実線のグラフは青色のレーザ光、すなわち第二の光であり、後述する図8の点線のグラフは紫色のレーザ光、すなわち第一の光である。
標準偏差が異なると、平均粒径が同じ粒子群であっても、全く異なる偏光比を示す。このため、単一の光だけでは、ある偏光比に対して異なる粒径が該当してしまうため、粒子群を特定することができない。
図7は、ある波長の光における、粒子群の平均の粒径と偏光比の関係を示すグラフである。なお、図7及び図8の実線のグラフは青色のレーザ光、すなわち第二の光であり、後述する図8の点線のグラフは紫色のレーザ光、すなわち第一の光である。
標準偏差が異なると、平均粒径が同じ粒子群であっても、全く異なる偏光比を示す。このため、単一の光だけでは、ある偏光比に対して異なる粒径が該当してしまうため、粒子群を特定することができない。
図8は、2種類の波長の光における、粒子群の粒径と偏光比の関係を示すグラフである。
そこで、2種類の波長の光について、粒子群の粒径と偏光比の関係をグラフにプロットすると、波長が異なるために、ある偏光比に対して異なる粒径が該当しても、別の波長のグラフと重ね合わせることで、粒径の誤差が最も少ない値が目的の粒径であると推定することができる。
そこで、2種類の波長の光について、粒子群の粒径と偏光比の関係をグラフにプロットすると、波長が異なるために、ある偏光比に対して異なる粒径が該当しても、別の波長のグラフと重ね合わせることで、粒径の誤差が最も少ない値が目的の粒径であると推定することができる。
図7及び図8に示すグラフは、以下の式で理論散乱光強度を算出する。なお、以下の式において、fはミーの散乱理論の式、λは入射光波長、θは散乱角度、τλは露光時間、mは複素屈折率、σgは幾何標準偏差、Dgは幾何平均粒径、Cλは光学定数、nは粒子数である。
λ、θ、τλは既定値であり、m、σg、Dg、Cλ、nは未知数である。
λ1は第一の光であり、λ2は第二の光である。
λ、θ、τλは既定値であり、m、σg、Dg、Cλ、nは未知数である。
λ1は第一の光であり、λ2は第二の光である。

上式のうち、第2の式を第1の式で除すると、あるいは第4の式を第3の式で除すると、τλ、Cλ、nは消去される。この比は偏光比とよばれる。上式をそのまま用いるよりも変数の数が減り、かつm、σg、Dgの算出にも利用できる。しかしながら、すす粒子のような数nmから数十nm程度の粒子の場合、平均の粒径を変化させたときの偏光比の変化は非常に小さく、計測が困難となる問題がある。
ある粒径Dを有する1個の粒子は、ある入射光波長λに対し、複素屈折率m、光学定数Cλを以て、散乱角度θに所定の強度の散乱光を出力する。粒子は1個だけではないので、粒子の数だけ散乱光の強度が累積加算される。また、粒子の粒径も1個だけではないので、異なる粒径の粒子においても同様に計算する必要がある。その粒子の粒径の出現頻度が、対数目盛による正規分布に概ね従う。
粒径の平均値と粒径の標準偏差、粒子数がわかれば、粒子群が出力する散乱光の強度を算出することができる。
粒径の平均値と粒径の標準偏差、粒子数がわかれば、粒子群が出力する散乱光の強度を算出することができる。
そこで、予め入射光波長λと散乱角度θと露光時間τλを固定しておき、複素屈折率m、幾何標準偏差σg、幾何平均粒径Dg、光学定数Cλを様々に変化させながら、第一波長第一散乱光強度理論値(I1λ1)、第一波長第二散乱光強度理論値(I2λ1)、第二波長第一散乱光強度理論値(I1λ2)、第二波長第二散乱光強度理論値(I2λ2)を演算することが、予備演算処理である。そして、予備演算処理の演算結果をテーブルに記録したものが、散乱光強度理論値テーブル402である。
予備演算処理では、散乱角度θを適切な値に定めている。したがって、粒子群計測装置101が実際に計測を行う際には、第一偏光カメラ111及び第二偏光カメラ113は、計測対象物に対して散乱角度±θを以て配置されていなければならない。
[実験]
図9は、従来技術であるPAMS法と本発明の実施形態に係る粒子群計測装置101とで、炎のすすを計測する実験を行った実験結果のグラフである。グラフの形態は図6とほぼ同じであり、横軸は対数目盛による粒径であり、縦軸は正規化粒子密度(出現頻度)である。
図9は、従来技術であるPAMS法と本発明の実施形態に係る粒子群計測装置101とで、炎のすすを計測する実験を行った実験結果のグラフである。グラフの形態は図6とほぼ同じであり、横軸は対数目盛による粒径であり、縦軸は正規化粒子密度(出現頻度)である。
実験は、ブタンガスの炎102を計測対象とした。
従来技術であるPAMS法とは、Portable aerosol mobility spectrometerの略で、発生源の粒子をパイプの横に開けた採取口から直接採取して、ふるいをかけるように分級したのち各粒径の粒子数をカウントする方法である。なお、火炎中のすすが計測対象であるため、炎による酸化反応を凍結させるため、またすす粒子同士の凝集を抑制するため、パイプに窒素ガスを流通して、冷却と希釈を行いながらすすを採取した。
図9を見ると、PAMS法による実測結果のグラフの頂点P901と、本発明の実施形態にかかる粒子群計測装置101の推定演算結果のグラフの頂点P902における粒径が、概ね近似することがわかる。
従来技術であるPAMS法とは、Portable aerosol mobility spectrometerの略で、発生源の粒子をパイプの横に開けた採取口から直接採取して、ふるいをかけるように分級したのち各粒径の粒子数をカウントする方法である。なお、火炎中のすすが計測対象であるため、炎による酸化反応を凍結させるため、またすす粒子同士の凝集を抑制するため、パイプに窒素ガスを流通して、冷却と希釈を行いながらすすを採取した。
図9を見ると、PAMS法による実測結果のグラフの頂点P901と、本発明の実施形態にかかる粒子群計測装置101の推定演算結果のグラフの頂点P902における粒径が、概ね近似することがわかる。
本発明の実施形態では、粒子群計測装置101を開示した。
粒子群計測装置101は、予め予備演算処理によって散乱光強度理論値テーブル402を作成しておく。そして、予備演算処理の時点で定めた散乱角度±θの位置に、第一偏光カメラ111、第二偏光カメラ113を設置する。
粒子群計測装置101は、予め予備演算処理によって散乱光強度理論値テーブル402を作成しておく。そして、予備演算処理の時点で定めた散乱角度±θの位置に、第一偏光カメラ111、第二偏光カメラ113を設置する。
距離極小値演算部401は、第一偏光カメラ111から出力される計測第一波長第一散乱光強度(I1λ1)、計測第一波長第二散乱光強度(I2λ1)と、第二偏光カメラ113から出力される計測第二波長第一散乱光強度(I1λ2)、計測第二波長第二散乱光強度(I2λ2)に最も類似度が高い、散乱光強度理論値テーブル402のレコードを特定し、屈折率m、標準偏差σg、平均粒径Dg、粒子数nを出力する。
粒子群計測装置101は、非接触かつ極短時間で、粒子群の屈折率m、標準偏差σg、平均粒径Dg、粒子数nを推定演算することが可能である。
粒子群計測装置101は、非接触かつ極短時間で、粒子群の屈折率m、標準偏差σg、平均粒径Dg、粒子数nを推定演算することが可能である。
以上、本発明の実施形態について説明したが、本発明は上記実施形態に限定されるものではなく、請求の範囲に記載した本発明の要旨を逸脱しない限りにおいて、他の変形例、応用例を含む。
101…粒子群計測装置、102…炎、104…第一光源、105…第二光源、106…光合成体、107…偏光フィルタ、108…凸レンズ、110…ビームストップ、111…第一偏光カメラ、112…第一色フィルタ、113…第二偏光カメラ、114…第二色フィルタ、115…情報処理装置、201…偏光カメラ、202…微小偏光板、301…バス、302…CPU、303…ROM、304…RAM、305…表示部、306…操作部、307…不揮発性ストレージ、308…シリアルインターフェース、401…距離極小値演算部、402…散乱光強度理論値テーブル、403…露光制御部
Claims (4)
- 計測対象を通過する光路に第一の波長を有する第一の光を照射する第一光源と、
前記光路に、前記第一の波長と異なる第二の波長を有する第二の光を照射する第二光源と、
前記光路から、前記計測対象を中心として、前記光路を含む観測面に平行な方向に予め定められた散乱角度+θの位置に配置される、前記第一光源の光を受光して第一の散乱光強度データを出力する出力する第一偏光カメラと、
前記光路から、前記計測対象を中心として、前記観測面に平行な方向に予め定められた散乱角度-θの位置に配置される、前記第二光源の光を受光して、第二の散乱光強度データを出力する第二偏光カメラと、
想定される粒子群における、散乱光強度理論値が格納される光強度フィールドと、屈折率が格納される屈折率フィールドと、標準偏差が格納される標準偏差フィールドと、平均粒径が格納される平均粒径フィールドと、粒子数が格納される粒子数フィールドとを有する散乱光強度理論値テーブルと、
前記散乱光強度データと散乱光強度理論値とを比較して、最も類似度が高いレコードから屈折率、標準偏差、平均粒径、粒子数を出力する距離極小値演算部と
を具備する、粒子群計測装置。 - 前記第一偏光カメラが出力する前記第一の散乱光強度データは、前記第一の光に由来する縦偏光強度値である計測第一波長第一散乱光強度データと、前記第一の光に由来する横偏光強度値である計測第一波長第二散乱光強度データであり、
前記第二偏光カメラが出力する前記第二の散乱光強度データは、前記第二の光に由来する縦偏光強度値である計測第二波長第一散乱光強度データと、前記第二の光に由来する横偏光強度値である計測第二波長第二散乱光強度データである、
請求項1に記載の粒子群計測装置。 - 前記光強度フィールドは、
前記計測第一波長第一散乱光強度データに対応する第一波長第一散乱光強度理論値が格納される第一波長第一散乱光強度フィールドと、
前記計測第一波長第二散乱光強度データに対応する第一波長第二散乱光強度理論値が格納される第一波長第二散乱光強度フィールドと、
前記計測第二波長第一散乱光強度データに対応する第二波長第一散乱光強度理論値が格納される第二波長第一散乱光強度フィールドと、
前記計測第二波長第二散乱光強度データに対応する第二波長第二散乱光強度理論値が格納される第二波長第二散乱光強度フィールドと
を有し、
前記距離極小値演算部は、前記計測第一波長第一散乱光強度データ、前記計測第一波長第二散乱光強度データ、前記計測第二波長第一散乱光強度データ及び前記計測第二波長第二散乱光強度データの入力を受けて、前記散乱光強度理論値テーブルの、前記第一波長第一散乱光強度理論値、前記第一波長第二散乱光強度理論値、前記第二波長第一散乱光強度理論値及び第二波長第二散乱光強度理論値と最も類似度が高いレコードを特定して、特定された前記レコードから前記屈折率、前記標準偏差、前記平均粒径、前記粒子数を出力する、
請求項2に記載の粒子群計測装置。 - 更に、
前記第一光源及び前記第二光源と前記計測対象との間に配置され、前記第一の光と前記第二の光を、前記観測面に対して45°の偏光を通過する偏光フィルタと
を具備する、請求項3に記載の粒子群計測装置。
Priority Applications (1)
| Application Number | Priority Date | Filing Date | Title |
|---|---|---|---|
| JP2020555622A JP7307497B2 (ja) | 2018-11-08 | 2019-11-08 | 粒子群計測装置 |
Applications Claiming Priority (2)
| Application Number | Priority Date | Filing Date | Title |
|---|---|---|---|
| JP2018210238 | 2018-11-08 | ||
| JP2018-210238 | 2018-11-08 |
Publications (1)
| Publication Number | Publication Date |
|---|---|
| WO2020096038A1 true WO2020096038A1 (ja) | 2020-05-14 |
Family
ID=70612083
Family Applications (1)
| Application Number | Title | Priority Date | Filing Date |
|---|---|---|---|
| PCT/JP2019/043850 Ceased WO2020096038A1 (ja) | 2018-11-08 | 2019-11-08 | 粒子群計測装置 |
Country Status (2)
| Country | Link |
|---|---|
| JP (1) | JP7307497B2 (ja) |
| WO (1) | WO2020096038A1 (ja) |
Cited By (3)
| Publication number | Priority date | Publication date | Assignee | Title |
|---|---|---|---|---|
| CN113075097A (zh) * | 2021-03-22 | 2021-07-06 | 厦门理工学院 | 一种基于散射光偏振检测的粒径测量方法、装置及设备 |
| WO2022270204A1 (ja) * | 2021-06-21 | 2022-12-29 | 富士フイルム株式会社 | 粒子の測定装置及び粒子の測定方法 |
| CN116793908A (zh) * | 2023-02-23 | 2023-09-22 | 合肥学院 | 一种基于偏振光能差的亚微米颗粒粒度测量方法及系统 |
Citations (5)
| Publication number | Priority date | Publication date | Assignee | Title |
|---|---|---|---|---|
| JPS5517000B2 (ja) * | 1971-07-01 | 1980-05-08 | ||
| JPS5721042B2 (ja) * | 1976-11-05 | 1982-05-04 | ||
| JPH03163332A (ja) * | 1989-11-22 | 1991-07-15 | Mitsubishi Electric Corp | レーザビームによる微細粒子の粒径測定方法 |
| JPH09257683A (ja) * | 1996-03-26 | 1997-10-03 | Horiba Ltd | 散乱光検出器 |
| US20110026023A1 (en) * | 2009-07-31 | 2011-02-03 | GENERAL IMPIANTI S.r.I.. | Method and apparatus for determining size and composition of a particulate matter in a fume flow |
Family Cites Families (1)
| Publication number | Priority date | Publication date | Assignee | Title |
|---|---|---|---|---|
| JP5517000B2 (ja) | 2009-10-16 | 2014-06-11 | 国立大学法人群馬大学 | 粒径計測装置、及び粒径計測方法 |
-
2019
- 2019-11-08 WO PCT/JP2019/043850 patent/WO2020096038A1/ja not_active Ceased
- 2019-11-08 JP JP2020555622A patent/JP7307497B2/ja active Active
Patent Citations (5)
| Publication number | Priority date | Publication date | Assignee | Title |
|---|---|---|---|---|
| JPS5517000B2 (ja) * | 1971-07-01 | 1980-05-08 | ||
| JPS5721042B2 (ja) * | 1976-11-05 | 1982-05-04 | ||
| JPH03163332A (ja) * | 1989-11-22 | 1991-07-15 | Mitsubishi Electric Corp | レーザビームによる微細粒子の粒径測定方法 |
| JPH09257683A (ja) * | 1996-03-26 | 1997-10-03 | Horiba Ltd | 散乱光検出器 |
| US20110026023A1 (en) * | 2009-07-31 | 2011-02-03 | GENERAL IMPIANTI S.r.I.. | Method and apparatus for determining size and composition of a particulate matter in a fume flow |
Cited By (5)
| Publication number | Priority date | Publication date | Assignee | Title |
|---|---|---|---|---|
| CN113075097A (zh) * | 2021-03-22 | 2021-07-06 | 厦门理工学院 | 一种基于散射光偏振检测的粒径测量方法、装置及设备 |
| WO2022270204A1 (ja) * | 2021-06-21 | 2022-12-29 | 富士フイルム株式会社 | 粒子の測定装置及び粒子の測定方法 |
| JPWO2022270204A1 (ja) * | 2021-06-21 | 2022-12-29 | ||
| JP7834751B2 (ja) | 2021-06-21 | 2026-03-24 | 富士フイルム株式会社 | 粒子の測定装置及び粒子の測定方法 |
| CN116793908A (zh) * | 2023-02-23 | 2023-09-22 | 合肥学院 | 一种基于偏振光能差的亚微米颗粒粒度测量方法及系统 |
Also Published As
| Publication number | Publication date |
|---|---|
| JP7307497B2 (ja) | 2023-07-12 |
| JPWO2020096038A1 (ja) | 2021-09-24 |
Similar Documents
| Publication | Publication Date | Title |
|---|---|---|
| JP5517000B2 (ja) | 粒径計測装置、及び粒径計測方法 | |
| Axelsson et al. | Laser-induced incandescence for soot particle size and volume fraction measurements using on-line extinction calibration | |
| Ault et al. | Atmospheric aerosol chemistry: Spectroscopic and microscopic advances | |
| AU2013327811B2 (en) | One-dimensional global rainbow measurement device and measurement method | |
| JP7307497B2 (ja) | 粒子群計測装置 | |
| CN103959039A (zh) | 用于颗粒大小和浓度测量的检测方案 | |
| US11415500B2 (en) | Particulate observation device and particulate observation method | |
| CN111398108B (zh) | 一种基于双光束干涉粒子成像技术测量不透明球形微颗粒粒径的方法和装置 | |
| CN105866013A (zh) | 基于两幅激光干涉成像离焦干涉图的球形粒子判别方法 | |
| Huang et al. | Key Technologies of Intelligentized Welding Manufacturing | |
| CN117629899A (zh) | 基于悬浮光镊的纳米颗粒消光截面原位测量方法及装置 | |
| Giri et al. | The color of aerosol particles | |
| Chen et al. | Digital imaging holography and pyrometry of aluminum drop combustion in solid propellant plumes | |
| Mariani et al. | Single particle extinction and scattering allows novel optical characterization of aerosols | |
| Chen et al. | Quality control in workshop production of NdFeB magnetic materials using an LIBS rare earth magnet instrument | |
| CN212432900U (zh) | 一种测量不透明球形微颗粒粒径的装置 | |
| CN109187727A (zh) | 分光瞳差动共焦Raman-LIBS-质谱探测的飞秒激光加工监测方法 | |
| Li et al. | Real-time dynamic measurement of scattering characteristics of optically-levitated fly ash interacting with water-soluble ammonium sulfate aerosol | |
| Cavicchi et al. | Measuring the size of oil droplets in a flow cytometer using Mie resonances: A possible size calibration ladder for 0.5–6 μm | |
| RU2189027C1 (ru) | Способ определения размеров дисперсных частиц | |
| CN105699357A (zh) | 一种基于二维拉曼光谱的颗粒粒度测量方法 | |
| Kozadaev | Diagnostics of aqueous colloids of noble metals by extinction modeling based on mie theory | |
| Albrecht et al. | Optical technique for the measurement of turbulent spectra using the photorefractive properties of BaTiO3 | |
| Huang et al. | Particle sizing and velocity measurement of microspheres from the analysis of polarization of the scattered light | |
| US9562862B2 (en) | Optical and chemical analytical systems and methods |
Legal Events
| Date | Code | Title | Description |
|---|---|---|---|
| 121 | Ep: the epo has been informed by wipo that ep was designated in this application |
Ref document number: 19882920 Country of ref document: EP Kind code of ref document: A1 |
|
| ENP | Entry into the national phase |
Ref document number: 2020555622 Country of ref document: JP Kind code of ref document: A |
|
| NENP | Non-entry into the national phase |
Ref country code: DE |
|
| 122 | Ep: pct application non-entry in european phase |
Ref document number: 19882920 Country of ref document: EP Kind code of ref document: A1 |