WO2020035935A1 - Plcユニット、方法、及びプログラム - Google Patents
Plcユニット、方法、及びプログラム Download PDFInfo
- Publication number
- WO2020035935A1 WO2020035935A1 PCT/JP2018/030474 JP2018030474W WO2020035935A1 WO 2020035935 A1 WO2020035935 A1 WO 2020035935A1 JP 2018030474 W JP2018030474 W JP 2018030474W WO 2020035935 A1 WO2020035935 A1 WO 2020035935A1
- Authority
- WO
- WIPO (PCT)
- Prior art keywords
- data
- unit
- plc
- information
- control
- Prior art date
- Legal status (The legal status is an assumption and is not a legal conclusion. Google has not performed a legal analysis and makes no representation as to the accuracy of the status listed.)
- Ceased
Links
Images







Classifications
-
- G—PHYSICS
- G05—CONTROLLING; REGULATING
- G05B—CONTROL OR REGULATING SYSTEMS IN GENERAL; FUNCTIONAL ELEMENTS OF SUCH SYSTEMS; MONITORING OR TESTING ARRANGEMENTS FOR SUCH SYSTEMS OR ELEMENTS
- G05B19/00—Program-control systems
- G05B19/02—Program-control systems electric
- G05B19/04—Program control other than numerical control, i.e. in sequence controllers or logic controllers
- G05B19/05—Programmable logic controllers, e.g. simulating logic interconnections of signals according to ladder diagrams or function charts
Definitions
- the present invention relates to a PLC unit, a method, and a program.
- Industrial robots and manufacturing equipment used in factories are equipped with sensors for detecting their states and control devices such as motors for controlling their operations.
- the control device is regularly maintained by an administrator.
- the control device that is determined to have deteriorated or deteriorated in accuracy is replaced by an administrator.
- the periodic maintenance and the replacement of the control device are performed until the life of the industrial robot, the manufacturing device, and the like in which the control device is arranged comes to an end.
- the longevity of industrial robots, manufacturing equipment, etc. is ten years or more. For this reason, it is necessary to perform regular maintenance and replacement of the control device over a long span, which requires an administrator's labor and cost. Therefore, in order to increase the efficiency of regular maintenance and replacement of control devices over a long span, demands for solutions for monitoring control devices have increased in recent years.
- a host system such as a PLC (Programmable Logic Controller) unit for connecting the control device and a SCADA (Supervisory Control Control And Data Data Acquisition) for collecting and analyzing data from the control device are linked.
- Monitoring and control system By arranging this monitoring and control system in a factory to monitor control devices, it is possible to reduce the labor and cost of an administrator.
- Patent Document 1 discloses a technique in which a data collection unit and a built-in database are mounted on a PLC unit, and the data collection performed by the monitoring control system is replaced by the PLC unit, thereby reducing the load on the monitoring control system. Is disclosed.
- the present invention solves these problems, and an object of the present invention is to provide a PLC unit that can efficiently collect and analyze data from a device to be controlled.
- a PLC unit includes a control unit and an information processing unit.
- the control unit includes a collection unit that collects PLC data indicating the operation states of the plurality of control target devices, and a control storage unit that stores the collected PLC data.
- the information processing unit manages based on the analysis storage area for storing management data for monitoring the operation state of the control target device and the link setting information for linking a part of the PLC data with the management data.
- a data extraction unit that extracts PLC data linked to the data from the control storage unit and stores the data in the analysis storage area, and based on the management data linked to the PLC data stored in the analysis storage area.
- a monitoring control unit that analyzes and monitors the operation state of the control target device.
- the PLC unit a part of the PLC data indicating the operation state of the plurality of control target devices is extracted from the control storage unit, and the extracted PLC data is used to monitor the operation state of the control target device. Since the monitoring control unit analyzes based on the management data and can monitor the operation state of the controlled device, data can be efficiently collected from the controlled device and analyzed.
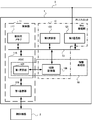
- FIG. 1 shows a configuration of a monitoring control system according to Embodiment 1.
- FIG. 2 shows a configuration of a PLC unit according to the first embodiment.
- FIG. 3 shows a configuration of a terminal according to the first embodiment.
- 1 is a block diagram showing an example of a hardware configuration of a PLC unit according to an embodiment.
- FIG. 2 is a block diagram illustrating an example of a hardware configuration of a terminal according to the first embodiment.
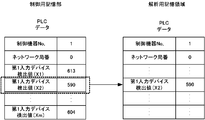
- FIG. 4 is a diagram showing a table of PLC data, management data, and link information stored in an analysis processing area of an information processing storage unit of a PLC unit according to the first embodiment.
- FIG. 4 is a diagram showing a table of PLC data stored in a control storage unit of the PLC unit according to the first embodiment.
- FIG. 6 is a diagram showing an example of data extraction from PLC data stored in the control storage unit to PLC data stored in the analysis storage area of the information processing storage unit according to the first embodiment.
- FIG. 4 is a diagram showing an example of a setting screen of an engineering tool according to the first embodiment.
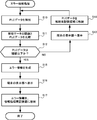
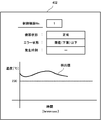
- Flowchart of error detection processing as an example of data output processing to a user according to the first embodiment Output screen when control device status is normal in Embodiment 1
- FIG. 10 is a diagram illustrating an example of a setting screen of an engineering tool according to the second embodiment. Flowchart of life notification process according to Embodiment 2
- the PLC unit can perform integrated monitoring and control including collection and analysis of data from the control device by itself. This makes it possible to improve the efficiency of maintenance and maintenance of control devices without introducing a monitoring control system.
- FIG. 1A shows a PLC unit 1 capable of executing integrated monitoring and control, and a terminal 4 connected to the PLC unit 1 via a network 3.
- the PLC unit 1 and the terminal 4 are included in the monitoring control system 100.
- the PLC unit 1 can be connected to n control devices 2a,..., 2n to be controlled.
- the control devices 2a,..., 2n are collectively referred to as a control device 2 below.
- the control device 2 is a device provided in a production device such as a motor and an arm.
- the control device 2 is an example of a device to be controlled according to the present invention.
- the terminal 4 includes a display unit 45.
- the display unit 45 displays a setting screen of the engineering tool 400 in which management data is set in the PLC unit 1 by a user, a data output screen for presenting the state of the control device 2 to the user, and the like.
- the terminal 4 includes an engineering tool 400.
- FIG. 1B shows the configuration of the PLC unit 1.
- the PLC unit 1 includes an information processing unit 10 that monitors and controls the control device 2, a control unit 11 that transmits and receives various data to and from the information processing unit 10, and a Web function unit 12 that is connected to the network 3.
- the network 3 is, for example, the Internet, a WAN (Wide Area Network), a LAN (Local Area Network) connecting a plurality of factories serving as production sites, and the like.
- the information processing unit 10 includes a monitoring control unit 101 that monitors and controls the control device 2, an information processing storage unit 102 including an analysis storage area 103 that stores data used by the monitoring control unit 101, and a control unit that will be described later.
- a data extraction unit 104 for transmitting and receiving data to and from the control storage unit 112 of the unit 11 is provided.
- the monitoring control unit 101 is a control unit that can monitor and control the control device 2 connected to the PLC unit 1.
- the monitoring control unit 101 periodically collects data from the control device 2 via the control unit 11 described below.
- the monitoring control unit 101 stores the collected data in the analysis storage area 103 of the information processing storage unit 102. Further, the monitoring control unit 101 analyzes the data stored in the analysis storage area 103.
- the monitoring control unit 101 stores the analysis result in the information processing storage unit 102. In the present invention, it is described that data is stored in a storage unit such as the information processing storage unit 102 and the analysis storage region 103. May be used.
- the information processing storage unit 102 is a storage unit that includes an analysis storage area 103 that stores data of the control device 2 collected by the monitoring control unit 101.
- the information processing storage unit 102 includes management data in which set values set by the user in advance, error information of the control device 2, data analysis results of the monitoring control unit 101, and an engineering tool 400 for setting data. And other programs are stored.
- the information processing storage unit 102 also stores association setting information in which some specific PLC data among the PLC data that is data relating to the control device 2 and management data are associated.
- the link setting information and the management data are data that can be set in advance by the user using the engineering tool 400. The method of setting data using the engineering tool 400 will be described later in detail.
- the data extraction unit 104 links the management data to the management data based on the link setting information stored in the information processing storage unit 102 from the PLC data stored in the control storage unit 112 of the control unit 11 described later.
- the data of the obtained PLC data is extracted.
- the extracted PLC data is stored in the analysis storage area 103 of the information processing storage unit 102.
- the control unit 11 includes an execution unit 111 that executes a process of collecting data from the control device 2, and a control storage unit 112 that stores a control program and various data.
- the execution unit 111 reads out and executes the control program stored in the control storage unit 112.
- This control program is a program for causing the execution unit 111 to execute a process of periodically collecting data from each control device 2 connected to the PLC unit 1.
- the control storage unit 112 is a storage unit that stores the control program executed by the execution unit 111 and data collected from each control device 2 in the execution unit 111.
- the execution unit 111 is an example of a collection unit according to the present invention.
- the Web function unit 12 is an interface for communicably connecting a terminal at the end of the network 3 to the PLC unit 1.
- the Web function unit 12 extracts the data of the control device 2 stored in the analysis storage area 103 of the information processing storage unit 102 and transmits the data to the terminal 4 via the network 3.
- the Web function unit 12 converts the data into a data format for displaying a graph.
- the data format for displaying the graph is a data format that can display a graph on a browser. Thereby, the user can see the data displayed in the graph on the browser developed on the display unit 45 of the terminal 4.
- the information processing unit 10 is configured on a software basis. Specifically, the monitoring control unit 101 and the data extraction unit 104 of the information processing unit 10 perform their functions as programs executed by an arithmetic processing device such as an MPU (Micro-processing Unit) or a CPU (Central Processing Unit). Be composed. In particular, SCADA can be used for the monitoring control unit 101.
- the control unit 11 is configured on a hardware basis. Specifically, an ASIC (Application ⁇ Specific ⁇ Integrated ⁇ Circuit) can be used as the execution unit 111 of the control unit 11. The hardware configuration of the PLC unit 1 will be described later in detail.
- SCADA can be used for the monitoring control unit 101 in this embodiment.
- An ASIC can be used for the execution unit 111 of the control unit 11. That is, the PLC unit 1 in this embodiment includes the ASIC provided in the conventional PLC unit and the SCADA which is a higher-order system cooperating with the conventional PLC unit. Therefore, the data format of data handled by SCADA and ASIC can be the same data format. As a result, the time required for data format conversion can be reduced. For this reason, it is possible to reduce the delay time until the feedback to the user.
- the terminal 4 includes a communication unit 41 for connecting to the network 3, a terminal storage unit 42 for storing data and information, an input unit 43 for inputting data and information, and a processing unit for processing data and information. And a display unit 45 for displaying data, information, and the like.
- the communication unit 41 is a communication interface for connecting to the network 3.
- the terminal 4 receives error data, life data, and the like transmitted from the PLC unit 1 by the communication unit 41 via the network 3.
- the terminal storage unit 42 stores a browser, a program for executing processing such as data output to a user, various data used or set by this program, a GUI (Graphical User Interface) component for display, and the like. I have.
- the terminal storage unit 42 also stores error data, life data, and the like received from the PLC unit 1 via the network 3.
- the input unit 43 allows the user to input various data, setting information, and the like.
- the processing unit 44 includes a terminal control unit 441 that executes a program, and an image generation unit 442 that generates an image to be displayed on the display unit 45.
- the terminal control unit 441 reads and executes a program stored in the terminal storage unit 42.
- the terminal control unit 441 executes processing on a program based on various data, setting information, and the like input from the input unit 43.
- the image generation unit 442 generates an image of a display screen using a processing result of the program executed by the terminal control unit 441, various data stored in the terminal storage unit 42, a GUI component for display, and the like. I do.
- the display unit 45 displays the image of the display screen generated by the image generation unit 442.
- FIG. 2 shows an example of a hardware configuration of the PLC unit 1 shown in FIG. 1B.
- the PLC unit 1 includes an auxiliary storage unit 106, a first operation unit 107, an ASIC 115, a first communication unit 116, a control memory 117, a second communication unit 121, and a second operation unit. And a part 122.
- the auxiliary storage unit 106, the ASIC 115, the first communication unit 116, the control memory 117, the second communication unit 121, and the second arithmetic unit 122 are mutually connected via the internal bus 13.
- the information processing unit 10 of the PLC unit 1 shown in FIG. 1B can be realized by the auxiliary storage unit 106 and the first calculation unit 107.
- the control unit 11 can be realized by the ASIC 115, the first communication unit 116, and the control memory 117.
- the Web function unit 12 can be realized by the second communication unit 121, the second calculation unit 122, and the auxiliary storage unit 106. Each component of the hardware constituting the PLC unit 1 will be described below.
- the auxiliary storage unit 106 is a storage unit for realizing the information processing storage unit 102 and the analysis storage area 103 illustrated in FIG. 1B.
- the auxiliary storage unit 106 stores a program for executing the functions of the monitoring control unit 101 and the data extraction unit 104.
- the auxiliary storage unit 106 includes an SD (Secure Digital) card, a flash memory, an EPROM (Erasable Programmable Read Only Only Memory), an EEPROM (Electrically Available Eraseable Programmable Read Only), and a nonvolatile semiconductor memory such as a volatile or non-volatile memory.
- the first arithmetic unit 107 is built in the ASIC 115 described later.
- the first calculation unit 107 executes a program stored in the auxiliary storage unit 106 to execute the functions of the monitoring control unit 101 and the data extraction unit 104 illustrated in FIG. 1B. That is, it is an arithmetic processing unit for realizing the functions of the monitoring control unit 101 and the data extraction unit 104.
- the first arithmetic unit 107 includes an arithmetic processing device such as an MPU and a CPU.
- the ASIC 115 is an arithmetic processing unit for realizing the execution unit 111 shown in FIG. 1B.
- the ASIC 115 performs a process of periodically collecting data from each control device 2.
- the first communication unit 116 is a communication interface for connecting the control device 2 and the PLC unit 1.
- the ASIC 115 collects data from each control device 2 via the first communication unit 116.
- the first communication unit 116 includes a cable for connecting to the control device 2, a port for inserting wiring, a connection terminal, and the like, and various communication interfaces.
- the control memory 117 is a storage unit for implementing the control storage unit 112 illustrated in FIG. 1B. Data of each control device 2 collected by the ASIC 115 is written in the control memory 117.
- the control memory 117 includes a non-volatile or volatile semiconductor memory to which data can be written at a high speed, such as a random access memory (RAM) or a flash memory.
- each control device 2 collected by the ASIC 115 is collected so as to be within a predetermined capacity for a certain period. Then, the collected data is stored in the control storage unit 112. If the capacity of the collected data exceeds a predetermined capacity, the data is overwritten in order from the oldest data.
- the auxiliary storage unit 106 is a storage unit for realizing the information processing storage unit 102 illustrated in FIG. 1B.
- the information processing storage unit 102 stores long-term data. That is, data to be newly written is added to the information processing storage unit 102 in addition to data that has already been written. For this reason, it is desirable that the storage element has a larger capacity than the control memory 117.
- the control memory 117 is configured by a mega-order storage element
- the auxiliary storage unit 106 be configured by a giga-order storage element.
- the second communication unit 121 is a communication interface for connecting the network 3 and the PLC unit 1.
- the second communication unit 121 corresponds to an interface for Ethernet (registered trademark), a network for the Internet or a WAN, or the like.
- the second calculation unit 122 is a calculation unit that controls communication of the second communication unit 121.
- the auxiliary storage unit 106 stores a program for realizing the function of the Web function unit 12 shown in FIG. 1B.
- the second calculation unit 122 reads a program for realizing the function of the Web function unit 12 from the auxiliary storage unit 106 and executes the program.
- the terminal 4 includes a processor 444, a memory 445, a display controller 446, an I / O (Input / Output) port 447, and an internal bus 448 in hardware.
- the processor 444, the memory 445, the display controller 446, and the I / O port 447 are interconnected via an internal bus 448.
- the processing unit 44 is realized by the processor 444, the memory 445, the display controller 446, the I / O port 447, and the internal bus 448.
- the processing unit 44 is connected to the terminal storage unit 42 via the internal bus 448.
- the processor 444 is an arithmetic processing device that reads a program stored in the terminal storage unit 42 into a memory 445 described below and executes the program.
- the processor 444 can implement the terminal control unit 441.
- the processor 444 includes an arithmetic processing device such as an MPU and a CPU.
- the memory 445 is a storage element in which the program stored in the terminal storage unit 42 is read by the processor 444.
- the memory 445 includes a non-volatile or volatile semiconductor memory to which data can be written at high speed, such as a random access memory (RAM) or a flash memory.
- the display controller 446 is a device that generates an image to be displayed on the display unit 45.
- the display controller 446 can realize the image generation unit 442 illustrated in FIG. 1C.
- the display controller 446 includes a video signal output device such as a video card, a GPU (Graphics Processing Unit), and a graphic board.
- the display unit 45 includes a display interface device such as an LCD (Liquid Crystal Display) and an organic EL (Electro-Luminescence) panel.
- the I / O port 447 is an interface for transmitting and receiving signals input to and output from the processing unit 44.
- the processing unit 44 is connected to the communication unit 41 and the input unit 43 via the I / O port 447.
- the communication unit 41 is a communication interface for connecting the network 3 and the terminal 4.
- the communication unit 41 includes an Ethernet (registered trademark), a network interface, and the like.
- the input unit 43 is a device that allows a user to input various data, setting information, and the like.
- the input unit 43 includes a keyboard, a mouse, a touch panel, and the like.
- FIG. 4A an example of the management data is shown in FIG. 4A.
- the operation state of the control device 2 is monitored, such as upper and lower thresholds that trigger an error detection, a device status indicating a device status such as abnormal or normal, and an error code indicating the content of the error.
- Data is included.
- the management data also includes a data collection cycle by the monitoring control unit 101 illustrated in FIG. 1B. This management data is put together with PLC data, which will be described in detail later, in the form of a table assigned to each control device 2. This will be specifically described.
- PLC data control device No. Is a device number arbitrarily assigned to each control device 2.
- This control device No. In each case, management data corresponding to each control device 2 is summarized in a table format.
- the management data and the PLC data are added to the analysis storage area 103 of the information processing storage unit 102 shown in FIG. That is, the management data and the PLC data are data that increases with time.
- the data content of the management data can be arbitrarily set by the user. Specifically, the user sets the data content of the management data using the engineering tool 400. The data content of the set management data is stored in the analysis storage area 103 of the information processing storage unit 102. Although not shown in FIG. 4A, the data collection cycle of the monitoring control unit 101 shown in FIG. 1B is set in the management data.
- FIG. 4B shows an example of the PLC data.
- the PLC data is data related to each control device 2 and the PLC unit 1.
- the data included in the PLC data includes, for example, a network station number set in each control device 2, data of a detection value of an input device such as a sensor and a switch provided in each control device 2, and each control device.
- the data includes timer value data of a timer device that counts an opening time of a valve provided in the device 2, an operating time of the motor, and the like.
- the PLC data includes the control device No., which is the device number of each control device 2. It is organized in the form of a table assigned to.
- This PLC data is stored in the control storage unit 112 shown in FIG. 1B.
- the data included in the PLC data is periodically collected from each control device 2 by the execution unit 111 of the control unit 11 illustrated in FIG. 1B.
- the data included in the PLC data is written to a PLC data table stored in the control storage unit 112.
- the PLC data shown in FIG. 4A has the same table items as the PLC data shown in FIG. 4B.
- data extracted from the PLC data stored in the control storage unit 112 by the data extraction unit 104 shown in FIG. 1B is written in a corresponding item.
- the link setting information is written in association with each control device 2. Details of the link setting information will be described later.
- a certain control device No For example, it is assumed that m first input devices from X1 to Xm are used.
- the first input device is, for example, a control device No.
- the temperature sensor provided in 1 is used.
- the execution unit 111 of the control unit 11 illustrated in FIG. 1B uses the sensing result of the temperature sensor as the detection value of the first input device as the control device No. Collect from 1
- the collected detection values of the first input device are written in the PLC data stored in the control storage unit 112.
- the detection value to be collected and analyzed by the monitoring control unit 101 shown in FIG. 1B is X2 of the first input device.
- the link setting information in which the management data and the specific PLC data are linked it is set that only the data of the X2 detection value of the first input device is transferred. That is, it is set not to access data other than the detection value of X2 of the first input device.
- the monitoring control unit 101 causes the data extraction unit 104 to extract the data of the X2 detection value of the first input device from the PLC data stored in the control storage unit 112 based on the link setting information.
- the monitoring control unit 101 writes the extracted data of the detected value of X2 of the first input device in a corresponding item of the PLC data table.
- the monitoring control unit 101 stores the written PLC data and the management data corresponding to the PLC data in the analysis storage area 103 in association with the date and time when the PLC data was written.
- data necessary for analysis in the monitoring control unit 101 that is, only data of a part of specific PLC data linked to the management data is extracted from the control storage unit 112 and analyzed. It can be stored in the storage area 103. Thereby, the amount of data collected by the monitoring control unit 101 can be minimized. Therefore, the load on the monitoring control unit 101 for data collection can be minimized. Further, the monitoring control unit 101 performs an analysis based on the data stored in the analysis storage area 103. For this reason, the monitoring control unit 101 can perform the analysis process without being affected by the control performed by the execution unit 111 of the control unit 11.
- FIG. 5 is an example of a setting screen 401 of the engineering tool 400 displayed on the display unit 45 of the terminal 4.
- the program of the engineering tool 400 is stored in the information processing storage unit 102 of the PLC unit 1 shown in FIG. 1B as described above.
- the program of the engineering tool 400 is activated based on an instruction from a terminal 4 connected to the PLC unit 1 via the network 3, as shown in FIG. 1A.
- the user connects the terminal 4 to the network 3 to which the PLC unit 1 is connected.
- the user causes the display unit 45 of the terminal 4 to display a browser.
- the user inputs the IP (Internet @ Protocol) address of the PLC unit 1 in the displayed address bar of the browser.
- the terminal 4 can access the PLC unit 1, the PLC unit 1 activates a program of the engineering tool 400.
- a setting screen 401 is displayed on a browser operating on the display unit 45 of the terminal 4.
- the control screen No. is displayed on the setting screen 401 as an item name of information to be set by the user. , Trigger settings, upper and lower thresholds, display units, and target data.
- the trigger setting is an item for setting information serving as a trigger for error detection.
- the target data is data necessary for analysis by the monitoring control unit 101 shown in FIG. 1B. That is, by setting the target data, it is possible to link the data of the specific PLC data to the management data.
- An input frame for inputting information to be set by the user is arranged next to each item name of information to be set by the user.
- the user inputs information to be set in this input box from the input unit 43 shown in FIG. 1C.
- the input to this input box is, for example, selection of a pull-down menu of predetermined options, input of an arbitrary character string from the input unit 43 shown in FIG. 1C, and the like.
- the user sets “below the lower threshold” as a trigger setting for error detection.
- the monitoring control unit 101 illustrated in FIG. 1B can determine an error state when the value of the collected data is equal to or less than the lower threshold.
- the user sets a lower limit “threshold”.
- the user sets “temperature [° C.]” as a display unit.
- the user sets “first input device (X2)” as the target data.
- the data set by this engineering tool 400 is the control device No. Is stored in the terminal storage unit 42 shown in FIG. 1C as management data associated with.
- the control device No. shown in FIG. One management data describes a lower threshold, a display unit, an error trigger setting, and the like.
- the target data is stored in the terminal storage unit 42 illustrated in FIG. 1C as link setting information in which the management data and the specific PLC data are linked. .
- the management data and the link setting information are stored by the user from the terminal storage unit 42 into the information processing storage unit 102 illustrated in FIG. 1B at an arbitrary timing.
- FIG. 6 shows a flowchart of an error detection process as an example of data output to the user.
- first input device (X2) is set in the association setting information.
- the first input device is, for example, a temperature sensor.
- the PLC unit 1 starts collecting data of the control device 2.
- the first input device is, as shown in FIG. Each m is provided.
- the detection value of the first input device is written in the PLC data stored in the control storage unit 112.
- the monitoring control unit 101 reads out and executes an error detection processing program from the information processing storage unit 102 in FIG. 1B.
- an error detection processing program from the information processing storage unit 102 in FIG. 1B.
- the monitoring control unit 101 illustrated in FIG. 1B causes the data extraction unit 104 to extract the data of the “first input device (X2)” from the PLC data stored in the control storage unit 112 as data necessary for analysis. (Step 10).
- the monitoring control unit 101 compares the extracted data of the “first input device (X2)” with the lower threshold set in the management data shown in FIG. 4A (step S11).
- the monitoring control unit 101 sets the “first input device (X2)”. Is converted into a graph display by the Web function unit 12. The Web function unit 12 transmits the result to the terminal 4 shown in FIG.
- the terminal 4 receives the data of the “first input device (X2)” converted into the form of the graph display from the Web function unit 12.
- the terminal control unit 441 of the terminal 4 stores the received data in the terminal storage unit 42.
- the terminal control unit 441 transmits the received data to the image generation unit 442.
- the image generating unit 442 generates an image that can be displayed on the browser of the display unit 45 based on the received data of the “first input device (X2)”.
- the image generation unit 442 transmits the generated image to the display unit 45.
- the display unit 45 displays the image received from the image generation unit 442 on the browser (Step S13).
- FIG. 7 shows an example of the image 402 displayed on the browser of the display unit 45 at this time.
- the image 402 displays a graph display converted so that the detection value of the “first input device (X2)” and the lower threshold value with respect to time can be understood.
- the image 402 displays the device status, the error state that is the cause of the error, and the time of occurrence of the error in accordance with the graph display.
- the device status is displayed as "normal”.
- "-" meaning blank is displayed at the time of occurrence of the error.
- the monitoring control unit 101 illustrated in FIG. 1B writes the detection value of the “first input device (X2)” extracted by the data extraction unit 104 into the PLC data illustrated in FIG. 4A.
- the monitoring control unit 101 adds the date and time when the data was extracted to the management data and the PLC data shown in FIG. 4A.
- the monitoring control unit 101 causes the management data with the date and time added and the PLC data to be stored in the analysis storage area 103 (step S14).
- step S10 and subsequent steps are repeated.
- the monitoring control unit 101 sets an error indicating the cause of the error. Error information is generated based on the information of “below the lower threshold” as the state and time information indicating the time of occurrence of the error (step S15).
- the monitoring control unit 101 causes the Web function unit 12 to convert the detected value data of the “first input device (X2)” into a graph display based on the error information and the device status “abnormal”. At this time, the monitoring control unit 101 converts the above-described data and information into graph display data so that the Web function unit 12 can detect the detection value with respect to time, the lower limit threshold value, and the error occurrence time. Let it.
- the Web function unit 12 transmits the data of the graph display and the data of the device status and the error information to the terminal 4 shown in FIG.
- the terminal control unit 441 stores the graph display data and the device status and error information data received by the communication unit 41 of the terminal 4 in the terminal storage unit 42.
- the terminal control unit 441 transmits the data of the graph display and the data of the device status and the error information received by the communication unit 41 to the image generation unit 442.
- the image generation unit 442 generates an image of a graph of the detection value of the first input device (X2) based on the data of the graph display received from the terminal control unit 441 and the data of the device state and the error information. In the image of this graph, the device state, the error state that is the cause of the error, and the error occurrence time are displayed together.
- the image generation unit 442 transmits the data of the generated image to the display unit 45.
- the display unit 45 displays the image received from the image generation unit 442 on the browser (Step S16).
- FIG. 8 shows an example of the image 402 displayed by the display unit 45 on the browser.
- the image 402 indicates that the detection value of the “first input device (X2)” has become equal to or lower than the lower limit threshold 230 ° C. at 13:35:24 at time 13:35:24 by device state data, graph display, and the like. Have been.
- the monitoring control unit 101 stores the error information generated in step S15 in the information processing storage unit 102 illustrated in FIG. 1B (step S17). Further, the monitoring control unit 101 stores the data of the “first input device (X2)” extracted by the data extraction unit 104 in a corresponding item of the PLC data associated with the management data as shown in FIG. 4A. Write. The monitoring control unit 101 adds the date and time when the data was extracted to the management data and the PLC data shown in FIG. 4A. The monitoring control unit 101 stores the management data and the PLC data added with the date and time in the analysis storage area 103.
- the monitoring control unit 101 uses the management data set by the engineering tool 400 and the link setting information in which the management data and the specific PLC parameter are linked to each other. Only the necessary data can be extracted from the control storage unit 112 of the control unit 11 and stored in the analysis storage area 103. Further, the monitoring control unit 101 performs an analysis based on the data stored in the analysis storage area 103. Therefore, the monitoring control unit 101 can analyze the data without being affected by the control performed by the execution unit 111 of the control unit 11 and monitor the operation state of the control device 2.
- the PLC unit 1 can collect and analyze PLC data from the control device 2 collectively. For this reason, when constructing a small- or medium-scale facility, it is not necessary to construct a complicated system or introduce advanced software tools. As a result, costs for starting the system can be reduced. Further, information from the PLC unit 1 can be confirmed at the terminal 4 via the network 3. For this reason, the user can check the equipment information of the factory, which is the production base, from a remote support center, a building different from the factory, and the like. Therefore, the user can take immediate action when a trouble occurs.
- the engineering tool 400 is provided in the PLC unit 1.
- the terminal 4 does not need to include the engineering tool 400. Therefore, the load on the terminal 4 can be reduced.
- the PLC unit 1 according to the second embodiment has a process of notifying the user of the life of the control device 2 in addition to the PLC unit 1 according to the first embodiment.
- This life notification processing is based on error information stored in the information processing storage unit 102 shown in FIG. 1B and management data stored in the analysis storage area 103 in accordance with conditions set in advance by the user. This is a process for notifying the user when the life of the control device 2 is approaching.
- the user activates the program of the engineering tool 400 stored in the information processing storage unit 102 of the PLC unit 1 shown in FIG. 1B using the terminal 4 shown in FIG. 1A.
- the user connects the terminal 4 to the network 3 to which the PLC unit 1 is connected.
- the user causes the display unit 45 of the terminal 4 to display a browser.
- the user inputs the IP (Internet @ Protocol) address of the PLC unit 1 in the displayed address bar of the browser.
- the terminal 4 can access the PLC unit 1, the PLC unit 1 starts a program of the engineering tool 400.
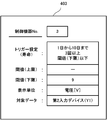
- a setting screen 403 shown in FIG. 9 is displayed on a browser operating on the display unit 45 of the terminal 4.
- the setting screen 403 is an example of a setting screen for setting conditions for notifying the user of the life.
- the trigger setting which is a trigger for the monitoring control unit 101 to notify the life
- “three or more times from one day to ten days and equal to or less than the lower limit threshold” is set. This is to cause the monitoring control unit 101 to notify the life when the lower limit threshold is detected three times during the period from the 1st to the 10th of this month.
- “9” and a display unit “voltage [V]” are set as the lower threshold.
- “Second input device (Y1)” is set in the target data.
- the second input device is, for example, a motor voltage detector that detects an output voltage of the motor. It is also assumed that k second input devices are connected to the PLC unit 1 as shown in FIG. 4B.
- the data set in FIG. 9 is stored in the terminal storage unit 42 of the terminal 4 as management data. Further, the data set in FIG. 9 is stored by the user in the information processing storage unit 102 of the PLC unit 1 shown in FIG. 1B from the terminal 4 via the network 3 as necessary.
- FIG. 10 shows a flowchart of the life notification process.
- This life notification process is stored in the information processing storage unit 102 shown in FIG. 1B as a program for performing the operation of this process.
- the monitoring control unit 101 reads out the program of the life notification process from the information processing storage unit 102 and executes the program.
- the control device No. set in FIG. If the detection value of the second input device (Y1) of No. 3 satisfies the condition of the trigger setting of “3 or more times from 1 day to 10 days and equal to or less than the lower threshold value”, the monitoring control unit 101 performs the life notification processing. Run the program.
- the monitoring control unit 101 acquires the error information stored in the information processing storage unit 102 (Step S20). Further, the monitoring control unit 101 acquires the management data stored in the analysis storage area 103 and the data of the detection value of the second input device (Y1) included in the PLC data (step S21). The monitoring control unit 101 determines the control device No. based on the data of the detection value of the second input device (Y1). The deterioration state of No. 3 is analyzed (step S22). For example, in this analysis, the wear state of the motor is estimated from the transition of the detection value of the second input device (Y1).
- the monitoring control unit 101 controls the control device No. From the analysis result of the deterioration state of control device No. 3, Third life information is generated (step S23). For example, the amount of change in the detected value is determined from the transition of the detected value of the second input device (Y1). Based on the amount of change, the time when the detection value becomes equal to or less than the lower threshold value is estimated.
- the monitoring control unit 101 causes the data of the life information to be transmitted from the Web function unit 12 to the terminal 4 illustrated in FIG.
- the terminal control unit 441 of the terminal 4 transmits the received life information data to the image generation unit 442.
- the image generation unit 442 acquires a GUI component for generating an image from the terminal storage unit 42.
- the image generation unit 442 provides the user with the control device No. based on the acquired GUI parts and the life information.
- An image for presenting the life information of No. 3 is generated. This image is, for example, a control device No. This message prompts replacement of a new second input device because the life of the third input device has come.
- the image generation unit 442 controls the control device No.
- An image for presenting the life information of No. 3 is transmitted to the display unit 45.
- the display unit 45 displays this image (Step S24).
- the monitoring control unit 101 stores the data of the life information in the information processing storage unit 102 (step S25).
- the second embodiment in addition to the effects of the first embodiment, it is possible to notify the user of the life of the control device 2. Thereby, the user can detect wear, deterioration, and the like of the control device 2 in advance. This allows the user to implement preventive maintenance on the control device 2.
- the first arithmetic unit 107 of the monitoring control unit 101 is built in the ASIC 115 of the control unit 11 as the hardware configuration of the PLC unit 1 shown in FIG. And
- the present invention is not limited to this.
- the first operation unit 107 and the second operation unit 122 of the Web function unit 12 may be combined into one operation unit.
- the IP address of the PLC unit 1 is input to the address bar of the browser operating on the display unit 45 of the terminal 4 shown in FIG.
- the program of the engineering tool 400 stored in the information processing storage unit 102 is started.
- the invention is not limited to this.
- an icon for activating the program of the engineering tool 400 may be provided on the display unit 45 of the terminal 4. The user can activate the program of the engineering tool 400 by selecting and confirming or double-clicking this icon.
- the monitoring control unit 101 generates error information based on information “below the lower threshold” as the error state indicating the cause of the error and time information indicating the time when the error occurred. And The present invention is not limited to this, and the monitoring control unit 101 may generate the error information based on the configuration information that determines the configuration of the error information stored in the information processing storage unit 102 in advance. For example, a configuration including error status information indicating the cause of the error and time information indicating the time when the error occurred may be determined as the configuration information.
- the monitoring control unit 101 generates the life information of the control device 2 from the analysis result of the deterioration state of the control device 2.
- the present invention is not limited thereto, and the monitoring control unit 101 may generate the life information based on the configuration information that defines the conditions, information, and the like for generating the life information stored in the information processing storage unit 102 in advance.
- the engineering tool 400 is stored in the terminal storage unit 42 of the terminal 4, and the program of the error detection process and the program of the life notification process are stored in the information processing storage unit 102 of the PLC unit 1. .
- These programs may be stored in a computer-readable recording medium such as a CD-ROM (Compact Disc Read Only Only Memory) or a DVD-ROM (Digital Versatile Disc Read Only Only Memory) and distributed.
- a computer-readable recording medium such as a CD-ROM (Compact Disc Read Only Only Memory) or a DVD-ROM (Digital Versatile Disc Read Only Only Memory) and distributed.
- the present invention can be suitably used for a PLC unit and a monitoring control system including the PLC unit and a terminal.
Landscapes
- Physics & Mathematics (AREA)
- General Physics & Mathematics (AREA)
- Engineering & Computer Science (AREA)
- Automation & Control Theory (AREA)
- Programmable Controllers (AREA)
- Testing And Monitoring For Control Systems (AREA)
Abstract
PLCユニット(1)は、制御部(11)と情報処理部(10)とを備える。制御部(11)は、複数の制御対象機器の動作状態を示すPLCデータを収集する収集部と、収集したPLCデータを格納するための制御用記憶部(112)とを含んでいる。情報処理部(10)は、制御対象機器の動作状態を監視するための管理データを格納する解析用記憶領域(103)と、PLCデータの一部と管理データとを紐付けた紐付け設定情報に基づいて、管理データに紐付けられているPLCデータを制御用記憶部(112)から抽出し、解析用記憶領域(103)に格納させるデータ抽出部(104)と、解析用記憶領域(103)に格納されたPLCデータを紐付けられている管理データに基づいて解析し、制御対象機器の動作状態を監視する監視制御部(101)とを含んでいる。
Description
本発明は、PLCユニット、方法、及びプログラムに関する。
工場内で使用される産業用ロボット、製造装置等には、その状態を検出するためのセンサ、その動作を制御するためのモータ等の制御機器が配置されている。制御機器には、管理者による定期的なメンテナンスが行われる。メンテナンスの結果、精度が低下している、または、劣化していると判断された制御機器は、管理者により交換される。この定期的なメンテナンスと制御機器の交換は、制御機器を配置した産業用ロボット、製造装置等の寿命が来るまで行われる。産業用ロボット、製造装置等の寿命は、長いと十年以上になる。このため、定期的なメンテナンスと制御機器の交換を長いスパンで行う必要があり、管理者の手間とコストがかかる。そこで、長いスパンでの定期的なメンテナンスと制御機器の交換を効率化するため、制御機器を監視するソリューションに対する要望が近年増加している。
制御機器を監視するソリューションとしては、例えば、制御機器を接続させるPLC(Programmable Logic Controller)ユニットと、制御機器からのデータを収集・解析させるSCADA(Supervisory Control And Data Acquisition)などの上位システムを連携させた監視制御システムが挙げられる。この監視制御システムを工場内に配置して制御機器を監視させることにより、管理者の手間とコストを減らすことができる。
しかし、監視制御システムに工場内の全ての制御機器からデータを収集させると、そのデータ量は膨大な量となる。このため、監視制御システムに制御機器からのデータを収集させて解析をさせる処理は、監視制御システムにとって負荷が大きい。そこで、例えば、特許文献1には、PLCユニットにデータ収集部と内蔵データベースを搭載し、監視制御システムが担っていたデータ収集をPLCユニットに肩代わりさせることで、監視制御システムの負荷を軽減させる技術が開示されている。
監視制御システムにデータの収集・解析をさせるためには、データベースサーバの導入、管理者に対する高難易度ツールのトレーニングなどが必要となる。このため、制御機器単位での制御をする中規模または小規模な設備においては、監視制御システムを導入するためのコスト、管理者へのトレーニングの手間などにおいて多くの課題がある。したがって、中規模または小規模な設備では、監視制御システムを導入することが難しいという問題がある。
本発明はこれらの課題を解決するものであり、制御対象機器からデータを効率的に収集し、解析することができるPLCユニットを提供することを目的とする。
上記目的を達するために、本発明に係るPLCユニットは、制御部と情報処理部とを備える。制御部は、複数の制御対象機器の動作状態を示すPLCデータを収集する収集部と、収集したPLCデータを格納するための制御用記憶部とを含んでいる。情報処理部は、制御対象機器の動作状態を監視するための管理データを格納する解析用記憶領域と、PLCデータの一部と管理データとを紐付けるための紐付け設定情報に基づいて、管理データに紐付けられているPLCデータを制御用記憶部から抽出し解析用記憶領域に格納させるデータ抽出部と、解析用記憶領域に格納されたPLCデータを紐付けられている管理データに基づいて解析し、制御対象機器の動作状態を監視する監視制御部とを含んでいる。
この発明によれば、PLCユニットにおいて、複数の制御対象機器の動作状態を示すPLCデータの一部を制御用記憶部から抽出し、抽出したPLCデータを制御対象機器の動作状態を監視するための管理データに基づいて監視制御部で解析し、制御対象機器の動作状態を監視することができるので、制御対象機器からデータを効率的に収集し、解析することができる。
(実施の形態1)
以下に、本発明の実施の形態1に係るPLCユニットについて説明する。PLCユニットは、制御機器からのデータの収集・解析を含めた統合的な監視制御を、PLCユニット単体で実施することができる。これにより、監視制御システムを導入しなくても、制御機器のメンテナンスと保守の効率化を図ることができる。
以下に、本発明の実施の形態1に係るPLCユニットについて説明する。PLCユニットは、制御機器からのデータの収集・解析を含めた統合的な監視制御を、PLCユニット単体で実施することができる。これにより、監視制御システムを導入しなくても、制御機器のメンテナンスと保守の効率化を図ることができる。
図1Aには、統合的な監視制御を実行することができるPLCユニット1と、PLCユニット1とネットワーク3を介して接続される端末4が示されている。このPLCユニット1と端末4とは、監視制御システム100に含まれる。PLCユニット1には、その制御の対象となるn個の制御機器2a、・・・、2nを接続することができる。この制御機器2a、・・・、2nを総称して、以下では、制御機器2と称する。制御機器2は、モータ、アームなど生産装置に備えられた機器である。なお、制御機器2は、本発明に係る制御対象機器の一例である。端末4には、表示部45が備えられている。表示部45には、詳細は後述するが、ユーザによりPLCユニット1への管理データが設定されるエンジニアリングツール400の設定画面、制御機器2の状態をユーザに提示するデータ出力画面などが表示される。また、端末4には、エンジニアリングツール400が備えられている。
PLCユニット1の構成を、図1Bに示す。PLCユニット1は、制御機器2の監視及び制御をする情報処理部10と、情報処理部10との間で各種データを送受信する制御部11と、ネットワーク3と接続されるWeb機能部12とを備えている。このネットワーク3は、例えば、インターネット、WAN(Wide Area Network)、複数の生産拠点である工場を結ぶLAN(Local Area Network)などである。
情報処理部10は、制御機器2の監視及び制御をする監視制御部101と、監視制御部101が使用するデータを格納する解析用記憶領域103を含む情報処理用記憶部102と、後述する制御部11の制御用記憶部112とデータを送受信するデータ抽出部104を備えている。
監視制御部101は、PLCユニット1に接続された制御機器2の監視及び制御をすることができる制御部である。監視制御部101は、後述する制御部11を介して制御機器2からデータを定期的に収集する。監視制御部101は、収集したデータを情報処理用記憶部102の解析用記憶領域103に格納する。また、監視制御部101は、解析用記憶領域103に格納されたデータを解析する。監視制御部101は、解析結果を情報処理用記憶部102に格納する。なお、本発明において、情報処理用記憶部102、解析用記憶領域103などの記憶部に対してデータを格納すると記載しているが、格納するではなく記憶する、保存する等、いずれの用語を用いてもよい。
情報処理用記憶部102は、監視制御部101により収集された制御機器2のデータを格納する解析用記憶領域103を含む記憶部である。また、情報処理用記憶部102には、ユーザが予め設定した設定値をまとめた管理データと、制御機器2のエラー情報、監視制御部101のデータ解析結果、データを設定するためのエンジニアリングツール400のプログラムなどが格納されている。また、情報処理用記憶部102には、制御機器2に関するデータであるPLCデータのうち、一部の特定のPLCデータと管理データとを紐付けた紐付け設定情報も格納されている。この紐付け設定情報と管理データは、エンジニアリングツール400により、ユーザが予め設定することができるデータである。なお、エンジニアリングツール400を用いたデータの設定方法について、詳細は後述する。
データ抽出部104は、後述する制御部11の制御用記憶部112に格納されているPLCデータから、情報処理用記憶部102に格納されている紐付け設定情報に基づいて、管理データに紐付けられたPLCデータのデータを抽出する。抽出されたPLCデータのデータは、情報処理用記憶部102の解析用記憶領域103に格納される。
制御部11は、制御機器2からデータを収集する処理を実行する実行部111と、制御用プログラム及び各種データを格納する制御用記憶部112とを備えている。実行部111は、制御用記憶部112に格納された制御用プログラムを読み出して実行する。この制御用プログラムは、PLCユニット1に接続されている各制御機器2から定期的にデータを収集させる処理を、実行部111に実行させるためのプログラムである。制御用記憶部112は、前述の実行部111の実行する制御用プログラムと、実行部111に各制御機器2から収集されたデータが格納される記憶部である。なお、実行部111は、本発明に係る収集部の一例である。
Web機能部12は、ネットワーク3の先にある端末とPLCユニット1とを通信可能に接続するインターフェースである。Web機能部12は、情報処理用記憶部102の解析用記憶領域103に格納されている制御機器2のデータを取り出し、ネットワーク3経由で端末4に送信する。データを送信する際、Web機能部12は、データをグラフ表示させるためのデータ形式に変換する。このグラフ表示させるためのデータ形式は、ブラウザ上にグラフを表示させることができるデータ形式である。これにより、ユーザは、端末4の表示部45に展開されるブラウザ上で、グラフ表示されるデータを見ることができる。
PLCユニット1において、情報処理部10は、ソフトウエアベースで構成される。具体的には、情報処理部10の監視制御部101とデータ抽出部104は、それぞれの機能をMPU(Micro-processing Unit)、CPU(Central Processing Unit)などの演算処理装置で実行されるプログラムとして構成される。特に、監視制御部101には、SCADAを用いることができる。また、PLCユニット1において、制御部11は、ハードウエアベースで構成される。具体的には、制御部11の実行部111には、ASIC(Application Specific Integrated Circuit)を用いることができる。なお、PLCユニット1のハードウエアの構成については、詳細は後述する。
上述のとおり、この実施の形態における監視制御部101には、SCADAを用いることができる。また、制御部11の実行部111には、ASICを用いることができる。すなわち、この実施の形態におけるPLCユニット1には、従来のPLCユニットにおいて備えられていたASICと、従来のPLCユニットと連携していた上位システムであるSCADAとが備えられている。このため、SCADA及びASICで扱われるデータのデータ形式を同じデータ形式にすることができる。これにより、データ形式の変換に必要な時間を削減することができる。このため、ユーザへのフィードバックに至るまでの遅延時間を短縮することができる。
次に、端末4について、図1Cを参照しつつ説明する。端末4には、ネットワーク3に接続するための通信部41と、データ、情報等を記憶する端末用記憶部42と、データ及び情報を入力する入力部43と、データ及び情報を処理する処理部44と、データ、情報等を表示する表示部45とが備えられている。
通信部41は、ネットワーク3に接続するための通信インターフェースである。端末4は、PLCユニット1から送信されるエラーデータ、寿命データなどを、ネットワーク3を介して通信部41で受信する。端末用記憶部42は、ブラウザ、ユーザへのデータ出力などの処理を実行するためのプログラム、このプログラムで使用または設定される各種データ、表示用のGUI(Graphical User Interface)部品などが格納されている。また、端末用記憶部42には、ネットワーク3を介してPLCユニット1から受信したエラーデータ、寿命データなども格納されている。入力部43は、ユーザから各種データ、設定情報などを入力させるものである。
処理部44は、プログラムを実行する端末用制御部441と、表示部45に表示させる画像を生成する画像生成部442とを備えている。端末用制御部441は、端末用記憶部42に格納されているプログラムを読み込んで実行する。また、端末用制御部441は、入力部43から入力される各種データ、設定情報などに基づいて、プログラム上での処理を実行する。画像生成部442は、端末用制御部441で実行されたプログラムの処理結果と、端末用記憶部42に格納されている各種データ、表示用のGUI部品などを用いて、表示画面の画像を生成する。表示部45は、画像生成部442で生成された表示画面の画像を表示する。
図1Bに示したPLCユニット1のハードウエアの構成の一例を、図2に示す。PLCユニット1は、ハードウエア的には、補助記憶部106と、第1演算部107と、ASIC115と、第1通信部116と、制御用メモリ117と、第2通信部121と、第2演算部122とを備えている。補助記憶部106と、ASIC115と、第1通信部116と、制御用メモリ117と、第2通信部121と、第2演算部122とは、内部バス13を介して相互に接続されている。
図1Bに示したPLCユニット1の情報処理部10は、補助記憶部106と第1演算部107により実現することができる。制御部11は、ASIC115と、第1通信部116と、制御用メモリ117とにより実現することができる。Web機能部12は、第2通信部121と、第2演算部122と、補助記憶部106とにより実現することができる。PLCユニット1を構成するハードウエアの各構成部について、以下に説明する。
補助記憶部106は、図1Bに示した情報処理用記憶部102及び解析用記憶領域103を実現するための記憶部である。また、補助記憶部106には、監視制御部101及びデータ抽出部104の機能を実行させるためのプログラムが格納されている。補助記憶部106には、SD(Secure Digital)カード、フラッシュメモリ、EPROM(Erasable Programmable Read Only Memory)、EEPROM(Electrically Erasable Programmable Read Only Memory)といった不揮発性または揮発性の半導体メモリ、磁気ディスク、フレキシブルディスク、光ディスク、コンパクトディスク、ミニディスク、DVD(Digital Versatile Disc)などの記憶素子及び記憶媒体が含まれる。
第1演算部107は、後述するASIC115に内蔵されている。第1演算部107は、補助記憶部106に格納された、図1Bに示した監視制御部101及びデータ抽出部104の機能を実行させるためのプログラムを実行する。すなわち、監視制御部101及びデータ抽出部104の機能を実現するための演算処理装置である。第1演算部107には、MPU、CPUなどの演算処理装置が含まれる。
ASIC115は、図1Bに示した実行部111を実現するための演算処理装置である。ASIC115は、定期的に各制御機器2からデータを収集する処理を実行する。第1通信部116は、制御機器2とPLCユニット1を接続するための通信インターフェースである。ASIC115は、第1通信部116を介して各制御機器2からデータを収集する。第1通信部116には、制御機器2と接続するためのケーブル、配線などを挿入する口、接続端子などと、各種の通信インターフェースとが含まれる。
制御用メモリ117は、図1Bに示した制御用記憶部112を実現するための記憶部である。制御用メモリ117には、ASIC115で収集された各制御機器2のデータが書き込まれる。制御用メモリ117には、RAM(Random Access Memory)、フラッシュメモリなどの、データを高速に書き込むことができる不揮発性または揮発性の半導体メモリが含まれる。
なお、ASIC115で収集される各制御機器2のデータは、一定期間の間、予め定められた容量に収まるように収集される。そして、収集されたデータは、制御用記憶部112に格納される。収集されるデータの容量が予め定められた容量を超える場合には、最も古いデータから順に上書きされる。
また、補助記憶部106は、図1Bに示す情報処理用記憶部102を実現するための記憶部である。情報処理用記憶部102には、長期間のデータを格納する。すなわち、情報処理用記憶部102には、既に書き込まれているデータに、新しく書き込まれるデータが追加される。このため、制御用メモリ117と比べて、大容量な記憶素子であることが望ましい。例えば、制御用メモリ117をメガオーダーの記憶素子で構成する場合には、補助記憶部106をギガオーダーの記憶素子で構成することが望ましい。
第2通信部121は、ネットワーク3とPLCユニット1とを接続させるための通信インターフェースである。第2通信部121は、イーサネット(登録商標)、インターネット及びWANのネットワーク用インターフェースなどが該当する。第2演算部122は、第2通信部121の通信を制御する演算部である。また、補助記憶部106には、図1Bに示したWeb機能部12の機能を実現するためのプログラムが格納されている。第2演算部122は、Web機能部12の機能を実現するためのプログラムを、補助記憶部106から読み込んで実行する。
次に、図1Cに示した端末4のハードウエアの構成の一例を、図3を参照しつつ説明する。端末4は、ハードウエア的には、プロセッサ444と、メモリ445と、表示コントローラ446と、I/O(Input/Output)ポート447と、内部バス448とを備えている。プロセッサ444と、メモリ445と、表示コントローラ446と、I/Oポート447は、内部バス448を介して相互に接続されている。また、プロセッサ444と、メモリ445と、表示コントローラ446と、I/Oポート447と、内部バス448より、処理部44が実現される。また、処理部44には、内部バス448を介して端末用記憶部42が接続されている。
プロセッサ444は、端末用記憶部42に記憶されたプログラムを、後述するメモリ445に読み込んで実行する演算処理装置である。プロセッサ444により、端末用制御部441を実現することができる。プロセッサ444には、MPU、CPUなどの演算処理装置が含まれる。
メモリ445は、端末用記憶部42に記憶されたプログラムを、プロセッサ444により読み込まされる記憶素子である。メモリ445には、RAM(Random access memory)、フラッシュメモリなどの、データを高速に書き込むことができる不揮発性または揮発性の半導体メモリが含まれる。
表示コントローラ446は、表示部45に表示させる画像を生成する装置である。表示コントローラ446により、図1Cに示した画像生成部442を実現することができる。表示コントローラ446には、ビデオカード、GPU(Graphics Processing Unit)、グラフィックボードなどの映像信号出力装置が含まれる。また、表示部45は、LCD(Liquid Crystal Display)、有機EL(Electro-Luminescence)パネルなどの表示インターフェース装置が含まれる。
I/Oポート447は、処理部44に入出力される信号を送受信するためのインターフェースである。処理部44は、I/Oポート447を介して通信部41と入力部43とに接続される。
また、通信部41は、ネットワーク3と端末4とを接続するための通信インターフェースである。通信部41には、イーサネット(登録商標)、ネットワーク用インターフェースなどが含まれる。入力部43は、ユーザから各種データ、設定情報などを入力させる機器である。入力部43には、キーボード、マウス、タッチパネルなどが含まれる。
ここで、管理データと、PLCデータと、管理データ及び特定のPLCデータを紐付ける紐付け設定情報の一例を、図4Aから図4Cを参照しつつ説明する。まず、管理データの一例を図4Aに示す。管理データには、例えば、エラー検出のトリガーとする上限及び下限の閾値、異常・正常などの機器の状態を示す機器状態、エラーの内容を示すエラーコードなど、制御機器2の動作状態を監視するためのデータが含まれている。また、管理データには、図1Bに示した監視制御部101によるデータの収集周期も含まれる。この管理データは、詳細は後述するPLCデータと共に、各制御機器2に割り当てられたテーブルの形式でまとめられている。具体的に説明する。PLCデータの制御機器No.は、各制御機器2に任意に割り当てられた装置番号である。この制御機器No.ごとに、各制御機器2に対応する管理データが、テーブルの形式でまとめられている。管理データとPLCデータは、データを作成した日時順に、図1Bに示した情報処理用記憶部102の解析用記憶領域103に追加される。すなわち、この管理データとPLCデータは、時間に伴って増えていくデータである。
管理データのデータ内容は、ユーザが任意に設定することができる。具体的には、ユーザは、エンジニアリングツール400によって、管理データのデータ内容を設定する。設定された管理データのデータ内容は、情報処理用記憶部102の解析用記憶領域103に格納される。なお、図4Aには記載されていないが、管理データには、図1Bに示した監視制御部101によるデータの収集周期も設定されている。
PLCデータの一例を、図4Bに示す。PLCデータは、各制御機器2とPLCユニット1に関連するデータである。PLCデータに含まれるデータは、図4Bに示すように、例えば、各制御機器2に設定されたネットワーク局番、各制御機器2に備えられるセンサ、スイッチなどの入力デバイスの検出値のデータ、各制御機器2に備えられるバルブの開時間、モータの稼働時間などをカウントするタイマデバイスのタイマ値のデータなどである。PLCデータは、各制御機器2の装置番号である制御機器No.に割り当てられたテーブルの形式でまとめられている。
このPLCデータは、図1Bに示した制御用記憶部112に格納されている。PLCデータに含まれるデータは、図1Bに示した制御部11の実行部111により、定期的に各制御機器2から収集される。PLCデータに含まれるデータは、制御用記憶部112に格納されているPLCデータのテーブルに書き込まれる。
また、図4Aに示すPLCデータには、図4Bに示すPLCデータと同様のテーブルの項目が備えられている。図4Aに示すPLCデータには、図1Bに示したデータ抽出部104により制御用記憶部112に格納されているPLCデータから抽出されたデータが、対応する項目に書き込まれる。さらに、図4Aには、紐付け設定情報が、各制御機器2に対応付けて書き込まれている。紐付け設定情報の詳細は後述する。
具体的な処理を、図4Cを参照しつつ説明する。例えば、ある制御機器No.1について、第1入力デバイスがX1からXmのm個使用されているとする。この第1入力デバイスは、例えば、制御機器No.1に備えられた温度センサとする。図1Bに示した制御部11の実行部111は、第1入力デバイスの検出値として、この温度センサのセンシング結果を制御機器No.1から収集する。収集された第1入力デバイスの検出値は、制御用記憶部112に格納されたPLCデータに書き込まれる。
ここで、図1Bに示した監視制御部101の収集・解析したい検出値が第1入力デバイスのX2だとする。この場合、管理データと特定のPLCデータとを紐付けた紐付け設定情報には、第1入力デバイスのX2の検出値のデータのみを転送することが設定されている。すなわち、第1入力デバイスのX2の検出値以外のデータにはアクセスしないことが設定される。監視制御部101は、紐付け設定情報に基づいてデータ抽出部104に、制御用記憶部112に格納されているPLCデータから、第1入力デバイスのX2の検出値のデータを抽出させる。監視制御部101は、抽出された第1入力デバイスのX2の検出値のデータを、PLCデータのテーブルの該当する項目に書き込む。なお、監視制御部101によりデータを書き込まれなかったPLCデータのテーブルの項目には、ブランクを示す「-」が書き込まれる。監視制御部101は、書き込んだPLCデータと、このPLCデータに対応する管理データとを、PLCデータを書き込んだ日時に対応づけて解析用記憶領域103に格納させる。
上記の方式を用いることにより、監視制御部101で解析に必要なデータ、すなわち、管理データに紐付けられた一部の特定のPLCデータのデータのみを制御用記憶部112から抽出し、解析用記憶領域103に格納させることができる。これにより、監視制御部101に収集させるデータ量を最小限に抑えることができる。したがって、データの収集に対する監視制御部101への負荷を最小限に抑えることができる。また、監視制御部101は、解析用記憶領域103に格納されているデータを基に解析を実施する。このため、監視制御部101は、制御部11の実行部111が担う制御に影響を受けることなく、解析の処理をすることができる。
また、監視制御部101に収集させるデータ量を最小限に抑えることで、少ないメモリ領域で、データの収集と解析を実現することができる。更に、必要なデータのみを、図1Bに示した制御用記憶部112からデータ抽出部104に抽出させる事で、制御用記憶部112へのアクセス回数を最小限に抑えることができる。このため、制御部11で実行される制御プログラムの演算性能の低下を抑えることができる。
エンジニアリングツール400における、管理データと紐付け設定情報との設定方法を、図5を参照しつつ説明する。図5は、端末4の表示部45に表示されるエンジニアリングツール400の設定画面401の一例である。エンジニアリングツール400のプログラムは、上述のとおり、図1Bに示したPLCユニット1の情報処理用記憶部102に格納されている。このエンジニアリングツール400のプログラムは、図1Aに示すように、ネットワーク3を介してPLCユニット1に接続された端末4からの指示に基づいて起動する。
例えば、図1Aに示すように、ユーザは、PLCユニット1の接続されたネットワーク3に端末4を接続する。ユーザは、端末4の表示部45にブラウザを表示させる。ユーザは、表示させたブラウザのアドレスバーに、PLCユニット1のIP(Internet Protocol)アドレスを入力する。端末4がPLCユニット1にアクセスできた場合、PLCユニット1は、エンジニアリングツール400のプログラムを起動させる。エンジニアリングツール400は起動すると、端末4の表示部45上で動作するブラウザに設定画面401を表示させる。
設定画面401には、ユーザに設定させる情報の項目名として、制御機器No.と、トリガー設定と、上限及び下限の閾値と、表示単位と、対象データとが示されている。トリガー設定は、エラー検知のためのトリガーとなる情報を設定するための項目である。対象データは、図1Bに示した監視制御部101で解析に必要なデータである。すなわち、この対象データを設定することにより、管理データに特定のPLCデータのデータを紐付けることができる。
ユーザに設定させる情報の各項目名の横には、ユーザに設定させる情報を入力させるための入力枠が配置されている。ユーザは、この入力枠に、図1Cに示した入力部43より、設定させる情報を入力する。なお、この入力枠への入力は、予め定められた選択肢のプルダウンメニューの選択、図1Cに示した入力部43からの任意な文字列の入力などである。
例えば、ユーザは、制御機器No.に「1」を設定する。ユーザは、エラー検知のためのトリガー設定として、「下限の閾値以下」を設定する。この設定により、図1Bに示した監視制御部101は、収集されるデータの値が下限の閾値以下になった場合を、エラー状態と判定することができる。続いてユーザは、下限の「閾値」を設定する。ユーザは、表示単位として「温度[℃]」を設定する。ユーザは、対象データとして、「第1入力デバイス(X2)」を設定する。
このエンジニアリングツール400で設定されたデータは、制御機器No.に対応つけられる管理データとして、図1Cに示した端末用記憶部42に格納される。例えば、図4Aに示した制御機器No.1の管理データに、下限の閾値と、表示単位と、エラーのトリガー設定などが記載されている。また、このエンジニアリングツール400で設定されたデータのうち、対象データは、管理データと特定のPLCデータとを紐付けた紐付け設定情報として、図1Cに示した端末用記憶部42に格納される。この管理データと、紐付け設定情報とは、ユーザが任意のタイミングで、端末用記憶部42から図1Bに示した情報処理用記憶部102へ格納させる。
次に、図1Bに示したPLCユニット1の監視制御部101が収集した制御機器2のPLCデータを、ユーザに視認させるデータ出力方法について、図6のフローチャートを参照しつつ説明する。このデータ出力方法は、図1Bに示した情報処理用記憶部102の解析用記憶領域103に格納されている制御機器2のデータを、図1Cに示した端末4の表示部45上で動作するブラウザにグラフ表示をさせる方法である。図6には、ユーザへのデータ出力の一例として、エラー検知処理のフローチャートが示されている。
まず、図4Aに示したように制御機器No.1の管理データには、エラー検知のトリガーとして「下限の閾値以下」、下限の閾値として「230℃」、表示単位として「温度[℃]」が設定されている。また、紐付け設定情報には、「第1入力デバイス(X2)」が設定されている。この第1入力デバイスは、例えば、温度センサである。
PLCユニット1が、制御機器2のデータの収集を開始する。第1入力デバイスは、図4Bに示したように、制御機器No.1にm個備えられている。制御用記憶部112に格納されているPLCデータには、第1入力デバイスの検出値が書き込まれる。
ここで、監視制御部101は、図1Bの情報処理用記憶部102からエラー検知処理のプログラムを読み出し、実行する。以下、エラー検知処理の動作を、図6を参照しつつ説明する。
図1Bに示した監視制御部101は、解析に必要なデータとして、データ抽出部104に、制御用記憶部112に格納されているPLCデータから「第1入力デバイス(X2)」のデータを抽出させる(ステップ10)。監視制御部101は、抽出させた「第1入力デバイス(X2)」のデータと、図4Aに示した管理データに設定されている下限の閾値とを比較する(ステップS11)。
抽出した「第1入力デバイス(X2)」のデータが管理データに設定されている下限の閾値以下で無ければ(ステップS12;NO)、監視制御部101は、「第1入力デバイス(X2)」のデータをWeb機能部12にグラフ表示に変換させる。Web機能部12は、ネットワーク3を介して図1Cに示した端末4に送信する。
端末4は、Web機能部12から、グラフ表示の形式に変換された「第1入力デバイス(X2)」のデータを受信する。端末4の端末用制御部441は、受信したデータを、端末用記憶部42に格納する。また、端末用制御部441は、受信したデータを画像生成部442に送信する。画像生成部442は、受信した「第1入力デバイス(X2)」のデータをもとに、表示部45のブラウザ上で表示できる画像を生成する。画像生成部442は、生成した画像を表示部45に送信する。表示部45は、画像生成部442から受信した画像をブラウザ上に表示させる(ステップS13)。
このとき、表示部45のブラウザ上に表示される画像402の一例を、図7に示す。画像402には、時間に対する「第1入力デバイス(X2)」の検出値及び下限の閾値が分かるように変換されたグラフ表示が表示されている。また、画像402には、グラフ表示に合わせて、機器状態と、エラーの原因であるエラー状態と、エラーの発生時刻とを表示させている。なお、ここではエラーは発生していないので機器状態は「正常」と表示される。また、エラーの発生時刻には、ブランクを意味する「-」が表示される。
図1Bに示した監視制御部101は、データ抽出部104に抽出させた「第1入力デバイス(X2)」の検出値を、図4Aに示したPLCデータに書き込む。監視制御部101は、図4Aに示した管理データとPLCデータとに、データを抽出した日時を付加する。監視制御部101は、日時を付加した管理データとPLCデータとを、解析用記憶領域103に格納させる(ステップS14)。以下、ステップS10以降を繰り返す。
抽出した「第1入力デバイス(X2)」の検出値のデータが管理データに設定されている下限の閾値以下であれば(ステップS12;YES)、監視制御部101は、エラーの原因を示すエラー状態として「下限の閾値以下」の情報と、エラーの発生時刻を示す時刻情報とにより、エラー情報を生成する(ステップS15)。監視制御部101は、「第1入力デバイス(X2)」の検出値のデータと、機器状態として「異常」と、エラー情報に基づいて、Web機能部12にグラフ表示に変換させる。このとき、監視制御部101は、Web機能部12に、時間に対する検出値と、下限の閾値と、エラーの発生時刻とが分かるように、上述の各データ及び各情報をグラフ表示のデータに変換させる。
Web機能部12は、このグラフ表示のデータと、機器状態及びエラー情報のデータとを、ネットワーク3を介して図1Cに示した端末4に送信する。端末用制御部441は、端末4の通信部41で受信したグラフ表示のデータと、機器状態及びエラー情報のデータとを端末用記憶部42に格納する。また、端末用制御部441は、通信部41で受信したグラフ表示のデータと、機器状態及びエラー情報のデータとを、画像生成部442に送信する。画像生成部442は、端末用制御部441から受信したグラフ表示のデータと機器状態及びエラー情報のデータとに基づいて、第1入力デバイス(X2)の検出値のグラフの画像を生成する。このグラフの画像には、機器状態と、エラーの原因であるエラー状態と、エラーの発生時刻とを合わせて表示させるものとする。
画像生成部442は、生成した画像のデータを表示部45に送信する。表示部45は、画像生成部442から受信した画像を、ブラウザ上に表示する(ステップS16)。この表示部45がブラウザ上に表示させる画像402の一例を、図8に示す。画像402には、「第1入力デバイス(X2)」の検出値が、時刻13時35分24秒に、下限の閾値230℃以下となったことを、機器状態のデータ、グラフ表示などにより示されている。
監視制御部101は、ステップS15で生成したエラー情報を、図1Bに示した情報処理用記憶部102に格納する(ステップS17)。また、監視制御部101は、データ抽出部104に抽出させた「第1入力デバイス(X2)」のデータを、図4Aに示すように、管理データと対応づけられたPLCデータの対応する項目に書き込む。監視制御部101は、図4Aに示した管理データとPLCデータとに、データを抽出した日時を付加する。監視制御部101は、日時を付加した管理データとPLCデータを、解析用記憶領域103に格納する。
以上のように、実施の形態1においては、エンジニアリングツール400で設定された管理データと、管理データと特定のPLCパラメータとを紐付けた紐付け設定情報とにより、監視制御部101で解析に必要なデータだけを制御部11の制御用記憶部112から抽出し、解析用記憶領域103に格納させることができる。また、監視制御部101は、解析用記憶領域103に格納されているデータを基に解析を実施する。このため、監視制御部101は、制御部11の実行部111が担う制御に影響を受けることなくデータを解析し、制御機器2の動作状態を監視することができる。
また、PLCユニット1単体で制御機器2からPLCデータの収集・解析を一括で実施可能である。このため、小規模または中規模の設備を構築する際、複雑なシステム構築、高度なソフトウェアツールの導入などが不要となる。これにより、システムを立ち上げる際のコストを削減することができる。また、PLCユニット1からの情報を、ネットワーク3を介して端末4で確認することができる。このため、ユーザは、生産拠点である工場の設備情報を遠隔地のサポートセンター、工場とは違う建物の中などから確認することができる。したがって、ユーザは、トラブル発生時に早急な対応をすることができる。
さらに、実施の形態1においては、エンジニアリングツール400をPLCユニット1に備えている。これにより、端末4にエンジニアリングツール400を備える必要が無くなる。したがって、端末4への負荷を減らすことができる。
(実施の形態2)
実施の形態2におけるPLCユニット1には、実施の形態1におけるPLCユニット1に加えて、ユーザに制御機器2の寿命を通知する処理を備えている。この寿命通知処理は、ユーザが予め設定した条件に応じて、図1Bに示した情報処理用記憶部102に格納されたエラー情報と、解析用記憶領域103に格納されている管理データとに基づいて、制御機器2の寿命が近づくとユーザに通知する処理である。
実施の形態2におけるPLCユニット1には、実施の形態1におけるPLCユニット1に加えて、ユーザに制御機器2の寿命を通知する処理を備えている。この寿命通知処理は、ユーザが予め設定した条件に応じて、図1Bに示した情報処理用記憶部102に格納されたエラー情報と、解析用記憶領域103に格納されている管理データとに基づいて、制御機器2の寿命が近づくとユーザに通知する処理である。
以下に、ユーザに制御機器2の寿命通知処理について説明する。まず、ユーザは、図1Bに示したPLCユニット1の情報処理用記憶部102に格納されているエンジニアリングツール400のプログラムを、図1Aに示した端末4を用いて起動させる。
例えば、ユーザは、PLCユニット1の接続されたネットワーク3に端末4を接続する。ユーザは、端末4の表示部45にブラウザを表示させる。ユーザは、表示させたブラウザのアドレスバーに、PLCユニット1のIP(Internet Protocol)アドレスを入力する。端末4がPLCユニット1にアクセスできた場合、PLCユニット1は、エンジニアリングツール400のプログラムを起動する。エンジニアリングツール400のプログラムは起動すると、端末4の表示部45上で動作するブラウザに、図9に示す設定画面403を表示させる。この設定画面403は、ユーザに寿命を通知させる条件を設定させるための設定画面の一例である。
図9には、制御機器No.として「3」が設定されている。監視制御部101が寿命を通知するためのトリガーであるトリガー設定には「1日から10日まで3回以上、下限の閾値以下」が設定されている。これは、今月の1日から10日までの間に、3回下限の閾値を検出した場合に、監視制御部101から寿命を通知させるものである。下限の閾値には「9」、表示単位「電圧[V]」が設定されている。対象データには、「第2入力デバイス(Y1)」が設定されている。この第2入力デバイスは、例えば、モータの出力電圧を検出するモータ電圧検出器である。また、図4Bに示すように、k個の第2入力デバイスがPLCユニット1に接続されているものとする。
図9で設定されたデータは、管理データとして端末4の端末用記憶部42に格納される。また、図9で設定されたデータは、ユーザが必要に応じて、端末4からネットワーク3を介して図1Bに示したPLCユニット1の情報処理用記憶部102に格納させる。
寿命通知処理のフローチャートを、図10に示す。この寿命通知処理は、この処理の動作を行うプログラムとして、図1Bに示した情報処理用記憶部102に格納されている。寿命を通知するためのトリガーの設定条件を満たす場合、監視制御部101は、情報処理用記憶部102から寿命通知処理のプログラムを読み出し、実行する。ここでは、図9で設定した制御機器No.3の第2入力デバイス(Y1)の検出値が、トリガー設定である「1日から10日まで3回以上、下限の閾値以下」の条件を満たした場合、監視制御部101は、寿命通知処理のプログラムを実行する。
監視制御部101は、情報処理用記憶部102に格納されたエラー情報を取得する(ステップS20)。また、監視制御部101は、解析用記憶領域103に格納された管理データと、PLCデータに含まれる第2入力デバイス(Y1)の検出値のデータとを取得する(ステップS21)。監視制御部101は、第2入力デバイス(Y1)の検出値のデータに基づいて、制御機器No.3の劣化状態を解析する(ステップS22)。例えば、この解析は、第2入力デバイス(Y1)の検出値の遷移から、モータの摩耗状態を推測するものである。
監視制御部101は、制御機器No.3の劣化状態の解析結果から、制御機器No.3の寿命情報を生成する(ステップS23)。例えば、第2入力デバイス(Y1)の検出値の遷移から、検出値の変化量を割り出す。この変化量により、検出値が下限の閾値以下になる時期を推測する。
監視制御部101は、寿命情報のデータを、Web機能部12からネットワーク3を介して図1Cに示した端末4に送信させる。端末4の端末用制御部441は、受信した寿命情報のデータを画像生成部442に送信する。画像生成部442は、端末用記憶部42から画像生成のためのGUI部品を取得する。画像生成部442は、取得したGUI部品と、寿命情報とに基づいて、ユーザに制御機器No.3の寿命情報を提示するための画像を生成する。この画像は、例えば、制御機器No.3の寿命が来るため、新しい第2入力デバイスに交換を促すメッセージである。画像生成部442は、制御機器No.3の寿命情報を提示するための画像を、表示部45に送信する。表示部45は、この画像を表示する(ステップS24)。監視制御部101は、寿命情報のデータを情報処理用記憶部102に格納する(ステップS25)。
以上のように、実施の形態2においては、実施の形態1の効果に加えて、ユーザに制御機器2の寿命を通知することができる。これにより、ユーザは、制御機器2の摩耗、劣化などを事前に察知できる。これにより、ユーザは、制御機器2への予防保全を実現することができる。
(変形例1)
上述の実施の形態1及び実施の形態2においては、図2に示したPLCユニット1のハードウエアの構成として、監視制御部101の第1演算部107を、制御部11のASIC115に内蔵するものとした。これに限らず、第1演算部107をASIC115の外に出しても良い。また、第1演算部107と、Web機能部12の第2演算部122とをまとめ、1つの演算部で構成しても良い。
上述の実施の形態1及び実施の形態2においては、図2に示したPLCユニット1のハードウエアの構成として、監視制御部101の第1演算部107を、制御部11のASIC115に内蔵するものとした。これに限らず、第1演算部107をASIC115の外に出しても良い。また、第1演算部107と、Web機能部12の第2演算部122とをまとめ、1つの演算部で構成しても良い。
(変形例2)
上述の実施の形態1及び実施の形態2においては、例えば、図1Aに示した端末4の表示部45上で動作するブラウザのアドレスバーにPLCユニット1のIPアドレスを入力し、図1Bに示した情報処理用記憶部102に格納されているエンジニアリングツール400のプログラムを起動させた。これに限らず、例えば、端末4の表示部45上に、エンジニアリングツール400のプログラムを起動させるためのアイコンを備えてもよい。ユーザが、このアイコンを選択し確定する、ダブルクリックする等により、エンジニアリングツール400のプログラムを起動させることができる。
上述の実施の形態1及び実施の形態2においては、例えば、図1Aに示した端末4の表示部45上で動作するブラウザのアドレスバーにPLCユニット1のIPアドレスを入力し、図1Bに示した情報処理用記憶部102に格納されているエンジニアリングツール400のプログラムを起動させた。これに限らず、例えば、端末4の表示部45上に、エンジニアリングツール400のプログラムを起動させるためのアイコンを備えてもよい。ユーザが、このアイコンを選択し確定する、ダブルクリックする等により、エンジニアリングツール400のプログラムを起動させることができる。
(変形例3)
上述の実施の形態1においては、監視制御部101は、エラーの原因を示すエラー状態として「下限の閾値以下」の情報と、エラーの発生時刻を示す時刻情報とにより、エラー情報を生成するものとした。これに限らず、監視制御部101は、予め情報処理用記憶部102に格納されたエラー情報の構成を定めた構成情報に基づいて、エラー情報を生成してもよい。例えば、構成情報として、エラーの原因を示すエラー状態の情報及びエラーの発生時刻を示す時刻情報とを含む構成を定めてもよい。
上述の実施の形態1においては、監視制御部101は、エラーの原因を示すエラー状態として「下限の閾値以下」の情報と、エラーの発生時刻を示す時刻情報とにより、エラー情報を生成するものとした。これに限らず、監視制御部101は、予め情報処理用記憶部102に格納されたエラー情報の構成を定めた構成情報に基づいて、エラー情報を生成してもよい。例えば、構成情報として、エラーの原因を示すエラー状態の情報及びエラーの発生時刻を示す時刻情報とを含む構成を定めてもよい。
(変形例4)
上述の実施の形態2においては、監視制御部101は、制御機器2の劣化状態の解析結果から、制御機器2の寿命情報を生成するものとした。これに限らず、監視制御部101は、予め情報処理用記憶部102に格納された寿命情報を生成する条件、情報等を定めた構成情報に基づいて、寿命情報を生成してもよい。
上述の実施の形態2においては、監視制御部101は、制御機器2の劣化状態の解析結果から、制御機器2の寿命情報を生成するものとした。これに限らず、監視制御部101は、予め情報処理用記憶部102に格納された寿命情報を生成する条件、情報等を定めた構成情報に基づいて、寿命情報を生成してもよい。
本発明では、エンジニアリングツール400を端末4の端末用記憶部42に格納し、また、エラー検知処理のプログラム及び寿命通知処理のプログラムをPLCユニット1の情報処理用記憶部102に格納するものとした。これらのプログラムを、例えば、コンピュータが読み取り可能なCD-ROM(Compact Disc Read Only Memory)、DVD-ROM(Digital Versatile Disc Read Only Memory)などの記録媒体に格納して配布できるようにしてもよい。このプログラムをコンピュータにインストールすることにより、上述の各機処理を実現することができるコンピュータを構成してもよい。そして、各処理をOS(Operating System)とアプリケーションとの分担、またはOSとアプリケーションとの協同により実現する場合等には、アプリケーションのみを記録媒体に格納してもよい。
本発明は、本発明の広義の精神と範囲を逸脱することなく、様々な実施の形態及び変形が可能とされるものである。また、上述した実施の形態は、この発明を説明するためのものであり、本発明の範囲を限定するものではない。すなわち、本発明の範囲は、実施の形態ではなく、請求の範囲によって示される。そして、請求の範囲内及びそれと同等の発明の意義の範囲内で施される様々な変形が、この発明の範囲内とみなされる。
本発明は、PLCユニット、及び、PLCユニットと端末を備える監視制御システムに好適に利用することができる。
1 PLCユニット、2 制御機器、3 ネットワーク、4 端末、10 情報処理部、11 制御部、12 Web機能部、13 内部バス、41 通信部、42 端末用記憶部、43 入力部、44 処理部、45 表示部、100 監視制御システム、101 監視制御部、102 情報処理用記憶部、103 解析用記憶領域、104 データ抽出部、106 補助記憶部、107 第1演算部、111 実行部、112 制御用記憶部、115 ASIC、116 第1通信部、117 制御用メモリ、121 第2通信部、122 第2演算部、400 エンジニアリングツール、401、403 設定画面、402 画像、441 端末用制御部、442 画像生成部、444 プロセッサ、445 メモリ、446 表示コントローラ、447 I/Oポート、448 内部バス。
Claims (10)
- 複数の制御対象機器の動作状態を示すPLCデータを収集する収集部と、収集したPLCデータを格納するための制御用記憶部とを含む制御部と、
前記制御対象機器の動作状態を監視するための管理データを格納する解析用記憶領域と、前記PLCデータの一部と前記管理データとを紐付けるための紐付け設定情報に基づいて、前記管理データに紐付けられている前記PLCデータを前記制御用記憶部から抽出し前記解析用記憶領域に格納させるデータ抽出部と、前記解析用記憶領域に格納された前記PLCデータを紐付けられている前記管理データに基づいて解析し、前記制御対象機器の動作状態を監視する監視制御部とを含む情報処理部と、
を備えるPLCユニット。 - 前記制御用記憶部に格納されるPLCデータと、前記解析用記憶領域に格納されるPLCデータとは、同じデータ形式である、
請求項1に記載のPLCユニット。 - 前記管理データは、前記PLCデータのエラーを検知させるための条件が定められたデータであり、
前記監視制御部は、前記管理データに基づいて、抽出したPLCデータのエラーを検出することにより、前記制御対象機器の動作状態を監視する、
請求項1又は2に記載のPLCユニット。 - 前記情報処理部は、前記解析用記憶領域を含む情報処理用記憶部を備え、
前記情報処理用記憶部は、前記制御対象機器でエラーが発生した場合に生成するエラー情報の構成を定義する構成情報を格納し、
前記監視制御部は、前記制御対象機器でエラーが発生したことを検知した場合に、前記情報処理用記憶部に記憶している構成情報に基づいてエラー情報を構成して出力する、
請求項3に記載のPLCユニット。 - 前記監視制御部は、前記紐付け設定情報に基づいて前記データ抽出部が前記制御用記憶部から抽出した前記PLCデータが、前記管理データに予め定められたエラー検知のトリガー設定を満たす場合、前記構成情報に基づいてエラーの原因を示すエラー状態の情報及びエラーの発生時刻を示す時刻情報を含む前記エラー情報を生成し、前記情報処理用記憶部に格納させる、
請求項4に記載のPLCユニット。 - 前記監視制御部は、前記紐付け設定情報に基づいて前記データ抽出部が前記制御用記憶部から抽出した前記PLCデータが、前記管理データに予め定められた寿命通知のトリガー設定を満たす場合、前記構成情報に基づいて、前記制御対象機器の寿命情報を生成し、生成した前記寿命情報を前記情報処理用記憶部に格納させる、
請求項4または5に記載のPLCユニット。 - 前記PLCユニットは、ネットワークを介して端末とデータを送受信可能なWeb機能部をさらに備え、
前記管理データ及び前記紐付け設定情報は、前記端末上で予め定められ、
前記監視制御部は、前記管理データ及び前記紐付け設定情報を、前記ネットワークを介して前記端末からWeb機能部に受信させ、受信させた前記管理データを前記解析用記憶領域に格納させる、
請求項1から6の何れか一項に記載のPLCユニット。 - 前記Web機能部は、前記解析用記憶領域に格納される前記管理データのデータ及び前記PLCデータをグラフ表示の形式に変換し、変換したグラフ表示の形式の前記PLCデータを、前記ネットワークを介して前記端末に送信する、
請求項7に記載のPLCユニット。 - 複数の制御対象機器の動作状態を示すPLCデータを収集し、
前記PLCデータの一部を、前記制御対象機器の動作状態を監視するための管理データと紐付け、
前記管理データに紐付けされた前記PLCデータを抽出し、
抽出した前記PLCデータを前記管理データに基づいて解析し、前記制御対象機器の動作状態を監視する、
方法。 - コンピュータに、
複数の制御対象機器の動作状態を示すPLCデータを収集させる処理、
前記PLCデータの一部を、前記制御対象機器の動作状態を監視するための管理データと紐付けさせる処理、
前記管理データに紐付けされた前記PLCデータを抽出させる処理、
抽出した前記PLCデータを前記管理データに基づいて解析し、前記制御対象機器の動作状態を監視する処理、
を実行させるためのプログラム。
Priority Applications (2)
| Application Number | Priority Date | Filing Date | Title |
|---|---|---|---|
| JP2019533665A JP6661842B1 (ja) | 2018-08-17 | 2018-08-17 | Plcユニット、方法、及びプログラム |
| PCT/JP2018/030474 WO2020035935A1 (ja) | 2018-08-17 | 2018-08-17 | Plcユニット、方法、及びプログラム |
Applications Claiming Priority (1)
| Application Number | Priority Date | Filing Date | Title |
|---|---|---|---|
| PCT/JP2018/030474 WO2020035935A1 (ja) | 2018-08-17 | 2018-08-17 | Plcユニット、方法、及びプログラム |
Publications (1)
| Publication Number | Publication Date |
|---|---|
| WO2020035935A1 true WO2020035935A1 (ja) | 2020-02-20 |
Family
ID=69525316
Family Applications (1)
| Application Number | Title | Priority Date | Filing Date |
|---|---|---|---|
| PCT/JP2018/030474 Ceased WO2020035935A1 (ja) | 2018-08-17 | 2018-08-17 | Plcユニット、方法、及びプログラム |
Country Status (2)
| Country | Link |
|---|---|
| JP (1) | JP6661842B1 (ja) |
| WO (1) | WO2020035935A1 (ja) |
Cited By (3)
| Publication number | Priority date | Publication date | Assignee | Title |
|---|---|---|---|---|
| JP2022158230A (ja) * | 2021-04-01 | 2022-10-17 | 株式会社キーエンス | プログラマブルロジックコントローラ |
| CN115836260A (zh) * | 2020-08-26 | 2023-03-21 | 三菱电机株式会社 | 控制装置及控制方法 |
| CN118435622A (zh) * | 2022-04-28 | 2024-08-02 | 三菱电机株式会社 | 信息处理装置、控制系统、信息处理方法及程序 |
Citations (4)
| Publication number | Priority date | Publication date | Assignee | Title |
|---|---|---|---|---|
| JP2006330774A (ja) * | 2005-05-23 | 2006-12-07 | Yokogawa Electric Corp | プロセス異常状態回復操作支援システム |
| JP2008140110A (ja) * | 2006-12-01 | 2008-06-19 | Yokogawa Electric Corp | プロセス解析支援装置およびプロセス解析支援方法 |
| WO2014064819A1 (ja) * | 2012-10-25 | 2014-05-01 | 三菱電機株式会社 | システム構築支援ツール及びシステム |
| WO2016088215A1 (ja) * | 2014-12-03 | 2016-06-09 | 富士電機株式会社 | Plc機能内蔵型ドライブ制御装置 |
Family Cites Families (1)
| Publication number | Priority date | Publication date | Assignee | Title |
|---|---|---|---|---|
| JP5661222B1 (ja) * | 2014-01-31 | 2015-01-28 | 三菱電機株式会社 | 監視制御システム及び制御装置 |
-
2018
- 2018-08-17 JP JP2019533665A patent/JP6661842B1/ja not_active Expired - Fee Related
- 2018-08-17 WO PCT/JP2018/030474 patent/WO2020035935A1/ja not_active Ceased
Patent Citations (4)
| Publication number | Priority date | Publication date | Assignee | Title |
|---|---|---|---|---|
| JP2006330774A (ja) * | 2005-05-23 | 2006-12-07 | Yokogawa Electric Corp | プロセス異常状態回復操作支援システム |
| JP2008140110A (ja) * | 2006-12-01 | 2008-06-19 | Yokogawa Electric Corp | プロセス解析支援装置およびプロセス解析支援方法 |
| WO2014064819A1 (ja) * | 2012-10-25 | 2014-05-01 | 三菱電機株式会社 | システム構築支援ツール及びシステム |
| WO2016088215A1 (ja) * | 2014-12-03 | 2016-06-09 | 富士電機株式会社 | Plc機能内蔵型ドライブ制御装置 |
Cited By (4)
| Publication number | Priority date | Publication date | Assignee | Title |
|---|---|---|---|---|
| CN115836260A (zh) * | 2020-08-26 | 2023-03-21 | 三菱电机株式会社 | 控制装置及控制方法 |
| JP2022158230A (ja) * | 2021-04-01 | 2022-10-17 | 株式会社キーエンス | プログラマブルロジックコントローラ |
| JP7696224B2 (ja) | 2021-04-01 | 2025-06-20 | 株式会社キーエンス | プログラマブルロジックコントローラ |
| CN118435622A (zh) * | 2022-04-28 | 2024-08-02 | 三菱电机株式会社 | 信息处理装置、控制系统、信息处理方法及程序 |
Also Published As
| Publication number | Publication date |
|---|---|
| JP6661842B1 (ja) | 2020-03-11 |
| JPWO2020035935A1 (ja) | 2020-08-20 |
Similar Documents
| Publication | Publication Date | Title |
|---|---|---|
| CN113614666B (zh) | 用于检测和预测工业过程自动化系统中的故障的系统和方法 | |
| CN102326142B (zh) | 警报趋势汇总显示系统和方法 | |
| JP4948679B1 (ja) | サーボ制御装置の異常診断装置および異常診断システム | |
| JP6661842B1 (ja) | Plcユニット、方法、及びプログラム | |
| CN112737936A (zh) | 一种用于设备预维护的边缘计算网关 | |
| US20140019092A1 (en) | System and Method for Monitoring Process Control System Health | |
| CN205193566U (zh) | 机器人及其生产线设备远程状态监控系统的硬件结构 | |
| JP2021026755A (ja) | 産業用コントローラのデータ完全性を保証するためのaiの使用 | |
| CN113924570A (zh) | 用于工业控制系统中的安全异常检测的用户行为分析 | |
| JP2015530641A (ja) | ヒューマンマシンインターフェース(hmi)デバイスの健康評価のためのシステムおよび方法 | |
| CN108376111A (zh) | 信息处理装置、信息处理方法和记录介质 | |
| US11209809B2 (en) | Data reproduction device for industrial plant | |
| JP2025514626A (ja) | 運用とアセット障害防止の推奨背景 | |
| CN108695855B (zh) | 用于配置负载削减控制器的计算机实现的方法 | |
| US20220035359A1 (en) | System and method for determining manufacturing plant topology and fault propagation information | |
| KR102006125B1 (ko) | 모바일 단말기를 이용한 plc 원격제어 및 모니터링 시스템 및 그 방법 | |
| JP2025156642A (ja) | 分析装置 | |
| WO2014167917A1 (ja) | 状態監視装置、状態監視システム、及び状態監視方法 | |
| KR102117960B1 (ko) | 예비 게이트웨이를 활용한 고가용성 지능형 제어 시스템 및 그 제어 방법 | |
| KR20230090274A (ko) | Ai 기반의 제조 설비 진단 및 챗봇 대응 방법 | |
| JP2022065129A (ja) | メッセージ処理方法、装置、電子装置、記憶媒体、及びプログラム製品 | |
| KR20230081753A (ko) | 통합 데이터 처리 장치 및 방법 | |
| JP2019102037A (ja) | プラント監視装置およびプラント監視方法 | |
| KR102879690B1 (ko) | Ai 기반의 제조 공정 표준 통합 관리 및 모니터링을 위한 방법 | |
| WO2025079097A1 (en) | System and method for detecting anomalies in a network |
Legal Events
| Date | Code | Title | Description |
|---|---|---|---|
| ENP | Entry into the national phase |
Ref document number: 2019533665 Country of ref document: JP Kind code of ref document: A |
|
| 121 | Ep: the epo has been informed by wipo that ep was designated in this application |
Ref document number: 18929869 Country of ref document: EP Kind code of ref document: A1 |
|
| NENP | Non-entry into the national phase |
Ref country code: DE |
|
| 122 | Ep: pct application non-entry in european phase |
Ref document number: 18929869 Country of ref document: EP Kind code of ref document: A1 |