WO2020031532A1 - 性能評価装置、性能評価方法及び性能影響度出力方法 - Google Patents
性能評価装置、性能評価方法及び性能影響度出力方法 Download PDFInfo
- Publication number
- WO2020031532A1 WO2020031532A1 PCT/JP2019/025307 JP2019025307W WO2020031532A1 WO 2020031532 A1 WO2020031532 A1 WO 2020031532A1 JP 2019025307 W JP2019025307 W JP 2019025307W WO 2020031532 A1 WO2020031532 A1 WO 2020031532A1
- Authority
- WO
- WIPO (PCT)
- Prior art keywords
- performance
- parameter
- influence
- function
- given factor
- Prior art date
- Legal status (The legal status is an assumption and is not a legal conclusion. Google has not performed a legal analysis and makes no representation as to the accuracy of the status listed.)
- Ceased
Links
Images

Classifications
-
- F—MECHANICAL ENGINEERING; LIGHTING; HEATING; WEAPONS; BLASTING
- F01—MACHINES OR ENGINES IN GENERAL; ENGINE PLANTS IN GENERAL; STEAM ENGINES
- F01D—NON-POSITIVE DISPLACEMENT MACHINES OR ENGINES, e.g. STEAM TURBINES
- F01D25/00—Component parts, details, or accessories, not provided for in, or of interest apart from, other groups
-
- F—MECHANICAL ENGINEERING; LIGHTING; HEATING; WEAPONS; BLASTING
- F02—COMBUSTION ENGINES; HOT-GAS OR COMBUSTION-PRODUCT ENGINE PLANTS
- F02C—GAS-TURBINE PLANTS; AIR INTAKES FOR JET-PROPULSION PLANTS; CONTROLLING FUEL SUPPLY IN AIR-BREATHING JET-PROPULSION PLANTS
- F02C7/00—Features, components parts, details or accessories, not provided for in, or of interest apart form groups F02C1/00 - F02C6/00; Air intakes for jet-propulsion plants
-
- G—PHYSICS
- G01—MEASURING; TESTING
- G01M—TESTING STATIC OR DYNAMIC BALANCE OF MACHINES OR STRUCTURES; TESTING OF STRUCTURES OR APPARATUS, NOT OTHERWISE PROVIDED FOR
- G01M15/00—Testing of engines
- G01M15/14—Testing gas-turbine engines or jet-propulsion engines
-
- G—PHYSICS
- G01—MEASURING; TESTING
- G01M—TESTING STATIC OR DYNAMIC BALANCE OF MACHINES OR STRUCTURES; TESTING OF STRUCTURES OR APPARATUS, NOT OTHERWISE PROVIDED FOR
- G01M99/00—Subject matter not provided for in other groups of this subclass
-
- G—PHYSICS
- G05—CONTROLLING; REGULATING
- G05B—CONTROL OR REGULATING SYSTEMS IN GENERAL; FUNCTIONAL ELEMENTS OF SUCH SYSTEMS; MONITORING OR TESTING ARRANGEMENTS FOR SUCH SYSTEMS OR ELEMENTS
- G05B23/00—Testing or monitoring of control systems or parts thereof
- G05B23/02—Electric testing or monitoring
-
- Y—GENERAL TAGGING OF NEW TECHNOLOGICAL DEVELOPMENTS; GENERAL TAGGING OF CROSS-SECTIONAL TECHNOLOGIES SPANNING OVER SEVERAL SECTIONS OF THE IPC; TECHNICAL SUBJECTS COVERED BY FORMER USPC CROSS-REFERENCE ART COLLECTIONS [XRACs] AND DIGESTS
- Y02—TECHNOLOGIES OR APPLICATIONS FOR MITIGATION OR ADAPTATION AGAINST CLIMATE CHANGE
- Y02E—REDUCTION OF GREENHOUSE GAS [GHG] EMISSIONS, RELATED TO ENERGY GENERATION, TRANSMISSION OR DISTRIBUTION
- Y02E20/00—Combustion technologies with mitigation potential
- Y02E20/16—Combined cycle power plant [CCPP], or combined cycle gas turbine [CCGT]
Definitions
- the present invention relates to a performance evaluation device, a performance evaluation method, and a performance influence output method.
- Patent Literature 1 discloses that a change in performance of a gas turbine such as a power generation efficiency is determined by using, as variables, an intake air temperature, a compressor outlet pressure, a change amount of a gas turbine output at two times, and a time difference (elapsed time) between the two times.
- the performance of a gas turbine can be modeled using a linear function, and the performance index calculated based on the linear function can be used to exclude effects such as gas turbine output during operation, intake air temperature, compressor outlet pressure, noise, etc. Is described.
- the linear function model described in Patent Literature 1 incorporates elapsed time as a variable and is a model for estimating performance reflecting the influence of performance degradation due to accumulation of operation time.
- elapsed time is a variable for estimating performance reflecting the influence of performance degradation due to accumulation of operation time.
- the linear function model described in Patent Document 1 cannot estimate such performance.
- the present invention provides a performance evaluation device, a performance evaluation method, and a performance influence output method that can solve the above-described problems.
- the performance evaluation device indicates the performance when each of the parameters takes a predetermined value, based on a function indicating a relationship between the performance of the plant and one or more parameters.
- the performance evaluation unit the given factor parameter is an uncontrollable factor included in the operation data collected from the plant and a point indicating the performance corresponding thereto, the given factor parameter Is moved so that at least one of them becomes a predetermined reference value, thereby calculating the standardized performance based on the reference value of the given factor parameter.
- the performance evaluation device includes an operation data acquisition unit that acquires the operation data, a setting reception unit that accepts settings for parameters included in the operation data, and a setting reception unit that includes the operation data.
- a function generation unit that generates a function indicating a relationship between the plurality of parameters and the performance, wherein the setting reception unit receives the selection of the given factor parameter included in the operation data, Forming a given factor parameter group, the function generating unit generates a first function indicating a relationship between the performance included in the operation data and each parameter of the first given factor parameter group, and the performance evaluation unit Sets the value of each parameter of the first given factor parameter group as a respective reference value based on the first function, thereby obtaining the first given factor parameter group. Calculating a first performance value excluding the effect of parameters.
- the setting accepting unit accepts a setting of a parameter that is affected by device deterioration in the first given factor parameter group, and excludes the parameter to set a second given factor.
- the function generation unit forms a parameter group
- the function generation unit generates a second function indicating a relationship between the performance included in the operation data and each parameter of the second given factor parameter group, the performance evaluation unit,
- the second performance value excluding the influence of each parameter of the second given factor parameter group is set by using the value of each parameter of the second given factor parameter group as a reference value based on the second function.
- the performance evaluation unit calculates the difference between the first performance value and the second performance value, and further calculates the deterioration amount of the device.
- the setting accepting unit accepts a setting of one or more maintenance parameters for evaluating the degree of influence among control factor parameters that are controllable factors included in the operation data.
- the function generation unit generates a third function indicating a relationship between the plurality of parameters obtained by adding the maintenance parameter to the first given factor parameter group and the performance, and the performance evaluation unit performs the third function
- the third performance value excluding the influence of the plurality of parameters is calculated by setting the values of the plurality of parameters obtained by adding the maintenance parameter to the first given cause parameter group to the respective reference values based on the first and second parameters.
- the performance evaluation device further includes a performance output unit that outputs a performance value after removing the influence of the given factor parameter calculated by the performance evaluation unit.
- the performance evaluation unit may include: the first performance value excluding the influence of each parameter of the first given factor parameter group calculated based on the first function; The magnitude of the effect of the maintenance parameter on the performance based on the difference between the effect of each parameter of the first given factor parameter group calculated based on the function and the third performance value excluding the effect of the maintenance parameter. Is calculated.
- the performance evaluation unit may determine that the first change amount of the performance value based on the first function in a predetermined period is the second change amount of the performance value based on the third function in the period.
- the degree of influence of the maintenance parameter is calculated based on a value obtained by subtracting the second change amount from the first change amount.
- the apparatus further includes an improvement measure corresponding to the maintenance parameter, and an effect output unit that outputs an effect of the improvement measure based on the degree of influence of the maintenance parameter.
- the performance evaluation method indicates the performance when each of the parameters takes a predetermined value, based on a function indicating a relationship between the performance of the plant and one or more parameters. By moving a point along a multidimensional curved surface indicated by the function so that at least one of the parameters has a predetermined reference value, the performance when the parameter has reached the reference value is calculated.
- a performance evaluation method includes a step of obtaining operation data including a plurality of parameters indicating a state of a plant and performance information, and a given factor parameter that is an uncontrollable factor included in the parameter. And forming a first given factor parameter group, and generating a first function indicating a relationship between the performance included in the operation data and each parameter of the first given factor parameter group. And a first performance excluding an influence of each parameter of the first given factor parameter group by setting a value of each parameter of the first given factor parameter group as a respective reference value based on the first function. Calculating a value.
- the performance evaluation method accepts a setting of one or a plurality of maintenance parameters for evaluating the degree of influence among control factor parameters that are controllable factors included in the operation data. Generating a third function indicating a relationship between the plurality of parameters obtained by adding the maintenance parameter to the first given factor parameter group and the performance; and determining the first given parameter based on the third function. Calculating the third performance value excluding the influence of the plurality of parameters by using the values of the plurality of parameters obtained by adding the maintenance parameters to the factor parameter group as the respective reference values.
- a performance influence output method outputs information on an improvement measure for improving the influence of the maintenance parameter on the performance together with the influence calculated by the above-described performance evaluation method.
- the influence of any factor on the performance of the plant is evaluated, or the original performance of the plant excluding the influence of those factors is evaluated. be able to.
- FIG. 8 is a diagram illustrating an example of a process for excluding an influence of a given factor according to an embodiment of the present invention.
- FIG. 9 is a first diagram illustrating an example of a process for calculating the degree of influence of a control factor according to an embodiment of the present invention.
- FIG. 11 is a second diagram illustrating an example of a process for calculating the degree of influence of a control factor according to an embodiment of the present invention. It is a figure showing an example of an improvement measure to performance degradation related to a control factor and an improvement effect in one embodiment concerning the present invention.
- FIG. 5 is a flowchart illustrating an example of a performance evaluation process according to an embodiment of the present invention. It is a 2nd block diagram of the performance evaluation device in one embodiment of the present invention. 9 is a second flowchart illustrating an example of a performance evaluation process according to an embodiment of the present invention.
- FIG. 1 is a diagram illustrating an example of a hardware configuration of a performance evaluation device according to an embodiment of the present invention.
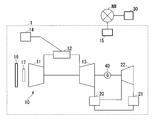
- FIG. 1 is a schematic diagram of a plant to be subjected to performance evaluation in one embodiment according to the present invention.
- a plant 1 targeted for performance evaluation in the present embodiment includes, for example, a gas turbine 10, an exhaust heat recovery boiler 20, a condenser 21, a steam turbine 22, a gas turbine 10,
- This is a gas turbine combined cycle power plant including a generator 40 connected to the rotor of the steam turbine 22 and a control device 15 for controlling these devices.
- the gas turbine 10 includes a compressor 11, a combustor 12, and a turbine 13.
- a filter 16 is provided on the upstream side of the flow in which the compressor 11 sucks air so as not to take in substances in the air that cause deterioration, and a GT (gas turbine) inlet is provided to adjust the amount of air sucked.
- a guide valve (IGV: inlet @ guide @ vane) 17 is provided.
- a fuel line for supplying fuel from the fuel supply source 14 to the combustor 12 is connected to the combustor 12.
- the compressor 11 compresses outside air to generate compressed air.
- the combustor 12 mixes the fuel gas and the compressed air generated by the compressor 11 and burns them to generate a high-temperature combustion gas.
- the turbine 13 is driven to rotate by the combustion gas.
- the exhaust port of the turbine 13 is connected to the exhaust heat recovery boiler 20.
- the exhaust heat recovery boiler 20 generates steam using the exhaust heat discharged from the turbine 13 and the water supplied from the condenser 21, and rotates the steam turbine 22 with the generated steam.
- the generator 40 generates electric power by the rotation of the turbine 13 and the steam turbine 22.
- the steam discharged from the steam turbine 22 is returned to water in the condenser 21, and the water is supplied to the exhaust heat recovery boiler 20.
- the control device 15 acquires the operation data of the plant 1 and controls the gas turbine 10 and the steam turbine 22 so that the load of the generator 40 becomes a desired value.
- the operation data of the plant 1 is, for example, measured values of the load, the temperature, the humidity, and the like of the gas turbine 10.
- the operation data includes a control value (such as an opening command value of the IGV 17) generated by the control device 15 for controlling the plant 1.
- the operation data includes values calculated based on the measured values and the control values (estimated values of state quantities that cannot be directly measured, performance of the plant 1, and the like).
- the operation data includes environmental factors such as temperature and humidity, factors that cannot be controlled by the user who operates the plant such as the load of the plant 1 (these factors are collectively referred to as given factors), and control by the user. Factors that can be performed (called control factors or maintenance factors) are included.
- the given factors include, for example, the load of the plant 1, the load of the gas turbine 10, the fuel calories of the fuel gas supplied to the combustor 12, and the supply of the steam from the steam turbine 22 to the condenser 21.
- the temperature of the water (condenser inflow water temperature), the atmospheric pressure of the air sucked by the compressor 11, the temperature, the humidity, and the like.
- the performance evaluation device 30 can perform the performance evaluation of the plant 1 excluding the influence of these given factors on the performance of the plant 1.
- the control factors include, for example, GT inlet pressure loss, GT exhaust pressure loss, GT inlet guide valve angle, compressor efficiency, fuel gas temperature, TCA (turbine cooling air) cooler (cooling that is extracted from the compressor 11 and supplied to the turbine 13).
- the GT inlet pressure loss can be improved by replacing the filter 16, for example.
- GT exhaust pressure loss can be improved by cleaning the exhaust heat recovery boiler 20.
- the GT inlet guide valve angle can be controlled by the control of the control device 15.
- the compressor efficiency can be improved by cleaning the blades of the compressor 11 or the like.
- the fuel gas temperature can be controlled by the control of the control device 15.
- the heat exchange rate of the TCA cooler can be improved by cleaning the heat exchanger of the TCA cooler.
- the degree of vacuum and the condenser temperature of the condenser 21 can be improved by cleaning the condenser 21.
- the performance evaluation device 30 of the present embodiment can evaluate the degree of influence of these control factors on the performance of the plant 1.
- the control device 15 and the performance evaluation device 30 are connected via a network (NW).
- the control device 15 transmits operation data including the given factor, the control factor, and the performance information of the plant 1 to the performance evaluation device 30 via the NW.
- the performance evaluation device 30 calculates the original performance information of the device excluding the influence of the given factor from the performance information.
- the performance evaluation device 30 calculates the difference between the performance information excluding the influence of the control factor from the performance information and the performance information before the exclusion, and calculates the degree of influence of the control factor on the performance of the plant 1.
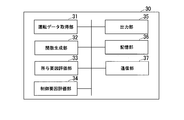
- FIG. 2 is a block diagram of a performance evaluation device according to an embodiment of the present invention.
- the performance evaluation device 30 includes an operation data acquisition unit 31, a function generation unit 32, a given factor evaluation unit 33, a control factor evaluation unit 34, an output unit 35, a storage unit 36, and a communication unit 37. ing.
- the operation data acquisition unit 31 acquires the operation data transmitted by the control device 15 and records the operation data in the storage unit 36.
- the function generating unit 32 generates a function or a model indicating the relationship between the performance information and the given factor and the control factor using the operation data.
- the function generation unit 32 generates a function by a statistical method such as a multiple regression analysis or a neural network.
- the given factor evaluation unit 33 excludes the influence of the given factor from the performance information of the plant 1 included in the operation data. Specifically, when the value of the performance value Y1 is y1 when the given factors X1, X2,..., Xn take certain values x1, x2,. Represents a point indicating the relationship of (x1, x2,..., Xn, y1), where the values of the given factors X1 to Xn are reference values determined for each of the given factors X1 to Xn. As described above, the movement is performed along the multidimensional curved surface indicated by the function generated by the function generation unit 32, and the value of the performance value Y1 at the point after the movement is calculated.
- the values of a plurality of pieces of performance information achieved under the conditions of various given factors included in the driving data are aligned with the performance information under one reference condition, and the difference between the given factors is determined. You can compare without worrying. In other words, the influence of a given factor is excluded from a plurality of pieces of performance information, and standardized performance information can be obtained.
- standardization processing will be described with reference to FIG.
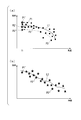
- FIG. 3 is a diagram illustrating an example of a process for excluding the influence of a given factor according to an embodiment of the present invention.
- FIG. 3 shows the relationship between the efficiency of the plant 1 as an example of the performance information and the temperature (air temperature) of the air sucked by the compressor 11 as an example of the given factor.
- the efficiency can be calculated by dividing the output of the plant 1 by the amount of fuel injected into the combustor 12 (fuel flow rate) and fuel calories.
- FIG. 3A is a graph showing the relationship between efficiency (vertical axis) and temperature (horizontal axis).
- the square points represent the relationship between the air temperature included in the operation data acquired at different points in time, the fuel flow rate and the fuel calories included in the operation data, and the efficiency calculated using the output of the plant 1.
- a curve L1 indicates a function generated by the function generating unit 32 from a point indicated by a square by a simple regression analysis or the like. If there are a plurality of given factors, a function can be generated by multiple regression analysis. In general, the plant 1 can operate with higher efficiency as the temperature is lower, and the efficiency decreases as the temperature increases.
- the curve L1 includes such a relationship between the temperature and the efficiency of the plant 1, and does not necessarily indicate the performance of the plant 1 alone. For example, comparing point P1 with point P3, the efficiency at point P1 is higher. However, the performance of the plant 1 at the point P1 is not always higher than the performance of the plant 1 at the point P3. For example, although the performance of the plant 1 at the point P1 is deteriorated compared to the performance at the point P3, the efficiency of the point P1 may be high due to a good operating environment (low temperature). Therefore, the given factor evaluation unit 33 performs a standardization process that excludes the influence of the given factor (temperature).
- the efficiency achieved under various temperatures is standardized by converting the efficiency under the temperature T1 into efficiency.
- the given factor evaluation unit 33 moves each of the points indicated by the squares along the curve L1 such that the temperature value corresponding to each point is T1.
- the point P1 is moved as indicated by a broken arrow.
- the point P1 moves to the star point P1 '.
- the efficiency value at the point P1 ' is the efficiency after standardization (under the temperature T1).
- the points P2 and P3 are moved to the star points P2 'and P3', respectively, according to the dashed arrows extending along the curve L1 from each point.
- the value of the efficiency at the point P2 'after the movement is the efficiency after the standardization at the point P2.
- the value of the efficiency at the point P3 'after the movement is the efficiency after the standardization at the point P3.
- FIG. 3B is a graph showing the relationship between the efficiency (vertical axis) and the time at which the efficiency was obtained (horizontal axis).
- the graph of FIG. 3B is obtained by re-plotting the efficiency values at each time point after the standardization obtained by the above processing on a graph showing the relationship between the time at which the efficiency was achieved and the efficiency.
- the curve L2 is an approximate curve generated by the function generation unit 32 from a point indicated by an asterisk by regression analysis or the like.
- a curve L2 indicates that the efficiency gradually decreases with time. For example, assuming that the points P1 'to P3' are points based on the operation data obtained every month in this order, the performance deteriorates in the order of the points P1 'to P3' over time.
- the curve L2 indicates that the performance of the plant 1 is degraded over time irrespective of the temperature fluctuation during this time.
- ⁇ By setting the value of a given reference factor as a condition for performance evaluation, performance under a desired condition can be estimated. For example, if the operation data of a plant operating in an environment where the annual temperature is 5 ° C to 35 ° C is accumulated, the same type of plant is newly introduced in an area where the temperature is 25 ° C to 30 ° C throughout the year. In this case, the performance information achieved in the environment of 5 ° C. to 35 ° C. by the above processing is standardized to the performance information at a predetermined reference value at 25 ° C. to 30 ° C., so that the performance of the plant in the relevant area is Can be estimated.
- the control factor evaluation unit 34 calculates the degree of influence of the control factor.
- the calculation process of the degree of influence of the control factor will be described with reference to FIG.
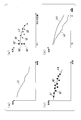
- FIG. 4 is a first diagram illustrating an example of a process of calculating the degree of influence of a control factor according to the embodiment of the present invention.
- FIG. 4A shows a graph in which the performance information after removing the influence of the given factor is plotted in time series. This is the same graph as the curve L2 in FIG.
- the function generation unit 32 generates a function indicating the relationship between one or a plurality of control factors and a given factor including the parameters excluded in the step described with reference to FIG. 3 and the performance information by a method such as a multiple regression analysis.
- the given factor evaluation unit 33 performs the standardization process for excluding the effect of the given factor from the result of the multiple regression analysis.
- the control factor evaluation unit 34 performs a process of excluding the influence of the control factor.
- FIG. 4B shows a graph in which the relationship between GT inlet pressure loss (control factor) and efficiency is extracted from the multidimensional curved surface obtained as a result of the multiple regression analysis (curve L3).
- the control factor evaluation unit 34 calculates the points Q1 to Q3 represented by the relationship between the control factor and the performance information in the same manner as the given factor evaluation unit 33, using the value of the control factor parameter. Is processed along the curved surface of the function (curve L3) until the reference value (Pr1) is reached.
- the efficiency at points Q1 'to Q3' is a value after standardization, that is, the efficiency when the value of the GT inlet pressure loss is Pr1. If the GT inlet pressure loss is large, the efficiency also decreases. For example, the efficiency at point Q3 is an efficiency including a performance decrease due to a greater GT inlet pressure loss than the efficiency shown at point Q1.
- the points Q1 'to Q3' excluding the influence of the GT inlet pressure loss can be calculated from the efficiencies indicated by the points Q1 to Q3.
- FIG. 4C shows a graph in which performance values excluding the influences of environmental factors and control factors are plotted in time series.
- the curve L4 is an approximate curve generated by the function generation unit 32 from the plotted points by regression analysis or the like.
- the control factor evaluation unit 34 compares the difference between the curve L2 obtained by excluding only the influence of the given factor and the curve L4 obtained by excluding the effect of the control factor in addition to the given factor, and (Eg, GT inlet pressure loss) is calculated.
- FIG. 4D shows a graph comparing the curves L2 and L4.
- Curve L2 includes the effect of GT inlet pressure loss. As the operation time of the plant 1 increases, the GT inlet pressure loss increases due to clogging of the filter 16 and the like.
- the efficiency of the curve L2 includes a decrease due to an increase in the GT inlet pressure loss
- the decrease in the efficiency of the curve L2 is larger than that of the curve L4. This difference in efficiency is due to the GT inlet pressure loss.
- the GT inlet pressure loss is a control factor and is controllable. For example, if the GT 16 pressure loss is improved by replacing the filter 16 at the time T1, the efficiency of the plant 1 is reduced, for example. There is a possibility that the efficiency indicated by the curve L4 can be improved.
- the control factor evaluation unit 34 calculates the amount of change in performance between two time points (T1, T2) before the exclusion of the influence of the control factor and the change in performance between the same two time points after the exclusion of the influence of the control factor. The difference is calculated by comparing the amount. The calculated difference is the degree of influence of the control factor.
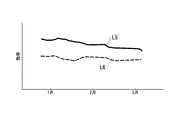
- FIG. 5 is a second diagram illustrating an example of a process of calculating the degree of influence of a control factor according to the embodiment of the present invention.
- FIG. 5 shows an example of a performance curve (solid line) obtained by excluding only the influence of a given factor and an example of a performance curve (dashed line) obtained by excluding the effects of a given factor and a control factor (GT inlet pressure loss).
- GT inlet pressure loss a control factor
- the control factor evaluation unit 34 calculates the difference between 0.5 and 0.2, and sets 0.3 as the degree of influence of the GT inlet pressure loss.
- the control factor evaluation unit 34 specifies that the improvement measure for the reduction in efficiency is replacement of the filter 16, and sets the improvement effect to the same value 0.3 as the calculated degree of influence.
- the control factor evaluation unit 34 may add the fuel price or the like to 0.3%, calculate a cost (fuel cost) that can be saved during this time, and use this cost as the degree of influence.
- Improvement measures are predetermined for each control factor.
- the improvement measures for the control factors other than the GT inlet pressure loss are, for example, the improvement measures for the GT exhaust pressure loss are cleaning of the exhaust heat recovery boiler 20, and the improvement measures for the compressor efficiency are the cleaning of the blades of the compressor 11, etc. It is.
- the control factor evaluation unit 34 performs the above-described calculation processing of the degree of influence and the processing of identifying the improvement measure for each of the plurality of control factors, calculates the degree of influence of each control factor, Identify the improvement effects of the introduction.
- the control factor evaluation unit 34 may perform the calculation process of the degree of influence and the process of specifying the improvement measure in units of the plurality of control factors as one group. Good.
- the fact that there is a strong correlation between a plurality of control factors means that, for example, when a lot of dust in the air is contained, the filter 16 is easily clogged between the GT inlet pressure loss and the compressor efficiency (GT inlet). Pressure loss increases) and the compressor is also easily contaminated (compressor efficiency decreases). Further, from the viewpoint of efficiency, when the GT inlet pressure loss simply increases or when the efficiency of the compressor 11 decreases.
- the function generation unit 32 generates a function including a relationship between two parameters of GT inlet pressure loss and compressor efficiency and performance information.
- the control factor evaluation unit 34 performs a process of simultaneously standardizing the two parameters, and determines the difference between the performance information when the values of the two parameters of the GT inlet pressure loss and the compressor efficiency are equalized to the reference value and the performance information before the standardization.
- the degree of influence of the control factor is evaluated by calculation. If the air in the operating environment of the plant contains a large amount of dust, the value of the degree of influence increases.
- the user can plan replacement of the filter 16 and cleaning of the compressor 11 based on the evaluation result.
- the control factor evaluator 34 specifies a specific combination of the two. Improvement measures may be presented. If the air in the operating environment of the plant is not in an air state (including a large amount of dust, etc.) that strongly affects the correlation between the GT inlet pressure loss and the compressor efficiency, the control factor evaluation unit 34 determines whether the two control factors correspond to each other. The degree of influence calculated for the combination does not become a large value. In that case, the user considers the execution of another improvement measure having a large impact.
- the output unit 35 outputs a graph of the performance information after removing the influence of the given factor (for example, FIG. 3B).
- the user can grasp the original performance of the equipment of the plant 1 and the change in the performance (such as the degree of deterioration) by looking at the performance curve excluding the influence of the given factor.
- the output unit 35 performs comparison output between a graph excluding only the influence of the given factor illustrated in FIG. 5 and a graph excluding the influence of the given factor and the control factor.
- the output unit 35 displays a list of the improvement measures identified by the control factor evaluation unit 34 and the improvement effects, for example, ranked in descending order of improvement effect.
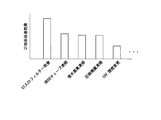
- FIG. 6 is a diagram illustrating an example of an improvement measure for performance deterioration related to a control factor and an improvement effect according to the embodiment of the present invention.
- FIG. 6 shows a list of improvement measures and improvement effects.
- replacement of the GT inlet filter (filter 16), cleaning of the HRSG (exhaust heat recovery boiler 20) tube, and the like are displayed in order from the left, together with the respective improvement effects, in order from the improvement measure with the highest performance improvement effect. Have been.
- the user can see the list to understand how much the performance of the plant 1 can be improved by taking care of the control factors.
- the improvement effect is a value based on each degree of influence, and in the example of FIG.
- the output unit 35 may also display, for example, the costs (various costs, the time required for introduction, the loss due to power generation stoppage at the time of introduction, etc.) required to introduce the improvement measures beside the bar graph of the improvement effect. . The user can consider the introduction of the improvement measures more comprehensively while considering the cost.
- the storage unit 36 stores the operation data, the function generated by the function generation unit 32, the graph after excluding the influence of the given factor, the graph after excluding the effect of the given factor and the control factor, and the effect for each control factor.
- a correspondence table between degrees, control factors and improvement measures is stored.
- the communication unit 37 performs data communication with the control device 15. Since the communication unit 37 can acquire operation data from the plant 1 in real time, the performance evaluation device 30 can appropriately evaluate the current performance of the plant 1 based on the latest operation data. For example, a change in performance of the plant 1 excluding the influence of a given factor can be grasped every day. Since deterioration of performance due to control factors can be grasped in real time, improvement measures can be introduced at appropriate timing to maintain performance.
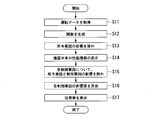
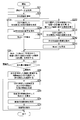
- FIG. 7 is a flowchart illustrating an example of the performance evaluation process according to the embodiment of the present invention.
- the flow of the performance evaluation process will be described with reference to FIG.
- the operation data acquisition unit 31 acquires operation data from the control device 15 via the communication unit 37 (Step S11).
- the operation data includes parameters of given factors such as load and temperature of the plant 1, parameters of control factors such as GT inlet pressure loss, and performance information about the plant 1 such as efficiency of the gas turbine 10.
- the performance information may be obtained by acquiring operation data necessary for calculating the performance information and calculating the performance data on the performance evaluation device 30 side.
- the operation data acquisition unit 31 records the acquired operation data in the storage unit 36.
- the function generation unit 32 generates a function (step S12).
- the function generating unit 32 reads, from the storage unit 36, a large number of sets of operation data including a plurality of given factors, a plurality of control factors, and one piece of performance information at the same time point, and generates a function indicating the relationship between them. .
- a method such as a multiple regression analysis or a neural network can be used to generate the function.
- the function generation unit 32 records the generated function in the storage unit 36.
- the given factor evaluation unit 33 excludes the influence of the given factor from the performance information by using the function obtained by the multiple regression analysis or the like (step S13). Specifically, as described with reference to FIG. 3, the given factor evaluation unit 33 includes the load on the plant 1, the load on the gas turbine 10, the fuel calories, the condenser inflow water temperature, the atmospheric pressure, the temperature, the humidity, and the like. Of the given factor parameter is normalized to exclude the influence of the difference in the value of the given factor parameter on the performance information. The given factor evaluation unit 33 records the standardized value of each given factor, the value of the control factor, and the performance information after the standardization in the storage unit 36 in association with each other.
- the output unit 35 displays the original performance information of the device excluding the influence of the given factor (step S14).
- the output unit 35 acquires the performance information after removing the influence of the given factor from the storage unit 36, and displays and visualizes, for example, the graph illustrated in FIG. 3B.
- the user can grasp the original performance and the degree of deterioration of the equipment of the plant 1. For example, in the case where a part of the equipment is damaged, even if the change in performance due to the damage is difficult to confirm due to the fluctuation of the given factor, the performance information after excluding the influence of the given factor Is displayed, a change in performance can be accurately detected.
- step S15 a process of excluding the influence of each given factor and control factor from the performance information is performed (step S15).
- the given factor evaluation unit 33 performs a process of standardizing each of the given factor parameters.
- the control factor evaluation unit 34 performs a process of standardizing the control factor parameter for one of the control factors.
- the control factor evaluator 34 performs, for example, individual standardization processing for each of the GT inlet pressure loss, GT exhaust pressure loss, GT inlet guide valve angle, compressor efficiency, fuel gas temperature, TCA cooler heat exchange rate, and condenser vacuum degree. I do.
- the control factor evaluation unit 34 calculates, for each control factor, the performance information excluding the influence of the control factor and the given factor on the performance information, the value of each standardized given factor, the value of each standardized control factor, and , And the values of other control factors are recorded in the storage unit 36 in association with each other.
- control factor evaluation unit 34 calculates the degree of influence of each control factor (step S16). For example, when calculating the degree of influence of the GT inlet pressure loss, the control factor evaluating unit 34 calculates performance information (performance A) excluding the influence of the given factor calculated in step S15 and the effect on the performance of the GT inlet pressure loss, The difference from the performance information (performance B) excluding the influence on the performance of the given factor calculated in step S13 is calculated to calculate the degree of influence. More specifically, as described with reference to FIG. 5, the control factor evaluation unit 34 calculates the difference between the change amount of the performance A and the change amount of the performance B at two time points.
- the control factor evaluation unit 34 calculates the degree of influence not only on the GT inlet pressure loss but also on other control factors such as the GT exhaust pressure loss, the GT inlet guide valve angle, and the compressor efficiency.
- the control factor evaluation unit 34 records the calculated influence degree in the storage unit 36 for each control factor. If there is a relationship between the control factor and the performance deterioration, the degree of influence of the control factor becomes a larger value (for example, the change over time of the performance information after the exclusion of the influence of the control factor is larger than the change over time of the performance information before the exclusion). Is smaller, the degree of influence is small when there is no effect on performance degradation.
- the output unit 35 displays a remedy (Step S17). Specifically, the output unit 35 displays a graph in which improvement measures such as those illustrated in FIG. 6 are ranked in order of influence (in order of improvement effect). This allows the user to understand which control factors affect the performance and the degree of the influence.
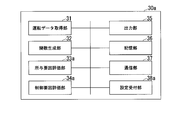
- FIG. 8 is a second block diagram of the performance evaluation device in one embodiment according to the present invention.
- the performance evaluation device 30a includes an operation data acquisition unit 31, a function generation unit 32, a given factor evaluation unit 33a, a control factor evaluation unit 34a, an output unit 35, a storage unit 36, a communication unit 37, And a receiving unit 38a.
- the setting receiving unit 38a receives setting of parameters related to performance evaluation. For example, the setting receiving unit 38a receives a setting of a parameter of a given factor (first given factor parameter group) whose influence on performance is to be excluded. The setting receiving unit 38a receives a setting of a parameter that is affected by the deterioration of the equipment constituting the plant 1 in the first given factor parameter group. The setting receiving unit 38a receives setting of a parameter (maintenance parameter) of a control factor whose effect on performance is to be grasped.
- the function generation unit 32 generates a function indicating a relationship between the performance of the plant 1 included in the operation data and a given factor included in the operation data. For example, the function generating unit 32 generates a first function indicating a relationship between each parameter of the first given factor parameter group and performance. The function generation unit 32 generates a second function indicating the relationship between each parameter of the second given factor parameter group obtained by excluding the parameter affected by the deterioration of the device from the first given factor parameter group and the performance of the plant 1. I do. The function generating unit 32 generates a third function indicating a relationship between a plurality of parameters obtained by adding a maintenance parameter to the first given factor parameter group and the performance of the plant 1.
- the given factor evaluation unit 33a based on the performance generated by the function generation unit 32 and the first function indicating the relationship between the parameters of the first given factor parameter group, as in the first embodiment, The performance of the plant 1 excluding the influence of each parameter is calculated by setting the value to a reference value defined for each. Similarly, the given factor evaluator 33a sets the value of each parameter of the second given factor parameter group to a respective reference value based on the second function, so that the influence of each parameter of the plant 1 is eliminated. Calculate performance.
- the control factor evaluation unit 34a based on the third function generated by the function generation unit 32 by adding the maintenance parameter to the first given factor parameter group, as in the first embodiment, By setting the values of the group and the added maintenance parameter to reference values defined for each, the performance of the plant 1 excluding the influence of each parameter and the maintenance parameter of the first given factor parameter group is calculated.
- the control factor evaluation unit 34a performs the performance of the plant 1 excluding the influence of each parameter of the first given factor parameter group and the maintenance parameter, and the performance of the plant 1 excluding the influence of each parameter of the first given factor parameter group. Then, the degree of influence of the maintenance parameter is calculated based on the difference.
- FIG. 9 is a second flowchart illustrating an example of the performance evaluation process according to the embodiment of the present invention. Processing similar to that in FIG. 7 will be described briefly.
- the operation data acquisition unit 31 acquires time-series operation data from the control device 15 via the communication unit 37 (Step S21).
- the operation data includes parameters of given factors such as load of plant 1, temperature, filter 16 differential pressure (pressure difference before and after filter 16), parameters of control factors such as GT inlet pressure loss, and efficiency of plant 1.
- performance information on the plant 1 for a predetermined period for example, three months is included.
- the user selects any given factor (step S22) and inputs it to the performance evaluation device 30a.
- the user specifies, from the selected given factors, a given factor related to equipment that affects the performance degradation of the plant 1 to be examined, and inputs the specified given factor to the performance evaluation device 30a.
- a given factor related to equipment that affects the performance degradation of the plant 1 to be examined For example, the user selects and inputs “load”, “atmospheric pressure”, “temperature”, “humidity”, and “filter 16 differential pressure” as arbitrary given factors, and among these, influences on performance degradation are selected.
- “Filter 16 differential pressure” is specified as a parameter related to a certain device, and is input to the performance evaluation device 30a.
- the given factor related to the device that affects the performance degradation is also a parameter that is affected by the degradation of the device (the filter 16).
- the setting receiving unit 38a acquires each parameter of the given factor input by the user.
- the setting reception unit 38a forms an arbitrary given factor selected
- the given factor evaluation unit 33a instructs the function generation unit 32 to generate a function indicating the relationship between the given factor selected in step S22 and the performance.
- the function generation unit 32 determines each parameter (in the above example, “load”, “atmospheric pressure”, “temperature”, “humidity”, and “filter 16 differential pressure”) and performance (for example, “filter 16 differential pressure”) in the first given factor parameter group. Efficiency)) from the operating data.
- the function generating unit 32 generates a function (first function) indicating the relationship between each parameter of the first given factor parameter group and the performance based on the extracted data (step S231). For example, the function generator 32 performs multiple regression analysis with the objective variable being “efficiency” and the explanatory variables being “load”, “atmospheric pressure”, “temperature”, “humidity”, and “filter 16 differential pressure”.
- One function f1 is calculated.
- the given factor evaluation unit 33a performs a standardization process on each parameter of the first given factor parameter group selected in step S22, and excludes the influence of each given factor (step S241). For example, when the efficiency of the plant 1 greatly fluctuates according to the load (for example, the performance is good when operating at the rated load, and the performance decreases when operating at the partial load), the first function f1 indicates Since the performance of three months (for example, the efficiency of the plant 1 obtained by dividing the output of the plant 1 by the fuel calorie and the fuel flow rate) is affected by the load fluctuation, the influence of the load fluctuation must be excluded. For example, the original performance of the plant 1 cannot be grasped.
- the given factor evaluation unit 33a performs a standardization process on the parameter “load” of the first function f1 using, for example, an average value of loads for three months as a reference value. Similarly, a standardization process is performed on the other parameters of the first given factor parameter group, so that the effects of all the parameters included in the first given factor parameter group are excluded.
- a model (Model 1) indicating the parameters and the performance of the plant 1 is calculated (step S251). Model1 includes each parameter and performance of the first given factor parameter group after the standardization processing.
- the performance evaluation device 30a executes the following processes of steps S222 to S252 separately from the processes of steps S231 to S251. That is, the setting reception unit 38a excludes a factor related to a device (device for which deterioration is to be examined) whose effect on performance is to be examined among the given factors selected by the user in step S22 (step S222). In the above example, the setting receiving unit 38a excludes “filter 16 differential pressure” from “load”, “atmospheric pressure”, “air temperature”, “humidity”, and “filter 16 differential pressure”. The setting receiving unit 38a forms, as a second given factor parameter group, a parameter group obtained by removing parameters related to the device from the first given factor parameter group.
- the given factor evaluation unit 33a instructs the function generation unit 32 to generate a function indicating the relationship between the given factor (second given factor parameter group) selected in step S222 and the performance.
- the function generation unit 32 calculates the parameters (“load”, “atmospheric pressure”, “temperature”, “humidity”) and performance (eg, “efficiency”) of the second given factor parameter group in the operation data. Extract from The function generating unit 32 generates a function (second function) indicating a relationship between each parameter of the second given factor parameter group and the performance based on the extracted data (step S232). For example, the function generation unit 32 calculates a second function f2 by performing multiple regression analysis with the objective variable being “efficiency” and the explanatory variables being “load”, “atmospheric pressure”, “temperature”, and “humidity”.
- the given factor evaluation unit 33a excludes the influence of each given factor by performing a standardization process on the value of each parameter of the second given factor parameter group (step S242).
- a standardization process is performed on each parameter using the same reference value as in step S241.
- the given factor evaluation unit 33a generates a model (Model2) including each parameter and performance of the second given factor parameter group when the influence on all parameters included in the second given factor parameter group is excluded. It is calculated (step S252).
- the given factor evaluation unit 33a specifies the influence (deterioration amount) of the factor of the device on the performance from the difference between Model1 and Model2 (Step S26).
- Model 1 includes the efficiency excluding the influence of each parameter of the first given factor parameter group including “filter 16 differential pressure”
- Model 2 includes the second given factor parameter group excluding “filter 16 differential pressure”.
- the given factor evaluation unit 33a calculates a difference between the efficiency indicated by Model1 and the efficiency indicated by Model2, and identifies the difference as an effect of a factor relating to the device (“filter 16 differential pressure”) on performance.
- the given factor evaluation unit 33a compares the specified effect (deterioration amount) on performance with a predetermined threshold (step S27). If the deterioration amount is within the threshold, the processing of this flowchart ends.
- the control factor evaluation unit 34a specifies the device related to the parameter of the given factor whose deterioration amount is outside the threshold value, and selects the control factor related to the device and the device selected in step S22.
- the giving factor is selected (step S28).
- the device related to the parameter of the given factor (“filter 16 differential pressure”) whose deterioration amount has exceeded the threshold is “filter 16”, and the control factor related to the device is “GT inlet pressure loss”. is there.
- the correspondence between a given factor that affects the performance degradation, a device, and a control factor related to the device is predetermined.
- control factor evaluation unit 34a causes the function generation unit 32 to generate a function of the control factor (maintenance parameter) selected in step S28, a given factor (each parameter of the first given factor parameter group), and performance.
- the function generation unit 32 adds the parameter of “GT inlet pressure loss” to the first given factor parameter group selected in step S22, and indicates a function indicating the relationship between the plurality of added parameters and the performance of the plant 1 (
- a third function is generated (step S29).
- the function generation unit 32 sets the objective variable as “efficiency” and the explanatory variables as “load”, “atmospheric pressure”, “temperature”, “humidity”, “filter 16 differential pressure”, and “GT inlet pressure loss”.
- a third function f3 is calculated by performing a regression analysis.
- the control factor evaluation unit 34a excludes the influence of each parameter by setting each of the values of the maintenance parameters in addition to each parameter of the first given factor parameter group to a predetermined reference value. For example, when the performance of the plant 1 fluctuates in accordance with the “GT inlet pressure loss”, the performance of the plant 1 for three months indicates an increase in the GT inlet pressure loss (clogging of the filter 16 due to an increase in the operation time of the plant 1). And the pressure loss gradually increases).
- the performance value calculated by the first function f1 includes an effect of a decrease in the performance of the plant 1 due to an increase in the GT inlet pressure loss.
- the control factor evaluation unit 34a sets all parameters included in the first given factor parameter group as A model (Model 3) including each parameter and performance when the influence on the maintenance parameter is excluded is calculated (step S30).
- a standardization process is performed on each parameter of the first given factor parameter group using the same reference value as in step S241.
- control factor evaluation unit 34a specifies an improvement effect of the device (step S31). For example, the control factor evaluation unit 34a calculates the degree of influence of the control factor (maintenance parameter), and specifies an improvement effect based on the degree of influence. The control factor evaluation unit 34a may calculate the difference between Model1 and Model3 as the degree of influence. For example, the control factor evaluating unit 34a calculates the first factor calculated by performing the standardization process on each parameter of the first given factor parameter group based on the first function f1 in a predetermined period (three months from January to March).
- a third performance value calculated by performing a standardization process on a first given factor parameter group and a maintenance parameter based on a change amount of a performance value (performance B: for example, a solid line graph L5 in FIG. 5) and a third function f3.
- Performance B for example, a solid line graph L5 in FIG. 5
- a third function f3. (Performance A: For example, a difference from the change amount of the broken line graph L6 in FIG. 5) may be calculated.
- the device is a device corresponding to the “given factor related to the device that affects the performance degradation” input in step S22.
- the decrease in efficiency (0.5%) indicated by the graph L5 includes the effect of the fluctuation of the GT inlet pressure loss during this period, and the decrease in efficiency (0%) indicated by the graph L6. .2%) excludes the effect of fluctuations in GT inlet pressure loss during this period.
- the difference (0.3%) between the performance degradation of the graph L5 and the performance of the graph L6 is the influence of the GT inlet pressure loss.
- the GT inlet pressure loss in March is larger than the GT inlet pressure loss in January, and the output efficiency of the plant 1 is much lower in March than in January due to the effect of the GT inlet pressure loss. It is considered to indicate that.
- the control factor evaluation unit 34a calculates the difference between 0.5 and 0.2, and sets 0.3 as the degree of influence of the GT inlet pressure loss.
- the control factor evaluation unit 34a specifies that the improvement measure for the efficiency reduction is replacement of the filter 16, and specifies that the improvement effect is the same value 0.3 as the calculated degree of influence.
- the control factor evaluation unit 34a may add the fuel price or the like to 0.3%, calculate the cost (fuel cost) that can be saved during this time, and specify this cost as the degree of influence or the improvement effect.
- the output unit 35 displays a remedy (Step S32). Specifically, the output unit 35 displays a graph in which improvement measures such as those illustrated in FIG. 6 are ranked in order of influence (in order of improvement effect). This allows the user to understand which control factors affect the performance and the degree of the influence. By obtaining the latest operation data from the plant 1 as needed through the communication unit 37 and performing the processing of steps S21 to S32, it is possible to grasp the maintenance work necessary for the current plant.
- step S22 the user specifies other given factors whose effect on performance is to be examined, and by repeating the same processing, it is possible to calculate an improvement effect for other control factors.
- the control factor evaluator 34a similarly calculates the maintenance parameters other than the GT inlet pressure loss such as the GT exhaust pressure loss, the GT inlet guide valve angle, and the compressor efficiency at two time points (for example, January and March).
- the difference between the change amount of the first performance value (performance B) and the change amount of the third performance value (performance A) is calculated.
- the control factor evaluation unit 34a records the calculated degree of influence in the storage unit 36 for each control factor. If there is a relationship between the control factor and the performance degradation as in the above example, the change with time (second change amount) of the performance after excluding the influence of the control factor is the change with time of the performance before the exclusion. (First change amount).
- step S28 when there is a group of control factors having a strong correlation of the degree of influence on the performance of the plant 1, the process from step S28 may be performed by adding the group to the explanatory variable for each group. For example, when the correlation between the GT inlet pressure loss and the compressor efficiency is strong, the multiple regression analysis is performed by adding the GT inlet pressure loss and the compressor efficiency in addition to the first given factor parameter group. Then, in addition to the first given factor parameter group, a standardization process is performed on the maintenance parameters “GT inlet pressure loss” and “compressor efficiency” to calculate the degree of influence of “GT inlet pressure loss” and “compressor efficiency”. .
- the given factors and control factors are not limited to those exemplified above. For example, by performing a process of calculating the degree of influence on a control factor whose contribution to performance is unknown, it can be used for the purpose of finding out what control factor parameter contributes to performance. Not only for the control factor, but also for a given factor, comparing the performance information before and after excluding the effect of the given factor on the performance, determines how much the given factor affects the performance. You can check.
- the function generator 32 generates a function f4 indicating the relationship between “atmospheric pressure”, “humidity”, “load”, and “efficiency”.
- the given factor evaluation unit 33a calculates the efficiency (performance B) when the value of “load” is set to each reference value.
- the function generation unit 32 adds a parameter “temperature” of a given factor, and generates a function f4 ′ indicating a relationship between “atmospheric pressure”, “humidity”, “load”, “temperature” and “efficiency”. I do.
- the given factor evaluation unit 33a calculates the efficiency (performance A) when the values of “load” and “temperature” are set to the respective reference values.
- the given factor evaluation unit 33a calculates the difference between the change amount of the performance A and the change amount of the performance B during the three months, thereby calculating the degree of influence of the given factor “air temperature” on the performance. it can.
- the performance information after excluding the influence of the given factor is further examined for the degree of influence of control acceptance.
- the processing for calculating the degree of influence of the control information is not limited to this.
- the influence of the control factor is calculated without excluding the influence of the given factor, and by comparing them, the environment where the temperature is high can be calculated. It is possible to distinguish between a control factor that is effective (having a large influence) in (summer) and a control factor that is effective in an environment with low temperature (winter). For example, when the humidity is high, the filter 16 is quickly clogged. By calculating the degree of influence of the GT inlet pressure loss based on the operation data at the time when the humidity is high, it is possible to plan the replacement timing of the filter 16 and the like.
- the output unit 35 may output a graph (for example, a graph L6 in FIG. 5) after removing the influence of the control factor as well as the given factor. Thereby, the user can confirm a change in performance after excluding the influence of the control factor. For example, when a plant is introduced in an environment where the GT inlet pressure loss is high, the performance after the introduction can be estimated by standardizing the performance data to a reference value having a high GT inlet pressure loss.
- FIG. 10 is a diagram illustrating an example of a hardware configuration of a performance evaluation device according to an embodiment of the present invention.
- the computer 900 is, for example, a PC (Personal Computer) or a server terminal device including a CPU 901, a main storage device 902, an auxiliary storage device 903, an input / output interface 904, and a communication interface 905.
- the above-described performance evaluation devices 30 and 30a are mounted on a computer 900.
- the operation of each processing unit described above is stored in the auxiliary storage device 903 in the form of a program.
- the CPU 901 reads out the program from the auxiliary storage device 903, expands the program in the main storage device 902, and executes the above processing according to the program.
- the CPU 901 secures a storage area corresponding to the storage unit 36 in the main storage device 902 according to a program.
- the CPU 901 secures a storage area for storing data being processed in the auxiliary storage device 903 according to a program.
- the auxiliary storage device 903 is an example of a non-transitory tangible medium.
- Other examples of the non-transitory tangible medium include a magnetic disk, a magneto-optical disk, a CD-ROM, a DVD-ROM, and a semiconductor memory connected via the input / output interface 904.
- this program is distributed to the computer 900 via a communication line, the computer 900 that has received the program may load the program into the main storage device 902 and execute the above processing.
- the program may be for realizing some of the functions described above.
- the program may be a program that realizes the above-described function in combination with another program already stored in the auxiliary storage device 903, that is, a so-called difference file (difference program).
- the given factor evaluation units 33 and 33a and the control factor evaluation units 34 and 34a are examples of a performance evaluation unit.
- a decrease of 0.5% in the efficiency of the plant 1 illustrated in FIG. 5 is an example of the first change amount, and a decrease of 0.2% is an example of the second change amount.
- the output unit 35 is an example of a performance output unit and an effect output unit.
- GT inlet pressure loss is an example of a maintenance parameter.
- the influence of any factor on the performance of the plant is evaluated, or the original performance of the plant excluding the influence of those factors is evaluated. be able to.
Landscapes
- Engineering & Computer Science (AREA)
- Physics & Mathematics (AREA)
- General Physics & Mathematics (AREA)
- Chemical & Material Sciences (AREA)
- Combustion & Propulsion (AREA)
- Mechanical Engineering (AREA)
- General Engineering & Computer Science (AREA)
- Automation & Control Theory (AREA)
- Testing Of Devices, Machine Parts, Or Other Structures Thereof (AREA)
- Testing Of Engines (AREA)
- Testing And Monitoring For Control Systems (AREA)
Applications Claiming Priority (2)
| Application Number | Priority Date | Filing Date | Title |
|---|---|---|---|
| JP2018147952A JP7014686B2 (ja) | 2018-08-06 | 2018-08-06 | 性能評価装置、性能評価方法及び性能影響度出力方法 |
| JP2018-147952 | 2018-08-06 |
Publications (1)
| Publication Number | Publication Date |
|---|---|
| WO2020031532A1 true WO2020031532A1 (ja) | 2020-02-13 |
Family
ID=69413483
Family Applications (1)
| Application Number | Title | Priority Date | Filing Date |
|---|---|---|---|
| PCT/JP2019/025307 Ceased WO2020031532A1 (ja) | 2018-08-06 | 2019-06-26 | 性能評価装置、性能評価方法及び性能影響度出力方法 |
Country Status (2)
| Country | Link |
|---|---|
| JP (1) | JP7014686B2 (enExample) |
| WO (1) | WO2020031532A1 (enExample) |
Families Citing this family (3)
| Publication number | Priority date | Publication date | Assignee | Title |
|---|---|---|---|---|
| JP7137592B2 (ja) * | 2020-05-16 | 2022-09-14 | 三菱電機株式会社 | 劣化診断システム、劣化診断装置および劣化診断プログラム |
| JP7542487B2 (ja) * | 2021-05-11 | 2024-08-30 | 三菱重工業株式会社 | 感度カーブ学習装置、その学習方法、性能値算出装置、および、その性能値算出方法 |
| JP7458357B2 (ja) | 2021-09-24 | 2024-03-29 | 三菱パワー株式会社 | モデル学習装置、性能評価装置、モデル学習方法、及びプログラム |
Citations (5)
| Publication number | Priority date | Publication date | Assignee | Title |
|---|---|---|---|---|
| JP2007107446A (ja) * | 2005-10-13 | 2007-04-26 | Hitachi Ltd | ガスタービンの性能診断方法及び診断システム |
| JP2011106467A (ja) * | 2011-02-28 | 2011-06-02 | Hitachi Ltd | ガスタービンの性能診断システムにおける表示画面の表示方法 |
| JP2012008782A (ja) * | 2010-06-24 | 2012-01-12 | Mitsubishi Heavy Ind Ltd | プラントの機能を診断する方法、及びプラント監視装置 |
| JP2012021487A (ja) * | 2010-07-15 | 2012-02-02 | Central Res Inst Of Electric Power Ind | 熱効率解析方法及び熱効率解析プログラム |
| KR20130069333A (ko) * | 2012-08-29 | 2013-06-26 | 이범제 | 실시간 발전기 공급능력 산정 방법 |
Family Cites Families (10)
| Publication number | Priority date | Publication date | Assignee | Title |
|---|---|---|---|---|
| US4794535A (en) | 1986-08-18 | 1988-12-27 | Automated Decisions, Inc. | Method for determining economic drill bit utilization |
| DE19907454A1 (de) | 1999-02-22 | 2000-08-24 | Schenck Vibro Gmbh | Verfahren zur modellbasierten schwingungsdiagnostischen Überwachung rotierender Maschinen |
| JP3922426B2 (ja) | 2001-09-14 | 2007-05-30 | 石川島播磨重工業株式会社 | ガスタービンの性能診断方法 |
| JP4176777B2 (ja) | 2006-03-23 | 2008-11-05 | 三菱重工業株式会社 | ガスタービン高温部品のき裂進展予測方法及びこの方法を用いたき裂進展予測装置 |
| JP4762088B2 (ja) | 2006-08-31 | 2011-08-31 | 株式会社東芝 | プロセス異常診断装置 |
| JP5061744B2 (ja) | 2007-06-15 | 2012-10-31 | 横河電機株式会社 | 状況解析システムおよび状況解析方法 |
| US9323234B2 (en) | 2009-06-10 | 2016-04-26 | Fisher-Rosemount Systems, Inc. | Predicted fault analysis |
| JP5793299B2 (ja) | 2010-12-28 | 2015-10-14 | 株式会社東芝 | プロセス監視診断装置 |
| US20170315960A1 (en) * | 2014-11-19 | 2017-11-02 | Nec Corporation | Factor analysis apparatus, factor analysis method and recording medium, and factor analysis system |
| JP6740157B2 (ja) | 2017-03-13 | 2020-08-12 | 株式会社東芝 | 解析装置、解析方法、及び、プログラム |
-
2018
- 2018-08-06 JP JP2018147952A patent/JP7014686B2/ja active Active
-
2019
- 2019-06-26 WO PCT/JP2019/025307 patent/WO2020031532A1/ja not_active Ceased
Patent Citations (5)
| Publication number | Priority date | Publication date | Assignee | Title |
|---|---|---|---|---|
| JP2007107446A (ja) * | 2005-10-13 | 2007-04-26 | Hitachi Ltd | ガスタービンの性能診断方法及び診断システム |
| JP2012008782A (ja) * | 2010-06-24 | 2012-01-12 | Mitsubishi Heavy Ind Ltd | プラントの機能を診断する方法、及びプラント監視装置 |
| JP2012021487A (ja) * | 2010-07-15 | 2012-02-02 | Central Res Inst Of Electric Power Ind | 熱効率解析方法及び熱効率解析プログラム |
| JP2011106467A (ja) * | 2011-02-28 | 2011-06-02 | Hitachi Ltd | ガスタービンの性能診断システムにおける表示画面の表示方法 |
| KR20130069333A (ko) * | 2012-08-29 | 2013-06-26 | 이범제 | 실시간 발전기 공급능력 산정 방법 |
Also Published As
| Publication number | Publication date |
|---|---|
| JP7014686B2 (ja) | 2022-02-01 |
| JP2020024119A (ja) | 2020-02-13 |
Similar Documents
| Publication | Publication Date | Title |
|---|---|---|
| JP4361582B2 (ja) | ガスタービンの性能診断方法及び性能診断システム | |
| CN106404403B (zh) | 用于涡轮机的分析的方法和系统 | |
| US7190149B2 (en) | Method and apparatus for determining actual reactive capability curves | |
| CN1837767B (zh) | 降级系统的健康参数或症状的估计 | |
| JP5715377B2 (ja) | タービン運転劣化判定システム及び方法 | |
| US20190033945A1 (en) | Data center total resource utilization efficiency (true) system and method | |
| WO2020031532A1 (ja) | 性能評価装置、性能評価方法及び性能影響度出力方法 | |
| US11847007B2 (en) | Data center total resource utilization efficiency (TRUE) system and method | |
| JP6416610B2 (ja) | プラント機器の保守計画システム及び方法 | |
| Tsoutsanis et al. | Part-Load performance of gas turbines: Part II—multi-point Adaptation with compressor map generation and GA optimization | |
| WO2017209179A1 (ja) | 監視装置、対象装置の監視方法、およびプログラム | |
| JP6482743B1 (ja) | リスク評価装置、リスク評価システム、リスク評価方法、及び、リスク評価プログラム | |
| JP4468282B2 (ja) | ガスタービンの性能診断方法及び診断システム | |
| JP2006057595A (ja) | ガスタービンの性能診断システム及び性能診断方法 | |
| CN108073145A (zh) | 运转支援装置以及程序 | |
| JP2007002673A (ja) | ガスタービン性能の分析予測方法 | |
| JP6554162B2 (ja) | 発電プラント性能評価方法及び発電プラント性能評価プログラム | |
| EP3373233A1 (en) | Scheduling maintenance to reduce degradation of a power generation system | |
| US20150323422A1 (en) | System and method for evaluating opportunities to extend operating durations | |
| KR20190072813A (ko) | 고압 펌프 고장 예지 방법 및 시스템 | |
| JP5653786B2 (ja) | 異常検出装置 | |
| WO2019124367A1 (ja) | 単位空間生成装置、プラント診断システム、単位空間生成方法、プラント診断方法、及びプログラム | |
| KR20200009081A (ko) | 리스크 평가 장치, 리스크 평가 시스템, 리스크 평가 방법, 리스크 평가 프로그램 및 데이터 구조 | |
| JP2005248848A (ja) | ガスタービン診断方法及び装置 | |
| KR101409589B1 (ko) | 가스터빈 정비 지원 시스템 |
Legal Events
| Date | Code | Title | Description |
|---|---|---|---|
| 121 | Ep: the epo has been informed by wipo that ep was designated in this application |
Ref document number: 19846827 Country of ref document: EP Kind code of ref document: A1 |
|
| NENP | Non-entry into the national phase |
Ref country code: DE |
|
| 122 | Ep: pct application non-entry in european phase |
Ref document number: 19846827 Country of ref document: EP Kind code of ref document: A1 |