WO2020017147A1 - シリコン単結晶の炭素濃度測定方法及び装置 - Google Patents
シリコン単結晶の炭素濃度測定方法及び装置 Download PDFInfo
- Publication number
- WO2020017147A1 WO2020017147A1 PCT/JP2019/020377 JP2019020377W WO2020017147A1 WO 2020017147 A1 WO2020017147 A1 WO 2020017147A1 JP 2019020377 W JP2019020377 W JP 2019020377W WO 2020017147 A1 WO2020017147 A1 WO 2020017147A1
- Authority
- WO
- WIPO (PCT)
- Prior art keywords
- carbon concentration
- sample
- temperature
- measuring
- measurement
- Prior art date
- Legal status (The legal status is an assumption and is not a legal conclusion. Google has not performed a legal analysis and makes no representation as to the accuracy of the status listed.)
- Ceased
Links
Images



Classifications
-
- G—PHYSICS
- G01—MEASURING; TESTING
- G01N—INVESTIGATING OR ANALYSING MATERIALS BY DETERMINING THEIR CHEMICAL OR PHYSICAL PROPERTIES
- G01N21/00—Investigating or analysing materials by the use of optical means, i.e. using sub-millimetre waves, infrared, visible or ultraviolet light
- G01N21/17—Systems in which incident light is modified in accordance with the properties of the material investigated
- G01N21/25—Colour; Spectral properties, i.e. comparison of effect of material on the light at two or more different wavelengths or wavelength bands
- G01N21/31—Investigating relative effect of material at wavelengths characteristic of specific elements or molecules, e.g. atomic absorption spectrometry
- G01N21/35—Investigating relative effect of material at wavelengths characteristic of specific elements or molecules, e.g. atomic absorption spectrometry using infrared light
- G01N21/3563—Investigating relative effect of material at wavelengths characteristic of specific elements or molecules, e.g. atomic absorption spectrometry using infrared light for analysing solids; Preparation of samples therefor
-
- G—PHYSICS
- G01—MEASURING; TESTING
- G01N—INVESTIGATING OR ANALYSING MATERIALS BY DETERMINING THEIR CHEMICAL OR PHYSICAL PROPERTIES
- G01N21/00—Investigating or analysing materials by the use of optical means, i.e. using sub-millimetre waves, infrared, visible or ultraviolet light
- G01N21/01—Arrangements or apparatus for facilitating the optical investigation
-
- G—PHYSICS
- G01—MEASURING; TESTING
- G01N—INVESTIGATING OR ANALYSING MATERIALS BY DETERMINING THEIR CHEMICAL OR PHYSICAL PROPERTIES
- G01N21/00—Investigating or analysing materials by the use of optical means, i.e. using sub-millimetre waves, infrared, visible or ultraviolet light
- G01N21/17—Systems in which incident light is modified in accordance with the properties of the material investigated
- G01N21/25—Colour; Spectral properties, i.e. comparison of effect of material on the light at two or more different wavelengths or wavelength bands
- G01N21/27—Colour; Spectral properties, i.e. comparison of effect of material on the light at two or more different wavelengths or wavelength bands using photo-electric detection ; circuits for computing concentration
-
- G—PHYSICS
- G01—MEASURING; TESTING
- G01N—INVESTIGATING OR ANALYSING MATERIALS BY DETERMINING THEIR CHEMICAL OR PHYSICAL PROPERTIES
- G01N21/00—Investigating or analysing materials by the use of optical means, i.e. using sub-millimetre waves, infrared, visible or ultraviolet light
- G01N21/17—Systems in which incident light is modified in accordance with the properties of the material investigated
- G01N21/25—Colour; Spectral properties, i.e. comparison of effect of material on the light at two or more different wavelengths or wavelength bands
- G01N21/31—Investigating relative effect of material at wavelengths characteristic of specific elements or molecules, e.g. atomic absorption spectrometry
- G01N21/35—Investigating relative effect of material at wavelengths characteristic of specific elements or molecules, e.g. atomic absorption spectrometry using infrared light
- G01N21/3563—Investigating relative effect of material at wavelengths characteristic of specific elements or molecules, e.g. atomic absorption spectrometry using infrared light for analysing solids; Preparation of samples therefor
- G01N2021/3568—Investigating relative effect of material at wavelengths characteristic of specific elements or molecules, e.g. atomic absorption spectrometry using infrared light for analysing solids; Preparation of samples therefor applied to semiconductors, e.g. Silicon
-
- G—PHYSICS
- G01—MEASURING; TESTING
- G01N—INVESTIGATING OR ANALYSING MATERIALS BY DETERMINING THEIR CHEMICAL OR PHYSICAL PROPERTIES
- G01N21/00—Investigating or analysing materials by the use of optical means, i.e. using sub-millimetre waves, infrared, visible or ultraviolet light
- G01N21/17—Systems in which incident light is modified in accordance with the properties of the material investigated
- G01N21/25—Colour; Spectral properties, i.e. comparison of effect of material on the light at two or more different wavelengths or wavelength bands
- G01N21/31—Investigating relative effect of material at wavelengths characteristic of specific elements or molecules, e.g. atomic absorption spectrometry
- G01N21/35—Investigating relative effect of material at wavelengths characteristic of specific elements or molecules, e.g. atomic absorption spectrometry using infrared light
- G01N2021/3595—Investigating relative effect of material at wavelengths characteristic of specific elements or molecules, e.g. atomic absorption spectrometry using infrared light using FTIR
Definitions
- the present invention relates to a method and an apparatus for measuring the carbon concentration of a silicon single crystal, and more particularly to a method and an apparatus for measuring the carbon concentration in a silicon single crystal by FT-IR (Fourier Transform Infrared Spectroscopy). It is.
- Silicon single crystals are widely used as substrate materials for semiconductor devices.
- the impurities contained in the silicon single crystal are important factors that affect the quality of the semiconductor device.
- substitutional carbon Cs in a silicon single crystal also causes a leak failure and the like. Therefore, it is desired to reduce the carbon concentration in the single crystal as much as possible.
- Patent Document 1 describes a method of measuring the concentration of substitutional carbon in a silicon single crystal by FT-IR.
- an infrared absorption spectrum obtained from a silicon single crystal as an object to be measured (sample) is substantially equal to free carrier absorption manufactured by the same manufacturing method as that of the sample, and is substantially the same.
- a difference coefficient is calculated from an infrared absorbance spectrum obtained from a carbon-free silicon single crystal (reference).
- Patent Document 2 discloses a carbon-free standard having an oxygen concentration lower than that of a silicon crystal to be measured because the carbon concentration in a silicon crystal having a carbon concentration of about 5 ⁇ 10 15 atoms / cm 3 or less is measured by FT-IR. It describes that a sample is used.
- Patent Document 3 discloses that a temperature difference between a measurement chamber that irradiates infrared light and a storage location of a measurement sample outside the apparatus is compensated to reduce variation in measured values due to the temperature difference. Describes that FT-IR measurement accuracy is improved.
- an object of the present invention is to provide a method and an apparatus for measuring the carbon concentration of a silicon single crystal, which can accurately measure the carbon concentration even when the carbon concentration in the silicon single crystal is extremely low.
- the inventor of the present application has conducted intensive studies on the cause of the variation in the measurement result of the carbon concentration in the silicon single crystal, and as a result, when the carbon concentration in the measurement sample is very low, specifically, the carbon concentration in the silicon single crystal Is less than or equal to 0.5 ⁇ 10 16 atoms / cm 3 , the temperature dependence of the carbon concentration becomes large, and even if the same measurement sample is used, the measured value of the carbon concentration fluctuates due to the difference in the measurement temperature. I found it.
- the present invention is based on such technical knowledge, and the method for measuring the carbon concentration of a silicon single crystal according to the present invention comprises the steps of measuring the carbon concentration of a silicon single crystal sample by FT-IR, Measuring the temperature of the sample during, before, or after measuring the concentration; and measuring the sample when the measured carbon concentration of the sample is 0.5 ⁇ 10 16 atoms / cm 3 or less. Correcting the measured value of the carbon concentration of the sample based on the temperature.
- the carbon concentration in the silicon single crystal at the reference temperature can be accurately measured by the FT-IR method.
- the step of correcting the measured value of the carbon concentration of the sample includes calculating a correction amount of the carbon concentration based on a temperature difference and a correction coefficient between a measured temperature of the sample and a reference temperature, and Calculating the carbon concentration of the sample at the reference temperature by adding the correction amount to the measured value of the carbon concentration.
- the measured value of the carbon concentration of the sample is Ycs
- the measured temperature of the sample is T
- the reference temperature of the sample is T 0
- the correction coefficient is A
- the carbon concentration of the sample at the reference temperature T 0 is Ycs ′.
- the correction is performed based on the measured values (Ycs) of the carbon concentration of the sample at a plurality of measurement temperatures.
- the method further includes the step of setting the value of the coefficient A. According to this, the measurement accuracy of the carbon concentration in the silicon single crystal can be improved.
- the correction coefficient (A) is preferably a value within a range of 0.011 ⁇ 10 16 to 0.014 ⁇ 10 16 (atoms / (cm 3 ⁇ ° C.)). According to this, the carbon concentration in the silicon single crystal can be accurately obtained.
- the temperature (T) of the sample is estimated by measuring the temperature in the measurement chamber for measuring the sample, and estimating the temperature (T) of the sample from the temperature in the measurement chamber.
- T) is measured indirectly. According to this, the temperature of the sample can be measured with a simple configuration.
- the apparatus for measuring the carbon concentration of a silicon single crystal comprises: a carbon concentration measuring unit for measuring the carbon concentration of a silicon single crystal sample by FT-IR; A first thermometer for measuring the temperature of the sample, and a method for measuring the temperature of the sample based on the measured temperature of the sample when the measured carbon concentration of the sample is 0.5 ⁇ 10 16 atoms / cm 3 or less. And a carbon concentration corrector for correcting the measured value of the carbon concentration.
- It is preferable to include a correction value calculator for calculating the carbon concentration (Ycs ′ Ycs + ⁇ Ycs). According to this, the carbon concentration of the silicon single crystal at the reference temperature can be accurately obtained regardless of the fluctuation of the measurement environment temperature.
- the carbon concentration measuring apparatus further includes a second thermometer for measuring a temperature in a measurement chamber for measuring the sample, and estimating a temperature (T) of the sample from a temperature in the measurement chamber.
- a second thermometer for measuring a temperature in a measurement chamber for measuring the sample, and estimating a temperature (T) of the sample from a temperature in the measurement chamber.
- the temperature (T) of the sample is measured indirectly. According to this, the temperature of the sample can be measured with a simple configuration.
- the present invention it is possible to provide a method and an apparatus for measuring the carbon concentration of a silicon single crystal which can accurately measure the carbon concentration even when the carbon concentration in the silicon single crystal is extremely low.
- FIG. 1 is a plan view schematically showing an example of the configuration of an FT-IR apparatus used in the method for measuring the carbon concentration of a silicon single crystal according to the present invention.
- FIG. 2 is a block diagram schematically showing a configuration of a control unit of the FT-IR device.
- FIG. 3 is a functional block diagram of a carbon concentration calculator realized by the controller.
- FIG. 4 is a flowchart showing a method for correcting the carbon concentration.
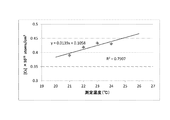
- FIG. 5 is a graph showing the rate of change of the carbon concentration of each of the silicon single crystal samples # 1 to # 4 when the measurement temperature changes within the range of 22.5 ⁇ 2 ° C.
- FIG. 1 is a plan view schematically showing an example of the configuration of an FT-IR apparatus used in the method for measuring the carbon concentration of a silicon single crystal according to the present invention.
- FIG. 2 is a block diagram schematically showing a configuration of a control unit of the FT-IR device.
- FIG. 3 is a functional block diagram of
- FIG. 6 is a graph showing the temperature dependence of the carbon concentration when the carbon concentration is less than 0.1 ⁇ 10 16 atoms / cm 3 .
- FIG. 7 is a graph showing the temperature dependence of the carbon concentration when the carbon concentration is 0.1 ⁇ 10 16 to 0.3 ⁇ 10 16 atoms / cm 3 .
- FIG. 8 is a graph showing the temperature dependence of the carbon concentration when the carbon concentration is 0.3 ⁇ 10 16 to 0.5 ⁇ 10 16 atoms / cm 3 .
- FIG. 1 is a plan view schematically showing an example of the configuration of an FT-IR apparatus used in the method for measuring the carbon concentration of a silicon single crystal according to the present invention.
- an FT-IR apparatus 1 is an apparatus suitable for measuring substitutional carbon Cs in a silicon single crystal, and includes an infrared lamp 11 as a light source provided in a spectroscopic chamber 10A, An interferometer 13 that emits interference fringes of infrared light from the lamp 11, and a plane mirror 14a and a concave mirror that guide the interference fringes of infrared light from the interferometer 13 to a sample 2 in a measurement chamber 10B connected to the spectroscopic chamber 10A.
- a detector 15 for detecting the transmitted light or reflected light of the interference fringes of the infrared light applied to the sample 2 and a detector for detecting the transmitted light or reflected light of the interference fringes of the infrared light applied to the sample 2.
- an A / D converter 18 for digitally converting the output (interferogram) of the detector 15 a control unit 19 for controlling the entire apparatus and performing arithmetic processing such as Fourier transform, and the measured IR.
- the detector 15, the A / D converter 18, the control unit 19, and the recording device 20 are provided in a control room 10C connected to the measurement room 10B.
- the FT-IR apparatus 1 measures the temperature of the sample 2 installed in the measurement chamber 10B in a non-contact manner with a pyrometer 17a (first thermometer) and the temperature in the measurement chamber 10B.
- a temperature sensor 17b second thermometer.
- the interferogram detected by the detector 15 is converted into a digital signal by the A / D converter 18 and then taken into the control unit 19 to output the same detection output from the reference sample or the output without the sample. Is used as a background to perform an arithmetic process such as Fourier transform to obtain an IR spectrum.
- the IR spectrum is recorded on the recording device 20.
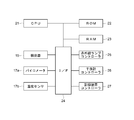
- FIG. 2 is a block diagram schematically showing a configuration of the control unit 19 of the FT-IR device.
- the control unit 19 of the FT-IR apparatus 1 controls the entire apparatus and performs arithmetic processing such as Fourier transform on an interferogram output from the detector 15; ROM 22, which stores the contents of the control, the RAM 23 for temporarily storing information necessary for measurement such as the size of the sample 2, the measurement mode, the measurement conditions, and the output data of the detector 15, and the interface 24.
- arithmetic processing such as Fourier transform on an interferogram output from the detector 15
- ROM 22 which stores the contents of the control
- the RAM 23 for temporarily storing information necessary for measurement such as the size of the sample 2, the measurement mode, the measurement conditions, and the output data of the detector 15, and the interface 24.
- the detector 15, the pyrometer 17a, the temperature sensor 17b, and the like are connected to the input side of the interface 24 via an A / D converter (not shown). Further, an infrared lamp controller 25, an interferometer controller 26, a recording device controller 27 and the like are connected to the output side of the interface 24 via a D / A converter (not shown). Although not shown, an operation unit for inputting measurement conditions and the like is connected to the interface 24.
- the infrared lamp 11 is turned on, and the interferometer 13, the detector 15, and the like are brought into an operation start state. Further, a purge gas such as a nitrogen gas is introduced into the spectroscopic chamber 10A and the measuring chamber 10B in order to remove carbon dioxide, water vapor, and the like in the atmosphere that absorb infrared rays very well.
- a purge gas such as a nitrogen gas is introduced into the spectroscopic chamber 10A and the measuring chamber 10B in order to remove carbon dioxide, water vapor, and the like in the atmosphere that absorb infrared rays very well.
- the divergent light from the infrared lamp 11 is collimated by the collimating mirror 11a, and then enters the beam splitter 13c in the interferometer 13.
- the infrared light that has entered the beam splitter 13c is split into reflected light and transmitted light, of which the reflected light is reflected by the fixed mirror 13a and returns to the beam splitter 13c, and the transmitted light is reflected by the movable mirror 13b and reflected by the movable mirror 13b. Return to the splitter 13c.
- the two lights are combined by the beam splitter 13c and interfere with each other.
- the interference light is reflected by the plane mirror 14a and then condensed by the concave mirror 14b, transmitted or reflected by the sample 2, and transmitted to the detector 15 via the concave mirror 14c. It is captured.
- the sample 2 is irradiated with interference fringes of infrared light, which is the light emitted from the interferometer 13, and the light transmitted or reflected by the sample 2 is detected by the detector 15, and a similar detection signal from the reference sample or the sample is detected.
- the IR spectrum is measured by performing arithmetic processing such as Fourier transform using the signal in a state without the background as a background.
- the IR spectrum is recorded on the recording device 20.
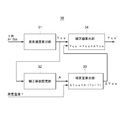
- FIG. 3 is a functional block diagram of the carbon concentration measuring unit 30 realized by the control unit 19.
- the carbon concentration measuring unit 30 includes a carbon concentration calculating unit 31 for quantifying the concentration of substitutional carbon Cs contained in the silicon single crystal measurement sample from the IR spectra of the measurement sample and the reference sample, A correction coefficient setting unit 32 for setting a correction coefficient A based on the measured values Ycs of the carbon concentrations of the measurement sample at a plurality of measurement temperatures obtained by the concentration calculation unit 31; and a measurement sample provided from the pyrometer 17a or the temperature sensor 17b.
- the correction coefficient setting unit 32, the correction amount calculation unit 33, and the correction value calculation unit 34 measure the carbon concentration of the measurement sample based on the measurement temperature of the measurement sample. It constitutes a carbon concentration correction unit for correcting the value.
- the correction coefficient setting unit 32 sets the correction coefficient A based on the measured value Ycs of the carbon concentration of the sample. That is, it is preferable to use a different correction coefficient according to the measured value Ycs of the carbon concentration. As described above, by setting the correction coefficient A to be a variable value based on the measured value (Ycs) of the carbon concentration, the carbon concentration can be measured more accurately.
- the correction coefficient A 0.
- the temperature dependency of the measured value of the carbon concentration is low.
- the correction coefficient A may be changed stepwise as described above, or may be changed linearly in accordance with a change in the measured value Ycs of the carbon concentration.
- the correction coefficient A can be a value within the range of 0.011 ⁇ 10 16 to 0.014 ⁇ 10 16 .
- the FT-IR measurement needs to be performed when the measurement temperature T of the sample is 20 to 26 ° C. This is because when the temperature is out of the temperature range, the reliability of the measured value of the carbon concentration by the FT-IR apparatus 1 decreases.
- the measurement temperature T of the sample is preferably the temperature during the measurement of the carbon concentration, but may be the temperature immediately before the measurement of the carbon concentration or the temperature immediately after the measurement of the carbon concentration. It is also possible to estimate the measurement temperature of the sample during the measurement of the carbon concentration from the measurement temperatures before and after the measurement of the carbon concentration. Instead of directly measuring the temperature of the sample, the temperature inside the measurement room 10B may be measured by the temperature sensor 17b, and the measurement temperature T of the sample may be estimated from the temperature inside the measurement room 10B. As an example, it is assumed that the measurement temperature T of the sample is estimated to be the same as the temperature in the measurement chamber 10B. That is, the measurement temperature T of the sample may be measured indirectly. According to this, the pyrometer 17a can be omitted, and the temperature of the sample can be measured with a simple configuration.
- FIG. 4 is a flowchart showing a method for correcting the carbon concentration.
- the concentration of the substitutional carbon Cs in the silicon single crystal is quantified from the IR spectra of the measurement sample and the reference sample to calculate the measured value Ycs of the carbon concentration of the measurement sample (step). S11).
- a correction coefficient A is set based on the measured value Ycs of the carbon concentration of the measurement sample (step S12).
- the setting method of the correction coefficient A is as described above. When the measured value of the carbon concentration is 0.5 ⁇ 10 16 atoms / cm 3 or more, the correction coefficient is set to zero, so that the carbon concentration is not corrected. .
- Ycs ′ Ycs.
- the reference temperature T 0 can be any temperature in the range of 20 ° C. to 32 ° C., for example, 23 ° C.
- FT-IR measurement is performed in a clean room, and the temperature in the clean room is generally kept constant, but slightly fluctuates due to the influence of the outside air temperature and the like. That is, the measurement environment temperature is not always constant, but shows daily fluctuation and seasonal fluctuation.
- the measurement environment temperature is not always constant, but shows daily fluctuation and seasonal fluctuation.
- the carbon concentration in the silicon single crystal is low, the fluctuation of the measurement environment temperature causes the fluctuation of the measurement value of the carbon concentration, and the fluctuation of the measurement value of the carbon concentration of the silicon single crystal increases due to the fluctuation of the measurement environment temperature.
- the corrected measured value of the carbon concentration in accordance with the temperature change of the affected the measurement environment temperature sample to accurately measure the carbon concentration in the silicon single crystal at a reference temperature T 0 can be. Further, since the correction coefficient is changed depending on the magnitude of the measured value of the carbon concentration, the carbon concentration of the silicon single crystal can be measured more accurately.
- the carbon concentration measuring unit 30 is realized by the control unit 19 of the FT-IR device 1, but may be realized by a computer different from the FT-IR device 1.
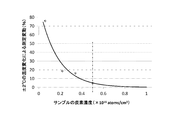
- FIG. 5 is a graph showing the rate of change of the carbon concentration of each sample when the measurement temperature of silicon single crystal samples # 1 to # 4 changed within the range of 22.5 ⁇ 2 ° C.
- the temperature dependence of the carbon concentration was confirmed by changing the measurement environment temperature.
- the measurement temperature was 21 to 24 ° C.
- the temperature of the silicon single crystal during the FT-IR measurement was measured with a pyrometer.
- Silicon sample single crystal, the sample carbon concentration is less than 0.1 ⁇ 10 16 atoms / cm 3 , of 0.1 ⁇ 10 16 ⁇ 0.3 ⁇ 10 16 atoms / cm 3 samples, 0.3 ⁇ 10 16 Seven samples each of 0.50.5 ⁇ 10 16 atoms / cm 3 were prepared.
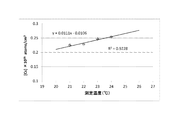
- FIG. 6 is a graph showing the temperature dependence of the carbon concentration when the carbon concentration is less than 0.1 ⁇ 10 16 atoms / cm 3 , the horizontal axis being the measurement temperature (° C.), and the vertical axis being the carbon concentration ( ⁇ 10 16 ). 16 atoms / cm 3 ).
- the plot values in the graph are the average values of the carbon concentrations of the seven samples at each temperature.
- the carbon concentration tended to increase as the measurement temperature increased.
- the coefficient of determination: R 2 0.988, and when the carbon concentration in the single crystal is very low, less than 0.1 ⁇ 10 16 atoms / cm 3 , a very strong correlation between the measurement temperature and the carbon concentration. It turned out that there was.
- FIG. 7 is a graph showing the temperature dependence of the carbon concentration when the carbon concentration is 0.1 ⁇ 10 16 to 0.3 ⁇ 10 16 atoms / cm 3 , where the horizontal axis is the measurement temperature (° C.) and the vertical axis is Indicates a carbon concentration ( ⁇ 10 16 atoms / cm 3 ).
- the plot values in the graph are the average values of the carbon concentrations of the seven samples at each temperature.
- the carbon concentration tended to increase as the measurement temperature increased.
- R 2 0.923
- the carbon concentration in the single crystal is as low as 0.1 ⁇ 10 16 to 0.3 ⁇ 10 16 atoms / cm 3
- the difference between the measurement temperature and the carbon concentration is It turns out that there is a strong correlation.
- FIG. 8 is a graph showing the temperature dependence of the carbon concentration when the carbon concentration is 0.3 ⁇ 10 16 to 0.5 ⁇ 10 16 atoms / cm 3 , where the horizontal axis is the measurement temperature (° C.) and the vertical axis is Indicates a carbon concentration ( ⁇ 10 16 atoms / cm 3 ).
- the plot values in the graph are the average values of the carbon concentrations of the seven samples at each temperature.
- the carbon concentration tended to increase as the measurement temperature increased.
- the coefficient of determination: R 2 0.791, and when the carbon concentration in the single crystal is as low as 0.3 ⁇ 10 16 to 0.5 ⁇ 10 16 atoms / cm 3 , there is a difference between the measurement temperature and the carbon concentration. It turns out that there is a strong correlation.
Landscapes
- Physics & Mathematics (AREA)
- Spectroscopy & Molecular Physics (AREA)
- Health & Medical Sciences (AREA)
- Life Sciences & Earth Sciences (AREA)
- Chemical & Material Sciences (AREA)
- Analytical Chemistry (AREA)
- Biochemistry (AREA)
- General Health & Medical Sciences (AREA)
- General Physics & Mathematics (AREA)
- Immunology (AREA)
- Pathology (AREA)
- Engineering & Computer Science (AREA)
- Mathematical Physics (AREA)
- Theoretical Computer Science (AREA)
- Investigating Or Analysing Materials By Optical Means (AREA)
- Crystals, And After-Treatments Of Crystals (AREA)
- Testing Or Measuring Of Semiconductors Or The Like (AREA)
Abstract
【課題】シリコン単結晶中の炭素濃度が非常に低い場合でも当該炭素濃度を正確に測定する。 【解決手段】本発明によるシリコン単結晶の炭素濃度測定方法は、シリコン単結晶の試料の炭素濃度YcsをFT-IRにより測定するステップ(S11)と、試料の炭素濃度Ycsの測定中又はその前後において試料の温度Tを測定するステップと、試料の炭素濃度Ycsが0.5×10¹⁶atoms/cm3以下である場合に、試料の測定温度Tに基づいて試料の炭素濃度の測定値Ycsを補正するステップ(S13、S14)とを備える。
Description
本発明は、シリコン単結晶の炭素濃度測定方法及び装置に関し、特に、シリコン単結晶中の炭素濃度をFT-IR(Fourier Transform Infrared Spectroscopy:フーリエ変換赤外分光法)により測定する方法及び装置に関するものである。
半導体デバイスの基板材料としてシリコン単結晶が広く用いられている。シリコン単結晶に含まれる不純物は、半導体デバイスの品質を左右する重要な要素である。近年の半導体デバイスの微細化及び高集積化により、シリコン単結晶中の置換型炭素Csもリーク不良等の原因となることから、単結晶中の炭素濃度を極力低減することが望まれている。
シリコン単結晶の多くはチョクラルスキー法(CZ法)により製造されており、単結晶中には製造工程由来の炭素が多く含まれている。しかし、最新の製造技術によれば、CZシリコン単結晶中の炭素濃度を1×10¹⁶atoms/cm3以下にすることが可能である。このような炭素濃度が低いシリコン単結晶を評価するためには、シリコン単結晶中の非常に低い炭素濃度を正確に測定する必要がある。
シリコン単結晶中の炭素濃度を測定する方法としてFT-IRが広く用いられている。例えば、特許文献1には、シリコン単結晶中の置換型炭素濃度をFT-IRにより測定する方法が記載されている。この測定方法では、被測定物(サンプル)であるシリコン単結晶から得られた赤外吸光度スペクトルと、前記サンプルと同一の製造法で製造された、フリーキャリア吸収が同程度で、かつ実質的に無炭素のシリコン単結晶(リファレンス)から得られた赤外吸光度スペクトルとから差係数を算出する。その後、この差係数を用いて前記両赤外吸光度スペクトルから差吸光度スペクトルを求めて、この差吸光度スペクトルにおける置換型炭素の局在振動吸収ピークとベースラインとの距離から、サンプル中の置換型炭素濃度を定量する。
また特許文献2には、炭素濃度が約5×10¹⁵atoms/cm3以下のシリコン結晶中の炭素濃度をFT-IRにより測定するため、被測定シリコン結晶よりも低い酸素濃度を有するカーボンフリー標準試料を用いることが記載されている。
特許文献3には、赤外光を照射する測定室と装置の外側にある測定試料の保管箇所との間に生じる温度差を補償して該温度差に起因する測定値のばらつきを小さくすることによりFT-IRの測定精度の向上を図ることが記載されている。
しかしながら、シリコン単結晶中の非常に低い炭素濃度をFT-IRにより測定する場合、同一の測定試料であっても測定結果に日間変動が見られ、炭素濃度の測定結果の再現性が悪いという問題がある。
したがって、本発明の目的は、シリコン単結晶中の炭素濃度が非常に低い場合でも当該炭素濃度を正確に測定することが可能なシリコン単結晶の炭素濃度測定方法及び装置を提供することにある。
本願発明者は、シリコン単結晶中の炭素濃度の測定結果がばらつく原因について鋭意研究を重ねた結果、測定試料中の炭素濃度が非常に低い場合、具体的には、シリコン単結晶中の炭素濃度が0.5×10¹⁶atoms/cm3以下である場合には、炭素濃度の温度依存性が大きくなり、同じ測定試料であっても測定温度の違いによって炭素濃度の測定値が変動することを見出した。
本発明はこのような技術的知見に基づくものであり、本発明によるシリコン単結晶の炭素濃度測定方法は、シリコン単結晶の試料の炭素濃度をFT-IRにより測定するステップと、前記試料の炭素濃度の測定中又は測定前若しくは測定後において前記試料の温度を測定するステップと、測定された前記試料の炭素濃度が0.5×10¹⁶atoms/cm3以下である場合に、前記試料の測定温度に基づいて前記試料の炭素濃度の測定値を補正するステップとを備えることを特徴とする。
本発明によれば、シリコン単結晶中の炭素濃度が低い場合であっても基準温度下におけるシリコン単結晶中の炭素濃度をFT-IR法により正確に測定することができる。
本発明において、前記試料の炭素濃度の測定値を補正するステップは、前記試料の測定温度と基準温度との温度差及び補正係数に基づいて、前記炭素濃度の補正量を算出するステップと、前記炭素濃度の測定値に前記補正量を加算することにより、前記基準温度における前記試料の炭素濃度を算出するステップとを含むことが好ましい。特に、前記試料の炭素濃度の測定値をYcs、前記試料の測定温度をT、前記試料の基準温度をT0、前記補正係数をA、前記基準温度T0における前記試料の炭素濃度をYcs'とするとき、前記試料の炭素濃度の測定値Ycsを補正するステップは、前記基準温度T0における前記試料の炭素濃度Ycs'=Ycs+A×(T0-T)を算出することが好ましい。これによれば、測定環境温度の変動によらず基準温度におけるシリコン単結晶の炭素濃度を正確に求めることができる。
本発明によるシリコン単結晶の炭素濃度測定方法は、前記炭素濃度の補正量(ΔYcs)を算出する前に、複数の測定温度における前記試料の炭素濃度の測定値(Ycs)に基づいて、前記補正係数Aの値を設定するステップをさらに含むことが好ましい。これによれば、シリコン単結晶中の炭素濃度の測定精度を高めることができる。
本発明において、前記補正係数(A)は、0.011×10¹⁶~0.014×10¹⁶(atoms/(cm3・℃))の範囲内の値であることが好ましい。これによれば、シリコン単結晶中の炭素濃度を正確に求めることができる。
本発明によるシリコン単結晶の炭素濃度測定方法は、前記試料を測定する測定室内の温度を測定し、当該測定室内の温度から前記試料の温度(T)を推定することにより、前記試料の温度(T)を間接的に測定することが好ましい。これによれば、簡易な構成により試料の温度を測定することができる。
また、本発明によるシリコン単結晶の炭素濃度測定装置は、シリコン単結晶の試料の炭素濃度をFT-IRにより測定する炭素濃度測定部と、前記試料の炭素濃度の測定中又は測定前若しくは測定後において前記試料の温度を測定する第1の温度計と、測定された前記試料の炭素濃度が0.5×10¹⁶atoms/cm3以下である場合に、前記試料の測定温度に基づいて前記試料の炭素濃度の測定値を補正する炭素濃度補正部とを備えることを特徴とする。
本発明において、前記炭素濃度補正部は、前記試料の測定温度(T)と基準温度(T0)との温度差及び補正係数(A)に基づいて、前記炭素濃度の補正量(ΔYcs=A×(T0-T))を算出する補正量算出部と、前記炭素濃度の測定値(Ycs)に前記補正量(ΔYcs)を加算することにより、前記基準温度(T0)における前記試料の炭素濃度(Ycs'=Ycs+ΔYcs)を算出する補正値算出部とを含むことが好ましい。これによれば、測定環境温度の変動によらず基準温度におけるシリコン単結晶の炭素濃度を正確に求めることができる。
本発明による炭素濃度測定装置は、前記試料を測定する測定室内の温度を測定する第2の温度計をさらに備え、当該測定室内の温度から前記試料の温度(T)を推定することにより、前記試料の温度(T)を間接的に測定することが好ましい。これによれば、簡易な構成により試料の温度を測定することができる。
本発明によれば、シリコン単結晶中の炭素濃度が非常に低い場合でも当該炭素濃度を正確に測定することが可能なシリコン単結晶の炭素濃度測定方法及び装置を提供することができる。
以下、添付図面を参照しながら、本発明の好ましい実施の形態について詳細に説明する。
図1は、本発明によるシリコン単結晶の炭素濃度測定方法に用いられるFT-IR装置の構成の一例を概略的に示す平面図である。
図1に示すように、FT-IR装置1は、シリコン単結晶中の置換型炭素Csの測定に好適な装置であって、分光室10A内に設けられた光源としての赤外線ランプ11と、赤外線ランプ11の赤外光の干渉縞を出射する干渉計13と、干渉計13からの赤外光の干渉縞を分光室10Aに連設された測定室10B内の試料2に導く平面鏡14a及び凹面鏡14bと、試料2に照射された赤外光の干渉縞の透過光又は反射光を検出する検出器15と、試料2に照射された赤外光の干渉縞の透過光又は反射光を検出器15に導く凹面鏡14cと、検出器15の出力(インターフェログラム)をデジタル変換するA/D変換器18と、装置全体の制御及びフーリエ変換等の演算処理を行う制御部19と、測定したIRスペクトルを記録する記録装置20とを備えている。検出器15、A/D変換器18、制御部19及び記録装置20は、測定室10Bに連設された制御室10C内に設けられている。
また本実施形態によるFT-IR装置1は、測定室10B内に設置された試料2の温度を非接触で測定するパイロメータ17a(第1の温度計)と、測定室10B内の温度を測定する温度センサ17b(第2の温度計)とを備えている。
検出器15によって検出されたインターフェログラムは、A/D変換器18によってデジタル信号に変換された後、制御部19に取り込まれ、参照試料からの同様の検出出力又は試料のない状態での出力をバックグランドにしてフーリエ変換等の演算処理をしてIRスペクトルが得られる。IRスペクトルは記録装置20に記録される。
図2は、FT-IR装置の制御部19の構成を概略的に示すブロック図である。
図2に示すように、FT-IR装置1の制御部19は、装置全体の制御を行うと共に、検出器15の出力であるインターフェログラムに対するフーリエ変換等の演算処理を行うCPU21と、装置全体の制御内容を記憶したROM22と、試料2の大きさ、測定モード、測定条件等の測定に必要な情報や検出器15の出力データ等を一時記憶するRAM23と、インターフェース24とを備えている。
インターフェース24の入力側にはA/D変換器(図示せず)を介して検出器15、パイロメータ17a、温度センサ17b等が接続されている。また、またインターフェース24の出力側には赤外線ランプコントローラ25、干渉計コントローラ26、記録装置コントローラ27等がD/A変換器(図示せず)を介して接続されている。なお、インターフェース24には、図示しないが、測定条件等を入力するための操作部が接続されている。
試料2の測定では、まず赤外線ランプ11を点灯し、また干渉計13及び検出器15等を動作開始状態にする。また赤外線を非常に良く吸収する大気中の二酸化炭素や水蒸気等を取り除くため、分光室10A及び測定室10B内には窒素ガス等のパージガスが導入される。
赤外線ランプ11からの発散光はコリメートミラー11aで平行光にされた後、干渉計13内のビームスプリッタ13cに入る。ビームスプリッタ13cに入射した赤外光は反射光と透過光に分割され、このうち反射光は固定鏡13aで反射してビームスプリッタ13cの方へ戻り、透過光は可動鏡13bで反射してビームスプリッタ13cの方へ戻る。そして2つの光はビームスプリッタ13cで合成されて干渉し、この干渉光は平面鏡14aで反射した後に凹面鏡14bで集光され、試料2を透過又は反射し、凹面鏡14cを経由して検出器15に取り込まれる。
次いで、干渉計13の出射光である赤外光の干渉縞を試料2に照射し、該試料2を透過又は反射する光を検出器15で検出し、参照試料からの同様の検出信号又は試料のない状態での信号をバックグランドにしてフーリエ変換等の演算処理することによりIRスペクトルを測定する。IRスペクトルは記録装置20に記録される。
図3は、制御部19によって実現される炭素濃度測定部30の機能ブロック図である。
図3に示すように、炭素濃度測定部30は、測定試料及び参照試料のIRスペクトルからシリコン単結晶の測定試料に含まれる置換型炭素Csの濃度を定量化する炭素濃度算出部31と、炭素濃度算出部31によって求められた複数の測定温度における測定試料の炭素濃度の測定値Ycsに基づいて補正係数Aを設定する補正係数設定部32と、パイロメータ17a又は温度センサ17bから提供される測定試料の測定温度T、基準温度T0(例えば23℃)及び補正係数Aに基づいて炭素濃度補正量ΔYcs=A×(T0-T)を算出する補正量算出部33と、基準温度T0における炭素濃度Ycs'=Ycs+ΔYcsを算出する補正値算出部34とを備えている。補正係数設定部32、補正量算出部33及び補正値算出部34は、測定試料の炭素濃度が所定値以下である場合に、当該測定試料の測定温度に基づいて当該測定試料の炭素濃度の測定値を補正する炭素濃度補正部を構成している。
本実施形態において、補正係数設定部32は、試料の炭素濃度の測定値Ycsに基づいて、補正係数Aを設定することが好ましい。すなわち、炭素濃度の測定値Ycsに応じて異なる補正係数を用いることが好ましい。このように、補正係数Aを炭素濃度の測定値(Ycs)に基づく可変値とすることにより、炭素濃度をより正確に測定することができる。
炭素濃度の測定値Ycsが1×10¹⁶atoms/cm3よりも大きい場合、補正係数A=0とすることが好ましい。炭素濃度の測定値Ycsが1×1016atoms/cm3よりも大きい場合には、炭素濃度の測定値の温度依存性が低いからである。
補正係数Aは、上記のように段階的に変化させてもよく、炭素濃度の測定値Ycsの変化に合わせて線形的に変化させてもよい。補正係数Aは、0.011×10¹⁶~0.014×10¹⁶の範囲内の値とすることができる。
上記FT-IR測定は、試料の測定温度Tが20~26℃であるときに行う必要がある。この温度範囲外のときにはFT-IR装置1による炭素濃度の測定値の信頼性が低下するからである。
試料の測定温度Tは、炭素濃度測定中における温度であることが好ましいが、炭素濃度を測定する直前の温度であってもよく、炭素濃度を測定した直後の温度であってもよい。また、炭素濃度の測定前後における測定温度から炭素濃度の測定中における試料の測定温度を推定することも可能である。また、試料の温度を直接測定するのではなく、測定室10B内の温度を温度センサ17bで測定し、測定室10B内の温度から試料の測定温度Tを推定してもよい。一例として、試料の測定温度Tが測定室10B内の温度と同じであると推定することが挙げられる。すなわち、試料の測定温度Tを間接的に測定してもよい。これによれば、パイロメータ17aを省略することができ、試料の温度を簡易な構成により測定することができる。
図4は、炭素濃度の補正方法を示すフローチャートである。
図4に示すように、炭素濃度の補正では、測定試料及び参照試料のIRスペクトルからシリコン単結晶の置換型炭素Csの濃度を定量化して測定試料の炭素濃度の測定値Ycsを算出する(ステップS11)。次に、測定試料の炭素濃度の測定値Ycsに基づいて補正係数Aを設定する(ステップS12)。補正係数Aの設定方法は上述の通りであり、炭素濃度の測定値が0.5×10¹⁶atoms/cm3以上の場合には補正係数をゼロとしたので、炭素濃度の補正は行われない。
次に、測定試料の測定温度T、基準温度T0及び補正係数Aに基づいて炭素濃度補正量ΔYcs=A×(T0-T)を算出する(ステップS13)する。その後、測定試料の炭素濃度の測定値Ycsを補正して、基準温度T0における炭素濃度Ycs'=Ycs+ΔYcsを算出する(ステップS14)。炭素濃度の測定値が0.5×10¹⁶atoms/cm3以上の場合、Ycs'=Ycsである。基準温度T0としては、20℃~32℃の範囲内の任意の温度とすることができ、例えば23℃とすることができる。
通常、FT-IR測定はクリーンルーム内で行われ、クリーンルーム内の温度は概ね一定に保たれているが、外気温等の影響によって多少変動する。すなわち、測定環境温度は常に一定ではなく日間変動や季節変動が見られる。従来、炭素濃度が比較的高いシリコン単結晶に対する炭素濃度の測定では、測定環境温度が多少変動しても測定結果のばらつきは見られなかった。しかし、シリコン単結晶中の炭素濃度が低い場合、測定環境温度の変動は炭素濃度の測定値を変動させる要因となり、測定環境温度の変動によってシリコン単結晶の炭素濃度の測定値のばらつきは大きくなる。
しかし、本実施形態においては、測定環境温度の影響を受けた試料の温度変化に合わせて炭素濃度の測定値を補正するので、基準温度T0におけるシリコン単結晶の炭素濃度を正確に測定することができる。また炭素濃度の測定値の大きさによって補正係数を変えるので、シリコン単結晶の炭素濃度をより正確に測定することができる。
以上、本発明の好ましい実施形態について説明したが、本発明は、上記の実施形態に限定されることなく、本発明の主旨を逸脱しない範囲で種々の変更が可能であり、それらも本発明の範囲内に包含されるものであることはいうまでもない。
例えば、上記実施形態において、炭素濃度測定部30はFT-IR装置1の制御部19によって実現されているが、FT-IR装置1とは別のコンピュータによって実現されてもよい。
シリコン単結晶の4つのサンプル#1~#4を用意し、測定温度が22.5±2℃の範囲内で変化したときの各サンプルの炭素濃度の変動率を測定した。
図5は、シリコン単結晶のサンプル#1~#4の測定温度が22.5±2℃の範囲内で変化したときの各サンプルの炭素濃度の変動率を示すグラフであり、横軸はサンプル#1~#4の測定温度が22.5℃のときの炭素濃度(×1016atoms/cm3)、縦軸は±2℃温度変化したときのサンプルの炭素濃度の変動率(%)をそれぞれ示している。
図5に示すように、シリコン単結晶の炭素濃度の変動率は、炭素濃度が低いほど非常に大きくなり、指数関数的に増加することが分かった。逆に、炭素濃度が0.5×10¹⁶atoms/cm3以上のときの炭素濃度の変動率は5%以下であり、温度依存性が非常に低いことが確認された。
次に、シリコン単結晶の炭素濃度をFT-IRにより測定する際に測定環境温度を変化させて炭素濃度の温度依存性を確認した。測定温度は21~24℃とし、FT-IR測定中におけるシリコン単結晶の温度をパイロメータで測定した値である。シリコン単結晶のサンプルは、炭素濃度が0.1×10¹⁶atoms/cm3未満のサンプル、0.1×1016~0.3×1016atoms/cm3のサンプル、0.3×1016~0.5×1016atoms/cm3のサンプルをそれぞれ7個ずつ用意した。
図6は、炭素濃度が0.1×10¹⁶atoms/cm3未満の場合の炭素濃度の温度依存性を示すグラフであり、横軸は測定温度(℃)、縦軸は炭素濃度(×1016atoms/cm3)をそれぞれ示している。グラフ中のプロット値は、各温度における7個のサンプルの炭素濃度の平均値である。
図6に示すように、炭素濃度は測定温度の増加と共に大きくなる傾向がみられた。測定温度xと炭素濃度yとの関係を示す一次回帰式は、y=0.0114x-0.211となり、補正係数:A≒0.011×10¹⁶となった。また決定係数:R2=0.988となり、単結晶中の炭素濃度が0.1×10¹⁶atoms/cm3未満と非常に低い場合、測定温度と炭素濃度との間には非常に強い相関があることが分かった。
図7は、炭素濃度が0.1×10¹⁶~0.3×10¹⁶atoms/cm3の場合の炭素濃度の温度依存性を示すグラフであり、横軸は測定温度(℃)、縦軸は炭素濃度(×1016atoms/cm3)をそれぞれ示している。グラフ中のプロット値は、各温度における7個のサンプルの炭素濃度の平均値である。
図7に示すように、炭素濃度は測定温度の増加と共に大きくなる傾向がみられた。測定温度xと炭素濃度yとの関係を示す一次回帰式は、y=0.0111x-0.0106となり、補正係数:A≒0.011×10¹⁶となった。また決定係数:R2=0.923となり、単結晶中の炭素濃度が0.1×10¹⁶~0.3×10¹⁶atoms/cm3と低い場合、測定温度と炭素濃度との間には強い相関があることが分かった。
図8は、炭素濃度が0.3×10¹⁶~0.5×10¹⁶atoms/cm3の場合の炭素濃度の温度依存性を示すグラフであり、横軸は測定温度(℃)、縦軸は炭素濃度(×1016atoms/cm3)をそれぞれ示している。グラフ中のプロット値は、各温度における7個のサンプルの炭素濃度の平均値である。
図8に示すように、炭素濃度は測定温度の増加と共に大きくなる傾向がみられた。測定温度xと炭素濃度yとの関係を示す一次回帰式は、y=0.0139x-0.1058となり、補正係数:A≒0.014×10¹⁶となった。また決定係数:R2=0.791となり、単結晶中の炭素濃度が0.3×10¹⁶~0.5×10¹⁶atoms/cm3と低い場合、測定温度と炭素濃度との間には強い相関があることが分かった。
1 FT-IR装置(炭素濃度測定装置)
2 測定試料(シリコン単結晶)
10A 分光室
10B 測定室
10C 制御室
11 赤外線ランプ
11a コリメートミラー
13 干渉計
13a 固定鏡
13b 可動鏡
13c ビームスプリッタ
14a 平面鏡
14b 凹面鏡
14c 凹面鏡
15 検出器
17a パイロメータ
17b 温度センサ
18 変換器
19 制御部
20 記録装置
24 インターフェース
25 赤外線ランプコントローラ
26 干渉計コントローラ
27 記録装置コントローラ
30 炭素濃度測定部
31 炭素濃度算出部
32 補正係数設定部
33 補正量算出部
34 補正値算出部
2 測定試料(シリコン単結晶)
10A 分光室
10B 測定室
10C 制御室
11 赤外線ランプ
11a コリメートミラー
13 干渉計
13a 固定鏡
13b 可動鏡
13c ビームスプリッタ
14a 平面鏡
14b 凹面鏡
14c 凹面鏡
15 検出器
17a パイロメータ
17b 温度センサ
18 変換器
19 制御部
20 記録装置
24 インターフェース
25 赤外線ランプコントローラ
26 干渉計コントローラ
27 記録装置コントローラ
30 炭素濃度測定部
31 炭素濃度算出部
32 補正係数設定部
33 補正量算出部
34 補正値算出部
Claims (9)
- シリコン単結晶の試料の炭素濃度をFT-IRにより測定するステップと、
前記試料の炭素濃度の測定中又は測定前若しくは測定後において前記試料の温度を測定するステップと、
測定された前記試料の炭素濃度が0.5×10¹⁶atoms/cm3以下である場合に、前記試料の測定温度に基づいて前記試料の炭素濃度の測定値を補正するステップとを備えることを特徴とするシリコン単結晶の炭素濃度測定方法。 - 前記試料の炭素濃度の測定値を補正するステップは、
前記試料の測定温度と基準温度との温度差及び補正係数に基づいて、前記炭素濃度の補正量を算出するステップと、
前記炭素濃度の測定値に前記補正量を加算することにより、前記基準温度における前記試料の炭素濃度を算出するステップとを含む、請求項1に記載の炭素濃度測定方法。 - 前記試料の炭素濃度の測定値をYcs、前記試料の測定温度をT、前記試料の基準温度をT0、前記補正係数をA、前記基準温度T0における前記試料の炭素濃度をYcs'とするとき、前記試料の炭素濃度の測定値Ycsを補正するステップは、前記基準温度T0における前記試料の炭素濃度Ycs'=Ycs+A×(T0-T)を算出する、請求項2に記載の炭素濃度測定方法。
- 前記炭素濃度の補正量を算出する前に、複数の測定温度における前記試料の炭素濃度の測定値に基づいて、前記補正係数の値を設定するステップをさらに含む、請求項2又は3に記載の炭素濃度測定方法。
- 前記補正係数は、0.011×10¹⁶~0.014×10¹⁶(atoms/(cm3・℃))の範囲内の値である、請求項2乃至4のいずれか一項に記載の炭素濃度測定方法。
- 前記試料を測定する測定室内の温度を測定し、当該測定室内の温度から前記試料の温度を推定することにより、前記試料の温度を間接的に測定する、請求項1乃至5のいずれか一項に記載の炭素濃度測定方法。
- シリコン単結晶の試料の炭素濃度をFT-IRにより測定する炭素濃度測定部と、
前記試料の炭素濃度の測定中又は測定前若しくは測定後において前記試料の温度を測定する第1の温度計と、
測定された前記試料の炭素濃度が0.5×10¹⁶atoms/cm3以下である場合に、前記試料の測定温度に基づいて前記試料の炭素濃度の測定値を補正する炭素濃度補正部とを備えることを特徴とするシリコン単結晶の炭素濃度測定装置。 - 前記炭素濃度補正部は、
前記試料の測定温度と基準温度との温度差及び補正係数に基づいて、前記炭素濃度の補正量を算出する補正量算出部と、
前記炭素濃度の測定値に前記補正量を加算することにより、前記基準温度における前記試料の炭素濃度を算出する補正値算出部とを含む、請求項7に記載のシリコン単結晶の炭素濃度測定装置。 - 前記試料を測定する測定室内の温度を測定する第2の温度計をさらに備え、
当該測定室内の温度から前記試料の温度を推定することにより、前記試料の温度を間接的に測定する、請求項7又は8に記載のシリコン単結晶の炭素濃度測定装置。
Priority Applications (4)
| Application Number | Priority Date | Filing Date | Title |
|---|---|---|---|
| US16/963,581 US11112354B2 (en) | 2018-07-20 | 2019-05-23 | Method and device for measuring carbon concentration in silicon single crystal |
| CN201980048489.0A CN112654856B (zh) | 2018-07-20 | 2019-05-23 | 单晶硅的碳浓度测定方法及装置 |
| DE112019003657.2T DE112019003657B4 (de) | 2018-07-20 | 2019-05-23 | Verfahren und Vorrichtung zur Messung der Kohlenstoffkonzentration in einem Silicium-Einkristall |
| KR1020207036808A KR102432166B1 (ko) | 2018-07-20 | 2019-05-23 | 실리콘 단결정의 탄소 농도 측정 방법 및 장치 |
Applications Claiming Priority (2)
| Application Number | Priority Date | Filing Date | Title |
|---|---|---|---|
| JP2018136376A JP6950639B2 (ja) | 2018-07-20 | 2018-07-20 | シリコン単結晶の炭素濃度測定方法及び装置 |
| JP2018-136376 | 2018-07-20 |
Publications (1)
| Publication Number | Publication Date |
|---|---|
| WO2020017147A1 true WO2020017147A1 (ja) | 2020-01-23 |
Family
ID=69163641
Family Applications (1)
| Application Number | Title | Priority Date | Filing Date |
|---|---|---|---|
| PCT/JP2019/020377 Ceased WO2020017147A1 (ja) | 2018-07-20 | 2019-05-23 | シリコン単結晶の炭素濃度測定方法及び装置 |
Country Status (6)
| Country | Link |
|---|---|
| US (1) | US11112354B2 (ja) |
| JP (1) | JP6950639B2 (ja) |
| KR (1) | KR102432166B1 (ja) |
| CN (1) | CN112654856B (ja) |
| DE (1) | DE112019003657B4 (ja) |
| WO (1) | WO2020017147A1 (ja) |
Families Citing this family (1)
| Publication number | Priority date | Publication date | Assignee | Title |
|---|---|---|---|---|
| CN217286148U (zh) * | 2021-04-20 | 2022-08-26 | 施瑞源 | 用于牙科的激光装置 |
Citations (10)
| Publication number | Priority date | Publication date | Assignee | Title |
|---|---|---|---|---|
| JPH0599844A (ja) * | 1991-07-18 | 1993-04-23 | Nippon Bio Ratsudo Lab Kk | フーリエ変換式赤外分光分析方法及びその装置 |
| JPH06194310A (ja) * | 1992-09-30 | 1994-07-15 | Shin Etsu Handotai Co Ltd | シリコン単結晶中の置換型炭素濃度の測定方法および自動測定装置 |
| JPH09283584A (ja) * | 1996-04-09 | 1997-10-31 | Toshiba Ceramics Co Ltd | シリコン結晶炭素濃度測定方法 |
| JP2001118902A (ja) * | 1999-10-15 | 2001-04-27 | Shin Etsu Handotai Co Ltd | 検査用ウェーハ、その作成方法、及びそれを用いた検査方法 |
| US20020011852A1 (en) * | 2000-03-21 | 2002-01-31 | Andreas Mandelis | Non-contact photothermal radiometric metrologies and instrumentation for characterization of semiconductor wafers, devices and non electronic materials |
| JP2003215028A (ja) * | 2002-01-17 | 2003-07-30 | Advantest Corp | 化学物質検出方法及び装置 |
| JP2004253726A (ja) * | 2003-02-21 | 2004-09-09 | Shin Etsu Handotai Co Ltd | 試料の検査装置および試料の検査方法 |
| JP2009162667A (ja) * | 2008-01-08 | 2009-07-23 | Sumco Techxiv株式会社 | 分光吸収測定方法及び分光吸収測定装置 |
| JP2015017019A (ja) * | 2013-07-12 | 2015-01-29 | グローバルウェーハズ・ジャパン株式会社 | シリコン単結晶及びその製造方法 |
| US20180088042A1 (en) * | 2016-09-27 | 2018-03-29 | Infineon Technologies Ag | Method and assembly for determining the carbon content in silicon |
Family Cites Families (9)
| Publication number | Priority date | Publication date | Assignee | Title |
|---|---|---|---|---|
| US5444246A (en) | 1992-09-30 | 1995-08-22 | Shin-Etsu Handotai Co., Ltd. | Determining carbon concentration in silicon single crystal by FT-IR |
| US20020179006A1 (en) * | 2001-04-20 | 2002-12-05 | Memc Electronic Materials, Inc. | Method for the preparation of a semiconductor substrate with a non-uniform distribution of stabilized oxygen precipitates |
| WO2004073057A1 (ja) * | 2003-02-14 | 2004-08-26 | Sumitomo Mitsubishi Silicon Corporation | シリコンウェーハの製造方法 |
| JP4805681B2 (ja) * | 2006-01-12 | 2011-11-02 | ジルトロニック アクチエンゲゼルシャフト | エピタキシャルウェーハおよびエピタキシャルウェーハの製造方法 |
| US7520932B2 (en) * | 2006-04-05 | 2009-04-21 | Dow Corning Corporation | Method of analyzing carbon concentration in crystalline silicon |
| JP2010243450A (ja) * | 2009-04-09 | 2010-10-28 | Japan Energy Corp | シリコン試料中の炭素濃度の測定方法及びそれを利用したシリコン製品の製造方法 |
| JP5524894B2 (ja) * | 2011-04-04 | 2014-06-18 | 信越化学工業株式会社 | 多結晶シリコン中の炭素濃度測定方法 |
| JP6528710B2 (ja) * | 2016-04-11 | 2019-06-12 | 株式会社Sumco | シリコン試料の炭素濃度測定方法およびシリコン単結晶インゴットの製造方法 |
| JP6531729B2 (ja) * | 2016-07-19 | 2019-06-19 | 株式会社Sumco | シリコン試料の炭素濃度評価方法、シリコンウェーハ製造工程の評価方法、シリコンウェーハの製造方法およびシリコン単結晶インゴットの製造方法 |
-
2018
- 2018-07-20 JP JP2018136376A patent/JP6950639B2/ja active Active
-
2019
- 2019-05-23 WO PCT/JP2019/020377 patent/WO2020017147A1/ja not_active Ceased
- 2019-05-23 CN CN201980048489.0A patent/CN112654856B/zh active Active
- 2019-05-23 KR KR1020207036808A patent/KR102432166B1/ko active Active
- 2019-05-23 US US16/963,581 patent/US11112354B2/en active Active
- 2019-05-23 DE DE112019003657.2T patent/DE112019003657B4/de active Active
Patent Citations (10)
| Publication number | Priority date | Publication date | Assignee | Title |
|---|---|---|---|---|
| JPH0599844A (ja) * | 1991-07-18 | 1993-04-23 | Nippon Bio Ratsudo Lab Kk | フーリエ変換式赤外分光分析方法及びその装置 |
| JPH06194310A (ja) * | 1992-09-30 | 1994-07-15 | Shin Etsu Handotai Co Ltd | シリコン単結晶中の置換型炭素濃度の測定方法および自動測定装置 |
| JPH09283584A (ja) * | 1996-04-09 | 1997-10-31 | Toshiba Ceramics Co Ltd | シリコン結晶炭素濃度測定方法 |
| JP2001118902A (ja) * | 1999-10-15 | 2001-04-27 | Shin Etsu Handotai Co Ltd | 検査用ウェーハ、その作成方法、及びそれを用いた検査方法 |
| US20020011852A1 (en) * | 2000-03-21 | 2002-01-31 | Andreas Mandelis | Non-contact photothermal radiometric metrologies and instrumentation for characterization of semiconductor wafers, devices and non electronic materials |
| JP2003215028A (ja) * | 2002-01-17 | 2003-07-30 | Advantest Corp | 化学物質検出方法及び装置 |
| JP2004253726A (ja) * | 2003-02-21 | 2004-09-09 | Shin Etsu Handotai Co Ltd | 試料の検査装置および試料の検査方法 |
| JP2009162667A (ja) * | 2008-01-08 | 2009-07-23 | Sumco Techxiv株式会社 | 分光吸収測定方法及び分光吸収測定装置 |
| JP2015017019A (ja) * | 2013-07-12 | 2015-01-29 | グローバルウェーハズ・ジャパン株式会社 | シリコン単結晶及びその製造方法 |
| US20180088042A1 (en) * | 2016-09-27 | 2018-03-29 | Infineon Technologies Ag | Method and assembly for determining the carbon content in silicon |
Also Published As
| Publication number | Publication date |
|---|---|
| JP2020012772A (ja) | 2020-01-23 |
| KR102432166B1 (ko) | 2022-08-11 |
| CN112654856B (zh) | 2024-03-22 |
| DE112019003657B4 (de) | 2023-01-26 |
| JP6950639B2 (ja) | 2021-10-13 |
| US20210055213A1 (en) | 2021-02-25 |
| CN112654856A (zh) | 2021-04-13 |
| US11112354B2 (en) | 2021-09-07 |
| KR20210011994A (ko) | 2021-02-02 |
| DE112019003657T5 (de) | 2021-04-15 |
Similar Documents
| Publication | Publication Date | Title |
|---|---|---|
| US7767969B2 (en) | Method and apparatus for measuring spectroscopic absorbance | |
| US10241038B2 (en) | Spectrophotometer and spectrophotometry method | |
| US10274422B2 (en) | Gas analysis apparatus and gas analysis method | |
| JP6248211B2 (ja) | ガスセンサの温度補償 | |
| US11099124B2 (en) | Gas analysis apparatus, program for gas analysis apparatus, and gas analysis method | |
| US20180364100A1 (en) | Arithmetic Expression Calculation Method for Correcting Output of Photo Detector and Output Correction Method of Photo Detector | |
| TW202014668A (zh) | 膜厚測定裝置及修正方法 | |
| RU2571185C2 (ru) | Способ компенсации дрейфа амплитуды в спектрометре и спектрометр, осуществляющий указанный способ | |
| WO2022118694A1 (ja) | ガス分析装置及びガス分析方法 | |
| JP6950639B2 (ja) | シリコン単結晶の炭素濃度測定方法及び装置 | |
| CN114544536B (zh) | 一种氮氧化物浓度校准模型的生成方法 | |
| US20050211901A1 (en) | Method for determining the substitutional carbon content in monocrystalline or polycrystalline silicon | |
| JP4146697B2 (ja) | 温度計測方法および温度計測装置 | |
| Sperling et al. | Quantitative infrared spectroscopy of tetrakis (dimethylamido) titanium for process measurements | |
| JP6558907B2 (ja) | ガス濃度測定装置及びガス濃度測定方法 | |
| CN116313865B (zh) | 量测校准方法及监控量测设备稳定性方法 | |
| JP2020094990A (ja) | 光学分析装置、並びに光学分析装置に用いられる機械学習装置及びその方法 | |
| US10571391B2 (en) | Method for adjusting a measuring device | |
| JP2025108956A (ja) | 成分濃度定量方法、および成分濃度定量プログラム | |
| CN108169208A (zh) | 一种拉曼光谱检测仪校准方法 | |
| JP2025540345A (ja) | 基板のための位相分解光計測学 | |
| CN106950185A (zh) | 一种光学仪器光谱响应的订正方法及装置 | |
| CN117030651A (zh) | 一种应用于ndir基于热电堆的气体传感器标定校准的算法 |
Legal Events
| Date | Code | Title | Description |
|---|---|---|---|
| 121 | Ep: the epo has been informed by wipo that ep was designated in this application |
Ref document number: 19837167 Country of ref document: EP Kind code of ref document: A1 |
|
| ENP | Entry into the national phase |
Ref document number: 20207036808 Country of ref document: KR Kind code of ref document: A |
|
| 122 | Ep: pct application non-entry in european phase |
Ref document number: 19837167 Country of ref document: EP Kind code of ref document: A1 |