WO2019124170A1 - 超音波観測装置、超音波観測装置の作動方法および超音波観測装置の作動プログラム - Google Patents
超音波観測装置、超音波観測装置の作動方法および超音波観測装置の作動プログラム Download PDFInfo
- Publication number
- WO2019124170A1 WO2019124170A1 PCT/JP2018/045565 JP2018045565W WO2019124170A1 WO 2019124170 A1 WO2019124170 A1 WO 2019124170A1 JP 2018045565 W JP2018045565 W JP 2018045565W WO 2019124170 A1 WO2019124170 A1 WO 2019124170A1
- Authority
- WO
- WIPO (PCT)
- Prior art keywords
- ultrasonic
- sensitivity
- unit
- observation apparatus
- display image
- Prior art date
- Legal status (The legal status is an assumption and is not a legal conclusion. Google has not performed a legal analysis and makes no representation as to the accuracy of the status listed.)
- Ceased
Links
Images


Classifications
-
- A—HUMAN NECESSITIES
- A61—MEDICAL OR VETERINARY SCIENCE; HYGIENE
- A61B—DIAGNOSIS; SURGERY; IDENTIFICATION
- A61B8/00—Diagnosis using ultrasonic, sonic or infrasonic waves
- A61B8/46—Ultrasonic, sonic or infrasonic diagnostic devices with special arrangements for interfacing with the operator or the patient
- A61B8/461—Displaying means of special interest
- A61B8/463—Displaying means of special interest characterised by displaying multiple images or images and diagnostic data on one display
-
- A—HUMAN NECESSITIES
- A61—MEDICAL OR VETERINARY SCIENCE; HYGIENE
- A61B—DIAGNOSIS; SURGERY; IDENTIFICATION
- A61B8/00—Diagnosis using ultrasonic, sonic or infrasonic waves
- A61B8/13—Tomography
- A61B8/14—Echo-tomography
-
- A—HUMAN NECESSITIES
- A61—MEDICAL OR VETERINARY SCIENCE; HYGIENE
- A61B—DIAGNOSIS; SURGERY; IDENTIFICATION
- A61B8/00—Diagnosis using ultrasonic, sonic or infrasonic waves
- A61B8/52—Devices using data or image processing specially adapted for diagnosis using ultrasonic, sonic or infrasonic waves
- A61B8/5207—Devices using data or image processing specially adapted for diagnosis using ultrasonic, sonic or infrasonic waves involving processing of raw data to produce diagnostic data, e.g. for generating an image
Definitions
- the present invention relates to an ultrasound observation apparatus, an operation method of the ultrasound observation apparatus, and an operation program of the ultrasound observation apparatus.
- an ultrasound diagnostic system that performs diagnosis using an ultrasound probe, it is required to notify the user of the state of the ultrasound transducer provided in the ultrasound probe each time the ultrasound probe is connected to the ultrasound observation apparatus. It is getting worse.
- an electronic scanning ultrasonic probe a plurality of elements included in an ultrasonic transducer are driven at one time to acquire sound ray data. Therefore, even if the sensitivity reduction occurs in one element, the influence on the image is small, and it is difficult for the user to view the image and judge the sensitivity reduction.
- Patent Document 1 has a circuit for detecting an abnormal state for each of the transmission and reception channels of the ultrasonic probe, and when an abnormal state is detected, judgment as to whether or not diagnosis is possible is made.
- Techniques for display are disclosed. In this technology, information on a channel in an abnormal state is displayed by characters to notify the user.
- Patent Document 2 it is determined whether the sensitivity characteristic of the evaluation vibrating element is normal based on the reception signal obtained from the predetermined evaluation vibrating element of the ultrasonic probe, and based on the determination result.
- a technique is disclosed that generates characteristic distribution data indicating the distribution of sensitivity characteristics of a plurality of transducer elements, and determines the propriety of diagnosis.
- the display unit informs the user of the abnormal part of the ultrasonic probe by displaying the vibrating element determined to be abnormal as distinguishable from the normal vibrating element.
- the present invention has been made in view of the above, and it is an ultrasonic observation that enables the user to intuitively grasp the influence on the ultrasonic image caused by the decrease in sensitivity of the element of the ultrasonic probe.
- Device, method of operating ultrasound observation device, and operation program of ultrasound observation device are provided.
- the ultrasonic observation apparatus can connect an ultrasonic probe provided with an ultrasonic transducer having a plurality of elements for generating ultrasonic waves, It is an ultrasonic observation device that generates data of an ultrasonic image based on an echo signal received from the ultrasonic probe while transmitting a transmission signal for generating an ultrasonic wave to the ultrasonic probe connected to the ultrasonic probe.
- a determination unit that determines whether each device is a sensitivity reduction device having a sensitivity decrease using data of digital signals corresponding to the echo signals received by a plurality of devices, and the determination unit is a sensitivity reduction device
- An area specifying unit for specifying an area in the ultrasonic image in which the sensitivity is lowered based on the contribution of the element determined to be present to the ultrasonic beam, and the area specified by the area specifying unit are displayed
- a sensitivity reduction unit display image generation unit for generating data that desensitization unit displaying an image, characterized by comprising a.
- the sensitivity reduction portion display image generation portion has data of a sensitivity reduction portion display image having a display form according to the contribution degree of the sensitivity reduction element to the ultrasonic beam. It is characterized by generating.
- the area specifying unit calculates a total contribution degree obtained by totaling the contribution degree of the sensitivity reducing element to the ultrasonic beam, and the area contribution unit calculates the total contribution degree It is characterized by specifying an area.
- the sensitivity reduction unit display image generation unit generates data of the sensitivity reduction unit display image by allocating visual information according to the total contribution degree to the area. It is characterized by
- the ultrasonic observation apparatus is characterized in that, in the above-mentioned invention, the area specifying unit specifies the area based on the degree of contribution according to the depth at which the ultrasonic wave reaches.
- the ultrasonic observation apparatus is characterized in that, in the above-mentioned invention, the area specifying unit specifies the area based on the degree of contribution according to the type of the connected ultrasonic probe.
- the determination unit acquires sensitivity information of one or more elements, and determines whether each element is a sensitivity reducing element based on the sensitivity information. It is characterized by
- the determination unit determines whether each element is a sensitivity reducing element based on a condition defined for each type of connected ultrasonic probe. It is characterized by
- the ultrasonic observation apparatus is characterized in that, in the above-mentioned invention, the judgment unit carries out the judgment when the connection of the ultrasonic probe is detected.
- an ultrasonic probe provided with an ultrasonic transducer having a plurality of elements generating ultrasonic waves can be connected, and ultrasonic waves are transmitted to the connected ultrasonic probe.
- An operation method of an ultrasound observation apparatus which generates ultrasound image data based on an echo signal received from the ultrasound probe while transmitting a transmission signal to be generated, the determination unit including the plurality of elements.
- the operation program of the ultrasonic observation apparatus is connectable to an ultrasonic probe provided with an ultrasonic transducer having a plurality of elements generating ultrasonic waves, and the ultrasonic wave is connected to the connected ultrasonic probe.
- An operation program of an ultrasonic observation apparatus which generates ultrasonic image data based on an echo signal received from the ultrasonic probe while transmitting a transmission signal to be generated, wherein the determination unit is the plurality of elements
- the user it is possible for the user to intuitively grasp the influence on the ultrasound image caused by the decrease in sensitivity of the ultrasound element of the ultrasound probe.
- FIG. 1 is a block diagram showing a configuration of an ultrasound diagnostic system provided with the ultrasound observation apparatus according to Embodiment 1 of the present invention.
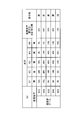
- FIG. 2 is a diagram for explaining an outline of processing performed by the sensitivity reduction unit display image generation unit of the ultrasound observation apparatus according to the first embodiment of the present invention.
- FIG. 3 is a view showing a display example of a sensitivity reduction portion display image displayed by the display device in the first embodiment of the present invention.
- FIG. 4 is a flowchart showing an outline of the element sensitivity determination process performed by the ultrasonic observation apparatus according to the first embodiment of the present invention.
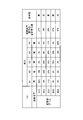
- FIG. 5 is a diagram (part 1) illustrating an outline of processing performed by the sensitivity reduction unit display image generation unit of the ultrasound observation apparatus according to the second embodiment of the present invention.
- FIG. 1 is a block diagram showing a configuration of an ultrasound diagnostic system provided with the ultrasound observation apparatus according to Embodiment 1 of the present invention.
- FIG. 2 is a diagram for explaining an outline of processing performed by the sensitivity reduction
- FIG. 6 is a diagram (part 2) illustrating an outline of a process performed by the sensitivity reduction unit display image generation unit of the ultrasound observation apparatus according to the second embodiment of the present invention.
- FIG. 7 is a diagram (part 3) illustrating an outline of processing performed by the sensitivity reduction unit display image generation unit of the ultrasound observation apparatus according to the second embodiment of the present invention.
- FIG. 8 is a view showing a display example of a sensitivity reduction portion display image displayed by the display device in the second embodiment of the present invention.
- FIG. 1 is a block diagram showing a configuration of an ultrasound diagnostic system provided with the ultrasound observation apparatus according to Embodiment 1 of the present invention.
- the ultrasound diagnostic system 1 shown in the figure transmits an ultrasound wave to a subject to be observed, and receives an ultrasound wave reflected by the subject.
- generated are provided.
- the ultrasonic probe 2 converts an electrical pulse signal received from the ultrasonic observation apparatus 3 into an ultrasonic pulse (acoustic pulse) at its tip and irradiates the object with the ultrasonic pulse, and
- the ultrasonic transducer 21 has an ultrasonic transducer 21 for converting an acoustic echo into an electrical echo signal (ultrasound signal) that is expressed by a voltage change.
- the ultrasonic transducer 21 is an electronic scanning type having a plurality of elements arranged in an array. The element is configured using a piezoelectric material such as lead zirconate titanate (PZT), lead titanate (PT), or lead niobate, and converts ultrasonic waves by converting mechanical energy and electrical energy. Send and receive.
- PZT lead zirconate titanate
- PT lead titanate
- lead niobate lead niobate
- the ultrasound probe 2 may be an ultrasound endoscope further having an imaging optical system and an imaging element, or may be a small diameter miniature probe not having an optical system. Further, the ultrasonic probe 2 may be of an extracorporeal type in which ultrasonic waves are irradiated from the body surface of the subject as well as the type inserted into the body of the subject.
- the ultrasound observation apparatus 3 includes a transmission unit 31, a reception unit 32, a signal processing unit 33, an ultrasound image generation unit 34, a determination unit 35, an area identification unit 36, and a sensitivity reduction unit display image generation unit 37. , An input unit 38, a control unit 39, and a storage unit 40.
- the transmission unit 31 is electrically connected to the ultrasound probe 2 and transmits a transmission signal (pulse signal) to the ultrasound transducer 21.
- the frequency band of the pulse signal transmitted by the transmission unit 31 may be a wide band that substantially covers the linear response frequency band of the electroacoustic conversion of the pulse signal in the ultrasonic transducer 21 to the ultrasonic pulse.
- the transmission unit 31 transmits a transmission signal to a plurality of elements constituting one sound ray while controlling the transmission timing to each element.
- the transmitter 31 transmits various control signals output from the controller 39 to the ultrasound probe 2. In addition, when detecting the presence or absence of the sensitivity fall of an element, you may make the power of the transmission signal which the transmission part 31 transmits stronger than the power of the transmission signal at the time of a test
- the receiving unit 32 receives an echo signal, which is an electrical reception signal, from the ultrasonic transducer 21 and performs A / D conversion to convert data of a digital radio frequency (RF) signal (hereinafter referred to as RF data). Generate).
- the receiving unit 32 also has a function of receiving various types of information including the identification ID from the ultrasound probe 2 and transmitting the information to the control unit 39.
- the signal processing unit 33 generates digital ultrasound image reception data based on the RF data received from the receiving unit 32. Specifically, the signal processing unit 33 performs known processing such as digital beam forming (DBF) processing for adjusting and adding phases of a plurality of RF data, envelope detection processing, and logarithmic conversion processing, and Generate reception data for ultrasound image.
- the ultrasonic image reception data is a plurality of line data (sound ray data) in which the amplitude or intensity of the reception signal indicating the intensity of reflection of the ultrasonic pulse is arranged along the transmission / reception direction (depth direction) of the ultrasonic pulse. It consists of
- the signal processing unit 33 outputs the generated reception data for ultrasound image for one frame to the ultrasound image generation unit 34.
- the ultrasound image generation unit 34 generates ultrasound image data based on the reception data for ultrasound image received from the signal processing unit 33.
- the ultrasound image generation unit 34 has a digital scan converter (DSC) that converts the ultrasound image reception data into data according to the display method of the display device 4.
- the ultrasound image generation unit 34 further performs known signal processing such as gain processing and contrast processing to generate ultrasound image data.
- This ultrasound image data is so-called B mode image data.
- the B-mode image is a grayscale image in which the values of R (red), G (green), and B (blue), which are variables when an RGB color system is adopted as a color space, are matched.
- the determination unit 35 analyzes the RF data received from the reception unit 32 to determine the presence or absence of the sensitivity decrease in the element included in the ultrasonic transducer 21. After the determination unit 35 detects the amplitude of the RF data as a sensitivity value, the sensitivity value is compared with a predetermined threshold value, and an element having a sensitivity value smaller than the threshold value is an element having a sensitivity decrease (hereinafter referred to as sensitivity decrease element). It is determined that The determination unit 35 writes, for example, sensitivity information in which the element determined to be the sensitivity reduction element is 1 and the other elements are 0 in the storage unit 40 and stores the information.
- This determination process is performed in a state where the distal end portion of the ultrasonic probe 2 is held in the air after the user connects the ultrasonic probe 2 to the ultrasonic observation apparatus 3.
- an echo signal received by the receiving unit 32 with respect to the transmission signal transmitted by the transmitting unit 31 is reflected at the interface between the ultrasonic transducer 21 and air. It is an echo signal that has returned.
- the area specifying unit 36 uses the sensitivity information for each element stored in the storage unit 40 to specify an area affected by the sensitivity decrease in the ultrasonic image.
- the area specifying unit 36 specifies the sensitivity reduction part based on the degree of contribution of the element for the transmission numerical aperture to the ultrasonic beam.
- FIG. 2 is a diagram for explaining an outline of processing performed by the area specifying unit 36.
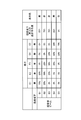
- FIG. 2 exemplifies the case where one ultrasonic beam is formed by using five elements E1 to E5, and the determination unit 35 determines that the element E2 and the element E3 are sensitivity reducing elements among the five elements E1 to E5. The case where it is judged is illustrated. Further, the ultrasonic probe 2 emits five ultrasonic beams B1 to B5. It goes without saying that the number of elements of the ultrasonic transducer 21 is not limited to this.
- Each ultrasonic beam Bi has the highest contribution from the element Ei, and the lower the contribution from the element Ei, the lower the contribution.
- the contribution of the element E1 is 75%
- the contribution of the element E2 is 25%
- the contributions of the elements E3 to E5 are 0%.
- the ultrasonic beam B2 has a contribution of 50% to the element E2, 25% to each of the elements E1 and E3, and 0% to the elements E4 and E5.
- Information on the degree of contribution to the ultrasonic beam for each element is stored in the storage unit 40.
- weighting may be performed by another method based on the degree of contribution of the element to the ultrasonic beam.
- the weights of the central element Ei and the three elements adjacent to the element Ei are equally maximized, and the weights of the other elements are relatively lowered.
- the method of weighting is not limited to the method described above as long as at least the weight of the central element is the largest and the weight of the element farthest from the central element is the smallest.
- the area specifying unit 36 calculates, for each ultrasonic beam, a total contribution degree obtained by summing the contribution degree of the sensitivity reducing element.
- the degree of contribution is the degree of contribution of each element to the ultrasonic beam (the ratio of the transmission intensity to which it contributes), and the sum of the degrees of contribution to one ultrasonic beam is always 100%.
- the sum of the degrees of contribution of the sensitivity reducing elements is the value of the total degree of contribution shown in the table. The larger this value, the greater the influence of the sensitivity reducing element.
- the degrees of contribution of the sensitivity reduction elements E2 and E3 are calculated for the ultrasonic beams B1 to B5.
- the sensitivity reduction unit display image generation unit 37 generates data of a sensitivity reduction unit display image that displays the area (sensitivity reduction unit) specified by the area specification unit 36.
- the sensitivity reduction unit display image generation unit 37 generates data of the sensitivity reduction unit display image based on the total contribution degree calculated by the region identification unit 36.
- the sensitivity reduction part display image generation part 37 allocates the color according to the total contribution degree for every area
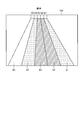
- FIG. 3 is a view showing a display example of the sensitivity reduction unit display image displayed by the display device 4.
- the sensitivity reduced portion display image 100 shown in the figure shows a display example in the case where the processing described with reference to FIG. 2 is performed and colors are assigned in accordance with the above-described rule.
- the sensitivity-reduced portion display image 100 displays beam regions b1 and b4 corresponding to the ultrasonic beams B1 and B4 in yellow (indicated by dots in FIG. 3), and beam regions b2 corresponding to the ultrasonic beams B2 and B3. , B3 are displayed in red (indicated by diagonal lines in FIG. 3), and the beam area b5 corresponding to the ultrasonic beam B5 is displayed in white.
- the sensitivity reduction unit display image generation unit 37 displays the sensitivity reduction unit display by allocating visual information such as saturation, lightness, pattern, or pattern according to the total contribution instead of allocating a color according to the total contribution. Image data may be generated.
- the input unit 38 is configured using a user interface such as a keyboard, a button, a mouse, a trackball, a touch panel, and a touch pad, and receives input of various operation signals.
- a signal instructing start of sensitivity determination processing of the element of the ultrasonic transducer 21 is included.
- the control unit 39 reads the information stored and stored by the storage unit 40 from the storage unit 40, and executes various arithmetic processing related to the operation method of the ultrasound observation apparatus 3 to perform ultrasound diagnosis including the ultrasound observation apparatus 3 Integrate and control the operation of the system 1.
- the storage unit 40 is a threshold of the sensitivity value to be referred to when the determination unit 35 makes a determination, information such as a result of determination made by the determination unit 35 for each element, an ultrasonic beam and an element that the sensitivity reduction unit display image generation unit 37 refers And the relationship between the total contribution degree and the assignment of colors to the desensitized portion display image.
- the threshold of the sensitivity value stored in the storage unit 40 may be different depending on the type of the ultrasound probe 2.
- the storage unit 40 stores various programs for operating the ultrasound diagnostic system 1 and data including various parameters and the like necessary for the operation of the ultrasound diagnostic system 1.
- the various programs include an operating program for executing the operating method of the ultrasound diagnostic system 1.
- the various programs can be stored in a computer readable storage medium such as a hard disk, a flash memory, a CD-ROM, a DVD-ROM, a flexible disk and the like, and can be widely distributed. Also, various programs can be acquired by downloading via a communication network.
- the communication network referred to here is realized by, for example, an existing public line network, LAN (Local Area Network), WAN (Wide Area Network) or the like, and may be wired or wireless.
- the ultrasound observation apparatus 3 having the above configuration is a dedicated integration that executes a specific function such as a general processor such as a central processing unit (CPU) or an application specific integrated circuit (ASIC) or a field programmable gate array (FPGA).
- the circuit is realized using a ROM (Read Only Memory) in which various programs and the like are previously installed, and a RAM (Random Access Memory) storing operation parameters and data of each process.
- ROM Read Only Memory
- RAM Random Access Memory
- the display device 4 receives and displays data signals of the ultrasonic image generated by the ultrasonic observation device 3 and the display image of the sensitivity reduction unit via the video cable.
- the display device 4 is configured using a monitor such as liquid crystal or organic EL (Electro Luminescence).
- FIG. 4 is a flowchart showing an outline of the element sensitivity determination process performed by the ultrasonic observation apparatus 3 having the above configuration. In the flowchart shown below, it is assumed that the ultrasonic observation apparatus 3 is powered on.
- the control unit 39 causes the display device 4 to display a start message of the element sensitivity determination process (step S102).
- This start message is, for example, "Start the element sensitivity determination process of the element of the ultrasonic probe. Please hold the tip of the ultrasonic probe in the air and press the OK button.”
- step S101: No the ultrasound observation apparatus 3 repeats step S101.
- the control unit 39 sets the counter i to the initial value 1 (step S104). Subsequently, the transmission unit 31 selects the element Ei among the plurality of elements included in the ultrasonic transducer 21 and transmits a transmission signal to the element Ei (step S105). Although the case where the transmission unit 31 transmits the transmission signal to the element E1 when the input unit 38 receives the input of the start instruction signal has been described here, when the control unit 39 detects the connection of the ultrasound probe 2 Alternatively, the transmitter 31 may automatically start transmitting the transmission signal to the element E1.
- the receiving unit 32 receives an echo signal from the ultrasonic transducer 21, performs A / D conversion to generate RF data, and outputs the RF data to the determination unit 35 (step S106).
- the determination unit 35 uses the RF data received from the reception unit 32 to determine whether or not the element Ei is a sensitivity reducing element, and stores the determination result in the storage unit 40 (step S107).
- the determination unit 35 calculates the sensitivity value of the element Ei from the RF data, and when the sensitivity value is lower than the threshold value, determines the element Ei as a sensitivity reduction element. In the case illustrated in FIG. 2, the determination unit 35 determines that the two elements E2 and E3 are sensitivity reducing elements.
- control unit 39 determines whether the counter i is smaller than the number 5 of elements (step S108). If the counter i is smaller than 5 (step S108: YES), the control unit 39 increments the counter i by 1 (step S109) and performs control to return to step S105 because the determination processing for all elements is not completed. On the other hand, when the counter i is not smaller than 5 (step S108: No), the control unit 39 performs control to shift to step S110 because the determination processing for all elements is completed. When all the determination processes by the determination unit 35 end, for example, the information illustrated in FIG. 2 is stored in the storage unit 40.
- the area specifying unit 36 refers to the storage unit 40 to calculate the total contribution of each ultrasonic beam (step S110).
- the specific calculation method is as described with reference to FIG.
- the area specifying unit 36 specifies an area in which the sensitivity is reduced using the total contribution degree (step S111).
- the sensitivity reduction unit display image generation unit 37 generates data of the sensitivity reduction unit display image based on the total contribution degree (step S112). Specifically, the sensitivity reduction unit display image generation unit 37 generates data of the sensitivity reduction unit display image by, for example, assigning a color corresponding to the total contribution degree to the ultrasonic beam corresponding region in the ultrasonic image.
- the control unit 39 causes the display device 4 to display the sensitivity reduction unit display image (step S113).
- the display device 4 displays, for example, the sensitivity reduction unit display image 100 shown in FIG.
- the control unit 39 may cause the display device 4 to display a message notifying that the sensitivity lowering element is present, and a message notifying the degree of sensitivity lowering for each ultrasonic beam together with the sensitivity lowering unit display image.
- the ultrasound observation apparatus 3 ends the series of processes.
- the control unit 39 causes the display device 4 to end the display of the sensitivity reduction unit display image. It is also good. In addition, after a predetermined time has elapsed since the display device 4 starts displaying the sensitivity reduction portion display image, the control unit 39 may cause the display device 4 to end the display of the sensitivity reduction portion display image.
- step S103 when the input unit 38 does not receive the input of the start instruction signal (step S103: No), when a predetermined time has elapsed since the start message was displayed (step S114: Yes), the ultrasonic observation is performed.
- the device 3 ends the series of processes.
- step S114: No the ultrasound observation apparatus 3 returns to step S103.
- the region where the sensitivity is lowered in the ultrasonic image based on the degree of contribution to the ultrasonic beam of the element determined to be the sensitivity lowering element having the sensitivity decrease is In order to generate data of the sensitivity reduced portion display image to be displayed, it is possible for the user to intuitively grasp the influence on the ultrasonic image caused by the sensitivity reduction of the ultrasonic element that the ultrasonic probe has.
- the user when performing local observation, the user can select and use a portion with less influence of sensitivity reduction.
- the ultrasound observation apparatus identifies the sensitivity-reduced portion by performing the determination of the sensitivity-reduced portion for each depth, and generates data of the sensitivity-reduced portion display image.
- the configuration of the ultrasound diagnostic system according to the second embodiment is the same as that of the first embodiment.
- components of the ultrasound diagnostic system will be described with the same reference numerals as in the first embodiment.
- FIG. 5 to FIG. 7 are diagrams for explaining an outline of processing performed by the sensitivity reduction unit display image generation unit 37 in the second embodiment.
- 5 to 7 show an outline of processing in different depth regions D1 to D3.
- FIG. 5 shows an outline of processing in the deepest depth region D1
- FIG. 7 shows an outline of processing of the deepest depth region D3.
- 5 to 7 show the case where one ultrasonic beam is formed using five elements E1 to E5 in the same manner as in FIG. 2, and determination unit 35 determines element E2 and five of five elements E1 to E5.
- the case where the element E3 is determined to be a sensitivity reducing element is illustrated.
- the ultrasonic beam Bij has the highest contribution from the element Ei, and the lower the contribution from the element Ei, the lower the contribution.
- the contribution of the element E1 is 75%
- the contribution of the element E2 is 25%
- the contributions of the elements E3 to E5 are 0% (FIG. 5).
- the contribution of the element E1 is 70%
- the contribution of the element E2 is 20%
- the contribution of the element E3 is 10%
- the contributions of the elements E4 and E5 are 0% (FIG. 6) .
- the ultrasonic beam B13 has a contribution of 68% for the element E1, 18% for the element E2, 9% for the element E3, 5% for the element E4, and 0% for the element E5. (FIG. 7).
- the ultrasonic beam B21 has a contribution of 50% to the element E2, 25% to each of the elements E1 and E3, and 0% to the elements E4 and E5 (FIG. 5).
- the contribution of the elements E2 and E3 is 40%
- the contribution of the elements E1 and E4 is 10%
- the contribution of the element E5 is 0% (FIG. 6).
- the ultrasonic beam B23 has a contribution of 38% for each of the elements E2 and E3, a contribution of 9% for each of the elements E1 and E4, and a contribution of 6% for the element E5 in the deepest region (FIG. 7). ).
- the setting of the degree of contribution shown in FIGS. 5 to 7 is merely an example, and the division in the depth direction and the setting of the contribution rate are not limited to this.
- the sensitivity reduction unit display image generation unit 37 calculates, for each depth region, a total contribution degree obtained by summing the contribution degree of the sensitivity reduction element with respect to each ultrasonic beam.
- the correspondence between the total contribution degree and the display color is the same as that of the first embodiment. That is, “white” when the total contribution is 0% or more and less than 25%, “yellow” when the total contribution is 25% or more and less than 60%, and “red” when the total contribution is 60% or more Assign each of
- the sensitivity reduction unit display image generation unit 37 generates data of the sensitivity reduction unit display image based on the calculated total contribution degree. Under the present circumstances, the sensitivity reduction part display image generation part 37 allocates the color according to the total contribution degree for every depth area
- FIG. 8 is a view showing a display example of the sensitivity reduction unit display image displayed by the display device 4.
- the display mode is determined for each partial beam area bij corresponding to the ultrasonic beam Bij.
- the sensitivity-reduced portion display image 200 includes beam regions b1 (b11, b12, b13) corresponding to the ultrasonic beams B1 (B11, B12, B13), and ultrasonic beams B4 (B41, B42, B43).
- the beam area b4 (b41, b42, b43) corresponding to Y is displayed in yellow (dot in FIG. 8).
- the beam area b2 (b21, b22, b23) corresponding to the ultrasonic beam B2 (B21, B22, B23) is displayed in red (hatched in FIG. 8), and the ultrasonic beam B5 is displayed.
- Beam regions b5 (b51, b52, b53) corresponding to (B51, B52, B53) are displayed in white.
- the reduced sensitivity portion display image 200 is displayed in a different color for each partial beam region in the beam region b3 corresponding to the ultrasonic beam B3. Specifically, in the reduced sensitivity portion display image 200, the partial beam area b31 is displayed in red (hatched in FIG. 8), and the partial beam areas b32 and b33 are displayed in yellow.
- step S110 the area specifying unit 36 calculates the total contribution degree for each depth area of each ultrasonic beam, as described above.
- step S111 the area specifying unit 36 specifies an area in which the sensitivity is reduced for each depth area of the ultrasonic beam.
- step S112 the sensitivity reduction unit display image generation unit 37 generates data of the sensitivity reduction unit display image by assigning a color according to the total contribution degree to each depth region of each ultrasonic beam.
- the user intuitively grasps the influence on the ultrasonic image caused by the decrease in the sensitivity of the ultrasonic element of the ultrasonic probe. It will be possible to
- the data of the sensitivity-reduced portion display image is generated using different degrees of contribution according to the depth at which the ultrasonic waves reach, only the sensitivity-reduced portion that affects the ultrasonic image is More accurate notification can be made.
- the determination unit 35 instead of calculating the sensitivity value using the RF data, performs processing similar to that at the time of data generation of the ultrasound image to convert the RF data into luminance data of each pixel after image data conversion. An average may be calculated, and this average may be used as sensitivity information to determine the presence or absence of a decrease in sensitivity of the element.
- the determination process of the presence or absence of the sensitivity fall of the element in the determination part 35 is not restricted to what was mentioned above.
- the determination unit 35 uses an element whose sensitivity value is smaller than the threshold value as a candidate element, and calculates a statistical value such as an average, a sum, a variance, or a mode value of sensitivity values of a predetermined number of elements nearby.
- the candidate element may be determined to be the sensitivity reducing element if it is smaller than the second threshold value determined according to the value.
- the near region in this case may be determined according to, for example, the transmission numerical aperture at the time of generating an ultrasound image, or may be determined according to the different reception numerical aperture according to the depth, or reception for each depth It may be determined according to the smaller one of the numerical aperture and the transmission numerical aperture.
- the near region may be thinned or selected at predetermined intervals within a predetermined range centered on the candidate element, or may be randomly selected within the predetermined range.
- the determination unit 35 may irradiate the ultrasonic beam to determine the reduction in sensitivity for each sound ray, and when there is a reduction in sensitivity, may determine the element at the center of the ultrasonic beam as the sensitivity reduction element .
- the sensitivity reduction unit may be displayed while the examination is performed using the ultrasound diagnostic system 1.
- the sensitivity reduction unit display image generation unit 37 refers to the storage unit 40 to specify the sensitivity reduction element, and an ultrasonic image The data of the sensitivity reduced portion display image is generated in accordance with the display of.
- the sensitivity reduction unit display image generation unit 37 also changes the display mode of the sensitivity reduction unit display image according to the scroll.
- the control unit 39 causes the display device 4 to display the sensitivity reduction unit display image side by side with the ultrasound image. Note that the control unit 39 may cause the display device 4 to display the sensitivity reduction unit display image smaller than the ultrasound image.
- the control unit 39 causes the display device 4 to end the display of the sensitivity reduction unit display image.
- the ultrasound observation apparatus may further include a superimposed image generation unit that generates data of a superimposed image in which the ultrasound image and the sensitivity reduction unit display image are superimposed.
- a superimposed image generation unit that generates data of a superimposed image in which the ultrasound image and the sensitivity reduction unit display image are superimposed.
- the input unit 38 receives the display instruction input of the sensitivity reduction unit during the examination
- the sensitivity reduction unit display image generation unit 37 generates the data of the sensitivity reduction unit display image as described above, and then the superimposed image is generated.
- the generation unit superimposes this data on the data of the ultrasound image to generate data of the superimposed image.
- the superimposed image may be displayed by coloring the reduced sensitivity portion or may be displayed as translucent by increasing the transmittance of the reduced sensitivity portion.
- the user can grasp the sensitivity reduction part even during the examination and can use it in the case of the examination or diagnosis.
- the ultrasound observation apparatus, the operation method of the ultrasound observation apparatus, and the operation program of the ultrasound observation apparatus according to the present invention have an effect on the ultrasound image due to the decrease in sensitivity of the element of the ultrasound probe. Useful for the user to intuitively grasp.
Landscapes
- Health & Medical Sciences (AREA)
- Life Sciences & Earth Sciences (AREA)
- Engineering & Computer Science (AREA)
- Biomedical Technology (AREA)
- Medical Informatics (AREA)
- Pathology (AREA)
- Radiology & Medical Imaging (AREA)
- Biophysics (AREA)
- Physics & Mathematics (AREA)
- Heart & Thoracic Surgery (AREA)
- Nuclear Medicine, Radiotherapy & Molecular Imaging (AREA)
- Molecular Biology (AREA)
- Surgery (AREA)
- Animal Behavior & Ethology (AREA)
- General Health & Medical Sciences (AREA)
- Public Health (AREA)
- Veterinary Medicine (AREA)
- Computer Vision & Pattern Recognition (AREA)
- Ultra Sonic Daignosis Equipment (AREA)
Abstract
本発明にかかる超音波観測装置(3)は、複数の素子がそれぞれ受信するエコー信号に対応するデジタル信号のデータを用いて各素子が感度低下を有する感度低下素子であるか否かを判定する判定部(35)と、判定部(35)が感度低下素子であると判定した素子の超音波ビームに対する寄与度をもとに超音波画像中において感度が低下した領域を特定する領域特定部(36)と、領域特定部(36)が特定した領域を表示する感度低下部表示画像のデータを生成する感度低下部表示画像生成部(37)と、を備えた。
Description
本発明は、超音波観測装置、超音波観測装置の作動方法および超音波観測装置の作動プログラムに関する。
超音波プローブを用いた診断を行う超音波診断システムにおいては、超音波プローブを超音波観測装置に接続するたびに、超音波プローブが備える超音波振動子の状態をユーザに報知することが求められつつある。
電子走査型の超音波プローブでは、超音波振動子が備える複数の素子を一度に駆動して音線のデータを取得している。そのため、一つの素子に感度低下が発生しても、画像への影響が小さく、ユーザが画像を見て感度低下を判断するのが難しい。
このような状況の下、例えば特許文献1には、超音波プローブの送受信チャンネルごとに異常状態を検出する回路を有し、異常状態が検出されたとき、診断の可否を判断して判断結果を表示する技術が開示されている。この技術では、異常状態にあるチャンネルの情報を文字により表示してユーザに報知する。
また、特許文献2には、超音波プローブの所定の評価用振動素子から得られる受信信号に基づいて評価用振動素子の感度特性が正常であるか否かを判定し、この判定結果に基づいて複数の振動素子の感度特性の分布を示す特性分布データを生成し、診断の可否を判定する技術が開示されている。この技術では、表示部が、異常と判定された振動素子を正常な振動素子と識別可能に表示することによって超音波プローブの異常箇所をユーザに報知する。
しかしながら、上述した従来技術では、感度低下が発生したチャンネルや振動素子を特定できるものの、超音波画像における影響箇所をユーザが直観的に把握することはできなかった。
本発明は、上記に鑑みてなされたものであって、超音波プローブが有する素子の感度低下に起因した超音波画像への影響を、ユーザが直観的に把握することを可能にする超音波観測装置、超音波観測装置の作動方法および超音波観測装置の作動プログラムを提供することを目的とする。
上述した課題を解決し、目的を達成するために、本発明に係る超音波観測装置は、超音波を発生する複数の素子を有する超音波振動子を備えた超音波プローブを接続可能であり、接続された前記超音波プローブに超音波を発生させる送信信号を送信する一方、前記超音波プローブから受信したエコー信号をもとに超音波画像のデータを生成する超音波観測装置であって、前記複数の素子がそれぞれ受信する前記エコー信号に対応するデジタル信号のデータを用いて各素子が感度低下を有する感度低下素子であるか否かを判定する判定部と、前記判定部が感度低下素子であると判定した素子の超音波ビームに対する寄与度をもとに超音波画像中において感度が低下した領域を特定する領域特定部と、前記領域特定部が特定した前記領域を表示する感度低下部表示画像のデータを生成する感度低下部表示画像生成部と、を備えたことを特徴とする。
本発明に係る超音波観測装置は、上記発明において、前記感度低下部表示画像生成部は、前記超音波ビームに対する感度低下素子の寄与度に応じた表示形態を有する感度低下部表示画像のデータを生成することを特徴とする。
本発明に係る超音波観測装置は、上記発明において、前記領域特定部は、前記感度低下素子の超音波ビームに対する寄与度を合計した合計寄与度を算出し、算出した合計寄与度に基づいて前記領域を特定することを特徴とする。
本発明に係る超音波観測装置は、上記発明において、前記感度低下部表示画像生成部は、前記合計寄与度に応じた視覚情報を前記領域に割り付けることによって前記感度低下部表示画像のデータを生成することを特徴とする。
本発明に係る超音波観測装置は、上記発明において、前記領域特定部は、前記超音波が到達する深度に応じた寄与度をもとに前記領域を特定することを特徴とする。
本発明に係る超音波観測装置は、上記発明において、前記領域特定部は、接続された超音波プローブの種類に応じた寄与度をもとに前記領域を特定することを特徴とする。
本発明に係る超音波観測装置は、上記発明において、前記判定部は、1または複数の素子の感度情報を取得し、該感度情報に基づいて各素子が感度低下素子であるか否かを判定することを特徴とする。
本発明に係る超音波観測装置は、上記発明において、前記判定部は、接続された超音波プローブの種類ごとに定められる条件に基づいて各素子が感度低下素子であるか否かを判定することを特徴とする。
本発明に係る超音波観測装置は、上記発明において、前記判定部は、前記超音波プローブの接続を検知した場合に判定を行うことを特徴とする。
本発明に係る超音波観測装置の作動方法は、超音波を発生する複数の素子を有する超音波振動子を備えた超音波プローブを接続可能であり、接続された前記超音波プローブに超音波を発生させる送信信号を送信する一方、前記超音波プローブから受信したエコー信号をもとに超音波画像のデータを生成する超音波観測装置の作動方法であって、判定部が、前記複数の素子がそれぞれ受信する前記エコー信号に対応するデジタル信号のデータを用いて各素子が感度低下を有する感度低下素子であるか否かを判定する判定ステップと、領域特定部が、前記判定ステップにおいて感度低下素子であると判定された素子の超音波ビームに対する寄与度をもとに超音波画像中において感度が低下した領域を特定する領域特定ステップと、前記判定ステップにおいて特定された前記領域を表示する感度低下部表示画像のデータを生成する感度低下部表示画像生成ステップと、を含むことを特徴とする。
本発明に係る超音波観測装置の作動プログラムは、超音波を発生する複数の素子を有する超音波振動子を備えた超音波プローブを接続可能であり、接続された前記超音波プローブに超音波を発生させる送信信号を送信する一方、前記超音波プローブから受信したエコー信号をもとに超音波画像のデータを生成する超音波観測装置の作動プログラムであって、判定部が、前記複数の素子がそれぞれ受信する前記エコー信号に対応するデジタル信号のデータを用いて各素子が感度低下を有する感度低下素子であるか否かを判定する判定ステップと、領域特定部が、前記判定ステップにおいて感度低下素子であると判定された素子の超音波ビームに対する寄与度をもとに超音波画像中において感度が低下した領域を特定する領域特定ステップと、前記判定ステップにおいて特定された前記領域を表示する感度低下部表示画像のデータを生成する感度低下部表示画像生成ステップと、を実行することを特徴とする。
本発明によれば、超音波プローブが有する超音波素子の感度低下に起因した超音波画像への影響を、ユーザが直観的に把握することが可能になる。
以下、添付図面を参照して、本発明を実施するための形態(以下、「実施の形態」という)を説明する。
(実施の形態1)
図1は、本発明の実施の形態1に係る超音波観測装置を備えた超音波診断システムの構成を示すブロック図である。同図に示す超音波診断システム1は、観測対象である被検体へ超音波を送信し、該被検体で反射された超音波を受信する超音波プローブ2と、超音波プローブ2が取得した超音波信号に基づいて超音波画像を生成する超音波観測装置3と、超音波観測装置3が生成した超音波画像を表示する表示装置4と、を備える。
図1は、本発明の実施の形態1に係る超音波観測装置を備えた超音波診断システムの構成を示すブロック図である。同図に示す超音波診断システム1は、観測対象である被検体へ超音波を送信し、該被検体で反射された超音波を受信する超音波プローブ2と、超音波プローブ2が取得した超音波信号に基づいて超音波画像を生成する超音波観測装置3と、超音波観測装置3が生成した超音波画像を表示する表示装置4と、を備える。
超音波プローブ2は、その先端部に、超音波観測装置3から受信した電気的なパルス信号を超音波パルス(音響パルス)に変換して被検体へ照射するとともに、被検体で反射された超音波エコーを電圧変化で表現する電気的なエコー信号(超音波信号)に変換して出力する超音波振動子21を有する。超音波振動子21は、アレイ状に並べられた複数の素子を有する電子走査型である。素子は、チタン酸ジルコン酸鉛(PZT)、チタン酸鉛(PT)、またはニオブ酸鉛等の圧電体を用いて構成され、機械的エネルギーと電気的エネルギーとの変換を行うことによって超音波を送受信する。以下の説明では、ラジアル型の超音波振動子21の場合を説明するが、これは一例に過ぎず、コンベックス型やリニア型であってもよい。
超音波プローブ2は、撮像光学系および撮像素子をさらに有する超音波内視鏡でもよいし、光学系を有しない細径のミニチュアプローブでもよい。また、超音波プローブ2は、被検体の体内に挿入するタイプのみならず、被検体の体表から超音波を照射する体外式であってもよい。
超音波観測装置3は、送信部31と、受信部32と、信号処理部33と、超音波画像生成部34と、判定部35と、領域特定部36と、感度低下部表示画像生成部37と、入力部38と、制御部39と、記憶部40と、を備える。
送信部31は、超音波プローブ2と電気的に接続され、送信信号(パルス信号)を超音波振動子21へ送信する。送信部31が送信するパルス信号の周波数帯域は、超音波振動子21におけるパルス信号の超音波パルスへの電気音響変換の線型応答周波数帯域をほぼカバーする広帯域にするとよい。送信部31は、一つの音線を構成する複数の素子に対して、各素子への送信タイミングを制御しながら送信信号を送信する。このようにして送信信号を受信した複数の素子は、超音波ビームを照射する。送信部31は、制御部39が出力する各種制御信号を超音波プローブ2に対して送信する。なお、素子の感度低下の有無を検出する際に送信部31が送信する送信信号のパワーを、検査時の送信信号のパワーに比して強くしてもよい。
受信部32は、超音波振動子21から電気的な受信信号であるエコー信号を受信して、A/D変換することによってデジタルの高周波(RF:Radio Frequency)信号のデータ(以下、RFデータという)を生成する。また、受信部32は、超音波プローブ2から識別用のIDを含む各種情報を受信して制御部39へ送信する機能も有する。
信号処理部33は、受信部32から受信したRFデータをもとにデジタルの超音波画像用受信データを生成する。具体的には、信号処理部33は、複数のRFデータの位相を調整して加算するデジタルビームフォーミング(DBF)処理、包絡線検波処理、および対数変換処理等の公知の処理を施し、デジタルの超音波画像用受信データを生成する。超音波画像用受信データは、超音波パルスの反射の強さを示す受信信号の振幅または強度が、超音波パルスの送受信方向(深度方向)に沿って並んだ複数のラインデータ(音線データ)からなる。信号処理部33は、生成した1フレーム分の超音波画像用受信データを、超音波画像生成部34へ出力する。
超音波画像生成部34は、信号処理部33から受信した超音波画像用受信データに基づいて超音波画像データを生成する。超音波画像生成部34は、超音波画像用受信データを表示装置4の表示方式に従ったデータに変換するデジタルスキャンコンバーター(DSC)を有する。超音波画像生成部34は、さらにゲイン処理、コントラスト処理等の公知の信号処理を行うことにより、超音波画像データを生成する。この超音波画像データは、いわゆるBモード画像データである。Bモード画像は、色空間としてRGB表色系を採用した場合の変数であるR(赤)、G(緑)、B(青)の値を一致させたグレースケール画像である。
判定部35は、受信部32から受信したRFデータを解析することによって超音波振動子21が有する素子における感度低下の有無を判定する。判定部35は、RFデータの振幅を感度値として検出した後、この感度値を所定の閾値と比較し、閾値よりも小さい感度値を有する素子を感度低下がある素子(以下、感度低下素子という)と判定する。判定部35は、例えば感度低下素子と判定した素子を1とし、それ以外の素子は0とする感度情報を記憶部40に書き込んで記憶させる。
この判定処理は、ユーザが超音波プローブ2を超音波観測装置3に接続した後、超音波プローブ2の先端部を空気中で保持した状態で行う。超音波プローブ2の先端部が空気中にある場合、送信部31が送信した送信信号に対して受信部32が受信するエコー信号は、超音波振動子21と空気との境界面で反射して戻ってきたエコー信号である。
領域特定部36は、記憶部40が記憶する素子毎の感度情報を用いて、超音波画像中で感度低下の影響が及ぶ領域を特定する。領域特定部36は、超音波ビームに対する送信開口数分の素子の寄与度をもとに感度低下部の特定を行う。
図2は、領域特定部36が行う処理の概要を説明する図である。図2は、五つの素子E1~E5を用いて一つの超音波ビームを形成する場合を例示しており、判定部35によって五つの素子E1~E5のうち素子E2と素子E3が感度低下素子と判定された場合を例示している。また、超音波プローブ2は、五つの超音波ビームB1~B5を照射するものとする。超音波振動子21が有する素子の数がこれに限定されないことは言うまでもない。各超音波ビームBiは、素子Eiからの寄与度が最も高く、素子Eiから遠いほど寄与度が低い。例えば超音波ビームB1は、素子E1の寄与度が75%、素子E2の寄与度が25%、素子E3~E5の寄与度がそれぞれ0%である。また、超音波ビームB2は、素子E2の寄与度が50%、素子E1、E3の寄与度がそれぞれ25%、素子E4、E5の寄与度がそれぞれ0%である。素子ごとの超音波ビームに対する寄与度の情報は、記憶部40に記憶されている。
なお、ここでは超音波ビームに対する寄与度に応じた重み付けをする場合を説明したが、超音波ビームに対する素子の寄与度をもとに他の方法によって重み付けをしてもよい。例えば、図2において、超音波ビームBiを構成する素子のうち中心の素子Eiおよび個の素子Eiと隣り合う3つの素子の重みを等しく最大とし、それ以外の素子の重みを相対的に低くしてもよい。このように、少なくとも中心の素子の重みが最大であり、中心の素子から最も離れた素子の重みが最小であれば、重み付けの方法は上述した方法に限られない。
領域特定部36は、各超音波ビームに対して、感度低下素子の寄与度を合計した合計寄与度を算出する。寄与度は超音波ビームに対する各素子の寄与具合(寄与している送信強度の割合)であり、一つの超音波ビームに対する寄与度の和は常に100%になる。このうち、感度低下素子の寄与度を合計したものが、表に示された合計寄与度の値である。この値が大きいほど、感度低下素子の影響が大きい。図2に示す場合、感度低下素子E2、E3の寄与度を超音波ビームB1~B5に対してそれぞれ算出する。算出結果は、超音波ビームB1の合計寄与度が25(%)+0(%)=25(%)、超音波ビームB2の合計寄与度が50(%)+25(%)=75(%)、超音波ビームB3の合計寄与度が25(%)+50(%)=75(%)、超音波ビームB4の合計寄与度が0(%)+25(%)=25(%)、超音波ビームB5の合計寄与度が0(%)+0(%)=0(%)である。
感度低下部表示画像生成部37は、領域特定部36が特定した領域(感度低下部)を表示する感度低下部表示画像のデータを生成する。感度低下部表示画像生成部37は、領域特定部36が算出した合計寄与度に基づいて、感度低下部表示画像のデータを生成する。この際、感度低下部表示画像生成部37は、各超音波ビームによって生成される超音波画像の領域ごとに、合計寄与度に応じた色を割り当ててその領域の感度情報を表示する感度低下部表示画像のデータを生成する。例えば、合計寄与度が0%以上25%未満の場合は「白」、合計寄与度が25%以上60%未満の場合には「黄」、合計寄与度が60%以上の場合には「赤」をそれぞれ割り当てる。
図3は、表示装置4が表示する感度低下部表示画像の表示例を示す図である。同図に示す感度低下部表示画像100は、図2を参照して説明した処理を行い、上述した規則にしたがって色を割り当てた場合の表示例を示している。感度低下部表示画像100は、超音波ビームB1、B4にそれぞれ対応するビーム領域b1、b4を黄色(図3ではドットで表示)で表示し、超音波ビームB2、B3にそれぞれ対応するビーム領域b2、b3を赤色(図3では斜線で表示)で表示し、超音波ビームB5に対応するビーム領域b5を白色で表示している。なお、感度低下部表示画像生成部37は、合計寄与度に応じた色を割り当てる代わりに、彩度、明度、模様またはパターン等の視覚情報を合計寄与度に応じて割り当てることによって感度低下部表示画像のデータを生成してもよい。
入力部38は、キーボード、ボタン、マウス、トラックボール、タッチパネル、タッチパッド等のユーザインタフェースを用いて構成され、各種操作信号の入力を受け付ける。各種操作信号の一つとして、超音波振動子21の素子の感度判定処理の開始を指示する信号が含まれる。
制御部39は、記憶部40が記憶、格納する情報を記憶部40から読み出し、超音波観測装置3の作動方法に関連した各種演算処理を実行することによって超音波観測装置3を含む超音波診断システム1の動作を統括して制御する。
記憶部40は、判定部35が判定する際に参照する感度値の閾値、判定部35が素子ごとに判定した結果等の情報、感度低下部表示画像生成部37が参照する超音波ビームと素子の寄与度との関係、および合計寄与度と感度低下部表示画像に対する色の割り当てとの関係等を記憶する。記憶部40が記憶する感度値の閾値は、超音波プローブ2の種類によって異なっていてもよい。記憶部40は、超音波診断システム1を動作させるための各種プログラム、および超音波診断システム1の動作に必要な各種パラメータ等を含むデータ等を記憶する。各種プログラムには、超音波診断システム1の作動方法を実行するための作動プログラムが含まれる。各種プログラムは、ハードディスク、フラッシュメモリ、CD-ROM、DVD-ROM、フレキシブルディスク等のコンピュータ読み取り可能な記憶媒体に記憶して広く流通させることも可能である。また、各種プログラムは、通信ネットワークを介してダウンロードすることによって取得することも可能である。ここでいう通信ネットワークは、例えば既存の公衆回線網、LAN(Local Area Network)、WAN(Wide Area Network)等によって実現されるものであり、有線、無線を問わない。
以上の構成を有する超音波観測装置3は、CPU(Central Processing Unit)等の汎用プロセッサ、またはASIC(Application Specific Integrated Circuit)もしくはFPGA(Field Programmable Gate Array)等の特定の機能を実行する専用の集積回路等、各種プログラム等が予めインストールされたROM(Read Only Memory)、および各処理の演算パラメータやデータ等を記憶するRAM(Random Access Memory)等を用いて実現される。
表示装置4は、映像ケーブルを介して超音波観測装置3が生成した超音波画像および感度低下部表示画像のデータ信号を受信して表示する。表示装置4は、液晶または有機EL(Electro Luminescence)等のモニタを用いて構成される。
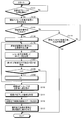
図4は、以上の構成を有する超音波観測装置3が行う素子感度判定処理の概要を示すフローチャートである。以下に示すフローチャートにおいては、超音波観測装置3の電源が入った状態にあるものとする。
超音波観測装置3のコネクタに超音波プローブ2が接続され、受信部32が超音波プローブ2からの信号を受信して制御部39が超音波プローブ2の接続を検知した場合(ステップS101:Yes)、制御部39は表示装置4に素子感度判定処理の開始メッセージを表示させる(ステップS102)。この開始メッセージは、例えば「超音波プローブの素子の素子感度判定処理を開始します。超音波プローブの先端部を空気中に保った状態でOKボタンを押してください。」という内容である。制御部39が超音波プローブ2の接続を検知しない場合(ステップS101:No)、超音波観測装置3はステップS101を繰り返す。
その後、入力部38が開始指示信号の入力を受け付けた場合(ステップS103:Yes)、制御部39はカウンタiを初期値1にセットする(ステップS104)。続いて、送信部31は、超音波振動子21が有する複数の素子のうち素子Eiを選択し、素子Eiに送信信号を送信する(ステップS105)。なお、ここでは入力部38が開始指示信号の入力を受け付けたときに送信部31が送信信号を素子E1に送信する場合を説明したが、制御部39が超音波プローブ2の接続を検知したときに送信部31が自動的に素子E1に送信信号の送信し始めるようにしてもよい。
続いて、受信部32は、超音波振動子21からエコー信号を受信して、A/D変換することによってRFデータを生成し、判定部35に出力する(ステップS106)。
判定部35は、受信部32から受信したRFデータを用いて素子Eiが感度低下素子であるか否かを判定して判定結果を記憶部40に記憶させる(ステップS107)。判定部35は、RFデータから素子Eiの感度値を算出し、その感度値が閾値よりも低い場合、素子Eiを感度低下素子と判定する。図2に示す場合、判定部35は二つの素子E2、E3を感度低下素子と判定する。
この後、制御部39は、カウンタiが素子の数5より小さいか否かを判定する(ステップS108)。カウンタiが5より小さい場合(ステップS108:Yes)、すべての素子に対する判定処理が終了していないため、制御部39はカウンタiを1増やし(ステップS109)、ステップS105に戻る制御を行う。一方、カウンタiが5より小さくない場合(ステップS108:No)、すべての素子に対する判定処理が終了したため、制御部39はステップS110へ移行する制御を行う。判定部35によるすべての判定処理が終了すると、例えば図2に示す情報が記憶部40に格納される。
ステップS110以降の処理を説明する。領域特定部36は、記憶部40を参照して、超音波ビームごとの合計寄与度を算出する(ステップS110)。具体的な算出方法は、図2を参照して説明した通りである。
続いて、領域特定部36は、合計寄与度を用いて感度が低下した領域を特定する(ステップS111)。
感度低下部表示画像生成部37は、合計寄与度に基づいて感度低下部表示画像のデータを生成する(ステップS112)。具体的には、感度低下部表示画像生成部37は、例えば合計寄与度に応じた色を超音波画像中の超音波ビーム対応領域に割り当てることによって感度低下部表示画像のデータを生成する。
この後、制御部39は、感度低下部表示画像を表示装置4に表示させる(ステップS113)。表示装置4は、例えば図3に示す感度低下部表示画像100を表示する。この際、制御部39は、感度低下部表示画像とともに、感度低下素子があることを報知するメッセージや、超音波ビームごとの感度低下の度合いを報知するメッセージを表示装置4に表示させてもよい。ステップS113の後、超音波観測装置3は一連の処理を終了する。
なお、ステップS113の後、入力部38が感度低下部表示画像の消去を指示する信号の入力を受け付けた場合、制御部39は表示装置4に感度低下部表示画像の表示を終了させるようにしてもよい。また、表示装置4が感度低下部表示画像の表示を開始してから所定時間が経過した後、制御部39が表示装置4に感度低下部表示画像の表示を終了させるようにしてもよい。
ステップS103において、入力部38が開始指示信号の入力を受け付けない場合(ステップS103:No)において、開始メッセージの表示を開始してから所定時間が経過したとき(ステップS114:Yes)、超音波観測装置3は一連の処理を終了する。ステップS114で所定時間が経過していないとき(ステップS114:No)、超音波観測装置3はステップS103に戻る。
以上説明した本発明の実施の形態1によれば、感度低下を有する感度低下素子であると判定した素子の超音波ビームへの寄与度をもとに超音波画像中において感度が低下した領域を表示する感度低下部表示画像のデータを生成するため、超音波プローブが有する超音波素子の感度低下に起因した超音波画像への影響を、ユーザが直観的に把握することが可能になる。
また、本実施の形態1によれば、例えば局所的な観測を行う際に、より感度低下の影響が少ない部分をユーザは選んで使うことができる。
(実施の形態2)
本発明の実施の形態2に係る超音波観測装置は、感度低下部の判定を深度ごとに行うことによって感度低下部を特定し、感度低下部表示画像のデータを生成する。本実施の形態2に係る超音波診断システムの構成は、実施の形態1と同様である。以下、超音波診断システムの構成要素には、実施の形態1と同じ符号を付して説明する。
本発明の実施の形態2に係る超音波観測装置は、感度低下部の判定を深度ごとに行うことによって感度低下部を特定し、感度低下部表示画像のデータを生成する。本実施の形態2に係る超音波診断システムの構成は、実施の形態1と同様である。以下、超音波診断システムの構成要素には、実施の形態1と同じ符号を付して説明する。
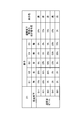
図5~図7は、本実施の形態2において、感度低下部表示画像生成部37が行う処理の概要を説明する図である。図5~図7では、互いに異なる深度領域D1~D3における処理の概要を示している。具体的には、図5が最も深度が浅い深度領域D1における処理の概要を示しており、図7が最も深度が深い深度領域D3の処理の概要を示している。図5~図7では、図2と同様に、五つの素子E1~E5を用いて一つの超音波ビームを形成する場合であって、判定部35によって五つの素子E1~E5のうち素子E2と素子E3が感度低下素子と判定された場合を例示している。
超音波ビームBij(i=1~5,j=1~3)は、深度領域Djにおける超音波ビームBiを意味している。超音波ビームBijは、素子Eiからの寄与度が最も高く、素子Eiから遠いほど寄与度が低い。例えば超音波ビームB11は、素子E1の寄与度が75%、素子E2の寄与度が25%、素子E3~E5の寄与度がそれぞれ0%である(図5)。超音波ビームB12は、素子E1の寄与度が70%、素子E2の寄与度が20%、素子E3の寄与度が10%、素子E4、E5の寄与度がそれぞれ0%である(図6)。超音波ビームB13は、素子E1の寄与度が68%、素子E2の寄与度が18%、素子E3の寄与度が9%、素子E4の寄与度が5%、素子E5の寄与度が0%である(図7)。
また、超音波ビームB21は、素子E2の寄与度が50%、素子E1、E3の寄与度がそれぞれ25%、素子E4、E5の寄与度がそれぞれ0%である(図5)。超音波ビームB22は、素子E2、E3の寄与度がそれぞれ40%、素子E1、E4の寄与度がそれぞれ10%、素子E5の寄与度が0%である(図6)。超音波ビームB23は、最も深度が大きい領域において、素子E2、E3の寄与度がそれぞれ38%、素子E1、E4の寄与度がそれぞれ9%、素子E5の寄与度が6%である(図7)。
なお、図5~図7に示す寄与度の設定はあくまでも一例にすぎず、深度方向の区分けや寄与率の設定はこれに限られるわけではない。
感度低下部表示画像生成部37は、各超音波ビームに対して、感度低下素子の寄与度を合計した合計寄与度を深度領域ごとに算出する。図5に示す場合の超音波ビームBi1(i=1~5)の合計寄与度は、図2における超音波ビームBiの合計寄与度とそれぞれ同じである。図6に示す場合、超音波ビームB12の合計寄与度が20(%)+10(%)=30(%)、超音波ビームB22の合計寄与度が40(%)+40(%)=80(%)、超音波ビームB32の合計寄与度が10(%)+40(%)=50(%)、超音波ビームB42の合計寄与度が10(%)+40(%)=50(%)、超音波ビームB52の合計寄与度が0(%)+10(%)=10(%)である。図7に示す場合、超音波ビームB13の合計寄与度が18(%)+9(%)=27(%)、超音波ビームB23の合計寄与度が38(%)+38(%)=76(%)、超音波ビームB33の合計寄与度が20(%)+38(%)=58(%)、超音波ビームB43の合計寄与度が9(%)+38(%)=47(%)、超音波ビームB53の合計寄与度が5(%)+9(%)=14(%)である。
図5~図7において、合計寄与度と表示色の対応は実施の形態1と同様である。すなわち、合計寄与度が0%以上25%未満の場合は「白」、合計寄与度が25%以上60%未満の場合には「黄」、合計寄与度が60%以上の場合には「赤」をそれぞれ割り当てる。
感度低下部表示画像生成部37は、算出した合計寄与度に基づいて、感度低下部表示画像のデータを生成する。この際、感度低下部表示画像生成部37は、各超音波ビームによって生成される超音波画像の深度領域ごとに、合計寄与度に応じた色を割り当ててその深度領域の感度情報を表示する感度低下部表示画像のデータを生成する。
図8は、表示装置4が表示する感度低下部表示画像の表示例を示す図である。同図に示す感度低下部表示画像200は、超音波ビームBijに対応する部分ビーム領域bijごとに表示態様が定められている。具体的には、感度低下部表示画像200は、超音波ビームB1(B11、B12、B13)に対応するビーム領域b1(b11、b12、b13)、および超音波ビームB4(B41、B42、B43)に対応するビーム領域b4(b41、b42、b43)を黄色(図8ではドット)で表示する。また、感度低下部表示画像200は、超音波ビームB2(B21、B22、B23)に対応するビーム領域b2(b21、b22、b23)を赤色(図8では斜線)で表示し、超音波ビームB5(B51、B52、B53)に対応するビーム領域b5(b51、b52、b53)を白色で表示する。感度低下部表示画像200は、超音波ビームB3に対応するビーム領域b3において、部分ビーム領域ごとに異なる色で表示している。具体的には、感度低下部表示画像200は、部分ビーム領域b31を赤色(図8では斜線)で表示し、部分ビーム領域b32およびb33を黄色で表示している。
本実施の形態2における処理の概要は、実施の形態1で説明した図4のフローチャートに準じる。ただし、ステップS110において、領域特定部36は、上述したように、各超音波ビームの深度領域ごとに合計寄与度を算出する。また、ステップS111において、領域特定部36は、超音波ビームの深度領域ごとに感度が低下した領域を特定する。また、ステップS112において、感度低下部表示画像生成部37は、各超音波ビームの深度領域ごとに合計寄与度に応じた色を割り当てることによって感度低下部表示画像のデータを生成する。
以上説明した本発明の実施の形態2によれば、実施の形態1と同様に、超音波プローブが有する超音波素子の感度低下に起因した超音波画像への影響を、ユーザが直観的に把握することが可能になる。
また、本実施の形態2によれば、超音波が到達する深度に応じて異なる寄与度を用いて感度低下部表示画像のデータを生成するため、超音波画像に影響が生じる感度低下部のみをより的確に報知することができる。
(その他の実施の形態)
ここまで、本発明を実施するための形態を説明してきたが、本発明は上述した実施の形態によってのみ限定されるべきものではない。例えば、判定部35は、RFデータを用いて感度値を算出する代わりに、RFデータを超音波画像のデータ生成時と同様の処理を行うことによって画像データ化した後の各画素の輝度値の平均を算出し、この平均を感度情報として用いることによって素子の感度低下の有無を判定するようにしてもよい。
ここまで、本発明を実施するための形態を説明してきたが、本発明は上述した実施の形態によってのみ限定されるべきものではない。例えば、判定部35は、RFデータを用いて感度値を算出する代わりに、RFデータを超音波画像のデータ生成時と同様の処理を行うことによって画像データ化した後の各画素の輝度値の平均を算出し、この平均を感度情報として用いることによって素子の感度低下の有無を判定するようにしてもよい。
また、判定部35における素子の感度低下の有無の判定処理は上述したものに限られない。例えば、判定部35は、閾値より感度値が小さい素子を候補素子として、その近傍の所定数の素子の感度値の平均や和、分散、最頻値、等の統計値を算出し、その統計値に応じて定められる第2閾値より小さい場合に候補素子を感度低下素子と判定するようにしてもよい。この場合の近傍領域は、例えば超音波画像を生成する際の送信開口数に応じて定めてもよいし、深度に応じて異なる受信開口数に応じて定めてもよいし、深さごとに受信開口数と送信開口数のうち小さい方の数に応じて定めてもよい。また、近傍領域は、候補素子を中心とする所定範囲内で所定の間隔で間引いても選択してもよいし、その所定範囲内でランダムに選択してもよい。また、判定部35は、超音波ビームを照射して音線ごとに感度低下を判定し、感度低下がある場合には、その超音波ビームの中心の素子を感度低下素子と判定してもよい。
また、超音波診断システム1を用いて検査を行っている最中に感度低下部を表示できるようにしてもよい。例えば、検査中に入力部38が感度低下部の表示を指示する信号の入力を受け付けると、感度低下部表示画像生成部37は記憶部40を参照して感度低下素子を特定し、超音波画像の表示に合わせて感度低下部表示画像のデータを生成する。超音波画像がスクロールされた場合、感度低下部表示画像生成部37は、そのスクロールに応じて感度低下部表示画像の表示形態も変更する。制御部39は、表示装置4に感度低下部表示画像を超音波画像と並べて表示させる。なお、制御部39は、表示装置4に対し、感度低下部表示画像を超音波画像よりも小さく表示させてもよい。この後、入力部38が感度低下部の表示を削除する信号の入力を受け付けた場合、制御部39は、表示装置4に感度低下部表示画像の表示を終了させる。
超音波観測装置が、超音波画像と感度低下部表示画像を重畳した重畳画像のデータを生成する重畳画像生成部をさらに備えてもよい。この場合には、検査中に入力部38が感度低下部の表示指示入力を受け付けたとき、感度低下部表示画像生成部37が上記同様に感度低下部表示画像のデータを生成した後、重畳画像生成部がこのデータを超音波画像のデータに重畳して重畳画像のデータを生成する。重畳画像は、感度低下部を色づけして表示してもよいし、感度低下部の透過度を高くして半透明にして表示してもよい。
このようにして検査中も感度低下部を表示する機能を具備することにより、ユーザは検査中にも感度低下部を把握して、検査や診断の際に役立てることができる。
以上のように、本発明に係る超音波観測装置、超音波観測装置の作動方法および超音波観測装置の作動プログラムは、超音波プローブが有する素子の感度低下に起因した超音波画像への影響を、ユーザが直観的に把握するのに有用である。
1 超音波診断システム
2 超音波プローブ
3 超音波観測装置
4 表示装置
21 超音波振動子
31 送信部
32 受信部
33 信号処理部
34 超音波画像生成部
35 判定部
36 領域特定部
37 感度低下部表示画像生成部
38 入力部
39 制御部
40 記憶部
100、200 感度低下部表示画像
B1~B5、Bij(i=1~5、j=1~3) 超音波ビーム
b1~b5 ビーム領域
bij(i=1~5、j=1~3) 部分ビーム領域
D1~D3 深度領域
2 超音波プローブ
3 超音波観測装置
4 表示装置
21 超音波振動子
31 送信部
32 受信部
33 信号処理部
34 超音波画像生成部
35 判定部
36 領域特定部
37 感度低下部表示画像生成部
38 入力部
39 制御部
40 記憶部
100、200 感度低下部表示画像
B1~B5、Bij(i=1~5、j=1~3) 超音波ビーム
b1~b5 ビーム領域
bij(i=1~5、j=1~3) 部分ビーム領域
D1~D3 深度領域
Claims (11)
- 超音波を発生する複数の素子を有する超音波振動子を備えた超音波プローブを接続可能であり、接続された前記超音波プローブに超音波を発生させる送信信号を送信する一方、前記超音波プローブから受信したエコー信号をもとに超音波画像のデータを生成する超音波観測装置であって、
前記複数の素子がそれぞれ受信する前記エコー信号に対応するデジタル信号のデータを用いて各素子が感度低下を有する感度低下素子であるか否かを判定する判定部と、
前記判定部が感度低下素子であると判定した素子の超音波ビームに対する寄与度をもとに超音波画像中において感度が低下した領域を特定する領域特定部と、
前記領域特定部が特定した前記領域を表示する感度低下部表示画像のデータを生成する感度低下部表示画像生成部と、
を備えたことを特徴とする超音波観測装置。 - 前記感度低下部表示画像生成部は、
前記超音波ビームに対する感度低下素子の寄与度に応じた表示形態を有する感度低下部表示画像のデータを生成することを特徴とする請求項1に記載の超音波観測装置。 - 前記領域特定部は、
前記感度低下素子の超音波ビームに対する寄与度を合計した合計寄与度を算出し、算出した合計寄与度に基づいて前記領域を特定することを特徴とする請求項1に記載の超音波観測装置。 - 前記感度低下部表示画像生成部は、
前記合計寄与度に応じた視覚情報を前記領域に割り当てることによって前記感度低下部表示画像のデータを生成することを特徴とする請求項3に記載の超音波観測装置。 - 前記領域特定部は、
前記超音波が到達する深度に応じた寄与度をもとに前記領域を特定することを特徴とする請求項1に記載の超音波観測装置。 - 前記領域特定部は、
接続された超音波プローブの種類に応じた寄与度をもとに前記領域を特定することを特徴とする請求項1に記載の超音波観測装置。 - 前記判定部は、
1または複数の素子の感度情報を取得し、該感度情報に基づいて各素子が感度低下素子であるか否かを判定することを特徴とする請求項1に記載の超音波観測装置。 - 前記判定部は、
接続された超音波プローブの種類ごとに定められる条件に基づいて各素子が感度低下素子であるか否かを判定することを特徴とする請求項1に記載の超音波観測装置。 - 前記判定部は、
前記超音波プローブの接続を検知した場合に判定を行うことを特徴とする請求項1に記載の超音波観測装置。 - 超音波を発生する複数の素子を有する超音波振動子を備えた超音波プローブを接続可能であり、接続された前記超音波プローブに超音波を発生させる送信信号を送信する一方、前記超音波プローブから受信したエコー信号をもとに超音波画像のデータを生成する超音波観測装置の作動方法であって、
判定部が、前記複数の素子がそれぞれ受信する前記エコー信号に対応するデジタル信号のデータを用いて各素子が感度低下を有する感度低下素子であるか否かを判定する判定ステップと、
領域特定部が、前記判定ステップにおいて感度低下素子であると判定された素子の超音波ビームに対する寄与度をもとに超音波画像中において感度が低下した領域を特定する領域特定ステップと、
前記判定ステップにおいて特定された前記領域を表示する感度低下部表示画像のデータを生成する感度低下部表示画像生成ステップと、
を含むことを特徴とする超音波観測装置の作動方法。 - 超音波を発生する複数の素子を有する超音波振動子を備えた超音波プローブを接続可能であり、接続された前記超音波プローブに超音波を発生させる送信信号を送信する一方、前記超音波プローブから受信したエコー信号をもとに超音波画像のデータを生成する超音波観測装置の作動プログラムであって、
判定部が、前記複数の素子がそれぞれ受信する前記エコー信号に対応するデジタル信号のデータを用いて各素子が感度低下を有する感度低下素子であるか否かを判定する判定ステップと、
領域特定部が、前記判定ステップにおいて感度低下素子であると判定された素子の超音波ビームに対する寄与度をもとに超音波画像中において感度が低下した領域を特定する領域特定ステップと、
前記判定ステップにおいて特定された前記領域を表示する感度低下部表示画像のデータを生成する感度低下部表示画像生成ステップと、
を実行することを特徴とする超音波観測装置の作動プログラム。
Priority Applications (1)
| Application Number | Priority Date | Filing Date | Title |
|---|---|---|---|
| US16/905,720 US11723627B2 (en) | 2017-12-20 | 2020-06-18 | Ultrasound imaging system, operating method of ultrasound imaging system, and computer-readable recording medium |
Applications Claiming Priority (2)
| Application Number | Priority Date | Filing Date | Title |
|---|---|---|---|
| JP2017244256A JP6875268B2 (ja) | 2017-12-20 | 2017-12-20 | 超音波観測装置、超音波観測装置の作動方法および超音波観測装置の作動プログラム |
| JP2017-244256 | 2017-12-20 |
Related Child Applications (1)
| Application Number | Title | Priority Date | Filing Date |
|---|---|---|---|
| US16/905,720 Continuation US11723627B2 (en) | 2017-12-20 | 2020-06-18 | Ultrasound imaging system, operating method of ultrasound imaging system, and computer-readable recording medium |
Publications (1)
| Publication Number | Publication Date |
|---|---|
| WO2019124170A1 true WO2019124170A1 (ja) | 2019-06-27 |
Family
ID=66994009
Family Applications (1)
| Application Number | Title | Priority Date | Filing Date |
|---|---|---|---|
| PCT/JP2018/045565 Ceased WO2019124170A1 (ja) | 2017-12-20 | 2018-12-11 | 超音波観測装置、超音波観測装置の作動方法および超音波観測装置の作動プログラム |
Country Status (3)
| Country | Link |
|---|---|
| US (1) | US11723627B2 (ja) |
| JP (1) | JP6875268B2 (ja) |
| WO (1) | WO2019124170A1 (ja) |
Cited By (2)
| Publication number | Priority date | Publication date | Assignee | Title |
|---|---|---|---|---|
| JP2021178112A (ja) * | 2020-05-15 | 2021-11-18 | キヤノンメディカルシステムズ株式会社 | 超音波診断装置 |
| JP2022178120A (ja) * | 2021-05-19 | 2022-12-02 | コニカミノルタ株式会社 | 超音波診断装置、超音波診断装置の制御方法、及び、超音波診断装置の制御プログラム |
Citations (4)
| Publication number | Priority date | Publication date | Assignee | Title |
|---|---|---|---|---|
| JP2001269336A (ja) * | 2000-03-24 | 2001-10-02 | Toshiba Corp | 超音波診断装置 |
| JP2002159492A (ja) * | 2000-11-27 | 2002-06-04 | Aloka Co Ltd | 超音波診断装置及び素子試験方法 |
| JP2007252529A (ja) * | 2006-03-22 | 2007-10-04 | Fujinon Corp | 超音波診断システム、および超音波トランスデューサアレイの動作検証方法 |
| JP2013165880A (ja) * | 2012-02-16 | 2013-08-29 | Hitachi Aloka Medical Ltd | 超音波診断装置 |
Family Cites Families (4)
| Publication number | Priority date | Publication date | Assignee | Title |
|---|---|---|---|---|
| JP3658429B2 (ja) | 1995-06-23 | 2005-06-08 | 株式会社東芝 | 超音波診断装置 |
| JP2009178262A (ja) | 2008-01-29 | 2009-08-13 | Toshiba Corp | 超音波診断装置 |
| JP2011005023A (ja) * | 2009-06-26 | 2011-01-13 | Konica Minolta Medical & Graphic Inc | 超音波診断装置、超音波診断システムおよびこれらに用いる検査用治具 |
| JP2011050542A (ja) * | 2009-09-01 | 2011-03-17 | Fujifilm Corp | 超音波診断装置 |
-
2017
- 2017-12-20 JP JP2017244256A patent/JP6875268B2/ja active Active
-
2018
- 2018-12-11 WO PCT/JP2018/045565 patent/WO2019124170A1/ja not_active Ceased
-
2020
- 2020-06-18 US US16/905,720 patent/US11723627B2/en active Active
Patent Citations (4)
| Publication number | Priority date | Publication date | Assignee | Title |
|---|---|---|---|---|
| JP2001269336A (ja) * | 2000-03-24 | 2001-10-02 | Toshiba Corp | 超音波診断装置 |
| JP2002159492A (ja) * | 2000-11-27 | 2002-06-04 | Aloka Co Ltd | 超音波診断装置及び素子試験方法 |
| JP2007252529A (ja) * | 2006-03-22 | 2007-10-04 | Fujinon Corp | 超音波診断システム、および超音波トランスデューサアレイの動作検証方法 |
| JP2013165880A (ja) * | 2012-02-16 | 2013-08-29 | Hitachi Aloka Medical Ltd | 超音波診断装置 |
Cited By (7)
| Publication number | Priority date | Publication date | Assignee | Title |
|---|---|---|---|---|
| JP2021178112A (ja) * | 2020-05-15 | 2021-11-18 | キヤノンメディカルシステムズ株式会社 | 超音波診断装置 |
| CN113662581A (zh) * | 2020-05-15 | 2021-11-19 | 佳能医疗系统株式会社 | 超声波诊断装置 |
| US11918419B2 (en) | 2020-05-15 | 2024-03-05 | Canon Medical Systems Corporation | Ultrasound diagnostic apparatus and method for diagnosing ultrasound probe |
| JP7445513B2 (ja) | 2020-05-15 | 2024-03-07 | キヤノンメディカルシステムズ株式会社 | 超音波診断装置 |
| JP2024045777A (ja) * | 2020-05-15 | 2024-04-02 | キヤノンメディカルシステムズ株式会社 | 超音波診断装置 |
| JP7796153B2 (ja) | 2020-05-15 | 2026-01-08 | キヤノンメディカルシステムズ株式会社 | 超音波診断装置 |
| JP2022178120A (ja) * | 2021-05-19 | 2022-12-02 | コニカミノルタ株式会社 | 超音波診断装置、超音波診断装置の制御方法、及び、超音波診断装置の制御プログラム |
Also Published As
| Publication number | Publication date |
|---|---|
| JP2019107418A (ja) | 2019-07-04 |
| JP6875268B2 (ja) | 2021-05-19 |
| US11723627B2 (en) | 2023-08-15 |
| US20200315581A1 (en) | 2020-10-08 |
Similar Documents
| Publication | Publication Date | Title |
|---|---|---|
| US11432807B2 (en) | Ultrasound imaging system, operating method of ultrasound imaging system, and computer-readable recording medium | |
| JP2006095002A (ja) | 超音波画像境界抽出方法及び超音波画像境界抽出装置、並びに、超音波撮像装置 | |
| JPWO2013011800A1 (ja) | 超音波診断装置及び超音波探触子の振動子劣化検出方法 | |
| CN102014758A (zh) | 参考变形体、超声波诊断装置及超声波诊断方法 | |
| JP2006217934A (ja) | 超音波撮像装置及び超音波撮像方法 | |
| JP7191949B2 (ja) | 超音波システムおよび超音波システムの制御方法 | |
| JP2016010523A (ja) | 超音波診断装置及びプログラム | |
| US11723627B2 (en) | Ultrasound imaging system, operating method of ultrasound imaging system, and computer-readable recording medium | |
| JP6589619B2 (ja) | 超音波診断装置 | |
| US20140200451A1 (en) | Ultrasonic measuring device, ultrasonic diagnosis device, ultrasonic measurement sheet, and measuring method | |
| US11927703B2 (en) | Ultrasound system and method for controlling ultrasound system | |
| US10492762B2 (en) | Ultrasound diagnostic device, ultrasound diagnostic method, and program | |
| JP2019208591A (ja) | 超音波診断装置および自動保存制御プログラム | |
| JP4594836B2 (ja) | 超音波撮像装置 | |
| WO2019124171A1 (ja) | 超音波観測装置、超音波観測装置の作動方法および超音波観測装置の作動プログラム | |
| JP7242618B2 (ja) | 超音波画像表示システム及びその制御プログラム | |
| JP7253400B2 (ja) | 超音波診断装置、プローブ感度管理システム、及びプログラム | |
| CN116350270A (zh) | 一种超声成像方法及装置 | |
| WO2022270180A1 (ja) | 超音波診断装置および超音波診断装置の制御方法 | |
| US12508003B2 (en) | Ultrasound system, ultrasound probe, control method of ultrasound system, and control method of ultrasound probe | |
| US20230270410A1 (en) | Ultrasound diagnostic apparatus and control method for ultrasound diagnostic apparatus | |
| US20240115241A1 (en) | Ultrasound diagnostic apparatus and control method thereof | |
| US11284865B2 (en) | Ultrasonic diagnostic apparatus and method for controlling pulse repetition frequency | |
| WO2023281987A1 (ja) | 超音波システムおよび超音波システムの制御方法 | |
| WO2024252739A1 (ja) | 超音波診断装置、目的結果抽出方法及び目的結果抽出プログラム |
Legal Events
| Date | Code | Title | Description |
|---|---|---|---|
| 121 | Ep: the epo has been informed by wipo that ep was designated in this application |
Ref document number: 18890328 Country of ref document: EP Kind code of ref document: A1 |
|
| NENP | Non-entry into the national phase |
Ref country code: DE |
|
| 122 | Ep: pct application non-entry in european phase |
Ref document number: 18890328 Country of ref document: EP Kind code of ref document: A1 |