WO2019106940A1 - 3dパラメータ推定装置、3dパラメータ推定プログラム及び3dパラメータ推定方法 - Google Patents
3dパラメータ推定装置、3dパラメータ推定プログラム及び3dパラメータ推定方法 Download PDFInfo
- Publication number
- WO2019106940A1 WO2019106940A1 PCT/JP2018/036668 JP2018036668W WO2019106940A1 WO 2019106940 A1 WO2019106940 A1 WO 2019106940A1 JP 2018036668 W JP2018036668 W JP 2018036668W WO 2019106940 A1 WO2019106940 A1 WO 2019106940A1
- Authority
- WO
- WIPO (PCT)
- Prior art keywords
- information
- parameter
- frequency information
- registered
- conversion information
- Prior art date
- Legal status (The legal status is an assumption and is not a legal conclusion. Google has not performed a legal analysis and makes no representation as to the accuracy of the status listed.)
- Ceased
Links
Images




Classifications
-
- G—PHYSICS
- G06—COMPUTING OR CALCULATING; COUNTING
- G06Q—INFORMATION AND COMMUNICATION TECHNOLOGY [ICT] SPECIALLY ADAPTED FOR ADMINISTRATIVE, COMMERCIAL, FINANCIAL, MANAGERIAL OR SUPERVISORY PURPOSES; SYSTEMS OR METHODS SPECIALLY ADAPTED FOR ADMINISTRATIVE, COMMERCIAL, FINANCIAL, MANAGERIAL OR SUPERVISORY PURPOSES, NOT OTHERWISE PROVIDED FOR
- G06Q10/00—Administration; Management
- G06Q10/04—Forecasting or optimisation specially adapted for administrative or management purposes, e.g. linear programming or "cutting stock problem"
Definitions
- the present invention relates to a 3D parameter estimation device, 3D parameter estimation program, and 3D parameter estimation method for estimating 3D parameters from 2D parameters of discrete bodies such as particles.
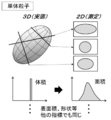
- the cross section of one particle has various shapes depending on the cutting position as shown in FIG. 1 (a). Therefore, the measurement value of the 2D measurement is represented by a frequency distribution having a variation, and it becomes difficult to set the true value of the 3D parameter to one.
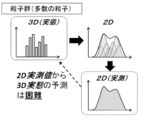
- the individual shown in FIG. when it is going to acquire the frequency distribution of the true values of the 3D parameters of the particles for a particle group consisting of a large number of particles, as shown in FIG. 1 (b), the individual shown in FIG. In this case, it is difficult to set the frequency distribution of the true value of the 3D parameter to one from the measurement value of the 2D measurement because the variation of the measurement value of the 2D measurement in the particles of the above acts in combination.
- FIG. 1 (a) is an explanatory view for explaining that it is difficult to set one true value of a 3D parameter from a measured value of 2D measurement for one particle
- FIG. 1B is an explanatory view for explaining a situation in which it is difficult to set one frequency distribution of true values of 3D parameters from measurement values of 2D measurement for particle groups.
- the vertical axis represents frequency
- the horizontal axis represents indexes such as volume and area.
- a method of estimating the 3D size distribution is proposed using a conversion table calculated geometrically from the measurement result of the 2D size distribution of spherical particles.
- a conversion table calculated geometrically from the measurement result of the 2D size distribution of spherical particles.
- estimation of the 3D size distribution is performed on particles having uniform particle shapes (spherical shapes) and distribution of sizes.
- an improvement method has also been proposed for a particle group having a uniform spheroid shape in place of the spherical particles (see Non-Patent Document 2). In this improvement method, estimation of the 3D size distribution is performed on particles having a uniform shape (spheroid) and a distribution of sizes.
- the aspect ratio distribution and major axis of 2D cross section calculated geometrically for particle groups having different spheroid shapes with different aspect ratios (ratio of major axis length to minor axis length) and size distribution
- a method has been proposed to estimate the 3D aspect ratio and long axis length from the measured aspect ratio distribution of the 2D cross section and the long axis length using the relationship between the long and 3D aspect ratio and the long axis length (non-patented) Reference 3).
- a spheroid shape with regular particle shape is to be estimated.
- a method for estimating a 3D shape by fitting a 2D particle cross-sectional shape with a shape index using a Fourier series and creating a 3D model particle based on the shape index (non-patent document) 4).
- the 3D shape estimation is performed on the premise that the shape and size of the particles are uniform and the particle cross section passes through the center point of the particles.
- the present invention solves the above-mentioned problems in the prior art and is a 3D parameter estimation device, 3D parameter estimation program that can estimate 3D parameters of various indicators from 2D parameters specified by various indicators, targeting all discrete objects. And providing a 3D parameter estimation method.
- the means for solving the problems are as follows. That is, ⁇ 1> The registered 2D frequency information and the frequency information based on the frequency information for each class when the 2D parameters for indexing the two-dimensional feature of one discrete object are classified according to the value according to the registered 2D frequency information 2D to 3D conversion information database in which a group of 2D to 3D conversion information forming a pair of conversion information is stored with registered 3D parameter information having value information of 3D parameters for indexing three-dimensional features of the discrete body at one time And one or more of the discrete objects as an object to be estimated, and input frequency information in which information of measured values of the 2D parameter measured for the object to be estimated is represented in the form of frequency for each class
- the input frequency information and the 2D are evaluated by evaluating the difference between the input frequency information and the comparison information based on the registered 2D frequency information for the 2D parameters of the same type.
- 3D parameter estimation means for associating 3D conversion information with each other and for estimating the 3D parameter of the object to be estimated based on the registered 3D parameter information of the 2D to 3D conversion information associated with the 3D conversion information 3D parameter estimation device.
- the input frequency information includes a plurality of discrete bodies as a set of estimation targets, and the class of the discrete bodies in the set when the discrete bodies are classified according to the respective measurement values of the 2D parameter
- the aggregate frequency information is based on the existence ratio of each, and the comparison information includes a plurality of registered 2D frequency information possessed by individual 2D to 3D conversion information for the 2D parameters of the same type as the aggregate frequency information.
- the 3D parameter estimation device which is information based on estimated frequency information accumulated for conversion information.
- the 3D parameter estimation means evaluates the existing ratio of the 2D-3D conversion information having the registered 2D frequency information corresponding to the frequency information of the discrete objects constituting the aggregate in the 2D-3D conversion information database Using an objective function that evaluates the difference between the input frequency information and the comparison information based on the evaluation value for each of the 2D to 3D conversion information, the evaluation value under the condition that the value of the objective function becomes maximum or minimum Solving the objective function as an application rate, and the input frequency information and the 2D-3D conversion information according to the application rate, wherein the optimum value is an application rate at which the 2D-3D conversion information is applied to the aggregate
- the 3D parameter estimation device according to ⁇ 2>, which is configured to associate.
- a 2D to 3D conversion information database is different from the linear group of 2D to 3D conversion information created based on the discrete body and the size similar to the discrete body, and a plurality of settings are made for one discrete body
- the 3D parameter estimation means solving the objective function for the first-order group First-order solution calculation processing for calculating a first-order solution as a provisional solution giving an optimum value, and second-order as an optimum solution giving an optimum value by solving the objective function for the second-order group based on the first-order solution
- the 3D parameter device according to ⁇ 3>, which can execute secondary solution calculation processing for calculating a solution.
- ⁇ 5> The 3D parameter estimation device according to any one of ⁇ 3> to ⁇ 4>, wherein an optimal solution of an objective function can be calculated by genetic algorithm analysis.
- One 2D to 3D conversion information has a plurality of registered 2D frequency information based on different types of 2D parameters, and the 3D parameter estimation means is of the same type as the input frequency information among the plurality of registered 2D frequency information.
- the 3D parameter estimation device according to any one of ⁇ 1> to ⁇ 5>, which is capable of estimating a 3D parameter to be estimated for the registered 2D frequency information based on the 2D parameter.
- One 2D to 3D conversion information has a plurality of registered 3D parameter information based on 3D parameters of different types, and the 3D parameter estimation means has a plurality of the registered 3D parameter information that the 2D to 3D conversion information has The 3D parameter estimation device according to any one of ⁇ 1> to ⁇ 6>, wherein the 3D parameters of the same kind of to-be-estimated object can be simultaneously estimated.
- a 3D parameter estimation program characterized by causing a computer to function as the 3D parameter estimation apparatus according to any one of ⁇ 1> to ⁇ 7>.
- 3D characterized by performing a 3D parameter estimation step of associating 2D-3D conversion information and estimating the 3D parameter of the object to be estimated based on the registered 3D parameter information of the 2D-3D conversion information associated with the 2D-3D conversion information Parameter estimation method.
- the above problems in the prior art can be solved, and a 3D parameter estimation device that can target 3D parameters of various indexes from 2D parameters specified by various indexes, targeting all discrete bodies.
- a 3D parameter estimation program and a 3D parameter estimation method can be provided.
- the verification results for the 3D parameters of the surface area (Q 1) is a diagram showing the cumulative distribution.
- the verification results for the 3D parameters of the volume (Q 2) is a diagram showing the cumulative distribution. It is a diagram showing the cumulative distribution verification results for the 3D parameters of the major axis (Q 3).
- Major axis / center pole length ratio verification results for the 3D parameters (Q 4) is a diagram showing the cumulative distribution.
- Major axis / minor axis ratio a verification result for 3D parameters (Q 5) is a diagram showing the cumulative distribution.
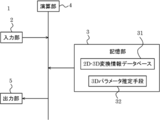
- FIG. 2 is a block diagram showing a configuration example of the 3D parameter estimation device.
- the 3D parameter estimation device 1 includes an input unit 2, a storage unit 3, an arithmetic unit 4, and an output unit 5.
- the input unit 2 is constituted by known information input means such as key input, touch input, data reading unit and the like, and can output input information to the operation unit 4.
- the storage unit 3 is constituted by a known memory such as a random access memory (RAM) or a read only memory (ROM), and stores the 2D-3D conversion information database 31 and the 3D parameter estimation means (program) 32 and an operation unit. It can also function as the fourth work area.
- RAM random access memory
- ROM read only memory
- Arithmetic unit 4 is configured by a known arithmetic unit such as a CPU (Central Processing Unit), and is capable of executing processing prescribed in a predetermined program based on an input instruction, and instructs each unit,
- the 3D parameter estimation device 1 can be controlled in an integrated manner.
- the arithmetic unit 4 reads a predetermined program from the storage unit 3 based on data and instructions input from the input unit 2 and executes processing.
- the processing result is stored in the storage unit 3 and output to the output unit 5.
- the 2D-3D conversion information database 31 has registered 2D frequency information and the frequency information based on frequency information for each class when 2D parameters that index two-dimensional features of one discrete object are classified according to values.
- a group of 2D to 3D conversion information forming a pair of conversion information is stored with registered 3D parameter information having value information of 3D parameters indicating the three-dimensional feature of the discrete body when the registered 2D frequency information is stored.
- the discrete body means one that can distinguish and distinguish the space from itself and the outside. For example, particles, lumps, crystals, cells, voids, bubbles and the like can be mentioned. Moreover, as said discrete body, in addition to what is a simple shape, such as spherical shape and an ellipsoidal shape, the thing of a distorted shape is included. When a plurality of discrete bodies are to be estimated, the shapes of the discrete bodies may be uniform or nonuniform.
- Examples of the index given by the magnitude of a single physical quantity related to the shape include the following indices for the 2D parameter and the 3D parameter.
- the equal-area circle diameter the diameter of a circle equal to the area of the cross section or projection view (hereinafter simply referred to as “cross section etc”) of the discrete body can be mentioned.
- cross section etc the diameter of a circle equal to the area of the cross section or projection view (hereinafter simply referred to as “cross section etc”) of the discrete body.
- an ellipse, a rectangle, a polygon, or the like may be used instead of the circle, and the representative lengths may be used.
- the Feret diameter the distance between two parallel straight lines sandwiching the cross section etc. can be mentioned. The largest Feret diameter is taken as the major axis, and the Feret diameter orthogonal to the major axis is taken as the minor axis.
- the lengths of the respective axes be the major axis length (a) and the minor axis length (c), respectively.
- Inertia constituted by the second-order central moment of the discrete body for 3-dimensional data which is mainly used when analyzing digital data of the cross section etc. as an eigen value of the inertia matrix and which gives a slight thickness to the cross section etc.
- the first and second largest eigenvalues of the matrix may be the major axis length (a ') and the minor axis length (c'), respectively.
- the area of the cross section etc. may be mentioned.
- 3D Parameter As an equal-volume sphere diameter, the diameter of a sphere equal to the volume of the discrete body can be mentioned.
- an ellipsoid, a cuboid, a polygon, a cylinder, or the like may be used instead of the sphere, and the representative lengths may be used.
- the Calliper diameter includes the distance between two parallel planes sandwiching the discrete body. The largest Calliper diameter is taken as the major axis, and the smallest Calliper diameter orthogonal to the major axis is taken as the minor axis, and the axis orthogonal to the major and minor axes is taken as the central axis.
- the lengths of the respective axes are respectively taken as the long axis length (a), the medium axis length (b), and the short axis length (c). It includes the eigenvalues of the inertia matrix. This index is mainly used when analyzing digital data of the discrete field, and the first, second and third largest eigenvalues of the inertia matrix formed by the second-order central moment of the discrete field are respectively long An axial length (a '), an intermediate axial length (b'), and a short axial length (c ') are used. Surface area is mentioned. Volume is mentioned.
- index given by the axial length ratio examples include the following indices for the 2D parameter and the 3D parameter.
- a / c As a major axis length / minor axis length ratio, a / c can be mentioned.
- Anisotropic indices include the positive square root of a / c.
- a / c can be mentioned.
- the major axis length / middle axis length ratio includes a / b.
- the central axis length / short axis length ratio includes b / c.
- ac / b 2 can be mentioned.
- the volume space filling rate includes abc / V.
- V represents the volume of the discrete body.
- na 2 b-100 can be mentioned. However, n shows 100 / V.
- index given on the basis of the shape examples include the following indices for the 2D parameter and the 3D parameter.
- this index when the shape of the discrete body is close to a shape other than a sphere and a circle, an ellipsoid, a rectangular solid, a polygonal body, a cylinder or the like is used instead of the sphere, and an ellipse, a rectangle, a large number instead of a circle. It can be used as an index in the same concept using a square or the like.
- L c / L can be mentioned as the circularity (1).
- L c represents ⁇ D H
- D H represents a positive tetragonal root of 4A ⁇
- A represents an area such as the cross section of the discrete body
- L represents a circumferential length of the discrete body .
- D R ⁇ / D L can be mentioned.
- D R - represents a ⁇ D R ( ⁇ ) d ⁇ / ⁇
- D R ( ⁇ ) is the discrete member when the two-dimensional image contour of the discrete bodies and polar coordinates the center of gravity or the like of the image as the origin Represents the angle of the diameter when the two-dimensional image contour is displayed in polar coordinates with the center of gravity of the image or the like as the origin
- D L represents L / ⁇ .
- D R ⁇ / D H can be mentioned.
- D F ⁇ / D H can be mentioned.
- D F - indicates a ⁇ D F ( ⁇ ) d ⁇ / ⁇
- D F has the same meaning as a.
- D R ⁇ / D F can be mentioned.
- a / ⁇ HL 2 can be mentioned.
- ⁇ HL is synonymous with L c / L as the circularity (1).
- D R ( ⁇ max ) / D R ( ⁇ max + ⁇ / 2) can be mentioned.
- ⁇ max indicates ⁇ when D R ( ⁇ ) is maximized.
- the roundness includes ⁇ / NR max .
- ⁇ indicates a local radius of curvature obtained by arc-approximating the contour of the discrete body
- N indicates the number of approximate arcs of the discrete body
- R max indicates the maximum inscribed circle radius of the discrete body.
- a / A ' is mentioned as a cash index. However, A 'shows the minimum circumscribed rectangular area of the above-mentioned section etc.
- S SP / S can be mentioned.
- S represents the surface area of the discrete body
- S SP represents 4 ⁇ (6 V / ⁇ ) 2/3 .
- D H / D min can be mentioned.
- D min indicates the minimum circumscribed circle diameter of the projection image of the discrete body.
- the index given by the calculation of the fractal dimension approximates the cross section etc. (two-dimensional) or the surface (three-dimensional) of the discrete body by the division elements (line segment, square lattice, plane, cubic lattice) in the following method
- the size of the division element when changing the division element to various sizes and the size of the perimeter (two dimensions) of the discrete body or the surface area (three dimensions) of the discrete body in a bilogarithmic graph Based on the fractal dimension calculated from the slope of the approximate line obtained by the least squares method.
- the following calculation method can be exemplified for the 2D parameter and the 3D parameter.
- 2D Parameter A method (Structured walk method) based on calculating the perimeter of the discrete body by approximating the outer periphery of the cross section or the like with a set of line segments of a certain length (the divided elements).
- Grid counting method based on calculating the perimeter of the discrete body by approximating the outer periphery of the cross section or the like with a set of square grids (division elements).
- 3D Parameter There is a method based on calculating the surface area of the discrete body by approximating the surface of the discrete body with a set of surfaces of the constant area (the division elements). There is a method based on calculating the surface area of the discrete body by approximating the surface of the discrete body with a set of cubic lattices (the division elements).
- F in the next Fourier coefficient is used as a two-dimensional or three-dimensional function to be used as a two-dimensional or three-dimensional shape index.
- C k ⁇ Fexp ( ⁇ jk ⁇ ) d ⁇ / 2 ⁇ as a function of 2D parameters and 3D parameters common Fourier coefficients.
- j represents a positive square root of -1
- k represents an integer of 1 or more
- F represents any of a radial function, a argument function and a radial vector.
- a k / A 0 can be mentioned as a function of the normalized Fourier coefficients. Where A k is equal to
- ⁇ k / A 0 k is given as a function of the k-th index.
- ⁇ k represents ⁇ [r ( ⁇ ) ⁇ A 0 ] k d ⁇ / 2 ⁇ , and r ( ⁇ ) represents a radial function.
- Examples of the other indicators include the following indicators for the 2D parameter and the 3D parameter.
- the roundness represented by the following equation can be mentioned.
- the numerator indicates the average value of the radius of the circle inscribed in all the corners (n) of the discrete body
- the denominator indicates the radius of the largest circle inscribed in the discrete body.
- the degree of angularity may be a value obtained by summing the angles of all the corners of the discrete body.
- a / L 2 can be mentioned.
- the unevenness coefficient 4 ⁇ A / L 2 can be mentioned.
- R 1 shows the positive square root of a / A
- R 2 shows the positive square root of c / A
- the positive square root of D F ⁇ / D L is shown as the index of the depression.
- the coefficient of variation of the expanded diameter includes the positive square root of ⁇ [D R ( ⁇ ) ⁇ D R ⁇ ] 2 d ⁇ / D R 2 .
- the variation coefficient of the Feret diameter includes the positive square root of ⁇ [D F ( ⁇ ) ⁇ D F ⁇ ] 2 d ⁇ / D F 2 .
- L / A can be mentioned as the perimeter / area ratio.
- S / D P 2 can be mentioned as the surface area shape factor.
- S indicates the surface area of the discrete body
- D P indicates various particle sizes given as the equal-volume sphere diameter, the Calliper diameter, and the eigenvalues of the inertia matrix.
- V / D P 3 can be mentioned.
- Specific surface area shape factor include (S / V) D P.
- a shape factor of Carman is 6 / ⁇ SV .
- ⁇ SV is synonymous with the specific surface area shape factor.
- the 2D-3D conversion information database 31 is configured such that the 2D-3D conversion information forms a pair of conversion information with the registered 2D frequency information based on the 2D parameters and the registered 3D parameter information based on the 3D parameters.
- Ru For example, when the area of the cross section or the like is used as the 2D parameter and the registered 2D frequency information is the frequency information of the area of the cross section or the like, the 2D to 3D conversion information includes the registered 2D frequency information and the frequency A pair of conversion information is configured with the registered 3D parameter which is the value of the 3D parameter of the discrete field having information.
- the 2D parameter another index such as the major axis length / minor axis length ratio can be used instead of the area of the cross section etc. from the viewpoint of ease of handling and ease of handling.
- the registered 3D parameter any index that the user wants to grasp can be selected.
- the 2D parameters can be selected from various indexes, but the 2D-3D conversion information database 31 includes a plurality of registered 2Ds based on the different 2D parameters for one piece of 2D-3D conversion information. It may have frequency information. That is, one set of 2D-3D conversion information may include a group of the registered 2D frequency information, and this group may be configured to form a pair of conversion information with the registered 3D parameter information (and its group).
- the 3D parameter estimation unit 32 estimates the 3D parameters of the to-be-estimated target, from among the plurality of registered 2D frequency information, the registered 2D frequency information based on the 2D parameters of the same type as the input frequency information. can do.
- the user appropriately selects any 2D parameter from among the 2D parameters of different types. It can be selected to estimate the 3D parameters.
- the 3D parameters can be selected from various indexes, but the 2D-3D conversion information database 31 includes a plurality of the 3D parameters based on different types of 3D parameters per one 2D-3D conversion information. It may have registered 3D parameter information. That is, one piece of 2D-3D conversion information may have a group of the registered 3D parameter information, and this group may be configured to form a pair of conversion information with the registered 2D parameter information (and the group thereof). In this case, the 3D parameter estimation means 32 can simultaneously estimate the plurality of registered 3D parameter information possessed by the 2D-3D conversion information. Therefore, if the 2D-3D conversion information based on the plurality of registered 3D parameter information is registered in the 2D-3D conversion information database 31, the plurality of 3D parameters of different types are simultaneously estimated according to the user's request. can do.
- the 2D parameters of the discrete body and the 3D parameters may be created based on the actual measurement results, or model particles of the discrete body are created virtually on a computer, It may be created based on the 2D parameters calculated from the model particle and the 3D parameters.
- the 3D parameter estimation means 32 has one or more of the discrete objects as an object to be estimated, and an input in which information on measured values of the 2D parameters measured for the object to be estimated is expressed in the form of frequency for each class
- the input frequency information is associated with the 2D-3D conversion information by evaluating the difference between the input frequency information and the comparison information based on the registered 2D frequency information for the 2D parameters of the same type, using frequency information as an input.
- the 3D parameter of the object to be estimated can be estimated based on registered 3D parameter information of the associated 2D-3D conversion information.
- the 3D parameter estimation means first, using the frequency information itself of the discrete object to be estimated with the single discrete object as the target of estimation as the input frequency information, the registered 2D frequency as the comparison information
- the information can be used as a means to estimate the 3D parameters for one of the discrete fields.
- a plurality of the discrete bodies as the input frequency information is a set of the objects to be estimated, and the discrete bodies in the set when the discrete bodies are classified according to the respective measurement values of the 2D parameter
- a plurality of registered 2D frequency information possessed by each 2D to 3D conversion information for the 2D parameters of the same type as the aggregate frequency information is used as the comparison information using aggregate frequency information based on the existence ratio for each class.
- the information processing apparatus can be configured as means for estimating the 3D parameter for the assembly using information based on estimated frequency information integrated for the 2D-3D conversion information. In the latter, there is no need to handle inputs and analysis results (outputs) for each discrete body when multiple discrete bodies are to be estimated, and one 2D parameter for one discrete body. Since it is necessary to measure the input frequency information for one set of the aggregate, it is not necessary to acquire the frequency information for each discrete object, and the 3D parameter estimation device can be made excellent in convenience.
- the method for associating the input frequency information with the comparison information is not particularly limited and can be appropriately selected according to the purpose.
- the comparison information based on the input frequency information and the registered 2D frequency information Can be compared and associated with matching ones, or can be associated with appropriate approximation values if they do not match.
- the estimation process since the estimation process can not be performed when they do not match, it is necessary to register a huge amount of the 2D-3D conversion information in the 2D-3D conversion information database 31, and the latter
- the 3D parameter estimation means 32 when configured as means for estimating the 3D parameters of one discrete object, the frequency information as the input frequency information and the registered 2D frequency information as the comparison information
- the objective function is evaluated by using the objective function for evaluating differences, and solving the objective function by using one piece of 2D-3D conversion information having the registered 2D frequency information that gives maximum or minimum value to the objective function as an optimal solution.
- the 3D parameter estimation means 32 can be configured to associate input frequency information with the 2D-3D conversion information.
- the 3D parameter estimation unit when the 3D parameter estimation means 32 is configured as means for estimating the 3D parameters of the aggregate, the 3D parameter estimation unit has the registered 2D frequency information corresponding to the frequency information of the discrete objects constituting the aggregate.
- the 2D-3D conversion information evaluates the existing ratio in the 2D-3D conversion information database
- the difference between the input frequency information and the comparison information is evaluated based on the evaluation value for each 2D-3D conversion information
- the objective function is solved using the evaluation value under the condition that the value of the objective function is maximum or minimum as the optimum value using the objective function, and the 2D-3D conversion information is applied to the aggregate with the optimum value.
- the 3D parameter estimation unit 32 is configured to associate the input frequency information with the 2D to 3D conversion information according to the application ratio as the application ratio to be It can be.
- the objective function is not particularly limited as long as the difference between the input frequency information and the comparison information can be evaluated, and can be selected as appropriate.
- the optimum value or the optimum value may be determined by the evaluation value having an extreme value, and the case where the evaluation value is maximum is evaluated as the optimum solution or the optimum value. Even if, the minimum case may be evaluated as the optimal solution or the optimal value.
- the 2D-3D conversion information database 31 is a linear group of the 2D-3D conversion information created based on the discrete body, and the discrete group A structure similar to the body and different in size, and configured to record the 2D to 3D conversion information of the 2D to 3D conversion information created on the basis of the size-changed body of the discrete body set plurally for one discrete body
- First-order solution calculation processing in which the 3D parameter estimation means 32 calculates a first-order solution as a temporary solution that gives the optimum value by solving the objective function for the first-order group, and It is preferable to be able to execute a second order solution calculation process of calculating a second order solution as an optimum solution which gives the optimum value by solving the objective function for the next group.
- the size change body is a kind of the discrete body, it is referred to as another name for the discrete body in a sense of distinguishing from the arbitrary discrete body from the relationship with the discrete body regarding the first-order group Ru. Incidentally, this point will be described in detail in the following embodiment.
- the genetic algorithm analysis is an optimization analysis method that simulates the genetic mechanism of an organism and natural selection (see the following reference for details). References: Holland, JH, 1975. Adaptation in Natural and Artificial Systems. Univ. Of Michigan Press
- the purpose of the individual excellence is This is an operation that expresses an objective function as a real value using "objective function”, converts the objective function to "fitness” based on a fixed rule, and increases or decreases the number of children left in the next generation according to the fitness.
- the binary coding that is, a method of directly coding the gene string as a real binary number or an N base number can be mentioned.
- Gray coding that is, a method using gray codes (sequences in which two successive integer values are assigned to differ by only one bit) can be mentioned.
- the action method of selection in the genetic algorithm analysis is not particularly limited, and examples thereof include the following.
- Roulette wheel selection that is, the fitness (A i ) of individual i and the sum (B) of the fitness of all individuals are calculated, and the probability that individual i is A i / B in the set of individuals after selection Methods to be included in Incidentally, as the roulette selection, “linear scaling” using a linear expression of fitness as a probability and a constant coefficient for fitness other than “fitness proportional selection” using probability proportional to fitness as described above It is good also as “power scaling” which carries out exponentiation.
- Ranking selection that is, each individual is ranked by fitness, and there is a method of determining a set of individuals after selection based on a predetermined probability for each rank.
- tournament selection that is, a method in which an operation of randomly extracting an appropriate number of individuals from a set of individuals and selecting one of them is repeated a certain number of times.
- Elite strategy elitism
- elitism individuals with the highest fitness in the population of each generation are not subjected to crossover or mutation, unconditionally left as they are in the next generation, the roulette selection, the ranking
- the method of using in combination with the selection and the tournament selection may be mentioned.
- One-point crossover or simple crossover that is, a method in which one crossover point is selected in the gene string and the portion in front of or behind the intersection is replaced.
- Multi-point crossover or multi-point crossover that is, a method of selecting a plurality of crossover points in a gene string and replacing a portion sandwiched between the crossover points.
- a uniform crossover that is, a method in which each gene of a gene string randomly inherits the gene of either parent.
- the role of the genetic algorithm analysis is to optimize the evaluation of the objective function. Therefore, as the calculation process of the optimal solution or the optimal value of the objective function, any optimization method that plays such a role can be suitably employed. In addition, even if these optimization methods are not used, if all the patterns that can be taken by the objective function can be analyzed by round-robin analysis, the optimum solution can be found out, but the analysis processing becomes complicated. Examples of the optimization method other than the genetic algorithm analysis are shown below.
- Linear programming that is, a method of maximizing or minimizing a linear function under constraints expressed by a linear inequality or equation.
- Main methods of the linear programming include simplex method and interior point method.
- Multi-start local search method that is, local search by repeatedly performing local search from an initial solution generated by an appropriate method to a neighborhood (a solution set obtained by slightly modifying the initial solution)
- Annealing method simulated annealing
- the probability is set to be large at first and gradually smaller.
- the tabu search method is a method of searching for a neighborhood from an initial solution generated by an appropriate method, but not selecting again a previously searched solution.
- Particle swarm optimization method that is, a method of searching a solution space by changing the position according to the speed at which a group composed of a plurality of particles (discrete bodies) is adjusted based on the past history Can be mentioned.
- It includes an evolutionary computation or an evolutionary algorithm, that is, an optimization calculation method that imitates biological evolution on a computer.
- the main ones are genetic programming, evolutionary programming, and evolution strategy. These have the following features as compared to the genetic algorithm analysis. That is, in the genetic programming, which is an extension method of the genetic algorithm analysis, an indefinite-length gene expression using a tree structure is used.
- the evolutionary programming uses the same set of individuals and selections as the genetic algorithm analysis, but uses mutations for the evolution of individuals.
- a population of individuals using real values as they are is used to evolve by selection and mutation.
- the 3D parameter estimation device 1 can also estimate the 3D parameter relating to the orientation representing the characteristic of the direction of the discrete object by devising the setting method of the 2D registration frequency information.
- the coin having a disk shape for the orientation will be described as an example. Assuming that a large number of the coins are scattered into a weightless space and one moment is observed, the orientation of each coin becomes completely random. On the other hand, if a large number of the coins are thrown into a container of a certain size on the ground, many of the coins are stacked with their planes directed in the vertical (vertical) direction or in a direction close thereto. By comparison, the direction of the coin is clearly biased.
- orientation means the size of the deviation of the direction of the coin, that is, the size of the deviation of the direction of the discrete body, and is treated as one type of the 3D parameter. This orientation does not occur if the discretes are spherical, but may occur if they are non-spherical.
- the orientation is estimated as the 3D parameter, the 2D registration frequency information of the discrete body is set in a state where a plurality of orientations having different sizes are given.
- the 2D in which the discrete body is viewed from the horizontal direction when the direction of the major axis of the discrete body is oriented at 0 degrees, 30 degrees, 60 degrees, and 90 degrees with respect to the vertical (vertical) direction The frequency information of each parameter and the 2D parameter of the discrete body viewed from the horizontal direction when the direction of the major axis of the discrete body is randomly oriented with respect to the vertical (vertical) direction
- a total of five sets of the 2D registration frequency information are set with the frequency information.
- the orientation may be 0 degrees, 30 degrees, 60 degrees, 90 degrees, and the like. It is possible to estimate which of the streets are likely.
- the orientation can be estimated more accurately.
- the same direction for example, a direction inclined by 30 degrees with respect to all perpendicular (vertical) directions
- a direction inclined by 30 degrees with respect to all perpendicular (vertical) directions may be given with respect to the major axis direction of all the discrete bodies, or different directions with variations.
- a standard deviation of 5 degrees of the inclination angle may be given in a direction inclined by 30 degrees on the average with respect to the vertical (vertical) direction).
- the 3D parameter estimation program of the present invention is a program that causes a computer to function as the 3D parameter estimation device.
- the specific contents of the 3D parameter estimation program all the items described for the 3D parameter estimation apparatus can be applied, and duplicate explanations will be omitted.
- 3D parameter estimation method In the 3D parameter estimation method of the present invention, registered 2D frequency information and the frequency information are based on frequency information for each class when 2D parameters that index a two-dimensional feature of one discrete object are classified according to a value A group of 2D to 3D conversion information forming a pair of conversion information is stored with registered 3D parameter information having value information of 3D parameters indicating three-dimensional features of the discrete body when the registered 2D frequency information is used.
- the 2D-3D conversion information database one or more of the discrete objects are assumed to be estimated, and information of the measured value of the 2D parameter measured for the estimated object is represented in the form of the frequency for each class.
- FIG. 4 illustrates a 3D model particle of a / ca3.02.
- the surface area (Q 1 ), volume (Q 2 ), major axis length (Q 3 ), major axis length / middle axis length ratio (Q 4 ) and major axis Consider five types of long / short axis length ratio (Q 5 ). For each of the 3D model particles (50 particles), 5 types of 3D parameters were calculated according to the settings.
- each 2D parameter constitutes registered 2D frequency information of each 3D particle model as frequency information for each class when the 2D parameters are classified according to a value, and 2D to 3D conversion information Registered in the database. Further, each 3D parameter constitutes registered 3D parameter information as a value of 3D parameter held by each 3D model particle when the frequency information is the registered 2D frequency information, and the 2D to 3D conversion information database Registered in Thus, with respect to each of the 3D model particles (50 pieces), the registered 2D frequency information and the registered 3D parameter information are registered so as to form a pair of conversion information, thereby registering 2D to 3D conversion information.
- the 2D-3D conversion information database composed of a group of 50 pieces of 2D-3D conversion information was constructed temporarily.
- the application method of the said scale parameter (s) for every kind of said 2D parameter and said 3D parameter becomes as following Table 1 based on a geometrical calculation method.
- the 3D parameter to the value of the surface area (Q 1) of the standard particles is multiplied by s 2 set the surface area (Q 1) of the expansion particles, perimeter / area of surface area (Q 1) for the 2D parameters (P 1), with respect to the value of the perimeter / area of the standard particles (P 1), sets the perimeter / area of the expanded particles is multiplied by 1 / s (P 1).
- the 2D-3D conversion information database expanded by the scale parameter (s) was constructed secondarily.
- the 2D-3D conversion information database constructed secondarily includes a total of 550 (50 shape patterns ⁇ 11 size patterns) of different 2D-3D conversion information of different shapes and sizes.
- the 3D parameter estimation means estimates the 3D parameters of the discrete object associated with the object to be estimated through the evaluation of the objective function by the genetic algorithm analysis (see FIG. 3). Configured The details will be described below.
- the genetic algorithm analysis is performed by employing the binary coding, the tournament selection and the one-point crossover method.
- the size of the gene sequence by the binary coding is a condition for estimating the 3D parameter using the 2D-3D conversion information database (the number of the 2D-3D conversion information is 550) constructed secondarily (the following: This is referred to as "one-step GA") and is 3,300 bits.
- the 2D-3D conversion information database (the number of the 2D-3D conversion information is 50) which is constructed temporarily and the 2D-3D conversion information database (the 2D-3D conversion which is constructed secondarily) Under the condition (hereinafter, referred to as “two-step GA”) that estimates the 3D parameter using the number of information of 550, the first order using the 2D to 3D conversion information database constructed in a first order
- the size of the gene string is 300 bits
- the size of the gene string Is 3,300 bits.
- the tournament selection 25 individuals were randomly extracted, and the operation of selecting the best individual among them was performed as many times as the population size.
- the one-point crossover two individuals were randomly extracted, positions of crossover genes (crossing points) were randomly determined, and genes behind the crossover points were crossed.
- the 3D parameters of the object to be estimated are estimated under two processing conditions of the one-stage GA and the two-stage GA.
- the target to be estimated is the aggregate composed of a plurality of discrete bodies.
- an existing ratio of the 2D-3D conversion information having the registered 2D frequency information corresponding to the frequency information of the discrete objects constituting the aggregate is present in the 2D-3D conversion information database.
- the evaluation value under the condition that the value of the objective function is maximum, using the objective function that evaluates the difference between the input frequency information and the comparison information based on an evaluation value for each of the 2D to 3D conversion information to be evaluated. Solving the objective function with the optimal value as the optimal value, and using the optimal value as the application rate at which the 2D to 3D conversion information is applied to the assembly, the input frequency information and the 2D-3D according to the application rate Associate conversion information.
- the objective function has selectivity, and depending on the objective function, the objective function may be solved under the condition that the value becomes minimum. That is, the optimum value may be determined to be one for each of the 2D-3D conversion information by the maximum or minimum extreme value.
- a group of 2D-3D conversion information in which the shapes of the discrete bodies are different (each of the 2D-3D conversion information (50 pieces in the 2D-3D conversion information database constructed primarily) is targeted)
- Optimal solution that gives the optimal value by solving the objective function for a group of 3D conversion information (each 2D to 3D conversion information (550 pieces in the 2D to 3D conversion information database constructed secondarily))
- the second solution calculation process of calculating a second solution as H. is performed.
- the basic analysis method based on the genetic algorithm analysis is common to the one-step GA and the two-step GA. The details will be described below.
- the meanings of the three subscripts (i, j, k) are as follows. That is, i represents the type (P 1 to P 4 ) of the 2D parameter, and i satisfies the following equation: 1 ⁇ i ⁇ N P 2D .
- k represents the class number of the 2D parameter constituting the frequency information.
- the frequency information is represented by the frequency for each class when the 2D parameter is classified according to a value.
- an appropriate maximum value and minimum value are set for each type of the 2D parameter, and these ranges are equally divided by 1,000 to set 1 ⁇ k ⁇ 1,000.
- j represents the number assigned to each of the 2D-3D conversion information, j satisfies 1 ⁇ j ⁇ N C.
- f j i k represents the frequency of the ith 2D parameter of the jth 2D-3D conversion information in the kth said class of 2D parameters.
- the optimum value, which is the evaluation value when the value of the objective function is maximum, that is, the application rate at which the 2D-3D conversion information is applied to the aggregate is denoted by g j .
- any one of the 2D to 3D conversion information in the group of 2D to 3D conversion information stored in the 2D to 3D conversion information database is necessarily applied to the discrete objects constituting the aggregate. In order to satisfy this precondition, the following equation is given to g j .
- a sequence in which 3,300 numbers of 0 or 1 are randomly arranged is created, and this is considered as a 3,300-bit gene sequence.
- the binary 6 digit sequence (for example, 001011) is read from the top of the gene sequence by 6 bits and converted to decimal system. By performing this process for all 3,300 bits, one integer is assigned to each of all the 2D-3D conversion information.
- a normalized value obtained by dividing U j by U SUM corresponds to g j in the j-th 2D-3D conversion information.
- the estimated frequency information of k-th class i th 2D parameter (F i k), is calculated by the following equation (1).
- the estimated frequency information (F i k) is integrated registration 2D frequency information with the individual 2D-3D conversion information as for a plurality of the 2D-3D conversion information for the same type of the 2D parameters and input frequency information which will be described later It corresponds to the estimated frequency information.
- the input frequency information when the plurality of discrete bodies are regarded as the aggregate of the objects to be estimated, and the discrete bodies are classified according to the respective measurement values of the 2D parameters of the discrete bodies.
- the aggregate frequency information based on the accumulated value of the existence rates of the discrete fields for each of the classes in the aggregate of is used and represented by M i k .
- the difference between the cumulative estimation frequency (C i k) and the input frequency information (M i k) as D and calculated by the following equation (3).
- the reason for calculating the estimated frequency information from the frequency information (f j i k) (F i k) ( and the accumulated estimation frequency (C i k)) is as follows.
- the frequency information (f j i k ) is deterministic information on one of the discrete fields
- the estimated frequency information (F i k ) is the set of the discrete fields based on g j It is an estimate of the body.
- the input frequency information is input to each of the discrete bodies for estimation of the 3D parameter, and analysis is performed through comparison with the frequency information (f j i k ) There is a need.
- Such analysis can also be performed sequentially for each discrete body to be estimated, but when the number of discrete bodies is large, handling of input and analysis results (outputs) can be complicated. Also, as in the case where the object to be estimated is a group of crushed pieces of ore, it is not realistic to obtain a large number of discrete bodies and to acquire a plurality of cross sections from one discrete body one by one, that is, It may not be practical to obtain the frequency information of the 2D parameter for one discrete object.
- Analytics assembly configured as a unit by a plurality of said discrete body The analysis results of each of the discrete bodies belonging to the assembly are obtained simultaneously.
- the input frequency information (M i k ) which is a measurement value for the group
- the estimated frequency information (F i k) used and the accumulated estimation frequency (C i k)
- the frequency information (f j i k ) is used, and the input frequency information (M i k ) is used as the frequency information for one discrete object, that is, The frequency information in the format corresponding to the registered 2D frequency information is changed, and analysis is performed using the difference between the frequency information (f j i k ) and the frequency information in the format corresponding to the registered 2D frequency information.
- the objective function (O) is defined by the following equation.
- the objective function (O) has a value in the range of 0 to 1.
- the value of the objective function (O) is maximum, i.e., the difference between the cumulative estimation frequency (C i k) and the input frequency information (M i k) (D) Find the smallest g j.
- the g j is obtained for each of the 2D-3D conversion data (j), and an optimum solution is formed by each g j when the difference (D) is minimized.
- This optimal solution has a role of optimally estimating the existence ratio of each discrete body in the assembly (object to be estimated) for each class.
- an application ratio (g j ) to which the 2D-3D conversion data is applied is determined with respect to the group of discrete objects constituting the aggregate (object to be estimated), and each 2D -Each of the registered 3D parameter information possessed by the 3D conversion data is used as frequency information for each class according to the application ratio of the 2D to 3D conversion data, whereby the aggregate (target to be estimated) has this It is assumed as estimation information of the 3D parameter (frequency information for each class).
- the estimated frequency for the volume (3D parameter) of the discrete body of the aggregate is 0.0 for volume 0.2, 0.4 for volume 0.3, and 0.6 for volume 0.5.
- the cumulative distribution of the estimation information can be expressed as 0.0 for volume 0.2 or less, 0.4 for volume 0.3, and 1.0 for volume 0.5 or more.
- the volume value is interpolated. And the value. The interpolation is easy for linear interpolation, but other interpolation methods may be used.
- the registration 2D frequency as the input frequency information
- the value of the objective function (O) in the equation (4) is maximized, that is, the condition that the difference becomes the smallest is the frequency.
- One piece of the 2D-3D conversion information is specified from the information (f j i k ), and the registered 3D parameter information itself possessed by the 2D-3D conversion information is possessed by the object to be estimated (one discrete body) It may be an estimation result of 3D parameters.
- the optimal solution means the first-order solution as a temporary solution in the first-order solution calculation process of the two-step GA, and means the second-order solution which is the optimum solution itself in the second-order solution calculation process.
- the value of the objective function (O) is called the fitness.
- the term "objective function” may be replaced with "fitness", which has the same meaning. Further, analysis parameters of the genetic algorithm analysis used in the present embodiment are shown in Table 2 below.
- the 2D-3D conversion information of the two-stage GA is 50 in the 2D-3D conversion information database constructed in a first order, and 550 in the 2D-3D conversion information database constructed in a second order. There exist.
- the size of the gene string is 3,300 bits, and all the 2D-3D conversion information (550 pieces) in the 2D-3D conversion information database constructed secondarily are used.
- the genetic algorithm analysis was performed for all the 2D parameters (P 1 to P 4 ). Note that all the 3D parameters (Q 1 to Q 5 ) are output as the analysis result.
- the size of the gene string is set to 300 bits, and all the 2D to 3D conversion information in the 2D to 3D conversion information database constructed temporarily.
- the genetic algorithm analysis was performed on the 2D parameters (P 1 and P 2 ) contributing to the difference in shape using (50 pieces).
- the gene sequence (contributing to the difference in shape) in the primary solution (best individual) of the primary solution calculation process is inherited and the remaining expanded portion (size difference)
- the genetic algorithm analysis was performed on all the 2D parameters (P 1 to P 4 ) using (550).
- extension is performed without losing the information of the primary solution related to the particle shape after the primary solution calculation processing.
- extension is performed without losing the information of the primary solution related to the particle shape after the primary solution calculation processing.
- the following procedure was performed.
- a binary 6 digit binary number assigned to one piece of the 2D-3D conversion information constituting the gene sequence for the 300-bit gene sequence used for calculating the primary solution in the primary solution calculation process, a binary 6 digit binary number assigned to one piece of the 2D-3D conversion information constituting the gene sequence.
- An extension process is performed to convert a number sequence (6 bits) into a binary 66 digit number sequence (66 bits).
- conversion is performed using an extended number sequence in which 11 number sequences in 6-bit units are provided for one number sequence in 6-bit units.
- eleven 6-bit number sequences constituting the extended number sequence five are set to the same number sequence as the binary 6-digit number sequence (6 bits) before the extension process, and the remaining About six, it is set as the number sequence which arranged six 0 pieces.
- which number sequence is set to the same number sequence as the number sequence of binary 6 digits (six bits) and is set as a sequence of six 0s is random and Be done.
- the binary 6-digit number sequence (6 bits) before the extension processing is “001011”
- the binary 66-digit number sequence (66 bits) after the extension processing is “001011, 000000, 000000, 000000 , 001011, 000000, 001011, 001011, 000000, 001011, 000000 ".
- one binary 66 digit number sequence (66 bits) is composed of 11 binary six digit number sequences (6 bits). It is a thing.
- a total of five binary six-digit number sequences (six bits) corresponding to the first, fifth, seventh, eighth, and tenth in the 66-digit binary number sequence (66 bits) after the extension processing are Each is a copy of a binary 6-digit number sequence (6 bits) before the extension processing, and a total of 6 binary 6-digit number sequences (6 bits) corresponding to the second, third, fourth, sixth, ninth, and eleventh Is a sequence of six 0's.
- the number of copies of the binary 6-digit number sequence (6 bits) before the extension processing with respect to the 66-digit binary number sequence (66 bits) after the extension processing is five; Alternatively, four, six, seven, etc. may be used.
- This extension process is performed on each of 50 binary 6-digit number sequences (6 bits) constituting the 300-bit gene sequence before the extension process, and 50 binary 66-digit number sequences ( 66 bits), that is, in the 2D-3D conversion information (6 bits) unit, set is a 3,300-bit extended gene string composed of 550 binary 6 digit number sequences (6 bits).
- the analysis process of the objective function similar to the primary solution calculation process is performed by performing the algorithm analysis with the extended gene string as an initial solid. Specifically, each 6 bits from the beginning of the extended gene string are converted into a decimal integer (U j ) in units of binary 6 digit number sequences (6 bits).
- FIG. 5 (a) is a diagram showing the major axis length distribution of the verification sample particle
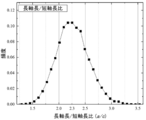
- FIG. 5 (b) is a diagram showing the major axis length / minor axis length ratio distribution of the verification sample particle. .
- the 3D parameter of the sample particle for verification is originally a matter to be estimated by the 3D parameter estimation device as the 3D parameter of the discrete object to be estimated.
- the 3D parameter estimation is here In order to verify the estimation result by the device, it is prepared in advance.
- the 3D parameter of the verification sample particle is a "true value", and in the present verification, only the information of the "true value” and the 2D parameter of the verification sample particle is input and output.
- the “estimated value” by the 3D parameter estimation device is compared to evaluate the effectiveness of the 3D parameter estimation device.
- the information on the 2D parameter of the verification sample particle that is, the input frequency information, is obtained by acquiring the cross section of the verification sample particle at a random position and calculating based on the cross section.
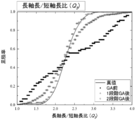
- FIGS. 6 (a) to 6 (e) The verification results are shown in FIGS. 6 (a) to 6 (e).
- FIG. 6 (a) is a diagram representing the verification result of the 3D parameter of the surface area (Q 1 ) as a cumulative distribution
- FIG. 6 (b) is a verification result of the 3D parameter of the volume (Q 2 )
- FIG. 6 (c) is a diagram showing the results of verification of 3D parameters of the long axis length (Q 3 ) as a cumulative distribution
- FIG. 6 (d) is a view showing the long axis It is a figure showing the verification result about 3D parameters of length / center axis length ratio (Q 4 ) expressed by cumulative distribution
- FIG.6 (e) is about 3D parameters of long axis length / short axis length ratio (Q 5 ) It is the figure which represented the verification result by cumulative distribution.
- “before GA” indicates the cumulative distribution of the 3D parameters of “reference value”
- “after one step GA” indicates the cumulative distribution of the 3D parameters of “estimated value” by the one step GA
- After two-stage GA indicates the cumulative distribution of the 3D parameters of the “estimated value” by the two-stage GA.
Landscapes
- Engineering & Computer Science (AREA)
- Business, Economics & Management (AREA)
- Human Resources & Organizations (AREA)
- Economics (AREA)
- Strategic Management (AREA)
- Marketing (AREA)
- Game Theory and Decision Science (AREA)
- Entrepreneurship & Innovation (AREA)
- Development Economics (AREA)
- Operations Research (AREA)
- Quality & Reliability (AREA)
- Tourism & Hospitality (AREA)
- Physics & Mathematics (AREA)
- General Business, Economics & Management (AREA)
- General Physics & Mathematics (AREA)
- Theoretical Computer Science (AREA)
- Management, Administration, Business Operations System, And Electronic Commerce (AREA)
- Information Retrieval, Db Structures And Fs Structures Therefor (AREA)
Abstract
【課題】あらゆる離散体を対象とし、種々の指標で特定される2Dパラメータから種々の指標の3Dパラメータを推定する。 【解決手段】3Dパラメータ推定装置1は、1つの離散体の2Dパラメータをクラス分けしたときの前記クラス毎の頻度情報に基づく登録2D頻度情報と前記頻度情報が前記登録2D頻度情報であるときの前記離散体の3Dパラメータを持つ登録3Dパラメータ情報とで一対の変換情報をなす変換情報の群が記憶される2D-3D変換情報データベース31と、被推定対象の入力頻度情報を入力として、前記入力頻度情報と前記登録2D頻度情報に基づく対比情報との差分を評価することで、前記入力頻度情報と前記2D-3D変換情報を関連付け、関連付けられた前記2D-3D変換情報の前記登録3Dパラメータ情報に基づき前記被推定対象の前記3Dパラメータを推定する3Dパラメータ推定手段32とを有する。
Description
本発明は、粒子等の離散体が有する2Dパラメータから3Dパラメータを推定する3Dパラメータ推定装置、3Dパラメータ推定プログラム及び3Dパラメータ推定方法に関する。
製造業における各種材料・合金の結晶・内部構造分析や空隙分析、医療業における生体細胞分析、食品業の空隙分析、地学・選鉱学における岩石や鉱石の内部構造分析、地球・惑星科学における岩石等の航空・衛星写真分析等の様々な分野において、離散体に対し、体積、表面積などの形状を指標する3D(3次元)パラメータを把握する技術が求められている。前記3Dパラメータを直接的に測定することが一つの解決手段であるが、実務上、このような3D測定は、技術的な困難性を伴う場合や、労力、コスト等の面から現実的でない場合があり、これらの場合では、断面積などの2D(2次元)パラメータに対する2D測定で代替せざるを得ない。
しかしながら、前記2D測定の実測値から前記3Dパラメータを正しく予測することには、困難性を伴う。
例えば、1つの粒子の断面は、図1(a)に示すように切断位置によって様々な形となる。したがって、前記2D測定の測定値がバラつきを持つ頻度分布で表され、前記3Dパラメータの真値を1つに定めることが困難な状況となる。また、多数の粒子からなる粒子群を対象として、前記粒子の前記3Dパラメータの真値の頻度分布を取得しようとすると、図1(b)に示すように、図1(a)に示した個々の前記粒子における前記2D測定の測定値のバラつきが複合的に作用するため、前記2D測定の測定値から前記3Dパラメータの真値の頻度分布を1つに定めることが困難な状況となる。
なお、図1(a)は、1つの粒子を対象として、2D測定の測定値から3Dパラメータの真値を1つに定めることが困難な状況となることを説明するための説明図であり、図1(b)は、粒子群を対象として、2D測定の測定値から3Dパラメータの真値の頻度分布を1つに定めることが困難な状況となることを説明するための説明図である。また、これらの図中に示すグラフは、縦軸が頻度を表し、横軸が体積、面積等の指標を表している。
しかしながら、前記2D測定の実測値から前記3Dパラメータを正しく予測することには、困難性を伴う。
例えば、1つの粒子の断面は、図1(a)に示すように切断位置によって様々な形となる。したがって、前記2D測定の測定値がバラつきを持つ頻度分布で表され、前記3Dパラメータの真値を1つに定めることが困難な状況となる。また、多数の粒子からなる粒子群を対象として、前記粒子の前記3Dパラメータの真値の頻度分布を取得しようとすると、図1(b)に示すように、図1(a)に示した個々の前記粒子における前記2D測定の測定値のバラつきが複合的に作用するため、前記2D測定の測定値から前記3Dパラメータの真値の頻度分布を1つに定めることが困難な状況となる。
なお、図1(a)は、1つの粒子を対象として、2D測定の測定値から3Dパラメータの真値を1つに定めることが困難な状況となることを説明するための説明図であり、図1(b)は、粒子群を対象として、2D測定の測定値から3Dパラメータの真値の頻度分布を1つに定めることが困難な状況となることを説明するための説明図である。また、これらの図中に示すグラフは、縦軸が頻度を表し、横軸が体積、面積等の指標を表している。
前記2D測定の測定値から前記3Dパラメータを推定する手法としては、球形粒子の2Dサイズ分布の測定結果から、幾何確率的に計算した変換表を用いて、3Dサイズ分布を推定する手法が提案されている(非特許文献1参照)。この提案では、粒子の形状が均一(球形)でサイズが分布を持つ粒子群を対象とした前記3Dサイズ分布の推定が行われる。
また、この変換表を用いた提案について、前記球形粒子に代えて、全粒子が均一な回転楕円体形状を持つ粒子群を対象とした改良手法も提案されている(非特許文献2参照)。この改良手法では、粒子の形状が均一(回転楕円体)でサイズが分布を持つ粒子群を対象とした前記3Dサイズ分布の推定が行われる。
また、アスペクト比(長軸長と短軸長の比)が異なる回転楕円体形状を持ち、サイズが分布を持つ粒子群を対象として、幾何学的に計算した2D断面のアスペクト比分布及び長軸長と3Dのアスペクト比及び長軸長の関係式を用いて、計測した2D断面のアスペクト比分布及び長軸長から3Dのアスペクト比及び長軸長を推定する手法が提案されている(非特許文献3参照)。この提案では、粒子の形状が規則的な回転楕円体形状が被推定対象とされる。
また、2Dの粒子断面形状をフーリエ級数を用いた形状指標でフィッティングして、前記形状指標を基に3Dのモデル粒子を作成することで3D形状を推定する手法が提案されている(非特許文献4参照)。この3D形状の推定手法では、前記粒子の形状及びサイズが均一で、粒子断面が前記粒子の中心点を通る断面であることを前提として、前記3D形状の推定が行われる。
また、この変換表を用いた提案について、前記球形粒子に代えて、全粒子が均一な回転楕円体形状を持つ粒子群を対象とした改良手法も提案されている(非特許文献2参照)。この改良手法では、粒子の形状が均一(回転楕円体)でサイズが分布を持つ粒子群を対象とした前記3Dサイズ分布の推定が行われる。
また、アスペクト比(長軸長と短軸長の比)が異なる回転楕円体形状を持ち、サイズが分布を持つ粒子群を対象として、幾何学的に計算した2D断面のアスペクト比分布及び長軸長と3Dのアスペクト比及び長軸長の関係式を用いて、計測した2D断面のアスペクト比分布及び長軸長から3Dのアスペクト比及び長軸長を推定する手法が提案されている(非特許文献3参照)。この提案では、粒子の形状が規則的な回転楕円体形状が被推定対象とされる。
また、2Dの粒子断面形状をフーリエ級数を用いた形状指標でフィッティングして、前記形状指標を基に3Dのモデル粒子を作成することで3D形状を推定する手法が提案されている(非特許文献4参照)。この3D形状の推定手法では、前記粒子の形状及びサイズが均一で、粒子断面が前記粒子の中心点を通る断面であることを前提として、前記3D形状の推定が行われる。
これら従来の提案では、形状が簡単な数式で表現可能な規則的な形状を持つ粒子が対象とされ、また、前記2Dパラメータも所定の指標で特定可能であることが前提とされる。
しかしながら、前記3Dパラメータの推定は、様々な場面で求められ、このような前提を満たす場面は、むしろ希であるといえ、多くの場面において、前記粒子の前記3Dパラメータを推定することができない問題がある。加えて、推定される前記3Dパラメータも特定の指標に限られ、ユーザが求めに応じて、任意に選択することができない問題がある。
形状(及びサイズ)が不均一である歪な粒子を含む、あらゆる離散体を対象とすることができ、前記2Dパラメータも取扱い易い指標を選択して特定可能で、かつ、任意の前記3Dパラメータを選択して推定可能であれば、ユーザにとって最良の3Dパラメータ推定ツールとなり得る。
しかしながら、前記3Dパラメータの推定は、様々な場面で求められ、このような前提を満たす場面は、むしろ希であるといえ、多くの場面において、前記粒子の前記3Dパラメータを推定することができない問題がある。加えて、推定される前記3Dパラメータも特定の指標に限られ、ユーザが求めに応じて、任意に選択することができない問題がある。
形状(及びサイズ)が不均一である歪な粒子を含む、あらゆる離散体を対象とすることができ、前記2Dパラメータも取扱い易い指標を選択して特定可能で、かつ、任意の前記3Dパラメータを選択して推定可能であれば、ユーザにとって最良の3Dパラメータ推定ツールとなり得る。
J.C. Russ, Practical Stereology, Plenum Press, New York, 1986.
R.T. DeHoff, The determination of the size distribution of ellipsoidal particles from measurements made on random plane sections, Trans. Metall. Soc. AIME. 224 (1962) 474-477.
V. Benes, M. Jiruse, and M. Slamova, "Stereological unfolding of the trivariate size-shape-orientation distribution of spheroidal particles with application," Acta Mater., vol. 45, no. 3, pp. 1105-1113, 1997.
A. Hobolth and E. B. V. Jensen, "Stereological Analysis of Shape," Image Anal Stereol, vol. 21, pp. 23-29, 2002.
本発明は、従来技術における前記諸問題を解決し、あらゆる離散体を対象とし、種々の指標で特定される2Dパラメータから種々の指標の3Dパラメータを推定可能な3Dパラメータ推定装置、3Dパラメータ推定プログラム及び3Dパラメータ推定方法を提供することを課題とする。
前記課題を解決するための手段としては、以下の通りである。即ち、
<1> 1つの離散体の2次元的特徴を指標する2Dパラメータを値に応じてクラス分けしたときの前記クラス毎の頻度情報に基づく登録2D頻度情報と前記頻度情報が前記登録2D頻度情報であるときの前記離散体の3次元的特徴を指標する3Dパラメータの値情報を持つ登録3Dパラメータ情報とで一対の変換情報をなす2D-3D変換情報の群が記憶される2D-3D変換情報データベースと、1つ又は複数の前記離散体を被推定対象とし、前記被推定対象について測定された前記2Dパラメータの測定値の情報が前記クラス毎の頻度の形式で表された入力頻度情報を入力として、同種類の前記2Dパラメータについて前記入力頻度情報と前記登録2D頻度情報に基づく対比情報との差分を評価することで、前記入力頻度情報と前記2D-3D変換情報とを関連付け、関連付けられた前記2D-3D変換情報の前記登録3Dパラメータ情報に基づき前記被推定対象の前記3Dパラメータを推定可能とされる3Dパラメータ推定手段と、を有することを特徴とする3Dパラメータ推定装置。
<2> 入力頻度情報が、複数の離散体を被推定対象の集合体とし、2Dパラメータの各測定値に応じて前記各離散体をクラス分けしたときの前記集合体における前記離散体の前記クラス毎の存在割合に基づく集合体頻度情報とされ、対比情報が、前記集合体頻度情報と同種類の前記2Dパラメータについて個々の2D-3D変換情報が持つ登録2D頻度情報を複数の前記2D-3D変換情報を対象として積算した推定頻度情報に基づく情報とされる前記<1>に記載の3Dパラメータ推定装置。
<3> 3Dパラメータ推定手段が、集合体を構成する離散体の頻度情報と対応する登録2D頻度情報を持つ前記2D-3D変換情報が2D-3D変換情報データベース中に存在する存在割合を評価する前記2D-3D変換情報毎の評価値に基づいて入力頻度情報と対比情報との差分を評価する目的関数を用い、前記目的関数の値が最大又は最小となる条件での前記評価値を最適値として前記目的関数を解き、前記最適値を前記集合体に対して前記2D-3D変換情報が適用される適用割合として、前記適用割合に応じて前記入力頻度情報と前記2D-3D変換情報とを関連付けるように構成とされる前記<2>に記載の3Dパラメータ推定装置。
<4> 2D-3D変換情報データベースが、離散体に基づき作成される2D-3D変換情報の一次群と、前記離散体と相似形で大きさが異なるとともに、1つの前記離散体に対し複数設定される前記離散体のサイズ変更体に基づき作成される前記2D-3D変換情報の2次群とを記録して構成され、3Dパラメータ推定手段が、前記一次群を対象として目的関数を解くことで最適値を与える暫定解としての一次解を算出する一次解算出処理と、前記一次解に基づき、前記二次群を対象として前記目的関数を解くことで前記最適値を与える最適解としての二次解を算出する二次解算出処理とを実行可能とされる前記<3>に記載の3Dパラメータ装置。
<5> 目的関数の最適解が遺伝アルゴリズム解析により算出可能とされる前記<3>から<4>のいずれかに記載の3Dパラメータ推定装置。
<6> 1つの2D-3D変換情報が、種類の異なる2Dパラメータに基づく複数の登録2D頻度情報を有し、3Dパラメータ推定手段が、複数の前記登録2D頻度情報のうち入力頻度情報と同種類の前記2Dパラメータに基づく前記登録2D頻度情報を対象として、被推定対象の3Dパラメータを推定可能とされる前記<1>から<5>のいずれかに記載の3Dパラメータ推定装置。
<7> 1つの2D-3D変換情報が、種類の異なる3Dパラメータに基づく複数の登録3Dパラメータ情報を有し、3Dパラメータ推定手段が、前記2D-3D変換情報が有する複数の前記登録3Dパラメータ情報と同種類の被推定対象の前記3Dパラメータを同時に推定可能とされる前記<1>から<6>のいずれかに記載の3Dパラメータ推定装置。
<8> コンピュータを前記<1>から<7>のいずれかに記載の3Dパラメータ推定装置として機能させることを特徴とする3Dパラメータ推定プログラム。
<9> 1つの離散体の2次元的特徴を指標する2Dパラメータを値に応じてクラス分けしたときの前記クラス毎の頻度情報に基づく登録2D頻度情報と前記頻度情報が前記登録2D頻度情報であるときの前記離散体の3次元的特徴を指標する3Dパラメータの値情報を持つ登録3Dパラメータ情報とで一対の変換情報をなす2D-3D変換情報の群が記憶される2D-3D変換情報データベースに対し、1つ又は複数の前記離散体を被推定対象とし、前記被推定対象について測定された前記2Dパラメータの測定値の情報が前記クラス毎の頻度の形式で表された入力頻度情報を入力として、同種類の前記2Dパラメータについて前記入力頻度情報と前記登録2D頻度情報に基づく対比情報との差分を評価することで、前記入力頻度情報と前記2D-3D変換情報とを関連付け、関連付けられた前記2D-3D変換情報の前記登録3Dパラメータ情報に基づき前記被推定対象の前記3Dパラメータを推定する3Dパラメータ推定工程を実施することを特徴とする3Dパラメータ推定方法。
<1> 1つの離散体の2次元的特徴を指標する2Dパラメータを値に応じてクラス分けしたときの前記クラス毎の頻度情報に基づく登録2D頻度情報と前記頻度情報が前記登録2D頻度情報であるときの前記離散体の3次元的特徴を指標する3Dパラメータの値情報を持つ登録3Dパラメータ情報とで一対の変換情報をなす2D-3D変換情報の群が記憶される2D-3D変換情報データベースと、1つ又は複数の前記離散体を被推定対象とし、前記被推定対象について測定された前記2Dパラメータの測定値の情報が前記クラス毎の頻度の形式で表された入力頻度情報を入力として、同種類の前記2Dパラメータについて前記入力頻度情報と前記登録2D頻度情報に基づく対比情報との差分を評価することで、前記入力頻度情報と前記2D-3D変換情報とを関連付け、関連付けられた前記2D-3D変換情報の前記登録3Dパラメータ情報に基づき前記被推定対象の前記3Dパラメータを推定可能とされる3Dパラメータ推定手段と、を有することを特徴とする3Dパラメータ推定装置。
<2> 入力頻度情報が、複数の離散体を被推定対象の集合体とし、2Dパラメータの各測定値に応じて前記各離散体をクラス分けしたときの前記集合体における前記離散体の前記クラス毎の存在割合に基づく集合体頻度情報とされ、対比情報が、前記集合体頻度情報と同種類の前記2Dパラメータについて個々の2D-3D変換情報が持つ登録2D頻度情報を複数の前記2D-3D変換情報を対象として積算した推定頻度情報に基づく情報とされる前記<1>に記載の3Dパラメータ推定装置。
<3> 3Dパラメータ推定手段が、集合体を構成する離散体の頻度情報と対応する登録2D頻度情報を持つ前記2D-3D変換情報が2D-3D変換情報データベース中に存在する存在割合を評価する前記2D-3D変換情報毎の評価値に基づいて入力頻度情報と対比情報との差分を評価する目的関数を用い、前記目的関数の値が最大又は最小となる条件での前記評価値を最適値として前記目的関数を解き、前記最適値を前記集合体に対して前記2D-3D変換情報が適用される適用割合として、前記適用割合に応じて前記入力頻度情報と前記2D-3D変換情報とを関連付けるように構成とされる前記<2>に記載の3Dパラメータ推定装置。
<4> 2D-3D変換情報データベースが、離散体に基づき作成される2D-3D変換情報の一次群と、前記離散体と相似形で大きさが異なるとともに、1つの前記離散体に対し複数設定される前記離散体のサイズ変更体に基づき作成される前記2D-3D変換情報の2次群とを記録して構成され、3Dパラメータ推定手段が、前記一次群を対象として目的関数を解くことで最適値を与える暫定解としての一次解を算出する一次解算出処理と、前記一次解に基づき、前記二次群を対象として前記目的関数を解くことで前記最適値を与える最適解としての二次解を算出する二次解算出処理とを実行可能とされる前記<3>に記載の3Dパラメータ装置。
<5> 目的関数の最適解が遺伝アルゴリズム解析により算出可能とされる前記<3>から<4>のいずれかに記載の3Dパラメータ推定装置。
<6> 1つの2D-3D変換情報が、種類の異なる2Dパラメータに基づく複数の登録2D頻度情報を有し、3Dパラメータ推定手段が、複数の前記登録2D頻度情報のうち入力頻度情報と同種類の前記2Dパラメータに基づく前記登録2D頻度情報を対象として、被推定対象の3Dパラメータを推定可能とされる前記<1>から<5>のいずれかに記載の3Dパラメータ推定装置。
<7> 1つの2D-3D変換情報が、種類の異なる3Dパラメータに基づく複数の登録3Dパラメータ情報を有し、3Dパラメータ推定手段が、前記2D-3D変換情報が有する複数の前記登録3Dパラメータ情報と同種類の被推定対象の前記3Dパラメータを同時に推定可能とされる前記<1>から<6>のいずれかに記載の3Dパラメータ推定装置。
<8> コンピュータを前記<1>から<7>のいずれかに記載の3Dパラメータ推定装置として機能させることを特徴とする3Dパラメータ推定プログラム。
<9> 1つの離散体の2次元的特徴を指標する2Dパラメータを値に応じてクラス分けしたときの前記クラス毎の頻度情報に基づく登録2D頻度情報と前記頻度情報が前記登録2D頻度情報であるときの前記離散体の3次元的特徴を指標する3Dパラメータの値情報を持つ登録3Dパラメータ情報とで一対の変換情報をなす2D-3D変換情報の群が記憶される2D-3D変換情報データベースに対し、1つ又は複数の前記離散体を被推定対象とし、前記被推定対象について測定された前記2Dパラメータの測定値の情報が前記クラス毎の頻度の形式で表された入力頻度情報を入力として、同種類の前記2Dパラメータについて前記入力頻度情報と前記登録2D頻度情報に基づく対比情報との差分を評価することで、前記入力頻度情報と前記2D-3D変換情報とを関連付け、関連付けられた前記2D-3D変換情報の前記登録3Dパラメータ情報に基づき前記被推定対象の前記3Dパラメータを推定する3Dパラメータ推定工程を実施することを特徴とする3Dパラメータ推定方法。
本発明によれば、従来技術における前記諸問題を解決することができ、あらゆる離散体を対象とし、種々の指標で特定される2Dパラメータから種々の指標の3Dパラメータを推定可能な3Dパラメータ推定装置、3Dパラメータ推定プログラム及び3Dパラメータ推定方法を提供することができる。
(3Dパラメータ推定装置)
本発明の3Dパラメータ推定装置の構成例を図2に基づき説明する。なお、図2は、3Dパラメータ推定装置の構成例を示すブロック図である。
本発明の3Dパラメータ推定装置の構成例を図2に基づき説明する。なお、図2は、3Dパラメータ推定装置の構成例を示すブロック図である。
3Dパラメータ推定装置1は、図2に示すように、入力部2、記憶部3、演算部4、出力部5を備える。
入力部2は、キー入力、タッチ入力、データ読取部等の公知の情報入力手段により構成され、入力情報を演算部4に出力可能とされる。
記憶部3は、RAM(Random Access Memory)、ROM(Read Only Memory)等の公知のメモリにより構成され、2D-3D変換情報データベース31及び3Dパラメータ推定手段(プログラム)32を記憶するとともに、演算部4の作業領域としても機能可能とされる。
演算部4は、CPU(Central Processing Unit)等の公知の演算手段により構成され、入力される指示に基づき、所定のプログラムに規定された処理を実行可能とされるとともに、各部へ指示を行い、3Dパラメータ推定装置1を統括的に制御可能とされる。
具体的には、演算部4では、入力部2から入力されるデータや指示に基づき、記憶部3から所定のプログラムを読出し、処理を実行する。また、演算部4では、処理結果を記憶部3に保存させるとともに出力部5に出力させる。
具体的には、演算部4では、入力部2から入力されるデータや指示に基づき、記憶部3から所定のプログラムを読出し、処理を実行する。また、演算部4では、処理結果を記憶部3に保存させるとともに出力部5に出力させる。
<2D-3D変換情報データベース>
2D-3D変換情報データベース31は、1つの離散体の2次元的特徴を指標する2Dパラメータを値に応じてクラス分けしたときの前記クラス毎の頻度情報に基づく登録2D頻度情報と前記頻度情報が前記登録2D頻度情報であるときの前記離散体の3次元的特徴を指標する3Dパラメータの値情報を持つ登録3Dパラメータ情報とで一対の変換情報をなす2D-3D変換情報の群が記憶されて構成される。
2D-3D変換情報データベース31は、1つの離散体の2次元的特徴を指標する2Dパラメータを値に応じてクラス分けしたときの前記クラス毎の頻度情報に基づく登録2D頻度情報と前記頻度情報が前記登録2D頻度情報であるときの前記離散体の3次元的特徴を指標する3Dパラメータの値情報を持つ登録3Dパラメータ情報とで一対の変換情報をなす2D-3D変換情報の群が記憶されて構成される。
前記離散体は、自身と外部との空間を区別して識別できるものを意味する。例えば、粒子、塊状物、結晶、細胞、空隙、気泡等が挙げられる。また、前記離散体としては、球形や楕円体形等の形状が単純形状であるもののほか、歪な形状のものを含む。また、複数の前記離散体を被推定対象とする場合に、これら前記離散体の形状が、均一であっても、不均一であってもよい。
前記2Dパラメータ及び前記3Dパラメータとしては、特に制限はなく、目的に応じて適宜選択することができる。
前記2Dパラメータ及び前記3Dパラメータの選択肢としては、様々なものがあるため、以下では、一部の例示として、形状に関する単一物理量の大きさにより与えられる指標、軸長比により与えられる指標、形状を基準として与えられる指標、フラクタル次元の算出により与えられる指標、前記フーリエ係数又は前記フーリエ係数を用いた指標及びその他の指標についての説明を行う。
前記2Dパラメータ及び前記3Dパラメータの選択肢としては、様々なものがあるため、以下では、一部の例示として、形状に関する単一物理量の大きさにより与えられる指標、軸長比により与えられる指標、形状を基準として与えられる指標、フラクタル次元の算出により与えられる指標、前記フーリエ係数又は前記フーリエ係数を用いた指標及びその他の指標についての説明を行う。
前記形状に関する単一物理量の大きさにより与えられる指標としては、前記2Dパラメータと前記3Dパラメータとで、例えば、次の指標が挙げられる。
・2Dパラメータ
等面積円径として、前記離散体の断面又は投影図(以下、単に「断面等」)の面積と等しい円の直径が挙げられる。前記離散体の形状が円以外の形状に近い場合は、円に代えて楕円、長方形、多角形等を用い、それぞれの代表長さとすることもできる。
Feret径として、前記断面等を挟む2つの平行な直線間の距離が挙げられる。最大のFeret径を長軸、長軸と直交するFeret径を短軸とする。各軸の長さをそれぞれ長軸長(a)、短軸長(c)とする。
慣性行列の固有値として、前記断面等のデジタルデータを解析する際に主に用いられ、前記断面等に僅かな厚みを与えた3次元データについて、前記離散体の2次中心モーメントによって構成される慣性行列の1番目及び2番目に大きい固有値をそれぞれ、長軸長(a’)、短軸長(c’)とするものが挙げられる。
前記断面等の面積が挙げられる。
等面積円径として、前記離散体の断面又は投影図(以下、単に「断面等」)の面積と等しい円の直径が挙げられる。前記離散体の形状が円以外の形状に近い場合は、円に代えて楕円、長方形、多角形等を用い、それぞれの代表長さとすることもできる。
Feret径として、前記断面等を挟む2つの平行な直線間の距離が挙げられる。最大のFeret径を長軸、長軸と直交するFeret径を短軸とする。各軸の長さをそれぞれ長軸長(a)、短軸長(c)とする。
慣性行列の固有値として、前記断面等のデジタルデータを解析する際に主に用いられ、前記断面等に僅かな厚みを与えた3次元データについて、前記離散体の2次中心モーメントによって構成される慣性行列の1番目及び2番目に大きい固有値をそれぞれ、長軸長(a’)、短軸長(c’)とするものが挙げられる。
前記断面等の面積が挙げられる。
・3Dパラメータ
等体積球径として、前記離散体の体積と等しい球の直径が挙げられる。前記離散体の形状が球以外の形状に近い場合は、球に代えて、楕円体、直方体、多角形体、円筒体等を用い、それぞれの代表長さとすることもできる。
Calliper径として、前記離散体を挟む2つの平行な平面間の距離が挙げられる。最大のCalliper径を長軸、長軸と直交する中で最小のCalliper径を短軸、長軸及び短軸と直交する軸を中軸とする。各軸の長さをそれぞれ、長軸長(a)、中軸長(b)、短軸長(c)とする。
慣性行列の固有値が挙げられる。この指標は、前記離散体のデジタルデータを解析する際に主に用いられ、前記離散体の2次中心モーメントによって構成される慣性行列の1番目、2番目及び3番目に大きい固有値をそれぞれ、長軸長(a’)、中軸長(b’)、短軸長(c’)とする。
表面積が挙げられる。
体積が挙げられる。
なお、以下の指標では、先のa,b,cをa’,b’,c’と置き換えて表すこと、逆に、先のa’,b’,c’をa,b,cと置き換えて表すこともできる。
等体積球径として、前記離散体の体積と等しい球の直径が挙げられる。前記離散体の形状が球以外の形状に近い場合は、球に代えて、楕円体、直方体、多角形体、円筒体等を用い、それぞれの代表長さとすることもできる。
Calliper径として、前記離散体を挟む2つの平行な平面間の距離が挙げられる。最大のCalliper径を長軸、長軸と直交する中で最小のCalliper径を短軸、長軸及び短軸と直交する軸を中軸とする。各軸の長さをそれぞれ、長軸長(a)、中軸長(b)、短軸長(c)とする。
慣性行列の固有値が挙げられる。この指標は、前記離散体のデジタルデータを解析する際に主に用いられ、前記離散体の2次中心モーメントによって構成される慣性行列の1番目、2番目及び3番目に大きい固有値をそれぞれ、長軸長(a’)、中軸長(b’)、短軸長(c’)とする。
表面積が挙げられる。
体積が挙げられる。
なお、以下の指標では、先のa,b,cをa’,b’,c’と置き換えて表すこと、逆に、先のa’,b’,c’をa,b,cと置き換えて表すこともできる。
前記軸長比により与えられる指標としては、前記2Dパラメータと前記3Dパラメータとで、例えば、次の指標を挙げることができる。
・2Dパラメータ
長軸長/短軸長比として、a/cが挙げられる。
異方性指標として、a/cの正の平方根が挙げられる。
長軸長/短軸長比として、a/cが挙げられる。
異方性指標として、a/cの正の平方根が挙げられる。
・3Dパラメータ
長軸長/短軸長比として、a/cが挙げられる。
長軸長/中軸長比として、a/bが挙げられる。
中軸長/短軸長比として、b/cが挙げられる。
Ziggの指標として、ac/b2が挙げられる。
体積空間充足率として、abc/Vが挙げられる。ただし、Vは、前記離散体の体積を示す。
Schulzの指標として、na2b-100が挙げられる。ただし、nは、100/Vを示す。
長軸長/短軸長比として、a/cが挙げられる。
長軸長/中軸長比として、a/bが挙げられる。
中軸長/短軸長比として、b/cが挙げられる。
Ziggの指標として、ac/b2が挙げられる。
体積空間充足率として、abc/Vが挙げられる。ただし、Vは、前記離散体の体積を示す。
Schulzの指標として、na2b-100が挙げられる。ただし、nは、100/Vを示す。
前記形状を基準として与えられる指標としては、前記2Dパラメータと前記3Dパラメータとで、例えば、次の指標を挙げることができる。なお、この指標において、前記離散体の形状が球及び円以外の形状に近い場合は、球に代えて楕円体、直方体、多角形体、円筒体等を用い、円に代えて楕円、長方形、多角形等を用いた同様の概念での指標として使用することができる。
・2Dパラメータ
円形度(1)として、Lc/Lが挙げられる。ただし、Lcは、πDHを示し、DHは、4Aπの正の正方根を示し、Aは、前記離散体の前記断面等の面積を示し、Lは、前記離散体の周長を示す。
円形度(2)として、DR -/DLが挙げられる。ただし、DR -は、∫DR(θ)dθ/πを示し、DR(θ)は、前記離散体の二次元像輪郭を像の重心等を原点として極座標表示したときの前記離散体の直径を示し、θは、前記二次元像輪郭を像の重心等を原点として極座標表示したときの前記直径の角度を示し、DLは、L/πを示す。
円形度(3)として、DR -/DHが挙げられる。
円形度(4)として、DF -/DHが挙げられる。ただし、DF -は、∫DF(θ)dθ/πを示し、DFは、aと同義である。
円形度(5)として、DR -/DFが挙げられる。
表面指数として、a/φHL 2が挙げられる。ただし、φHLは、前記円形度(1)として、Lc/Lと同義である。
円形度(6)として、DR(θmax)/DR(θmax+π/2)が挙げられる。ただし、θmaxは、DR(θ)が最大となるときのθを示す。
丸み度として、Σρ/NRmaxが挙げられる。ただし、ρは、前記離散体の輪郭を円弧近似した局所的曲率半径を示し、Nは、前記離散体の近似円弧数を示し、Rmaxは、前記離散体の最大内接円半径を示す。
カサ指数として、A/A’が挙げられる。ただし、A’は、前記断面等の最小外接矩形面積を示す。
円形度(1)として、Lc/Lが挙げられる。ただし、Lcは、πDHを示し、DHは、4Aπの正の正方根を示し、Aは、前記離散体の前記断面等の面積を示し、Lは、前記離散体の周長を示す。
円形度(2)として、DR -/DLが挙げられる。ただし、DR -は、∫DR(θ)dθ/πを示し、DR(θ)は、前記離散体の二次元像輪郭を像の重心等を原点として極座標表示したときの前記離散体の直径を示し、θは、前記二次元像輪郭を像の重心等を原点として極座標表示したときの前記直径の角度を示し、DLは、L/πを示す。
円形度(3)として、DR -/DHが挙げられる。
円形度(4)として、DF -/DHが挙げられる。ただし、DF -は、∫DF(θ)dθ/πを示し、DFは、aと同義である。
円形度(5)として、DR -/DFが挙げられる。
表面指数として、a/φHL 2が挙げられる。ただし、φHLは、前記円形度(1)として、Lc/Lと同義である。
円形度(6)として、DR(θmax)/DR(θmax+π/2)が挙げられる。ただし、θmaxは、DR(θ)が最大となるときのθを示す。
丸み度として、Σρ/NRmaxが挙げられる。ただし、ρは、前記離散体の輪郭を円弧近似した局所的曲率半径を示し、Nは、前記離散体の近似円弧数を示し、Rmaxは、前記離散体の最大内接円半径を示す。
カサ指数として、A/A’が挙げられる。ただし、A’は、前記断面等の最小外接矩形面積を示す。
・3Dパラメータ
球形度として、SSP/Sが挙げられる。ただし、Sは、前記離散体の表面積を示し、SSPは、4π(6V/π)2/3を示す。
・Wadellの球形度として、DH/Dminが挙げられる。ただし、Dminは、前記離散体の投影像の最小外接円直径を示す。
球形度として、SSP/Sが挙げられる。ただし、Sは、前記離散体の表面積を示し、SSPは、4π(6V/π)2/3を示す。
・Wadellの球形度として、DH/Dminが挙げられる。ただし、Dminは、前記離散体の投影像の最小外接円直径を示す。
前記フラクタル次元の算出により与えられる指標は、前記断面等(2次元)又は前記離散体の表面(3次元)を、以下の方法で分割要素(線分、正方格子、面、立方格子)により近似し、前記分割要素を様々な大きさに変えた場合の前記分割要素の大きさと、前記離散体の周長(2次元)又は前記離散体の表面積(3次元)の大きさとを両対数グラフに取り、最小二乗法により求めた近似線の傾きから算出されるフラクタル次元に基づく。
前記フラクタル次元の算出方法としては、前記2Dパラメータと前記3Dパラメータとで、例えば、次の算出方法を挙げることができる。
前記フラクタル次元の算出方法としては、前記2Dパラメータと前記3Dパラメータとで、例えば、次の算出方法を挙げることができる。
・2Dパラメータ
前記断面等の外周を一定の長さの線分(前記分割要素)の集合で近似して、前記離散体の周長を計算することに基づく方法(Structured walk method)が挙げられる。
前記断面等の外周を正方格子(分割要素)の集合で近似して、前記離散体の周長を計算することに基づく方法(Grid counting method)が挙げられる。
前記断面等の外周を一定の長さの線分(前記分割要素)の集合で近似して、前記離散体の周長を計算することに基づく方法(Structured walk method)が挙げられる。
前記断面等の外周を正方格子(分割要素)の集合で近似して、前記離散体の周長を計算することに基づく方法(Grid counting method)が挙げられる。
・3Dパラメータ
前記離散体の表面を一定の面積の面(前記分割要素)の集合で近似して、前記離散体の表面積を計算することに基づく方法が挙げられる。
前記離散体の表面を立方格子(前記分割要素)の集合で近似して、前記離散体の表面積を計算することに基づく方法が挙げられる。
前記離散体の表面を一定の面積の面(前記分割要素)の集合で近似して、前記離散体の表面積を計算することに基づく方法が挙げられる。
前記離散体の表面を立方格子(前記分割要素)の集合で近似して、前記離散体の表面積を計算することに基づく方法が挙げられる。
前記フーリエ係数及び前記フーリエ係数を用いた指標としては、次の前記フーリエ係数におけるFを2次元又は3次元の関数とすることで、2次元及び3次元の形状指標として利用するものである。
・2Dパラメータ及び3Dパラメータ共通
フーリエ係数の関数として、Ck=∫Fexp(-jkθ)dθ/2πが挙げられる。ただし、jは、-1の正の平方根を示し、kは、1以上の整数を示し、Fは、動径関数、偏角関数及び動径ベクトルのいずれかを示す。
正規化フーリエ係数の関数として、Ak/A0が挙げられる。ただし、Akは、|Ck|に等しく、A0は、|C0|に等しい。
フーリエ係数の関数として、(DH/2A0)2が挙げられる。
k次指標の関数として、μk/A0 kが挙げられる。ただし、μkは、∫[r(θ)-A0]kdθ/2πを示し、r(θ)は、動径関数を示す。
フーリエ係数の関数として、Ck=∫Fexp(-jkθ)dθ/2πが挙げられる。ただし、jは、-1の正の平方根を示し、kは、1以上の整数を示し、Fは、動径関数、偏角関数及び動径ベクトルのいずれかを示す。
正規化フーリエ係数の関数として、Ak/A0が挙げられる。ただし、Akは、|Ck|に等しく、A0は、|C0|に等しい。
フーリエ係数の関数として、(DH/2A0)2が挙げられる。
k次指標の関数として、μk/A0 kが挙げられる。ただし、μkは、∫[r(θ)-A0]kdθ/2πを示し、r(θ)は、動径関数を示す。
前記その他の指標としては、前記2Dパラメータと前記3Dパラメータとで、例えば、次の指標を挙げることができる。
・2Dパラメータ
次式で表される円磨度が挙げられる。

ただし、分子は、前記離散体の全ての角(n個)に内接する円の半径の平均値を示し、分母は、前記離散体に内接する最大円の半径を示す。
角張度として、前記離散体の全ての角の角度を合計した値が挙げられる。
断面積/周長比として、A/L2が挙げられる。
凹凸係数として、4πA/L2が挙げられる。
バルキネスとして、4πR1R2/Aが挙げられる。ただし、R1は、a/Aの正の平方根を示し、R2は、c/Aの正の平方根を示す。
凹みの指数として、DF -/DLの正の平方根を示す。
展開径の変動係数として、∫[DR(θ)-DR -]2dθ/DR 2の正の平方根が挙げられる。
Feret径の変動係数として、∫[DF(θ)-DF -]2dθ/DF 2の正の平方根が挙げられる。
周長/面積比として、L/Aが挙げられる。
次式で表される円磨度が挙げられる。
角張度として、前記離散体の全ての角の角度を合計した値が挙げられる。
断面積/周長比として、A/L2が挙げられる。
凹凸係数として、4πA/L2が挙げられる。
バルキネスとして、4πR1R2/Aが挙げられる。ただし、R1は、a/Aの正の平方根を示し、R2は、c/Aの正の平方根を示す。
凹みの指数として、DF -/DLの正の平方根を示す。
展開径の変動係数として、∫[DR(θ)-DR -]2dθ/DR 2の正の平方根が挙げられる。
Feret径の変動係数として、∫[DF(θ)-DF -]2dθ/DF 2の正の平方根が挙げられる。
周長/面積比として、L/Aが挙げられる。
・3Dパラメータ
表面積形状係数として、S/DP 2が挙げられる。ただし、Sは、前記離散体の表面積を示し、DPは、前記等体積球径、前記Calliper径及び前記慣性行列の固有値として与えられる各種の粒径を示す。
体積形状係数として、V/DP 3が挙げられる。
比表面積形状係数として、(S/V)DPが挙げられる。
Carmanの形状係数として、6/φSVが挙げられる。ただし、φSVは、前記比表面積形状係数と同義である。
表面積形状係数として、S/DP 2が挙げられる。ただし、Sは、前記離散体の表面積を示し、DPは、前記等体積球径、前記Calliper径及び前記慣性行列の固有値として与えられる各種の粒径を示す。
体積形状係数として、V/DP 3が挙げられる。
比表面積形状係数として、(S/V)DPが挙げられる。
Carmanの形状係数として、6/φSVが挙げられる。ただし、φSVは、前記比表面積形状係数と同義である。
2D-3D変換情報データベース31では、前記2D-3D変換情報が前記2Dパラメータに基づく前記登録2D頻度情報と、前記3Dパラメータに基づく前記登録3Dパラメータ情報とで一対の変換情報をなすように構成される。
例えば、前記2Dパラメータとして前記断面等の面積を用い、前記登録2D頻度情報が前記断面等の面積の前記頻度情報であるとき、前記2D-3D変換情報は、前記登録2D頻度情報と、この頻度情報を持つ前記離散体の前記3Dパラメータの値である前記登録3Dパラメータとで一対の変換情報をなすように構成される。
この時、前記2Dパラメータとしては、任意性があり、取扱い易さの観点から、前記断面等の面積に代えて前記長軸長/短軸長比などの他の指標を用いることができる。
また、前記登録3Dパラメータとしても、ユーザが把握したい任意の指標を選択することができる。
例えば、前記2Dパラメータとして前記断面等の面積を用い、前記登録2D頻度情報が前記断面等の面積の前記頻度情報であるとき、前記2D-3D変換情報は、前記登録2D頻度情報と、この頻度情報を持つ前記離散体の前記3Dパラメータの値である前記登録3Dパラメータとで一対の変換情報をなすように構成される。
この時、前記2Dパラメータとしては、任意性があり、取扱い易さの観点から、前記断面等の面積に代えて前記長軸長/短軸長比などの他の指標を用いることができる。
また、前記登録3Dパラメータとしても、ユーザが把握したい任意の指標を選択することができる。
前記2Dパラメータとしては、種々の指標から選択することができるが、2D-3D変換情報データベース31としては、1つの前記2D-3D変換情報につき、種類の異なる前記2Dパラメータに基づく複数の前記登録2D頻度情報を有してもよい。つまり、1つの前記2D-3D変換情報としては、前記登録2D頻度情報の群を持ち、この群が登録3Dパラメータ情報(及びその群)と一対の変換情報をなすように構成されてもよい。
この場合、3Dパラメータ推定手段32としては、複数の登録2D頻度情報のうち入力頻度情報と同種類の前記2Dパラメータに基づく前記登録2D頻度情報を対象として、前記被推定対象の前記3Dパラメータを推定することができる。
したがって、2D-3D変換情報データベース31に複数の前記登録2D頻度情報に基づく前記2D-3D変換情報を登録しておけば、ユーザが種類の異なる前記2Dパラメータの中から任意の前記2Dパラメータを適宜選択して前記3Dパラメータの推定を行うことができる。
この場合、3Dパラメータ推定手段32としては、複数の登録2D頻度情報のうち入力頻度情報と同種類の前記2Dパラメータに基づく前記登録2D頻度情報を対象として、前記被推定対象の前記3Dパラメータを推定することができる。
したがって、2D-3D変換情報データベース31に複数の前記登録2D頻度情報に基づく前記2D-3D変換情報を登録しておけば、ユーザが種類の異なる前記2Dパラメータの中から任意の前記2Dパラメータを適宜選択して前記3Dパラメータの推定を行うことができる。
また、前記3Dパラメータとしては、種々の指標から選択することができるが、2D-3D変換情報データベース31としては、1つの前記2D-3D変換情報につき、種類の異なる前記3Dパラメータに基づく複数の前記登録3Dパラメータ情報を有してもよい。つまり、1つの前記2D-3D変換情報は、前記登録3Dパラメータ情報の群を持ち、この群が前記登録2Dパラメータ情報(及びその群)と一対の変換情報をなすように構成されてもよい。
この場合、3Dパラメータ推定手段32としては、前記2D-3D変換情報が有する複数の前記登録3Dパラメータ情報を同時に推定することができる。
したがって、2D-3D変換情報データベース31に複数の前記登録3Dパラメータ情報に基づく前記2D-3D変換情報を登録しておけば、ユーザの求めに応じて、種類の異なる複数の前記3Dパラメータを同時に推定することができる。
この場合、3Dパラメータ推定手段32としては、前記2D-3D変換情報が有する複数の前記登録3Dパラメータ情報を同時に推定することができる。
したがって、2D-3D変換情報データベース31に複数の前記登録3Dパラメータ情報に基づく前記2D-3D変換情報を登録しておけば、ユーザの求めに応じて、種類の異なる複数の前記3Dパラメータを同時に推定することができる。
前記2D-3D変換情報としては、前記離散体の前記2Dパラメータ及び前記3Dパラメータを実測定結果を基に作成してもよいし、前記離散体のモデル粒子をコンピュータ上で仮想的に作成し、このモデル粒子から電算される前記2Dパラメータ及び前記3Dパラメータを基に作成してもよい。
<3Dパラメータ推定手段>
3Dパラメータ推定手段32は、1つ又は複数の前記離散体を被推定対象とし、前記被推定対象について測定された前記2Dパラメータの測定値の情報が前記クラス毎の頻度の形式で表された入力頻度情報を入力として、同種類の前記2Dパラメータについて前記入力頻度情報と前記登録2D頻度情報に基づく対比情報との差分を評価することで、前記入力頻度情報と前記2D-3D変換情報とを関連付け、関連付けられた前記2D-3D変換情報の登録3Dパラメータ情報に基づき前記被推定対象の前記3Dパラメータを推定可能とされる。
3Dパラメータ推定手段32は、1つ又は複数の前記離散体を被推定対象とし、前記被推定対象について測定された前記2Dパラメータの測定値の情報が前記クラス毎の頻度の形式で表された入力頻度情報を入力として、同種類の前記2Dパラメータについて前記入力頻度情報と前記登録2D頻度情報に基づく対比情報との差分を評価することで、前記入力頻度情報と前記2D-3D変換情報とを関連付け、関連付けられた前記2D-3D変換情報の登録3Dパラメータ情報に基づき前記被推定対象の前記3Dパラメータを推定可能とされる。
前記3Dパラメータ推定手段としては、先ず、前記入力頻度情報として1つの前記離散体を被推定対象として前記被推定対象の前記離散体が有する前記頻度情報自体を用い、前記対比情報として前記登録2D頻度情報を用いて、1つの前記離散体についての前記3Dパラメータを推定する手段として構成することができる。
また、前記入力頻度情報として複数の前記離散体を前記被推定対象の集合体とし、前記2Dパラメータの各測定値に応じて前記各離散体をクラス分けしたときの前記集合体における前記離散体の前記クラス毎の存在割合に基づく集合体頻度情報を用い、前記対比情報として前記集合体頻度情報と同種類の前記2Dパラメータについて個々の前記2D-3D変換情報が持つ前記登録2D頻度情報を複数の前記2D-3D変換情報を対象として積算した推定頻度情報に基づく情報を用いて、前記集合体についての前記3Dパラメータを推定する手段として構成することができる。
後者では、多数の前記離散体を被推定対象とする場合に、前記離散体毎に入力及び解析結果(出力)の取扱いを行う必要がなく、また、1つの前記離散体について1つの前記2Dパラメータを測定し、前記集合体について1つの前記入力頻度情報を付与するため、前記離散体毎に前記頻度情報を取得する必要がなく、利便性に優れた前記3Dパラメータ推定装置とすることができる。
また、前記入力頻度情報として複数の前記離散体を前記被推定対象の集合体とし、前記2Dパラメータの各測定値に応じて前記各離散体をクラス分けしたときの前記集合体における前記離散体の前記クラス毎の存在割合に基づく集合体頻度情報を用い、前記対比情報として前記集合体頻度情報と同種類の前記2Dパラメータについて個々の前記2D-3D変換情報が持つ前記登録2D頻度情報を複数の前記2D-3D変換情報を対象として積算した推定頻度情報に基づく情報を用いて、前記集合体についての前記3Dパラメータを推定する手段として構成することができる。
後者では、多数の前記離散体を被推定対象とする場合に、前記離散体毎に入力及び解析結果(出力)の取扱いを行う必要がなく、また、1つの前記離散体について1つの前記2Dパラメータを測定し、前記集合体について1つの前記入力頻度情報を付与するため、前記離散体毎に前記頻度情報を取得する必要がなく、利便性に優れた前記3Dパラメータ推定装置とすることができる。
前記入力頻度情報と前記対比情報との関連付けの方法としては、特に制限はなく、目的に応じて適宜選択することができ、例えば、前記入力頻度情報と前記登録2D頻度情報に基づく前記対比情報とを対比し、一致するもの同士で関連付ける方法や、これらが一致しない場合に適当な近似値で関連付ける方法が挙げられる。
しかしながら、前者の処理では、一致しない場合に推定処理が行うことができないことから、膨大な量の前記2D-3D変換情報を2D-3D変換情報データベース31に登録する必要があること、また、後者の処理では、推定結果が不安定となり易いことから、次の目的関数を用いた評価により前記関連付け処理を行うことが好ましい。
しかしながら、前者の処理では、一致しない場合に推定処理が行うことができないことから、膨大な量の前記2D-3D変換情報を2D-3D変換情報データベース31に登録する必要があること、また、後者の処理では、推定結果が不安定となり易いことから、次の目的関数を用いた評価により前記関連付け処理を行うことが好ましい。
即ち、3Dパラメータ推定手段32が1つの前記離散体についての前記3Dパラメータを推定する手段として構成される場合、前記入力頻度情報としての前記頻度情報と前記対比情報としての前記登録2D頻度情報との差分を評価する前記目的関数を用い、前記目的関数に対し最大又は最小の値を与える前記登録2D頻度情報を持つ1つの前記2D-3D変換情報を最適解として前記目的関数を解くことで、前記入力頻度情報と前記2D-3D変換情報とを関連付けるように、3Dパラメータ推定手段32を構成することができる。
また、3Dパラメータ推定手段32が前記集合体についての前記3Dパラメータを推定する手段として構成される場合、前記集合体を構成する前記離散体の前記頻度情報と対応する前記登録2D頻度情報を持つ前記2D-3D変換情報が前記2D-3D変換情報データベース中に存在する存在割合を評価する前記2D-3D変換情報毎の評価値に基づいて前記入力頻度情報と前記対比情報との差分を評価する前記目的関数を用い、前記目的関数の値が最大又は最小となる条件での前記評価値を最適値として前記目的関数を解き、前記最適値を前記集合体に対して前記2D-3D変換情報が適用される適用割合として、前記適用割合に応じて前記入力頻度情報と前記2D-3D変換情報とを関連付けるように、3Dパラメータ推定手段32を構成することができる。
なお、前記目的関数としては、前記入力頻度情報と前記対比情報との差分を評価可能であれば特に制限はなく、適宜選択することができる。また、前記目的関数としては、前記評価値が極値を持つことで前記最適解又は前記最適値が定まればよく、前記評価値が最大の場合を前記最適解又は前記最適値と評価するものであっても、最小の場合を前記最適解又は前記最適値と評価するものであってもよい。
また、3Dパラメータ推定手段32が前記集合体についての前記3Dパラメータを推定する手段として構成される場合、前記集合体を構成する前記離散体の前記頻度情報と対応する前記登録2D頻度情報を持つ前記2D-3D変換情報が前記2D-3D変換情報データベース中に存在する存在割合を評価する前記2D-3D変換情報毎の評価値に基づいて前記入力頻度情報と前記対比情報との差分を評価する前記目的関数を用い、前記目的関数の値が最大又は最小となる条件での前記評価値を最適値として前記目的関数を解き、前記最適値を前記集合体に対して前記2D-3D変換情報が適用される適用割合として、前記適用割合に応じて前記入力頻度情報と前記2D-3D変換情報とを関連付けるように、3Dパラメータ推定手段32を構成することができる。
なお、前記目的関数としては、前記入力頻度情報と前記対比情報との差分を評価可能であれば特に制限はなく、適宜選択することができる。また、前記目的関数としては、前記評価値が極値を持つことで前記最適解又は前記最適値が定まればよく、前記評価値が最大の場合を前記最適解又は前記最適値と評価するものであっても、最小の場合を前記最適解又は前記最適値と評価するものであってもよい。
また、前記集合体に対し、高精度に前記3Dパラメータを推定する観点から、2D-3D変換情報データベース31が、前記離散体に基づき作成される前記2D-3D変換情報の一次群と、前記離散体と相似形で大きさが異なるとともに、1つの前記離散体に対し複数設定される前記離散体のサイズ変更体に基づき作成される前記2D-3D変換情報の2次群とを記録して構成され、3Dパラメータ推定手段32が、前記一次群を対象として前記目的関数を解くことで前記最適値を与える暫定解としての一次解を算出する一次解算出処理と、前記一次解に基づき、前記二次群を対象として前記目的関数を解くことで前記最適値を与える最適解としての二次解を算出する二次解算出処理と、を実行可能とされることが好ましい。ここで、前記サイズ変更体は、前記離散体の一種であるが、前記一次群に関する前記離散体との関係性から、任意の前記離散体と区別する意味で前記離散体と別名称で呼称される。
なお、この点については、後述の実施例において詳述する。
なお、この点については、後述の実施例において詳述する。
前記目的関数による前記最適解又は前記最適値の算出処理としては、特に制限はなく、目的に応じて適宜選択することができるが、中でも、高精度かつ高効率で解析を行う観点から、遺伝アルゴリズム解析が好ましい。
前記遺伝アルゴリズム解析とは、生物の遺伝機構と自然選択を模した最適化解析手法である(詳細につき下記参考文献参照)。
参考文献:Holland, J.H., 1975. Adaptation in Natural and Artificial Systems. Univ. of Michigan Press
参考文献:Holland, J.H., 1975. Adaptation in Natural and Artificial Systems. Univ. of Michigan Press
具体的には、問題の解を記号列である「遺伝子列(genotype)」として表現した「個体(individual)」の集合である「個体集合(population)」を用い、個体の優秀さを「目的関数(objective function)」を用いて実数値で表し、目的関数を一定規則の元に「適応度(fitness)」に変換し、適応度に応じて次世代に残す子の数を増減させる操作である「選択(selection)」、個体集合内の個体をランダムに2個ずつ組合わせて、ある確率(交叉率(pc))の下に2つの個体の遺伝子列を部分的に交換する操作である「交叉(crossover)」、及び、各個体についてある確率(突然変異率(pm))の下に各遺伝子列の遺伝子を他の対立遺伝子と入れ替える操作である「突然変異(mutation)」の3つの操作により次世代の個体集合を生成する操作を一定数の世代に渡って繰り返すことにより、最適解を探査する手法である。前記遺伝アルゴリズム解析のフローチャートを図3に示す。
前記遺伝アルゴリズム解析における遺伝子列の表現手法としては、特に制限はなく、例えば、以下に示すものが挙げられる。
バイナリ・コーディング(binary coding)、つまり、前記遺伝子列を実数の2進数又はN進数としてそのままコードする手法が挙げられる。
グレイ・コーディング(Gray coding)、つまり、前記遺伝子列にグレイ・コード(連続する2つの整数値がただ1ビットのみ異なるように割り当てられた数列)を用いる手法が挙げられる。
バイナリ・コーディング(binary coding)、つまり、前記遺伝子列を実数の2進数又はN進数としてそのままコードする手法が挙げられる。
グレイ・コーディング(Gray coding)、つまり、前記遺伝子列にグレイ・コード(連続する2つの整数値がただ1ビットのみ異なるように割り当てられた数列)を用いる手法が挙げられる。
前記遺伝アルゴリズム解析における選択の作用方法としては、特に制限はなく、例えば、以下に示すものが挙げられる。
ルーレット選択(roulette wheel selection)、つまり、個体iの適応度(Ai)と全個体の適応度の総和(B)とを計算し、選択後の個体集合に個体iがAi/Bの確率で含まれるようにする手法が挙げられる。なお、前記ルーレット選択としては、このように適応度に比例した確率を用いる「適応度比例選択」の他、適応度の1次式を確率とする「線形スケーリング」や、適応度に一定の係数をべき算する「べき乗スケーリング」としてもよい。
ランキング選択(ranking selection)、つまり、各個体を適応度によって順位付けし、あらかじめ定めた順位毎の確率に基づいて、選択後の個体集合を決める手法が挙げられる。
トーナメント選択(tournament selection)、つまり、個体集合から適当な数の個体をランダムに抽出し、その中から1つを選択する操作を一定回数繰り返す手法が挙げられる。
エリート戦略(elitism)、つまり、各世代の個体集合の中で最大の適応度を有する個体については、交叉や突然変異の対象とせず、無条件にそのまま次世代に残し、前記ルーレット選択、前記ランキング選択、前記トーナメント選択と併用して利用する手法が挙げられる。
ルーレット選択(roulette wheel selection)、つまり、個体iの適応度(Ai)と全個体の適応度の総和(B)とを計算し、選択後の個体集合に個体iがAi/Bの確率で含まれるようにする手法が挙げられる。なお、前記ルーレット選択としては、このように適応度に比例した確率を用いる「適応度比例選択」の他、適応度の1次式を確率とする「線形スケーリング」や、適応度に一定の係数をべき算する「べき乗スケーリング」としてもよい。
ランキング選択(ranking selection)、つまり、各個体を適応度によって順位付けし、あらかじめ定めた順位毎の確率に基づいて、選択後の個体集合を決める手法が挙げられる。
トーナメント選択(tournament selection)、つまり、個体集合から適当な数の個体をランダムに抽出し、その中から1つを選択する操作を一定回数繰り返す手法が挙げられる。
エリート戦略(elitism)、つまり、各世代の個体集合の中で最大の適応度を有する個体については、交叉や突然変異の対象とせず、無条件にそのまま次世代に残し、前記ルーレット選択、前記ランキング選択、前記トーナメント選択と併用して利用する手法が挙げられる。
前記遺伝アルゴリズム解析における交叉の作用方法としては、特に制限はなく、例えば、以下に示すものが挙げられる。
一点交叉(one-point crossover)又は単純交差(simple crossover)、つまり、遺伝子列の中で交叉点を1箇所選んで、交差点の前又は後ろの部分を入れ替える手法が挙げられる。
多点交叉又は複数点交叉(multi-point crossover)、つまり、遺伝子列の中で交叉点を複数箇所選んで、交叉点に挟まれた部分を入れ替える手法が挙げられる。
一様交叉(uniform crossover)、つまり、遺伝子列の各遺伝子に、どちらかの親の遺伝子をランダムに継承する手法が挙げられる。
一点交叉(one-point crossover)又は単純交差(simple crossover)、つまり、遺伝子列の中で交叉点を1箇所選んで、交差点の前又は後ろの部分を入れ替える手法が挙げられる。
多点交叉又は複数点交叉(multi-point crossover)、つまり、遺伝子列の中で交叉点を複数箇所選んで、交叉点に挟まれた部分を入れ替える手法が挙げられる。
一様交叉(uniform crossover)、つまり、遺伝子列の各遺伝子に、どちらかの親の遺伝子をランダムに継承する手法が挙げられる。
前記遺伝アルゴリズム解析の役割は、前記目的関数の評価を最適化することにある。
したがって、前記目的関数の前記最適解又は前記最適値の算出処理としては、このような役割を果たす最適化法であれば、好適に採用することができる。
なお、これらの最適化法を用いなくても、前記目的関数が取り得る全てのパターンを総当り的に解析すれば、前記最適解を見つけ出すことができるが、解析処理が煩雑になる。
前記遺伝アルゴリズム解析以外の前記最適化法の例を以下に示す。
したがって、前記目的関数の前記最適解又は前記最適値の算出処理としては、このような役割を果たす最適化法であれば、好適に採用することができる。
なお、これらの最適化法を用いなくても、前記目的関数が取り得る全てのパターンを総当り的に解析すれば、前記最適解を見つけ出すことができるが、解析処理が煩雑になる。
前記遺伝アルゴリズム解析以外の前記最適化法の例を以下に示す。
線形計画法、つまり、1次不等式又は等式で表される制約条件のもとで、1次関数を最大化又は最小化する手法が挙げられる。前記線形計画法の主たる解法としては、単体法(又はシンプレックス法)(simplex method)と内点法(interior point method)がある。
多スタート局所探索法(multi-start local search)、つまり、適当な方法で生成した初期解から近傍(前記初期解に少し変形を行うことで得られる解集合)の局所探査を繰り返し行って、局所最適解(近傍における最適解)を求める手法が挙げられる。
アニーリング法(simulated annealing)、つまり、適当な方法で生成した初期解から近傍を探査するが、その際に、一定の確率で改悪の方向へも遷移することで、広い領域の探査を行う手法が挙げられる。なお、前記確率は、最初は大きく、次第に小さな値になるように設定する。
タブー探索法(tabu search)、つまり、適当な方法で生成した初期解から近傍を探査するが、その際に、前に探索した解を再び選択しないようにする手法が挙げられる。
粒子群最適化法(particle swarm optimization)、つまり、複数の粒子(離散体)で構成された群が、過去の履歴に基づいて調整される速度に従って位置を変えていき、解空間を探索する手法が挙げられる。
進化型計算(evolutionary computation)又は進化的アルゴリズム(evolutionary algorithm)、つまり、生物進化を計算機上で模した最適化計算手法が挙げられる。主たるものに、遺伝的プログラミング(genetic programming)、進化プログラミング(evolutionary programming)、進化戦略(evolution strategy)がある。これらは、前記遺伝アルゴリズム解析と比較して、以下のような特徴を有する。
即ち、前記遺伝的プログラミングでは、前記遺伝アルゴリズム解析の拡張手法であり、木構造を用いた不定長な遺伝子表現を使用する。
また、前記進化プログラミングでは、前記遺伝アルゴリズム解析と同様の個体集合と選択を用いるが、個体の進化には突然変異を用いる。
また、前記進化戦略では、実数値をそのまま用いた個体集合を使用し、選択と突然変異により進化させる。
多スタート局所探索法(multi-start local search)、つまり、適当な方法で生成した初期解から近傍(前記初期解に少し変形を行うことで得られる解集合)の局所探査を繰り返し行って、局所最適解(近傍における最適解)を求める手法が挙げられる。
アニーリング法(simulated annealing)、つまり、適当な方法で生成した初期解から近傍を探査するが、その際に、一定の確率で改悪の方向へも遷移することで、広い領域の探査を行う手法が挙げられる。なお、前記確率は、最初は大きく、次第に小さな値になるように設定する。
タブー探索法(tabu search)、つまり、適当な方法で生成した初期解から近傍を探査するが、その際に、前に探索した解を再び選択しないようにする手法が挙げられる。
粒子群最適化法(particle swarm optimization)、つまり、複数の粒子(離散体)で構成された群が、過去の履歴に基づいて調整される速度に従って位置を変えていき、解空間を探索する手法が挙げられる。
進化型計算(evolutionary computation)又は進化的アルゴリズム(evolutionary algorithm)、つまり、生物進化を計算機上で模した最適化計算手法が挙げられる。主たるものに、遺伝的プログラミング(genetic programming)、進化プログラミング(evolutionary programming)、進化戦略(evolution strategy)がある。これらは、前記遺伝アルゴリズム解析と比較して、以下のような特徴を有する。
即ち、前記遺伝的プログラミングでは、前記遺伝アルゴリズム解析の拡張手法であり、木構造を用いた不定長な遺伝子表現を使用する。
また、前記進化プログラミングでは、前記遺伝アルゴリズム解析と同様の個体集合と選択を用いるが、個体の進化には突然変異を用いる。
また、前記進化戦略では、実数値をそのまま用いた個体集合を使用し、選択と突然変異により進化させる。
3Dパラメータ推定装置1では、前記2D登録頻度情報の設定方法を工夫することにより、前記離散体の向きの特性を表す配向に関する前記3Dパラメータを推定することもできる。
前記配向について円盤形状をした硬貨を例として説明する。多数の前記硬貨を無重力空間にばら撒き、ある一瞬を観測したと仮定すると、1つ1つの前記硬貨の向きが完全にランダムとなる。一方で、多数の前記硬貨を地上で一定サイズの容器に投入したとすると、多くの前記硬貨がその平面を垂直(鉛直)方向ないしそれに近い方向に向けて積み重ねられ、前記無重力空間での例と比べて、明らかに前記硬貨の向きに偏りが出る。
本明細書において「配向」とは、前記硬貨の向きの偏りの大きさ、つまり、前記離散体の向きの偏りの大きさを意味し、前記3Dパラメータの一種類として扱われる。この配向は、前記離散体が球体であれば発生しないが、非球体であれば発生し得る。
前記配向を前記3Dパラメータとして推定する場合は、大きさが異なる複数の配向を与えた状態で前記離散体の前記2D登録頻度情報を設定する。例えば、前記離散体の長軸の方向が垂直(鉛直)方向に対して0度、30度、60度、90度に向いた状態とされるときの前記離散体を水平方向から視た前記2Dパラメータの前記各頻度情報と、前記離散体の長軸の方向が垂直(鉛直)方向に対してランダムな方向を向いた状態とされるときの前記離散体を水平方向から視た前記2Dパラメータの前記頻度情報とで、合計5通りの前記2D登録頻度情報を設定する。それらを基にした前記2D-3D変換情報を用いた前記3Dパラメータ(配向以外)の推定を行えば、前記配向についても、0度、30度、60度、90度及びランダムとされる前記5通りのうち、どれが尤もらしいかを推定することができる。
前記配向を与えて前記2D登録頻度情報を設定する際に、前記2D登録頻度情報を設定する際の方向をより細かく設定すれば、より高精度に前記配向を推定することができる。また、全ての前記離散体の長軸方向に対し、同じ方向(例えば、全て垂直(鉛直)方向に対して30度傾斜させた方向)を与えてもよいし、バラつきを持たせて、異なる方向(例えば、垂直(鉛直)方向に対して平均で30度傾斜させた方向で、傾斜角度の標準偏差5度)を与えてもよい。
前記配向について円盤形状をした硬貨を例として説明する。多数の前記硬貨を無重力空間にばら撒き、ある一瞬を観測したと仮定すると、1つ1つの前記硬貨の向きが完全にランダムとなる。一方で、多数の前記硬貨を地上で一定サイズの容器に投入したとすると、多くの前記硬貨がその平面を垂直(鉛直)方向ないしそれに近い方向に向けて積み重ねられ、前記無重力空間での例と比べて、明らかに前記硬貨の向きに偏りが出る。
本明細書において「配向」とは、前記硬貨の向きの偏りの大きさ、つまり、前記離散体の向きの偏りの大きさを意味し、前記3Dパラメータの一種類として扱われる。この配向は、前記離散体が球体であれば発生しないが、非球体であれば発生し得る。
前記配向を前記3Dパラメータとして推定する場合は、大きさが異なる複数の配向を与えた状態で前記離散体の前記2D登録頻度情報を設定する。例えば、前記離散体の長軸の方向が垂直(鉛直)方向に対して0度、30度、60度、90度に向いた状態とされるときの前記離散体を水平方向から視た前記2Dパラメータの前記各頻度情報と、前記離散体の長軸の方向が垂直(鉛直)方向に対してランダムな方向を向いた状態とされるときの前記離散体を水平方向から視た前記2Dパラメータの前記頻度情報とで、合計5通りの前記2D登録頻度情報を設定する。それらを基にした前記2D-3D変換情報を用いた前記3Dパラメータ(配向以外)の推定を行えば、前記配向についても、0度、30度、60度、90度及びランダムとされる前記5通りのうち、どれが尤もらしいかを推定することができる。
前記配向を与えて前記2D登録頻度情報を設定する際に、前記2D登録頻度情報を設定する際の方向をより細かく設定すれば、より高精度に前記配向を推定することができる。また、全ての前記離散体の長軸方向に対し、同じ方向(例えば、全て垂直(鉛直)方向に対して30度傾斜させた方向)を与えてもよいし、バラつきを持たせて、異なる方向(例えば、垂直(鉛直)方向に対して平均で30度傾斜させた方向で、傾斜角度の標準偏差5度)を与えてもよい。
(3Dパラメータ推定プログラム)
本発明の3Dパラメータ推定プログラムは、コンピュータを前記3Dパラメータ推定装置として機能させるプログラムである。
前記3Dパラメータ推定プログラムの具体的な内容としては、前記3Dパラメータ推定装置について説明した事項の全てを適用することができ、重複した説明を省略する。
本発明の3Dパラメータ推定プログラムは、コンピュータを前記3Dパラメータ推定装置として機能させるプログラムである。
前記3Dパラメータ推定プログラムの具体的な内容としては、前記3Dパラメータ推定装置について説明した事項の全てを適用することができ、重複した説明を省略する。
(3Dパラメータ推定方法)
本発明の3Dパラメータ推定方法は、1つの離散体の2次元的特徴を指標する2Dパラメータを値に応じてクラス分けしたときの前記クラス毎の頻度情報に基づく登録2D頻度情報と前記頻度情報が前記登録2D頻度情報であるときの前記離散体の3次元的特徴を指標する3Dパラメータの値情報を持つ登録3Dパラメータ情報とで一対の変換情報をなす2D-3D変換情報の群が記憶される2D-3D変換情報データベースに対し、1つ又は複数の前記離散体を被推定対象とし、前記被推定対象について測定された前記2Dパラメータの測定値の情報が前記クラス毎の頻度の形式で表された入力頻度情報を入力として、同種類の前記2Dパラメータについての前記入力頻度情報と前記登録2D頻度情報に基づく対比情報との差分を評価することで、前記入力頻度情報と前記2D-3D変換情報とを関連付け、関連付けられた前記2D-3D変換情報の登録3Dパラメータ情報に基づき前記被推定対象の前記3Dパラメータを推定する3Dパラメータ推定工程を実施する方法である。
前記3Dパラメータ推定方法の具体的な実施方法としては、前記3Dパラメータ推定装置について説明した事項の全てを適用することができ、重複した説明を省略する。
本発明の3Dパラメータ推定方法は、1つの離散体の2次元的特徴を指標する2Dパラメータを値に応じてクラス分けしたときの前記クラス毎の頻度情報に基づく登録2D頻度情報と前記頻度情報が前記登録2D頻度情報であるときの前記離散体の3次元的特徴を指標する3Dパラメータの値情報を持つ登録3Dパラメータ情報とで一対の変換情報をなす2D-3D変換情報の群が記憶される2D-3D変換情報データベースに対し、1つ又は複数の前記離散体を被推定対象とし、前記被推定対象について測定された前記2Dパラメータの測定値の情報が前記クラス毎の頻度の形式で表された入力頻度情報を入力として、同種類の前記2Dパラメータについての前記入力頻度情報と前記登録2D頻度情報に基づく対比情報との差分を評価することで、前記入力頻度情報と前記2D-3D変換情報とを関連付け、関連付けられた前記2D-3D変換情報の登録3Dパラメータ情報に基づき前記被推定対象の前記3Dパラメータを推定する3Dパラメータ推定工程を実施する方法である。
前記3Dパラメータ推定方法の具体的な実施方法としては、前記3Dパラメータ推定装置について説明した事項の全てを適用することができ、重複した説明を省略する。
(2D-3D変換データベースの構築)
<3Dモデル粒子>
離散体として球及び楕円体の3Dモデル粒子を考える。球及び楕円体の形状は、互いに直交する長軸、中軸、短軸の長さ比により決まる。
ここでは、50通りの前記3Dモデル粒子を、次の通りコンピュータ上で仮想的に設定した。即ち、長軸長(a)と短軸長(c)の比(a/c)を1から4の間を均等割りした50パターンとし、中軸長(b)は、acの正の平方根(√ac)で与えた。図4にa/c≒3.02の3Dモデル粒子を例示する。
<3Dモデル粒子>
離散体として球及び楕円体の3Dモデル粒子を考える。球及び楕円体の形状は、互いに直交する長軸、中軸、短軸の長さ比により決まる。
ここでは、50通りの前記3Dモデル粒子を、次の通りコンピュータ上で仮想的に設定した。即ち、長軸長(a)と短軸長(c)の比(a/c)を1から4の間を均等割りした50パターンとし、中軸長(b)は、acの正の平方根(√ac)で与えた。図4にa/c≒3.02の3Dモデル粒子を例示する。
<3Dパラメータ及び2Dパラメータ>
設定した前記3Dモデル粒子の2Dパラメータについて、ここでは任意の断面における、周長/面積比(P1)、長軸長/短軸長比(P2)、面積(P3)及び長軸長(P4)の4種を考える。
前記各3Dモデル粒子(50個)に対してランダムな位置の断面を5,000回取得し、4種の前記各2Dパラメータを設定に応じて算出し、頻度分布としてまとめた。
設定した前記3Dモデル粒子の2Dパラメータについて、ここでは任意の断面における、周長/面積比(P1)、長軸長/短軸長比(P2)、面積(P3)及び長軸長(P4)の4種を考える。
前記各3Dモデル粒子(50個)に対してランダムな位置の断面を5,000回取得し、4種の前記各2Dパラメータを設定に応じて算出し、頻度分布としてまとめた。
また、設定した前記3Dモデル粒子の3Dパラメータについて、ここでは、表面積(Q1)、体積(Q2)、長軸長(Q3)、長軸長/中軸長比(Q4)及び長軸長/短軸長比(Q5)の5種を考える。
前記各3Dモデル粒子(50個)に対して5種の前記各3Dパラメータを設定に応じて算出した。
前記各3Dモデル粒子(50個)に対して5種の前記各3Dパラメータを設定に応じて算出した。
前記各2Dパラメータの頻度分布は、それぞれ前記2Dパラメータを値に応じてクラス分けしたときの前記クラス毎の頻度情報として個々の前記3D粒子モデルの登録2D頻度情報を構成し、2D-3D変換情報データベースに登録される。
また、前記各3Dパラメータは、それぞれ前記頻度情報が前記登録2D頻度情報であるときの個々の前記3Dモデル粒子が持つ3Dパラメータの値として登録3Dパラメータ情報を構成し、前記2D-3D変換情報データベースに登録される。
こうして、個々の前記3Dモデル粒子(50個)について、それぞれ前記登録2D頻度情報と前記登録3Dパラメータ情報とが一対の変換情報をなすように関連付けされた2D-3D変換情報を登録することで、50個の前記2D-3D変換情報の群で構成される前記2D-3D変換情報データベースを一次的に構築した。
また、前記各3Dパラメータは、それぞれ前記頻度情報が前記登録2D頻度情報であるときの個々の前記3Dモデル粒子が持つ3Dパラメータの値として登録3Dパラメータ情報を構成し、前記2D-3D変換情報データベースに登録される。
こうして、個々の前記3Dモデル粒子(50個)について、それぞれ前記登録2D頻度情報と前記登録3Dパラメータ情報とが一対の変換情報をなすように関連付けされた2D-3D変換情報を登録することで、50個の前記2D-3D変換情報の群で構成される前記2D-3D変換情報データベースを一次的に構築した。
<スケールパラメータによる2D-3D変換情報データベースの拡張>
次に、個々の前記3Dモデル粒子(50個)について、前記2Dパラメータ及び前記3Dパラメータに対し、スケールパラメータ(s)を掛けることで、前記3Dモデル粒子と相似形で大きさが異なる拡張粒子(サイズ変更体)についての前記2D-3D変換情報を設定し、前記2D-3D変換情報データベースを構築した。
前記スケールパラメータ(s)は、前記3Dモデル粒子を標準粒子として、前記拡張粒子と前記標準粒子との寸法比により設定される。ここでは、前記標準粒子のサイズを400(無次元)として、前記スケールパラメータ(s)を0.075,0.568,1.06,1.55,2.05,2.54,3.03,3.52,4.02,4.51,5.00の11通りで設定した。
なお、前記2Dパラメータ及び前記3Dパラメータの種類ごとの前記スケールパラメータ(s)の適用方法は、幾何学的計算手法に基づき、下記表1の通りとなる。例えば、表面積(Q1)の前記3Dパラメータについては、前記標準粒子の表面積(Q1)の値に対し、s2を掛けて前記拡張粒子の表面積(Q1)を設定し、周長/面積(P1)の前記2Dパラメータについては、前記標準粒子の周長/面積(P1)の値に対し、1/sを掛けて前記拡張粒子の周長/面積(P1)を設定する。
次に、個々の前記3Dモデル粒子(50個)について、前記2Dパラメータ及び前記3Dパラメータに対し、スケールパラメータ(s)を掛けることで、前記3Dモデル粒子と相似形で大きさが異なる拡張粒子(サイズ変更体)についての前記2D-3D変換情報を設定し、前記2D-3D変換情報データベースを構築した。
前記スケールパラメータ(s)は、前記3Dモデル粒子を標準粒子として、前記拡張粒子と前記標準粒子との寸法比により設定される。ここでは、前記標準粒子のサイズを400(無次元)として、前記スケールパラメータ(s)を0.075,0.568,1.06,1.55,2.05,2.54,3.03,3.52,4.02,4.51,5.00の11通りで設定した。
なお、前記2Dパラメータ及び前記3Dパラメータの種類ごとの前記スケールパラメータ(s)の適用方法は、幾何学的計算手法に基づき、下記表1の通りとなる。例えば、表面積(Q1)の前記3Dパラメータについては、前記標準粒子の表面積(Q1)の値に対し、s2を掛けて前記拡張粒子の表面積(Q1)を設定し、周長/面積(P1)の前記2Dパラメータについては、前記標準粒子の周長/面積(P1)の値に対し、1/sを掛けて前記拡張粒子の周長/面積(P1)を設定する。
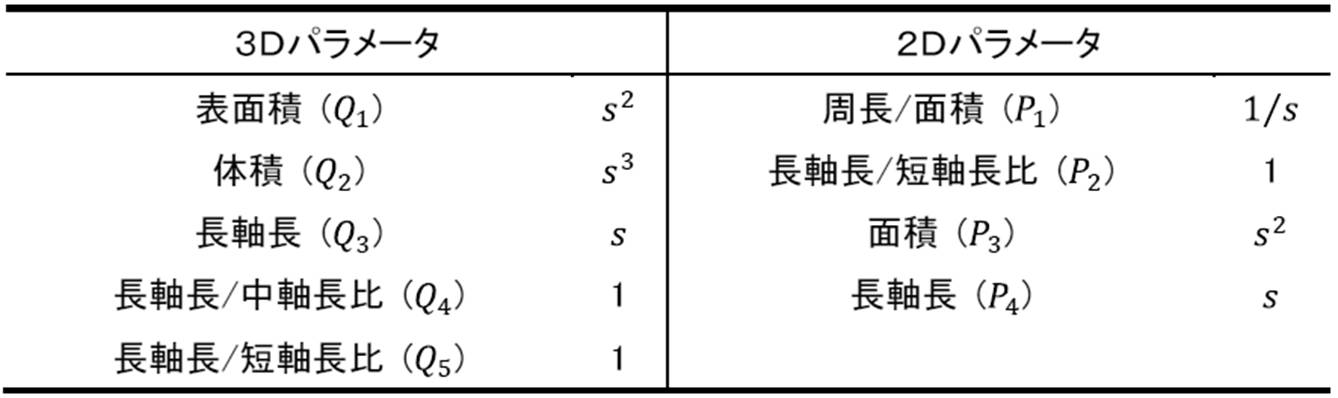
以上により、前記スケールパラメータ(s)により拡張された前記2D-3D変換情報データベースを二次的に構築した。
二次的に構築される前記2D-3D変換情報データベースは、形状及び大きさが異なる計550通り(50形状パターン×11サイズパターン)の前記2D-3D変換情報の群で構成される。
二次的に構築される前記2D-3D変換情報データベースは、形状及び大きさが異なる計550通り(50形状パターン×11サイズパターン)の前記2D-3D変換情報の群で構成される。
(3Dパラメータ推定手段)
本実施例では、前記3Dパラメータ推定手段が、前記遺伝アルゴリズム解析(図3参照)により前記目的関数を評価することを通じて、前記被推定対象に係る前記離散体が持つ前記3Dパラメータを推定するように構成される。以下、具体的に説明する。
本実施例では、前記3Dパラメータ推定手段が、前記遺伝アルゴリズム解析(図3参照)により前記目的関数を評価することを通じて、前記被推定対象に係る前記離散体が持つ前記3Dパラメータを推定するように構成される。以下、具体的に説明する。
前記遺伝アルゴリズム解析としては、前記バイナリ・コーディング、前記トーナメント選択及び前記一点交叉の方式を採用して行う。
前記バイナリ・コーディングによる遺伝子列のサイズは、二次的に構築される前記2D-3D変換情報データベース(前記2D-3D変換情報の数が550個)を用いて前記3Dパラメータを推定する条件(以下、これを「1段階GA」と称する)では、3,300ビットとした。
また、一次的に構築される前記2D-3D変換情報データベース(前記2D-3D変換情報の数が50個)と、二次的に構築される前記2D-3D変換情報データベース(前記2D-3D変換情報の数が550個)とを用いて前記3Dパラメータを推定する条件(以下、これを「2段階GA」と称する)では、一次的に構築される前記2D-3D変換情報データベースを用いた一次解算出処理を行う際において、前記遺伝子列のサイズを300ビットとし、二次的に構築される前記2D-3D変換情報データベースを用いた二次解算出処理を行う際において、前記遺伝子列のサイズを3,300ビットとした。
また、前記トーナメント選択では、25の個体をランダムに抽出して、その中で最良の個体を選択する操作を、個体集合サイズと同じ回数実施した。
また、前記一点交叉では、2つの個体をランダムに抽出し、交叉する遺伝子の位置(交叉点)をランダムに決定し、交叉点より後方の遺伝子を交叉した。
前記バイナリ・コーディングによる遺伝子列のサイズは、二次的に構築される前記2D-3D変換情報データベース(前記2D-3D変換情報の数が550個)を用いて前記3Dパラメータを推定する条件(以下、これを「1段階GA」と称する)では、3,300ビットとした。
また、一次的に構築される前記2D-3D変換情報データベース(前記2D-3D変換情報の数が50個)と、二次的に構築される前記2D-3D変換情報データベース(前記2D-3D変換情報の数が550個)とを用いて前記3Dパラメータを推定する条件(以下、これを「2段階GA」と称する)では、一次的に構築される前記2D-3D変換情報データベースを用いた一次解算出処理を行う際において、前記遺伝子列のサイズを300ビットとし、二次的に構築される前記2D-3D変換情報データベースを用いた二次解算出処理を行う際において、前記遺伝子列のサイズを3,300ビットとした。
また、前記トーナメント選択では、25の個体をランダムに抽出して、その中で最良の個体を選択する操作を、個体集合サイズと同じ回数実施した。
また、前記一点交叉では、2つの個体をランダムに抽出し、交叉する遺伝子の位置(交叉点)をランダムに決定し、交叉点より後方の遺伝子を交叉した。
本実施例では、前記1段階GAと前記2段階GAとの2通りの処理条件により、前記被推定対象についての前記3Dパラメータの推定を行う。ここでは、前記被推定対象を複数の前記離散体で構成される前記集合体とする。
前記1段階GAでは、前記集合体を構成する前記離散体の前記頻度情報と対応する前記登録2D頻度情報を持つ前記2D-3D変換情報が前記2D-3D変換情報データベース中に存在する存在割合を評価する前記2D-3D変換情報毎の評価値に基づいて前記入力頻度情報と前記対比情報との差分を評価する前記目的関数を用い、前記目的関数の値が最大となる条件での前記評価値を最適値として前記目的関数を解き、前記最適値を前記集合体に対して前記2D-3D変換情報が適用される前記適用割合として、前記適用割合に応じて前記入力頻度情報と前記2D-3D変換情報とを関連付ける。なお、前記目的関数には、選択性があり、前記目的関数によっては、値が最小となる条件で解くこととしてもよい。つまり、最大又は最小の極値により前記最適値が前記2D-3D変換情報毎に一つに定まればよい。
前記2段階GAでは、前記離散体の形状が異なる2D-3D変換情報の群(一次的に構築される前記2D-3D変換情報データベースにおける前記各2D-3D変換情報(50個))を対象として前記目的関数を解くことで前記最適値を与える暫定解としての一次解を算出する前記一次解算出処理と、前記一次解に基づき、前記拡張粒子(サイズ変更体)に基づき作成される前記2D-3D変換情報の群(二次的に構築される前記2D-3D変換情報データベースにおける前記各2D-3D変換情報(550個))を対象として前記目的関数を解くことで前記最適値を与える最適解としての二次解を算出する前記二次解算出処理と、が実行とされる。
なお、前記遺伝アルゴリズム解析による基本的な解析手法は、前記1段階GAと前記2段階GAとで共通する。以下、詳述する。
なお、前記遺伝アルゴリズム解析による基本的な解析手法は、前記1段階GAと前記2段階GAとで共通する。以下、詳述する。
前記登録2D頻度情報における前記頻度情報をfj
i
kとする。ここで、3つの添え字(i,j,k)の意味は、次の通りである。
即ち、iは、前記2Dパラメータの種類(P1~P4)を表し、iは、次式、1≦i≦NP 2Dを満たす。ただし、NP 2Dは、解析に使用された前記2Dパラメータの数を意味し、後述の前記1段階GAでは、NP 2D=4、前記2段階GAの前記一次解算出処理では、NP 2D=2、前記二次解算出処理では、NP 2D=4である。
また、kは、前記頻度情報を構成する前記2Dパラメータのクラス番号を表す。前記頻度情報は、前記2Dパラメータを値に応じてクラス分けしたときの前記クラス毎の頻度で表される。ここでは、前記2Dパラメータの種類毎に適当な最大値と最小値とを設定し、これらの範囲を1,000等分することで、1≦k≦1,000とした。
また、jは、個々の前記2D-3D変換情報に割り当てられた番号を表し、jは、1≦j≦NCを満たす。ただし、NCは、解析に使用された前記2D-3D変換情報の数を意味し、後述の前記1段階GAでは、NC=550、前記2段階GAの前記一次解算出処理では、NC=50、前記二次解算出処理では、NC=550である。
よって、fj i kは、j番目の前記2D-3D変換情報のi番目の前記2Dパラメータのk番目の前記クラスにおける頻度を表す。
即ち、iは、前記2Dパラメータの種類(P1~P4)を表し、iは、次式、1≦i≦NP 2Dを満たす。ただし、NP 2Dは、解析に使用された前記2Dパラメータの数を意味し、後述の前記1段階GAでは、NP 2D=4、前記2段階GAの前記一次解算出処理では、NP 2D=2、前記二次解算出処理では、NP 2D=4である。
また、kは、前記頻度情報を構成する前記2Dパラメータのクラス番号を表す。前記頻度情報は、前記2Dパラメータを値に応じてクラス分けしたときの前記クラス毎の頻度で表される。ここでは、前記2Dパラメータの種類毎に適当な最大値と最小値とを設定し、これらの範囲を1,000等分することで、1≦k≦1,000とした。
また、jは、個々の前記2D-3D変換情報に割り当てられた番号を表し、jは、1≦j≦NCを満たす。ただし、NCは、解析に使用された前記2D-3D変換情報の数を意味し、後述の前記1段階GAでは、NC=550、前記2段階GAの前記一次解算出処理では、NC=50、前記二次解算出処理では、NC=550である。
よって、fj i kは、j番目の前記2D-3D変換情報のi番目の前記2Dパラメータのk番目の前記クラスにおける頻度を表す。
前記目的関数の値が最大となるときの前記評価値である前記最適値、つまり、前記集合体に対して前記2D-3D変換情報が適用される前記適用割合をgjとする。
ここで、前記集合体を構成する前記離散体に対し、前記2D-3D変換情報データベースに記憶された前記2D-3D変換情報の群うち、いずれか1つの前記2D-3D変換情報が必ず適用されることを前提条件とし、この前提条件を満足させるため、gjには、次式の制約を与える。

ここで、前記集合体を構成する前記離散体に対し、前記2D-3D変換情報データベースに記憶された前記2D-3D変換情報の群うち、いずれか1つの前記2D-3D変換情報が必ず適用されることを前提条件とし、この前提条件を満足させるため、gjには、次式の制約を与える。
gjの具体的な算出方法としては、前記1段階GAを例とすれば、次の通りであり、前記2段階GAにおいても、同様に行うことができる。
先ず、0又は1の数字をランダムに3,300個並べた数列を作り、これを3,300ビットの遺伝子列と考える。前記遺伝子列における1つの前記2D-3D変換情報の割り当ては、6ビット(=3,300/550)である。
前記遺伝子列の先頭から6ビットずつ、2進数6桁の数列(例えば、001011)を読み、それを10進法に変換する。この処理を3,300ビット全体に対して行うことで、全ての前記2D-3D変換情報のそれぞれについて、一つの整数が割り当てられる。例えば、2進数6桁の数列が001011であるとき、この数列に対応する前記2D-3D変換情報に対して、11(=1×20+1×21+0×22+1×23+0×24+0×25)が割り当てられる。
j番目の前記2D-3D変換情報に割り当てられた整数をUjとし、次式により算出されるUjの合計値をUSUMとする。
先ず、0又は1の数字をランダムに3,300個並べた数列を作り、これを3,300ビットの遺伝子列と考える。前記遺伝子列における1つの前記2D-3D変換情報の割り当ては、6ビット(=3,300/550)である。
前記遺伝子列の先頭から6ビットずつ、2進数6桁の数列(例えば、001011)を読み、それを10進法に変換する。この処理を3,300ビット全体に対して行うことで、全ての前記2D-3D変換情報のそれぞれについて、一つの整数が割り当てられる。例えば、2進数6桁の数列が001011であるとき、この数列に対応する前記2D-3D変換情報に対して、11(=1×20+1×21+0×22+1×23+0×24+0×25)が割り当てられる。
j番目の前記2D-3D変換情報に割り当てられた整数をUjとし、次式により算出されるUjの合計値をUSUMとする。

次に、i番目の2Dパラメータのk番目クラスの推定頻度情報(Fi
k)を、下記式(1)により算出する。この推定頻度情報(Fi
k)は、後述する入力頻度情報と同種類の前記2Dパラメータについて個々の2D-3D変換情報が持つ登録2D頻度情報を複数の前記2D-3D変換情報を対象として積算した推定頻度情報に該当する。

次に、前記推定頻度情報(Fi
k)を累積で表した累積推定頻度(Ci
k)を、下記式(2)により算出する。

ここで、前記入力頻度情報としては、複数の前記離散体を前記被推定対象の前記集合体とし、前記離散体が有する前記2Dパラメータの各測定値に応じて前記各離散体をクラス分けしたときの前記集合体における前記離散体の前記クラス毎の存在割合の累積値に基づく集合体頻度情報を用い、Mi
kで表す。
これにより、前記累積推定頻度(Ci k)と前記入力頻度情報(Mi k)との差をDとして、下記式(3)により算出する。

これにより、前記累積推定頻度(Ci k)と前記入力頻度情報(Mi k)との差をDとして、下記式(3)により算出する。
ここで、前記頻度情報(fj
i
k)から前記推定頻度情報(Fi
k)(及び前記累積推定頻度(Ci
k))を算出する理由は、次の通りである。
前記頻度情報(fj i k)は、1つの前記離散体についての確定的な情報であるのに対して、前記推定頻度情報(Fi k)は、gjに基づく前記離散体の前記集合体の推定値である。
1つの前記離散体を被推定対象とする場合、前記3Dパラメータの推定を前記離散体毎に前記入力頻度情報を入力して、前記頻度情報(fj i k)との対比を通じた解析を行う必要がある。
このような解析は、被推定対象の前記離散体毎に遂次行うこともできるが、前記離散体の数が多い場合には、入力及び解析結果(出力)の取扱いが煩雑となり得る。
また、被推定対象が鉱石の破砕片の群である場合のように、前記離散体の数が多く、また、1つの前記離散体から複数の断面を逐一取得することが現実的でない、つまり、1つの前記離散体について前記2Dパラメータの前記頻度情報を取得することが現実的でない場合がある。
ここでは、前記集合体に対する前記推定頻度情報(Fi k)(及び前記累積推定頻度(Ci k))を用いて、複数の前記離散体で構成される集合体を1つの単位として解析を行い、前記集合体に属する前記各離散体の解析結果を同時に得ることとする。
即ち、前記集合体に対する測定値である前記入力頻度情報(Mi k)と対比させる前記対比情報として、1つの前記離散体についての前記頻度情報(fj i k)ではなく、前記集合体に対する前記推定頻度情報(Fi k)(及び前記累積推定頻度(Ci k))を用いる。
このような解析手法によれば、前記離散体毎に入力及び解析結果(出力)の取扱いを行う必要がなく、また、1つの前記離散体について1つの前記2Dパラメータを測定し、前記集合体について1つの前記入力頻度情報(Mi k)を付与するため、前記離散体毎に前記頻度情報を取得する必要がなく、利便性に優れた前記3Dパラメータ推定装置とすることができる。
なお、被推定対象の前記離散体の数が少なく、1つの前記離散体について前記2Dパラメータの前記頻度情報を取得し易い場合には、前記離散体毎に解析を行ってもよく、この場合、前記対比情報として前記推定頻度情報(Fi k)に代えて前記頻度情報(fj i k)を用い、前記入力頻度情報(Mi k)を、1つの前記離散体における前記頻度情報、つまり前記登録2D頻度情報に相当する形式の頻度情報に変更し、前記頻度情報(fj i k)と前記登録2D頻度情報に相当する形式の頻度情報との差を用いて解析を行う。
前記頻度情報(fj i k)は、1つの前記離散体についての確定的な情報であるのに対して、前記推定頻度情報(Fi k)は、gjに基づく前記離散体の前記集合体の推定値である。
1つの前記離散体を被推定対象とする場合、前記3Dパラメータの推定を前記離散体毎に前記入力頻度情報を入力して、前記頻度情報(fj i k)との対比を通じた解析を行う必要がある。
このような解析は、被推定対象の前記離散体毎に遂次行うこともできるが、前記離散体の数が多い場合には、入力及び解析結果(出力)の取扱いが煩雑となり得る。
また、被推定対象が鉱石の破砕片の群である場合のように、前記離散体の数が多く、また、1つの前記離散体から複数の断面を逐一取得することが現実的でない、つまり、1つの前記離散体について前記2Dパラメータの前記頻度情報を取得することが現実的でない場合がある。
ここでは、前記集合体に対する前記推定頻度情報(Fi k)(及び前記累積推定頻度(Ci k))を用いて、複数の前記離散体で構成される集合体を1つの単位として解析を行い、前記集合体に属する前記各離散体の解析結果を同時に得ることとする。
即ち、前記集合体に対する測定値である前記入力頻度情報(Mi k)と対比させる前記対比情報として、1つの前記離散体についての前記頻度情報(fj i k)ではなく、前記集合体に対する前記推定頻度情報(Fi k)(及び前記累積推定頻度(Ci k))を用いる。
このような解析手法によれば、前記離散体毎に入力及び解析結果(出力)の取扱いを行う必要がなく、また、1つの前記離散体について1つの前記2Dパラメータを測定し、前記集合体について1つの前記入力頻度情報(Mi k)を付与するため、前記離散体毎に前記頻度情報を取得する必要がなく、利便性に優れた前記3Dパラメータ推定装置とすることができる。
なお、被推定対象の前記離散体の数が少なく、1つの前記離散体について前記2Dパラメータの前記頻度情報を取得し易い場合には、前記離散体毎に解析を行ってもよく、この場合、前記対比情報として前記推定頻度情報(Fi k)に代えて前記頻度情報(fj i k)を用い、前記入力頻度情報(Mi k)を、1つの前記離散体における前記頻度情報、つまり前記登録2D頻度情報に相当する形式の頻度情報に変更し、前記頻度情報(fj i k)と前記登録2D頻度情報に相当する形式の頻度情報との差を用いて解析を行う。
本実施例では、前記目的関数(O)は、次式により定義される。

前記遺伝アルゴリズム解析では、前記目的関数(O)は、0~1の範囲で値を持つ。前記目的関数(O)の値が最大となる、つまり、前記累積推定頻度(Ci
k)と前記入力頻度情報(Mi
k)との差(D)が最も小さくなるgjを求める。gjは、前記2D-3D変換データ(j)毎に求められ、差(D)が最小となるときの各gjで最適解が構成される。
この最適解は、前記集合体(被推定対象)における前記各離散体の前記クラス毎の存在割合を最適に推定する役割を有する。
即ち、前記最適解に基づき、前記集合体(被推定対象)を構成する前記離散体の群に対し、前記2D-3D変換データが適用される適用割合(gj)を決定し、前記各2D-3D変換データが持つ個々の前記登録3Dパラメータ情報を前記2D-3D変換データの前記適用割合に応じて前記クラス毎の頻度情報とすることで、これを前記集合体(被推定対象)が有する前記3Dパラメータ(クラス毎の頻度情報)の推定情報とする。
以下、説明のために簡単な例を示す。
この例では、j=1,2,3の3つの前記2D-3D変換情報で前記2D-3D変換情報データベースが構成され、前記各2D-3D変換情報に登録される前記登録3Dパラメータ情報が体積を前記3Dパラメータとし、体積の値がj=1で0.2、j=2で0.3、j=3で0.5であり、また、前記最適解を構成する前記2D-3D変換データ(j)毎のgjの値がj=1で0.0(g1=0.0)、j=2で0.4(g2=0.4)、j=3で0.6(g3=0.6)と求められたとする。
この場合、前記集合体が持つ前記離散体の体積(3Dパラメータ)についての推定頻度は、体積0.2で0.0、体積0.3で0.4、体積0.5で0.6となり、また、前記推定情報の累積分布は、体積0.2以下が0.0、体積0.3で0.4、体積0.5以上で1.0と表すことができる。また、体積値の間隙、即ち、体積値が0.2を超え0.3未満であるときと、体積値が0.3を超え0.5未満であるときについては、それぞれ、体積値を補間した値とする。前記補間は、線形補間が容易であるが、その他の補間方法でも構わない。前記線形補間の例を挙げると、例えば、体積0.25の累積分布は、0.2(=(0.0+0.4)/((0.3-0.2)/(0.25-0.2)))となる。
なお、1つの前記離散体を前記被推定対象として前記3Dパラメータの推定を行う場合には、前記対比情報としての前記頻度情報(fj i k)と、前記入力頻度情報としての前記登録2D頻度情報に相当する形式の頻度情報との差をDとして、前記式(4)における前記目的関数(O)の値が最大となる、つまり、前記差が最も小さくなる条件を最適解として、前記頻度情報(fj i k)から1つの前記2D-3D変換情報を特定し、この前記2D-3D変換情報が持つ前記登録3Dパラメータ情報自身を前記被推定対象(1つの前記離散体)が持つ前記3Dパラメータの推定結果とすればよい。
この最適解は、前記集合体(被推定対象)における前記各離散体の前記クラス毎の存在割合を最適に推定する役割を有する。
即ち、前記最適解に基づき、前記集合体(被推定対象)を構成する前記離散体の群に対し、前記2D-3D変換データが適用される適用割合(gj)を決定し、前記各2D-3D変換データが持つ個々の前記登録3Dパラメータ情報を前記2D-3D変換データの前記適用割合に応じて前記クラス毎の頻度情報とすることで、これを前記集合体(被推定対象)が有する前記3Dパラメータ(クラス毎の頻度情報)の推定情報とする。
以下、説明のために簡単な例を示す。
この例では、j=1,2,3の3つの前記2D-3D変換情報で前記2D-3D変換情報データベースが構成され、前記各2D-3D変換情報に登録される前記登録3Dパラメータ情報が体積を前記3Dパラメータとし、体積の値がj=1で0.2、j=2で0.3、j=3で0.5であり、また、前記最適解を構成する前記2D-3D変換データ(j)毎のgjの値がj=1で0.0(g1=0.0)、j=2で0.4(g2=0.4)、j=3で0.6(g3=0.6)と求められたとする。
この場合、前記集合体が持つ前記離散体の体積(3Dパラメータ)についての推定頻度は、体積0.2で0.0、体積0.3で0.4、体積0.5で0.6となり、また、前記推定情報の累積分布は、体積0.2以下が0.0、体積0.3で0.4、体積0.5以上で1.0と表すことができる。また、体積値の間隙、即ち、体積値が0.2を超え0.3未満であるときと、体積値が0.3を超え0.5未満であるときについては、それぞれ、体積値を補間した値とする。前記補間は、線形補間が容易であるが、その他の補間方法でも構わない。前記線形補間の例を挙げると、例えば、体積0.25の累積分布は、0.2(=(0.0+0.4)/((0.3-0.2)/(0.25-0.2)))となる。
なお、1つの前記離散体を前記被推定対象として前記3Dパラメータの推定を行う場合には、前記対比情報としての前記頻度情報(fj i k)と、前記入力頻度情報としての前記登録2D頻度情報に相当する形式の頻度情報との差をDとして、前記式(4)における前記目的関数(O)の値が最大となる、つまり、前記差が最も小さくなる条件を最適解として、前記頻度情報(fj i k)から1つの前記2D-3D変換情報を特定し、この前記2D-3D変換情報が持つ前記登録3Dパラメータ情報自身を前記被推定対象(1つの前記離散体)が持つ前記3Dパラメータの推定結果とすればよい。
なお、前記最適解は、前記2段階GAの前記一次解算出処理では、暫定解としての前記一次解を意味し、前記二次解算出処理では、最適解そのものである前記二次解を意味する。
また、本実施例では、前記目的関数(O)が前記遺伝アルゴリズム解析で一般に用いられる適応度の概念に準じて設定されるため、前記目的関数(O)の値は、前記適応度と呼称しても問題なく、以下では、「目的関数」との記載を「適応度」と読み替えても同じ意味である。
また、本実施例で用いた前記遺伝アルゴリズム解析の解析パラメータを下記表2に示す。
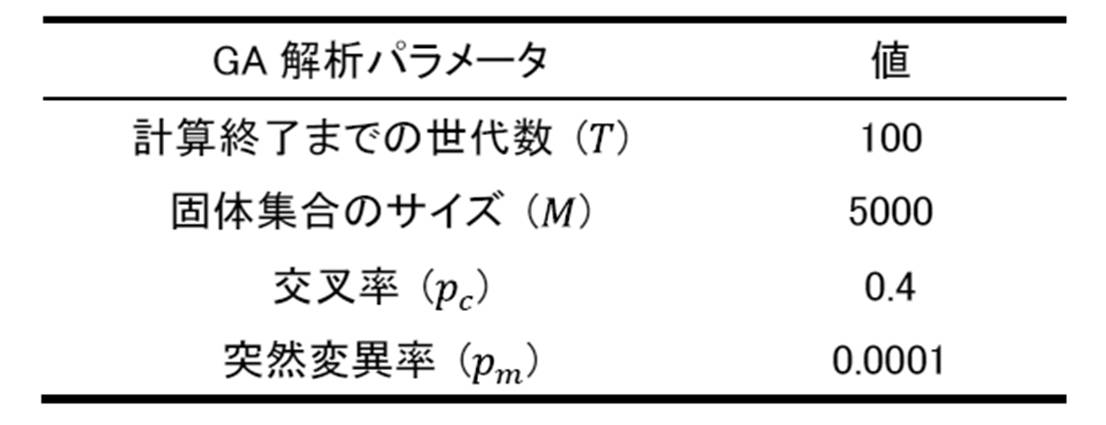
また、本実施例では、前記目的関数(O)が前記遺伝アルゴリズム解析で一般に用いられる適応度の概念に準じて設定されるため、前記目的関数(O)の値は、前記適応度と呼称しても問題なく、以下では、「目的関数」との記載を「適応度」と読み替えても同じ意味である。
また、本実施例で用いた前記遺伝アルゴリズム解析の解析パラメータを下記表2に示す。
以上の前記遺伝アルゴリズム解析条件の下、前記1段階GA及び前記2段階GAの2通りの解析を次のように行った。
前述の通り、前記2段階GAの前記2D-3D変換情報は、一次的に構築される前記2D-3D変換情報データベースでは50個、二次的に構築される前記2D-3D変換情報データベースでは550個存在する。
前述の通り、前記2段階GAの前記2D-3D変換情報は、一次的に構築される前記2D-3D変換情報データベースでは50個、二次的に構築される前記2D-3D変換情報データベースでは550個存在する。
前記1段階GAでは、前記遺伝子列のサイズを3,300ビットとし、二次的に構築される前記2D-3D変換情報データベース中の全ての前記2D-3D変換情報(550個)を使用し、全ての前記2Dパラメータ(P1~P4)について、前記遺伝アルゴリズム解析を行った。なお、解析結果として全ての前記3Dパラメータ(Q1~Q5)を出力することとした。
また、前記2段階GAでは、先ず、前記一次解算出処理において、前記遺伝子列のサイズを300ビットとし、一次的に構築される前記2D-3D変換情報データベース中の全ての前記2D-3D変換情報(50個)を使用し、前記形状の相違に寄与する前記2Dパラメータ(P1,P2)について、前記遺伝アルゴリズム解析を行った。
次に、前記二次解算出処理において、前記一次解算出処理の前記一次解(最良の個体)における前記遺伝子列(形状の相違に寄与する)を受け継ぎ、かつ、残りの拡張部分(サイズの相違に寄与する)をランダムに設定することで、前記遺伝子列のサイズを3,300ビットに拡張し、二次的に構築される前記2D-3D変換情報データベース中の全ての前記2D-3D変換情報(550個))を使用し、全ての前記2Dパラメータ(P1~P4)について、前記遺伝アルゴリズム解析を行った。
ここで、前記遺伝子列の具体的なサイズ拡張(300ビットから3,300ビットへの拡張)方法としては、前記一次解算出処理後の粒子形状に関する前記一次解の情報を失わずに、前記拡張粒子(サイズ変更体)に対してランダム性を確保した個体群を作成して前記二次解算出処理を行うことを目的として、次のように行った。
概要として、前記一次解算出処理において、前記一次解の算出に用いた300ビットの前記遺伝子列に対し、前記遺伝子列を構成する1つの前記2D-3D変換情報に割り当てられた2進数6桁の数列(6ビット)を2進数66桁の数列(66ビット)に変換する拡張処理を行う。つまり、6ビット単位の数列1個に対し、6ビット単位の数列が11個で構成される拡張数列で変換する。
具体的には、前記拡張数列を構成する6ビット単位の数列11個のうち、5個については、前記拡張処理前の2進数6桁の数列(6ビット)と同じ数列に設定し、残りの6個については、0を6個並べた数列とする。また、6ビット単位の数例11個のうち、いずれの数列を、2進数6桁の数列(6ビット)と同じ数列に設定し、0を6個並べた数列に設定するかは、ランダムとされる。
例えば、前記拡張処理前の2進数6桁の数列(6ビット)が「001011」だったとすると、前記拡張処理後の2進数66桁の数列(66ビット)は、「001011,000000,000000,000000,001011,000000,001011,001011,000000,001011,000000」のように設定される。なお、この例示で6桁毎に加えられるカンマは、1つの2進数66桁の数列(66ビット)が11個の2進数6桁の数列(6ビット)で構成されることを説明するためのものである。
この例示では、前記拡張処理後の2進数66桁の数列(66ビット)における、1,5,7,8,10番目に該当する合計5個の2進数6桁の数列(6ビット)が、それぞれ前記拡張処理前の2進数6桁の数列(6ビット)のコピーとされ、2,3,4,6,9,11番目に該当する合計6個の2進数6桁の数列(6ビット)が、それぞれ0を6個並べた数列とされる。なお、ここでは、前記拡張処理後の2進数66桁の数列(66ビット)に対する、前記拡張処理前の2進数6桁の数列(6ビット)のコピー数を5個としたが、5個ではなく4個,6個,7個等としてもよい。
この拡張処理を、前記拡張処理前における300ビットの前記遺伝子列を構成する、50個の2進数6桁の数列(6ビット)のそれぞれに対して行い、50個の2進数66桁の数列(66ビット)、つまり、前記2D-3D変換情報(6ビット)単位では、550個の2進数6桁の数列(6ビット)で構成される3,300ビットの拡張遺伝子列を設定する。
なお、前記二次解算出処理では、この拡張遺伝子列を初期固体として前記アルゴリズム解析を行うことで、前記一次解算出処理と同様の前記目的関数の解析処理を行う。
具体的には、前記拡張遺伝子列の先頭から6ビットずつ、2進数6桁の数列(6ビット)単位で10進数の整数(Uj)に変換する。この処理を3,300ビット全体、つまり、550個の2進数6桁の数列(6ビット)毎に1つの整数(Uj)に変換する計算を行う。また、これら整数(Uj)の合計値(USUM)を計算する。2進数6桁の数列(6ビット)毎に計算された整数(Uj)を前記2D-3D変換情報毎に割り当て、各整数(Uj)を合計値(USUM)で除して正規化することで、前記2D-3D変換情報毎にgjを算出可能とし、前記目的関数の解析処理を行う。
次に、前記二次解算出処理において、前記一次解算出処理の前記一次解(最良の個体)における前記遺伝子列(形状の相違に寄与する)を受け継ぎ、かつ、残りの拡張部分(サイズの相違に寄与する)をランダムに設定することで、前記遺伝子列のサイズを3,300ビットに拡張し、二次的に構築される前記2D-3D変換情報データベース中の全ての前記2D-3D変換情報(550個))を使用し、全ての前記2Dパラメータ(P1~P4)について、前記遺伝アルゴリズム解析を行った。
ここで、前記遺伝子列の具体的なサイズ拡張(300ビットから3,300ビットへの拡張)方法としては、前記一次解算出処理後の粒子形状に関する前記一次解の情報を失わずに、前記拡張粒子(サイズ変更体)に対してランダム性を確保した個体群を作成して前記二次解算出処理を行うことを目的として、次のように行った。
概要として、前記一次解算出処理において、前記一次解の算出に用いた300ビットの前記遺伝子列に対し、前記遺伝子列を構成する1つの前記2D-3D変換情報に割り当てられた2進数6桁の数列(6ビット)を2進数66桁の数列(66ビット)に変換する拡張処理を行う。つまり、6ビット単位の数列1個に対し、6ビット単位の数列が11個で構成される拡張数列で変換する。
具体的には、前記拡張数列を構成する6ビット単位の数列11個のうち、5個については、前記拡張処理前の2進数6桁の数列(6ビット)と同じ数列に設定し、残りの6個については、0を6個並べた数列とする。また、6ビット単位の数例11個のうち、いずれの数列を、2進数6桁の数列(6ビット)と同じ数列に設定し、0を6個並べた数列に設定するかは、ランダムとされる。
例えば、前記拡張処理前の2進数6桁の数列(6ビット)が「001011」だったとすると、前記拡張処理後の2進数66桁の数列(66ビット)は、「001011,000000,000000,000000,001011,000000,001011,001011,000000,001011,000000」のように設定される。なお、この例示で6桁毎に加えられるカンマは、1つの2進数66桁の数列(66ビット)が11個の2進数6桁の数列(6ビット)で構成されることを説明するためのものである。
この例示では、前記拡張処理後の2進数66桁の数列(66ビット)における、1,5,7,8,10番目に該当する合計5個の2進数6桁の数列(6ビット)が、それぞれ前記拡張処理前の2進数6桁の数列(6ビット)のコピーとされ、2,3,4,6,9,11番目に該当する合計6個の2進数6桁の数列(6ビット)が、それぞれ0を6個並べた数列とされる。なお、ここでは、前記拡張処理後の2進数66桁の数列(66ビット)に対する、前記拡張処理前の2進数6桁の数列(6ビット)のコピー数を5個としたが、5個ではなく4個,6個,7個等としてもよい。
この拡張処理を、前記拡張処理前における300ビットの前記遺伝子列を構成する、50個の2進数6桁の数列(6ビット)のそれぞれに対して行い、50個の2進数66桁の数列(66ビット)、つまり、前記2D-3D変換情報(6ビット)単位では、550個の2進数6桁の数列(6ビット)で構成される3,300ビットの拡張遺伝子列を設定する。
なお、前記二次解算出処理では、この拡張遺伝子列を初期固体として前記アルゴリズム解析を行うことで、前記一次解算出処理と同様の前記目的関数の解析処理を行う。
具体的には、前記拡張遺伝子列の先頭から6ビットずつ、2進数6桁の数列(6ビット)単位で10進数の整数(Uj)に変換する。この処理を3,300ビット全体、つまり、550個の2進数6桁の数列(6ビット)毎に1つの整数(Uj)に変換する計算を行う。また、これら整数(Uj)の合計値(USUM)を計算する。2進数6桁の数列(6ビット)毎に計算された整数(Uj)を前記2D-3D変換情報毎に割り当て、各整数(Uj)を合計値(USUM)で除して正規化することで、前記2D-3D変換情報毎にgjを算出可能とし、前記目的関数の解析処理を行う。
(検証)
<検証用サンプル粒子>
被推定対象の前記離散体として、コンピュータ上で仮想的に、図5(a),(b)に示す前記2Dパラメータ(長軸長(P4)、長軸長/短軸長比(P2))を持つ検証用サンプル粒子を10,000個作成した。なお、図5(a)は、検証用サンプル粒子の長軸長分布を示す図であり、図5(b)は、検証用サンプル粒子の長軸長/短軸長比分布を示す図である。
また、前記検証用サンプル粒子に対し、前記2D-3D変換情報と同じ、表面積(Q1)、体積(Q2)、長軸長(Q3)、長軸長/中軸長比(Q4)及び長軸長/短軸長比(Q5)の5種の前記3Dパラメータを算出した。
この検証用サンプル粒子が持つ前記3Dパラメータは、本来、被推定対象の前記離散体が持つ前記3Dパラメータとして、前記3Dパラメータ推定装置により推定されるべき事項であるが、ここでは、前記3Dパラメータ推定装置による推定結果を検証する目的で、予め用意するものである。
つまり、前記検証用サンプル粒子が持つ前記3Dパラメータは、“真値”であり、本検証では、この“真値”と、前記検証用サンプル粒子の前記2Dパラメータの情報のみを入力して出力される前記3Dパラメータ推定装置による“推定値”とを比較し、前記3Dパラメータ推定装置の有効性を評価する。
なお、前記検証用サンプル粒子の前記2Dパラメータの情報、つまり、前記入力頻度情報は、前記検証用サンプル粒子における断面をランダムな位置で取得し、前記断面に基づき算出したものである。
<検証用サンプル粒子>
被推定対象の前記離散体として、コンピュータ上で仮想的に、図5(a),(b)に示す前記2Dパラメータ(長軸長(P4)、長軸長/短軸長比(P2))を持つ検証用サンプル粒子を10,000個作成した。なお、図5(a)は、検証用サンプル粒子の長軸長分布を示す図であり、図5(b)は、検証用サンプル粒子の長軸長/短軸長比分布を示す図である。
また、前記検証用サンプル粒子に対し、前記2D-3D変換情報と同じ、表面積(Q1)、体積(Q2)、長軸長(Q3)、長軸長/中軸長比(Q4)及び長軸長/短軸長比(Q5)の5種の前記3Dパラメータを算出した。
この検証用サンプル粒子が持つ前記3Dパラメータは、本来、被推定対象の前記離散体が持つ前記3Dパラメータとして、前記3Dパラメータ推定装置により推定されるべき事項であるが、ここでは、前記3Dパラメータ推定装置による推定結果を検証する目的で、予め用意するものである。
つまり、前記検証用サンプル粒子が持つ前記3Dパラメータは、“真値”であり、本検証では、この“真値”と、前記検証用サンプル粒子の前記2Dパラメータの情報のみを入力して出力される前記3Dパラメータ推定装置による“推定値”とを比較し、前記3Dパラメータ推定装置の有効性を評価する。
なお、前記検証用サンプル粒子の前記2Dパラメータの情報、つまり、前記入力頻度情報は、前記検証用サンプル粒子における断面をランダムな位置で取得し、前記断面に基づき算出したものである。
また、本検証では、先の“真値”と“推定値”との比較に加えて、個々の前記2D-3D変換情報に対し、gjとしてランダムな値を与えただけの前記アルゴリズム解析(前記3Dパラメータの推定処理)を行わない状態における前記3Dパラメータの推定値を“参考値”として使用し、“参考値”と“推定値”とを比較し、前記3Dパラメータ推定装置の有効性を評価する。
<検証結果>
図6(a)~(e)に検証結果を示す。なお、図6(a)は、表面積(Q1)の3Dパラメータについての検証結果を累積分布で表した図であり、図6(b)は、体積(Q2)の3Dパラメータについての検証結果を累積分布で表した図であり、図6(c)は、長軸長(Q3)の3Dパラメータについての検証結果を累積分布で表した図であり、図6(d)は、長軸長/中軸長比(Q4)の3Dパラメータについての検証結果を累積分布で表した図であり、図6(e)は、長軸長/短軸長比(Q5)の3Dパラメータについての検証結果を累積分布で表した図である。
また、各図中、「GA前」は、“参考値”の前記3Dパラメータの累積分布を示し、「1段階GA後」は、前記1段階GAによる“推定値”の前記3Dパラメータの累積分布を示し、「2段階GA後」は、前記2段階GAによる“推定値”の前記3Dパラメータの累積分布を示す。
図6(a)~(e)に検証結果を示す。なお、図6(a)は、表面積(Q1)の3Dパラメータについての検証結果を累積分布で表した図であり、図6(b)は、体積(Q2)の3Dパラメータについての検証結果を累積分布で表した図であり、図6(c)は、長軸長(Q3)の3Dパラメータについての検証結果を累積分布で表した図であり、図6(d)は、長軸長/中軸長比(Q4)の3Dパラメータについての検証結果を累積分布で表した図であり、図6(e)は、長軸長/短軸長比(Q5)の3Dパラメータについての検証結果を累積分布で表した図である。
また、各図中、「GA前」は、“参考値”の前記3Dパラメータの累積分布を示し、「1段階GA後」は、前記1段階GAによる“推定値”の前記3Dパラメータの累積分布を示し、「2段階GA後」は、前記2段階GAによる“推定値”の前記3Dパラメータの累積分布を示す。
前記1段階GAによる“推定値”に関し、図6(b),(c)に示すように、体積(Q2)及び長軸長(Q3)の前記各3Dパラメータについては、“参考値”と概ね変わらないが、図6(a),(d),(e)に示すように、表面積(Q1)、長軸長/中軸長比(Q4)及び長軸長/短軸長比(Q5)の前記各3Dパラメータについては、“真値”に近い結果が得られている。
したがって、全体としてみれば、前記3Dパラメータ推定装置の有効性が認められるといえる。
したがって、全体としてみれば、前記3Dパラメータ推定装置の有効性が認められるといえる。
また、前記2段階GAによる“推定値”に関し、図6(a)~(e)に示すように、表面積(Q1)、体積(Q2)、長軸長(Q3)、長軸長/中軸長比(Q4)及び長軸長/短軸長比(Q5)の全ての前記3Dパラメータについて、“真値”に近い結果が得られている。
したがって、前記1段階GAと前記2段階GAとでは、前記2段階GAの有効性を高く評価することができる。
なお、長軸長(Q3)の前記3Dパラメータに関する図6(c)において、「GA前」及び「2段階GA後」の各プロットが縦軸方向に非連続的となっているが、これは、前記2D-3D変換情報におけるサイズ数が少ない(11個)ことによる。サイズ数を増やせば、より連続的なプロットが得られる。
したがって、前記1段階GAと前記2段階GAとでは、前記2段階GAの有効性を高く評価することができる。
なお、長軸長(Q3)の前記3Dパラメータに関する図6(c)において、「GA前」及び「2段階GA後」の各プロットが縦軸方向に非連続的となっているが、これは、前記2D-3D変換情報におけるサイズ数が少ない(11個)ことによる。サイズ数を増やせば、より連続的なプロットが得られる。
1 3Dパラメータ推定装置
2 入力部
3 記憶部
4 演算部
5 出力部
31 2D-3D変換情報データベース
32 3Dパラメータ推定手段
2 入力部
3 記憶部
4 演算部
5 出力部
31 2D-3D変換情報データベース
32 3Dパラメータ推定手段
Claims (9)
- 1つの離散体の2次元的特徴を指標する2Dパラメータを値に応じてクラス分けしたときの前記クラス毎の頻度情報に基づく登録2D頻度情報と前記頻度情報が前記登録2D頻度情報であるときの前記離散体の3次元的特徴を指標する3Dパラメータの値情報を持つ登録3Dパラメータ情報とで一対の変換情報をなす2D-3D変換情報の群が記憶される2D-3D変換情報データベースと、
1つ又は複数の前記離散体を被推定対象とし、前記被推定対象について測定された前記2Dパラメータの測定値の情報が前記クラス毎の頻度の形式で表された入力頻度情報を入力として、同種類の前記2Dパラメータについて前記入力頻度情報と前記登録2D頻度情報に基づく対比情報との差分を評価することで、前記入力頻度情報と前記2D-3D変換情報とを関連付け、関連付けられた前記2D-3D変換情報の前記登録3Dパラメータ情報に基づき前記被推定対象の前記3Dパラメータを推定可能とされる3Dパラメータ推定手段と、
を有することを特徴とする3Dパラメータ推定装置。 - 入力頻度情報が、複数の離散体を被推定対象の集合体とし、2Dパラメータの各測定値に応じて前記各離散体をクラス分けしたときの前記集合体における前記離散体の前記クラス毎の存在割合に基づく集合体頻度情報とされ、
対比情報が、前記集合体頻度情報と同種類の前記2Dパラメータについて個々の2D-3D変換情報が持つ登録2D頻度情報を複数の前記2D-3D変換情報を対象として積算した推定頻度情報に基づく情報とされる請求項1に記載の3Dパラメータ推定装置。 - 3Dパラメータ推定手段が、集合体を構成する離散体の頻度情報と対応する登録2D頻度情報を持つ前記2D-3D変換情報が2D-3D変換情報データベース中に存在する存在割合を評価する前記2D-3D変換情報毎の評価値に基づいて入力頻度情報と対比情報との差分を評価する目的関数を用い、前記目的関数の値が最大又は最小となる条件での前記評価値を最適値として前記目的関数を解き、前記最適値を前記集合体に対して前記2D-3D変換情報が適用される適用割合として、前記適用割合に応じて前記入力頻度情報と前記2D-3D変換情報とを関連付けるように構成とされる請求項2に記載の3Dパラメータ推定装置。
- 2D-3D変換情報データベースが、離散体に基づき作成される2D-3D変換情報の一次群と、前記離散体と相似形で大きさが異なるとともに、1つの前記離散体に対し複数設定される前記離散体のサイズ変更体に基づき作成される前記2D-3D変換情報の2次群とを記録して構成され、
3Dパラメータ推定手段が、前記一次群を対象として目的関数を解くことで最適値を与える暫定解としての一次解を算出する一次解算出処理と、前記一次解に基づき、前記二次群を対象として前記目的関数を解くことで前記最適値を与える最適解としての二次解を算出する二次解算出処理とを実行可能とされる請求項3に記載の3Dパラメータ装置。 - 目的関数の最適解が遺伝アルゴリズム解析により算出可能とされる請求項3から4のいずれかに記載の3Dパラメータ推定装置。
- 1つの2D-3D変換情報が、種類の異なる2Dパラメータに基づく複数の登録2D頻度情報を有し、
3Dパラメータ推定手段が、複数の前記登録2D頻度情報のうち入力頻度情報と同種類の前記2Dパラメータに基づく前記登録2D頻度情報を対象として、被推定対象の3Dパラメータを推定可能とされる請求項1から5のいずれかに記載の3Dパラメータ推定装置。 - 1つの2D-3D変換情報が、種類の異なる3Dパラメータに基づく複数の登録3Dパラメータ情報を有し、
3Dパラメータ推定手段が、前記2D-3D変換情報が有する複数の前記登録3Dパラメータ情報と同種類の被推定対象の前記3Dパラメータを同時に推定可能とされる請求項1から6のいずれかに記載の3Dパラメータ推定装置。 - コンピュータを請求項1から7のいずれかに記載の3Dパラメータ推定装置として機能させることを特徴とする3Dパラメータ推定プログラム。
- 1つの離散体の2次元的特徴を指標する2Dパラメータを値に応じてクラス分けしたときの前記クラス毎の頻度情報に基づく登録2D頻度情報と前記頻度情報が前記登録2D頻度情報であるときの前記離散体の3次元的特徴を指標する3Dパラメータの値情報を持つ登録3Dパラメータ情報とで一対の変換情報をなす2D-3D変換情報の群が記憶される2D-3D変換情報データベースに対し、
1つ又は複数の前記離散体を被推定対象とし、前記被推定対象について測定された前記2Dパラメータの測定値の情報が前記クラス毎の頻度の形式で表された入力頻度情報を入力として、同種類の前記2Dパラメータについて前記入力頻度情報と前記登録2D頻度情報に基づく対比情報との差分を評価することで、前記入力頻度情報と前記2D-3D変換情報とを関連付け、関連付けられた前記2D-3D変換情報の前記登録3Dパラメータ情報に基づき前記被推定対象の前記3Dパラメータを推定する3Dパラメータ推定工程を実施することを特徴とする3Dパラメータ推定方法。
Priority Applications (1)
| Application Number | Priority Date | Filing Date | Title |
|---|---|---|---|
| JP2019557033A JP6879595B2 (ja) | 2017-11-28 | 2018-10-01 | 3dパラメータ推定装置、3dパラメータ推定プログラム及び3dパラメータ推定方法 |
Applications Claiming Priority (2)
| Application Number | Priority Date | Filing Date | Title |
|---|---|---|---|
| JP2017227624 | 2017-11-28 | ||
| JP2017-227624 | 2017-11-28 |
Publications (1)
| Publication Number | Publication Date |
|---|---|
| WO2019106940A1 true WO2019106940A1 (ja) | 2019-06-06 |
Family
ID=66663897
Family Applications (1)
| Application Number | Title | Priority Date | Filing Date |
|---|---|---|---|
| PCT/JP2018/036668 Ceased WO2019106940A1 (ja) | 2017-11-28 | 2018-10-01 | 3dパラメータ推定装置、3dパラメータ推定プログラム及び3dパラメータ推定方法 |
Country Status (2)
| Country | Link |
|---|---|
| JP (1) | JP6879595B2 (ja) |
| WO (1) | WO2019106940A1 (ja) |
Cited By (3)
| Publication number | Priority date | Publication date | Assignee | Title |
|---|---|---|---|---|
| CN111899342A (zh) * | 2020-06-29 | 2020-11-06 | 中铁第一勘察设计院集团有限公司 | 基于中心数据库的图形建立方法和装置 |
| JP2021099233A (ja) * | 2019-12-20 | 2021-07-01 | 国立研究開発法人産業技術総合研究所 | 三次元の片刃分布の推定プログラム、方法及び装置 |
| CN117606991A (zh) * | 2023-10-23 | 2024-02-27 | 深地科学与工程云龙湖实验室 | 岩土颗粒的三维参数获取方法、装置、设备和存储介质 |
Citations (1)
| Publication number | Priority date | Publication date | Assignee | Title |
|---|---|---|---|---|
| JPH08136439A (ja) * | 1994-11-04 | 1996-05-31 | Toa Medical Electronics Co Ltd | 粒子画像分析装置 |
-
2018
- 2018-10-01 JP JP2019557033A patent/JP6879595B2/ja active Active
- 2018-10-01 WO PCT/JP2018/036668 patent/WO2019106940A1/ja not_active Ceased
Patent Citations (1)
| Publication number | Priority date | Publication date | Assignee | Title |
|---|---|---|---|---|
| JPH08136439A (ja) * | 1994-11-04 | 1996-05-31 | Toa Medical Electronics Co Ltd | 粒子画像分析装置 |
Non-Patent Citations (1)
| Title |
|---|
| YANAGISAWA, OSAMU: "Evaluation of spatial distribution of graphite in spheroidal graphite cast irons", JOURNAL OF JAPAN FOUNDRY ENGINEERING SOCIETY, vol. 73, no. 11, 25 November 2001 (2001-11-25), pages 733 - 740, XP055615290 * |
Cited By (4)
| Publication number | Priority date | Publication date | Assignee | Title |
|---|---|---|---|---|
| JP2021099233A (ja) * | 2019-12-20 | 2021-07-01 | 国立研究開発法人産業技術総合研究所 | 三次元の片刃分布の推定プログラム、方法及び装置 |
| JP7333956B2 (ja) | 2019-12-20 | 2023-08-28 | 国立研究開発法人産業技術総合研究所 | 三次元の片刃分布の推定プログラム、方法及び装置 |
| CN111899342A (zh) * | 2020-06-29 | 2020-11-06 | 中铁第一勘察设计院集团有限公司 | 基于中心数据库的图形建立方法和装置 |
| CN117606991A (zh) * | 2023-10-23 | 2024-02-27 | 深地科学与工程云龙湖实验室 | 岩土颗粒的三维参数获取方法、装置、设备和存储介质 |
Also Published As
| Publication number | Publication date |
|---|---|
| JP6879595B2 (ja) | 2021-06-02 |
| JPWO2019106940A1 (ja) | 2020-12-10 |
Similar Documents
| Publication | Publication Date | Title |
|---|---|---|
| Wagner et al. | Efficient computation of persistent homology for cubical data | |
| González | Measurement of areas on a sphere using Fibonacci and latitude–longitude lattices | |
| US8412492B2 (en) | System and method for fitting feature elements using a point-cloud of an object | |
| Gommes et al. | Density of states for a specified correlation function and the energy landscape | |
| CN107102016B (zh) | 一种基于晶体结构的原子尺度晶体取向分析方法 | |
| CN105359163A (zh) | 用于将基元形状拟合到3d点的集合的方法 | |
| Klitgaard et al. | Implementing quantum Ricci curvature | |
| KR20180004226A (ko) | 고전적 프로세서 상에서 양자-유사 계산을 에뮬레이트하기 위한 퀀톤 표현 | |
| JP6879595B2 (ja) | 3dパラメータ推定装置、3dパラメータ推定プログラム及び3dパラメータ推定方法 | |
| CN104731847B (zh) | 搜索方法、搜索程序以及搜索装置 | |
| CN101937453B (zh) | 一种基于加权拓扑约束比较的三维模型检索方法 | |
| Fang et al. | Temperature distribution descriptor for robust 3D shape retrieval | |
| CN103473464B (zh) | 基于量子遗传算法的货物装载三维布局优化方法及系统 | |
| CN104392253A (zh) | 一种草图数据集的交互式类别标注方法 | |
| JP5034941B2 (ja) | コンピュータ読み出し可能媒体、システム及び方法 | |
| CN101350035A (zh) | 基于内容的三维模型检索方法试验平台 | |
| Antoniadis et al. | A PTAS for Euclidean TSP with hyperplane neighborhoods | |
| US10529444B1 (en) | System that rapidly generates a solvent-excluded surface | |
| Zhang et al. | Statistical properties of filaments in the cosmic web | |
| Miller et al. | The maximum degree and diameter-bounded subgraph in the mesh | |
| CN114627263A (zh) | 一种基于变异粒子群优化算法的三维产权体视角选择方法 | |
| Creasey | Tree-less 3d friends-of-friends using spatial hashing | |
| CN108021716B (zh) | 一种基于径向坐标优化的多维数据可视化方法和装置 | |
| EP4523181A1 (en) | Training method for training a machine learning algorithm, segmentation method, computer program product and segmentation device | |
| Walker | Visualising multi-objective populations with treemaps |
Legal Events
| Date | Code | Title | Description |
|---|---|---|---|
| 121 | Ep: the epo has been informed by wipo that ep was designated in this application |
Ref document number: 18882643 Country of ref document: EP Kind code of ref document: A1 |
|
| ENP | Entry into the national phase |
Ref document number: 2019557033 Country of ref document: JP Kind code of ref document: A |
|
| NENP | Non-entry into the national phase |
Ref country code: DE |
|
| 122 | Ep: pct application non-entry in european phase |
Ref document number: 18882643 Country of ref document: EP Kind code of ref document: A1 |