WO2019043859A1 - Inspection system, inspection method, and program - Google Patents
Inspection system, inspection method, and program Download PDFInfo
- Publication number
- WO2019043859A1 WO2019043859A1 PCT/JP2017/031308 JP2017031308W WO2019043859A1 WO 2019043859 A1 WO2019043859 A1 WO 2019043859A1 JP 2017031308 W JP2017031308 W JP 2017031308W WO 2019043859 A1 WO2019043859 A1 WO 2019043859A1
- Authority
- WO
- WIPO (PCT)
- Prior art keywords
- equation
- state
- wheelset
- track
- motion
- Prior art date
Links
Images


Classifications
-
- B—PERFORMING OPERATIONS; TRANSPORTING
- B61—RAILWAYS
- B61L—GUIDING RAILWAY TRAFFIC; ENSURING THE SAFETY OF RAILWAY TRAFFIC
- B61L23/00—Control, warning, or like safety means along the route or between vehicles or vehicle trains
- B61L23/04—Control, warning, or like safety means along the route or between vehicles or vehicle trains for monitoring the mechanical state of the route
- B61L23/042—Track changes detection
-
- B—PERFORMING OPERATIONS; TRANSPORTING
- B61—RAILWAYS
- B61K—AUXILIARY EQUIPMENT SPECIALLY ADAPTED FOR RAILWAYS, NOT OTHERWISE PROVIDED FOR
- B61K9/00—Railway vehicle profile gauges; Detecting or indicating overheating of components; Apparatus on locomotives or cars to indicate bad track sections; General design of track recording vehicles
- B61K9/08—Measuring installations for surveying permanent way
-
- G—PHYSICS
- G01—MEASURING; TESTING
- G01B—MEASURING LENGTH, THICKNESS OR SIMILAR LINEAR DIMENSIONS; MEASURING ANGLES; MEASURING AREAS; MEASURING IRREGULARITIES OF SURFACES OR CONTOURS
- G01B21/00—Measuring arrangements or details thereof, where the measuring technique is not covered by the other groups of this subclass, unspecified or not relevant
Definitions
- the present invention relates to an inspection system, an inspection method, and a program, and is particularly suitable for use in inspecting a track of a railway vehicle.
- Patent Document 1 describes a measurement apparatus including a laser light irradiation unit, a traveling unit, and a light receiving unit.
- the irradiation unit is fixed to one rail.
- the traveling unit travels on a rail to which the irradiation unit is fixed.
- the light receiving unit is attached to the traveling unit.
- the light receiving unit has a detection unit that detects a light receiving position of the laser light.
- the shape of the detection portion is planar in a cross section substantially orthogonal to the extending direction of the rail.
- the advancing of the traveling portion by the distance L, the retraction of the traveling portion by the distance L / 2, and the advancing of the traveling portion by the distance L are repeatedly performed. By running the traveling unit such that a part of the measurement range of the light receiving unit overlaps, the amount of track deviation at the curved portion of the track is measured.
- Patent Document 1 is a method of directly measuring the orbital irregularity. This requires expensive measuring equipment. Further, in the method described in Patent Document 1, the traveling unit repeats forward and backward. For this reason, it is not possible to detect track irregularities while the sales vehicle is traveling.
- the present invention has been made in view of the above problems, and it is an object of the present invention to be able to detect irregularities in a curved portion of a track of a railway vehicle without using a special measuring device. .
- An inspection system comprises: data acquisition means for acquiring measurement data which is time-series data of measurement values measured by causing a railway vehicle having a vehicle body, a bogie and a wheelset to travel on a track; Frequency adjustment means for reducing the signal strength of low frequency components generated due to the railway vehicle traveling in the curved portion of the track from time series data of physical quantities whose values change according to the state; Track condition deriving means for deriving information reflecting the condition, the measurement data including a measurement value of longitudinal force, the longitudinal force comprising the wheel axle and the carriage provided with the wheel axle The force is a force in the front-rear direction generated in the member disposed between the two, the member is a member for supporting the axle box, the front-rear direction is a direction along the traveling direction of the railway vehicle, and the frequency Key
- the first means reduces the signal strength of the low frequency component generated due to the railway vehicle traveling on the curved portion of the track from the time series data of the measured values of the longitudinal force which is the physical quantity.
- the track state deriving means includes frequency adjustment means, and a relational expression indicating a relation between the information reflecting the state of the track at the position of the wheelset and the longitudinal force, and the first frequency adjustment means.
- Information that reflects the state of the orbit is derived using the value of the front-back direction force in which the signal strength of the low frequency component is reduced, and the relational expression is an expression that does not include the radius of curvature of the rail It is characterized by
- the inspection method includes a data acquisition step of acquiring measurement data which is time-series data of measurement values measured by causing a railway vehicle having a vehicle body, a bogie, and a wheelset to travel on a track.
- the frequency adjustment step of reducing the signal strength of the low frequency component generated due to the railway vehicle traveling on the curved portion of the track from the time series data of the physical quantity whose value fluctuates according to the state;
- the force is a force in the front-rear direction generated in the member disposed between the two, the member is a member for supporting the axle box, the front-rear direction is a direction along the traveling direction of the railway vehicle, and the frequency Adjuster
- the track state derivation step is a relational expression indicating a relationship between information reflecting the state of the track at the position of the wheelset and the longitudinal force, and a low value by the first frequency adjustment step.
- Information that reflects the state of the trajectory is derived using the value of the front-back direction force in which the signal strength of the frequency component is reduced, and the relational expression is an expression based on an expression that does not include the radius of curvature of the rail. It is characterized by
- a program according to the present invention comprises a data acquisition step of acquiring measurement data which is time-series data of measurement values measured by causing a railway vehicle having a car body, a bogie and a wheelset to travel on a track, and a state of the railway vehicle
- the frequency adjustment step of reducing the signal strength of the low frequency component generated due to the railway vehicle traveling on the curved portion of the track from the time series data of the physical quantity whose value fluctuates according to the state of the track
- the measurement data includes a measurement value of longitudinal force
- the longitudinal force includes the wheel shaft and the bogie provided with the wheel shaft
- a member for supporting the axle box wherein the fore-and-aft direction is a direction along the traveling direction of the railway vehicle.
- the frequency adjustment step reduces signal strength of low frequency components generated due to the railway vehicle traveling along a curved portion of the track from time-series data of measured values of the longitudinal force which is the physical quantity.
- a first frequency adjustment step, and the trajectory state derivation step is a relational expression indicating a relationship between information reflecting the condition of the trajectory at the position of the wheelset and the longitudinal force, and the first Information that reflects the state of the trajectory is derived using the value of the longitudinal force in which the signal strength of the low frequency component is reduced by the frequency adjustment step, and the relational expression does not include the radius of curvature of the rail It is characterized by being an expression based on an expression.
- FIG. 1 is a diagram showing an example of a railway vehicle.
- FIG. 2 is a diagram conceptually showing the direction of the main movement of the components of the railway vehicle.
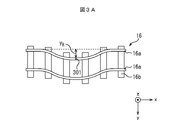
- FIG. 3A is a diagram showing an example of the amount of deviation in a straight track.
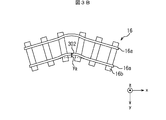
- FIG. 3B is a diagram showing an example of the amount of deviation in a curved track.
- FIG. 4 is a diagram showing an example of the interaction between the amount of run-in and the movement of the components of the railway vehicle.
- FIG. 5 is a diagram showing an example of the interaction between the amount of run-in and the movement of the components of the railway vehicle using the front-rear direction force.
- FIG. 6 is a diagram showing an example of the operational relationship required to determine the motion of the component that directly acts on the yaw of the wheelset.
- FIG. 7 is a diagram showing an example of an operational relationship required to determine the amount of deviation.
- FIG. 8 is a diagram showing a first example of a functional configuration of the inspection apparatus.
- FIG. 9 is a diagram showing an example of the hardware configuration of the inspection apparatus.
- FIG. 10 is a flowchart showing a first example of pre-processing in the inspection apparatus.
- FIG. 11 is a flowchart showing a first example of the process in the inspection apparatus.
- FIG. 12 is a diagram showing an example of the distribution of the eigenvalues of the autocorrelation matrix.
- FIG. 13 is a diagram showing an example of time-series data (measurement value) of measured values of longitudinal force and time-series data (calculated value) of predicted values of longitudinal force.
- FIG. 14 is a diagram showing an example of time series data of high frequency components of front and rear direction force.
- FIG. 15 is a view showing an example of time-series data of the amount of deviation at each wheelset.
- FIG. 16 is a diagram showing an example of time series data of the final deviation amount and the curvature of the track 16 (rail).
- FIG. 17 is a diagram showing a second example of the functional configuration of the inspection apparatus.
- FIG. 18 is a flowchart showing a second example of pre-processing in the inspection apparatus.
- FIG. 19 is a flowchart showing a second example of the main process in the inspection apparatus.
- FIG. 20 is a diagram showing an example of the configuration of the inspection system.
- FIG. 1 is a diagram showing an example of a railway vehicle.
- a railway vehicle is assumed to travel in the positive direction of the x-axis (the x-axis is an axis along the traveling direction of the railway vehicle).
- the z axis is perpendicular to the track 16 (ground) (in the height direction of the railway vehicle).
- the y-axis is assumed to be a horizontal direction perpendicular to the traveling direction of the railcar (a direction perpendicular to both the traveling direction and the height direction of the railcar).
- a railway vehicle shall be a sales vehicle.
- a circle with a circle indicates a direction from the back side to the front side of the drawing. In FIG. 1, this direction is the positive direction of the y-axis. In FIG. 3, this direction is the positive direction of the z-axis.
- the railway vehicle has a vehicle body 11, bogies 12a and 12b, and wheel sets 13a to 13d.
- a railway vehicle including two bogies 12a and 12b and four sets of wheel sets 13a to 13d in one vehicle body 11 will be described as an example.
- the wheelset 13a-13d has axles 15a-15d and wheels 14a-14d provided at both ends thereof.
- bogies 12a and 12b are bolsterless bogies will be described as an example.
- the carriages 12a and 12b have a carriage frame, a pillow spring, and the like.
- axle boxes are disposed on both sides in the left-right direction of the respective wheel sets 13a to 13d.
- the bogie frame and the axle box are mutually coupled by the axle box support device.
- the axle box support device is a device (suspension) disposed between the axle box and the bogie frame.
- the axle box supporting device absorbs the vibration transmitted from the track 16 to the railway vehicle.
- the axle box support device is configured to prevent the axle box from moving in the direction along the x-axis and the direction along the y-axis with respect to the bogie frame (preferably, so that the movement does not occur)
- the axle box is supported in a state where the position of the wheel with respect to the bogie frame is restricted
- the axle box support devices are disposed on both sides in the direction along the y-axis of each wheelset 13a-13d.
- the detailed description thereof is omitted here.
- FIG. 2 is a view conceptually showing the main movement directions of the components of the railway vehicle (wheel axles 13a to 13d, carriages 12a and 12b, and vehicle body 11).
- the x-axis, y-axis and z-axis shown in FIG. 2 correspond to the x-axis, y-axis and z-axis shown in FIG. 1, respectively.
- the wheel shafts 13a to 13d, the bogies 12a and 12b, and the vehicle body 11 rotate with the x axis as a rotation axis and with the z axis as a rotation axis.
- the case of performing movement in the direction along the y-axis will be described as an example.
- the movement of rotating about the x axis as the rotation axis is referred to as rolling if necessary, and the rotation direction about the x axis as the rotation axis is referred to as the rolling direction as needed along the x axis
- the direction is referred to as the front-rear direction as needed.
- the front-rear direction is the traveling direction of the railway vehicle.
- the direction along the x-axis is the traveling direction of the railway vehicle.
- the movement of rotating about the z axis as the rotation axis is referred to as yawing as required, and the rotation direction about the z axis as the rotation axis is referred to as the yawing direction as necessary, and a direction along the z axis is required. It is called up and down direction according to.
- the vertical direction is a direction perpendicular to the track 16.
- movement in a direction along the y-axis is referred to as lateral vibration as needed, and a direction along the y-axis is referred to as left-right direction as needed.
- the left-right direction is a direction perpendicular to both the front-rear direction (the running direction of the railway vehicle) and the vertical direction (the direction perpendicular to the track 16).
- the railcar also performs other exercises, but in each embodiment, these exercises are not considered in order to simplify the description. However, these movements may be taken into account.
- the inventors of the present invention have the force in the front-rear direction generated in the member disposed between the wheel sets 13a to 13b (13c to 13d) and the carriage 12a (12b) on which the wheel sets 13a to 13b (13c to 13d) are provided.
- a method of calculating the amount of deviation as an example of information reflecting the track irregularity (defect on the appearance of the track 16) using the measured values was conceived.
- the force in the front-rear direction generated in this member will be referred to as the front-rear direction force as needed.
- the amount of deviation is an equation based on an equation of motion that describes the movement of the railway vehicle when traveling on a straight track, and is calculated using an equation that indicates the relationship between the amount of deviation and the longitudinal force.
- the track 16 includes straight and curved portions.
- the straight part of the track 16 will be referred to as a straight track as required
- the curved part of the track 16 will be referred to as a curved track as required.
- the equation of motion describing the motion of a railway vehicle traveling on a curved track it is necessary to take into consideration the centrifugal force or the like that the railway vehicle receives when traveling.
- the equation of motion describing the motion of a railcar traveling on a curved track includes a term that includes the radius of curvature of the rail. Therefore, the measurement error of the front-rear direction force is likely to be reflected on the accuracy of the deviation amount, and there is a possibility that the deviation amount can not be calculated with high accuracy.
- the present inventors focused on the fact that when the railway vehicle travels on a curved track, the measured value of the longitudinal force has a certain bias, as opposed to traveling on a straight track.
- the component of the fore-aft direction force due to the deviation is the same whether it is a curvilinear trajectory or a linear trajectory. Therefore, the inventors consider that the amount of deviation as such is irrelevant to the amount of the bias, and reduces the low frequency component (the behavior of the bias) from the time series data of the measured values of the back and forth force. I thought it would be fine.
- the inventors of the present invention are time-series data of the value of the longitudinal force with reduced low frequency components, an equation based on an equation of motion that describes the motion during traveling of the straight track of the railway vehicle, By giving an equation showing the relationship between the amount of deviation and the force in the back and forth direction, I thought of calculating the amount of deviation.
- the amount of deviation in a curved track is calculated despite the use of an equation based on an equation of motion that describes the movement of the railway vehicle when traveling in a straight track. be able to.
- the formula for calculating the amount of deviation is the same formula whether it is a curved track or a straight track.
- the degree of freedom is not limited to 21 degrees of freedom. Increasing the degree of freedom improves the calculation accuracy but increases the calculation load. In addition, there is a possibility that the operation of a Kalman filter described later may not be stable.
- the degree of freedom can be appropriately determined in consideration of these points.
- the following equation of motion is for example, non-patent document 1 to operate the respective components (the vehicle body 11, the carriages 12a and 12b, and the wheel axles 13a to 13d) in the respective directions (horizontal direction, yawing direction and rolling direction). This can be realized by expressing based on the description of 2). Therefore, here, the outline of each equation of motion will be described, and the detailed description will be omitted.
- each of the following equations is an equation expressing that a railway vehicle travels on a straight track.
- the expression expressing that a railway vehicle travels on a curved track expressing that the railway vehicle travels on a straight track by setting the curvature radius of the track 16 (rail) to infinity (curvature is 0 (zero)) The equation to obtain is obtained.
- the suffix w represents the wheel sets 13a to 13d.
- the variable with the suffix w (only) indicates that it is common to the wheel sets 13a to 13d.
- the suffixes w1, w2, w3 and w4 represent the wheel sets 13a, 13b, 13c and 13d, respectively.
- the subscripts t and T represent the carriages 12a and 12b.
- the variables with suffixes t and T (only) indicate that they are common to the bogies 12a and 12b.
- the subscripts t1 and t2 represent the carriages 12a and 12b, respectively.
- the suffixes b and B indicate that the vehicle body 11 is used.
- the subscript x represents the longitudinal direction or the rolling direction
- the subscript y represents the lateral direction
- the subscript z represents the vertical direction or the yawing direction.
- “ ⁇ above the variable represents the second order time derivative and the first order time derivative, respectively.
- m w is the mass of the wheel sets 13a to 13d.
- y w1 ... (where in the formula... is added above y w1 (hereinafter, the same applies to other variables as well)) is an acceleration in the left-right direction of the wheel shaft 13a.
- f 2 is a lateral creep coefficient.
- v is the traveling speed of the railway vehicle.
- y w1 ⁇ (in the formula, ⁇ ⁇ added above y w1 (hereinafter, the same applies to other variables)) is the velocity in the left-right direction of the wheel set 13a.
- C wy is a damping constant in the left-right direction of an axle box supporting device connecting the axle box and the wheelset .
- y t1 ⁇ is the velocity in the left-right direction of the carriage 12a.
- “a” represents one half of the distance between the wheelset 13a, 13b, 13c, 13d provided on the carriages 12a, 12b in the front-rear direction (wheelset 13a, 13b, 13c, 13d provided on the carriages 12a, 12b The distance between will be 2a).
- [psi t1 ⁇ is the angular velocity in the yawing direction of the carriage 12a.
- h 1 is the distance in the vertical direction between the center of gravity and the center of the truck 12a of the axle.
- ⁇ t1 ⁇ is the angular velocity in the rolling direction of the carriage 12a.
- W w1 is the amount of rotation (angular displacement) in the yawing direction of the wheel set 13a.
- K wy is a spring constant in the lateral direction of the axle box support device.
- y w1 is a displacement of the wheel set 13 a in the left-right direction.
- y t1 is a displacement in the left-right direction of the carriage 12a.
- ⁇ t1 is the amount of rotation (angular displacement) in the yawing direction of the carriage 12a.
- ⁇ t1 is the amount of rotation (angular displacement) in the rolling direction of the carriage 12a.
- the variables in the equations (2) to (4) are expressed by replacing the variables in the equation (1) according to the meaning of the subscripts described above.
- I wz is a moment of inertia in the yawing direction of the wheel sets 13a to 13d.
- [psi w1 ⁇ ⁇ is the angular acceleration in the yawing direction of the wheel shaft 13a.
- f 1 is the longitudinal creep factor.
- b is the distance in the left-right direction between the contact points of the two wheels attached to the wheel sets 13a to 13d and the track 16 (rail).
- [psi w1 ⁇ is the angular velocity in the yawing direction of the wheel shaft 13a.
- C wx is a damping constant in the longitudinal direction of the axle box support device.
- b 1 is the left-right direction represents the 1/2 of the interval in the axle box support device (spacing in the lateral direction of the two axle box support device which is provided to the left and right with respect to a single wheel set will 2b 1).
- ⁇ is a tread slope.
- r is the radius of the wheels 14a-14d.
- y R1 is a deviation amount at the position of the wheel set 13a.
- s a is an offset amount in the front-rear direction from the center of the axles 15a to 15d to the axle box support spring.
- y t1 is a displacement in the left-right direction of the carriage 12a.
- K wx is a longitudinal spring constant of the axle box support device.
- FIGS. 3A and 3B show an example of the amount of deviation y R1 at the position of the wheel set 13a.
- FIG. 3A the case where the orbit 16 is a linear orbit will be described as an example.
- FIG. 3B the case where the orbit 16 is a curved orbit will be described as an example.
- 16a shows a rail and 16b shows a tie.
- FIG. 3A it is assumed that the wheel 14a of the wheelset 13a is in contact with the rail 16a at the position 301.
- the amount of deviation y R1 at the position of the wheel set 13a is the distance between the contact position of the wheel 14a of the wheel set 13a and the rail 16a and the position of the rail 16a when assuming the normal state.
- the position of the wheelset 13a is the contact position between the wheel 14a of the wheelset 13a and the rail 16a.
- Wheel shaft 13b, 13c, as deviation amount at the position of 13d y R2, y R3, y R4 is also defined as in as deviation amount y R1 at the position of the wheel shaft 13a.
- m T is the mass of the carriages 12a and 12b.
- y t1 .. is the acceleration in the left-right direction of the carriage 12a.
- c ' 2 is a damping constant of the left and right movement damper.
- h 4 is the distance in the vertical direction between the center of gravity of the carriage 12a and lateral movement damper.
- y b ⁇ is the velocity in the left-right direction of the vehicle body 11.
- L represents one half of the distance between the centers of the bogies 12a and 12b in the front-rear direction (the distance between the centers of the bogies 12a and 12b in the front-rear direction is 2L).
- [psi b ⁇ is an angular velocity in the yawing direction of the vehicle body 11.
- h 5 is the distance in the vertical direction between the center of gravity of the lateral movement damper and the vehicle body 11.
- ⁇ b is the angular velocity in the rolling direction of the vehicle body 11.
- y w2 ⁇ is the speed in the left-right direction of the wheel set 13b.
- k ' 2 is the spring constant of the air spring (pillow spring) in the left-right direction.
- h 2 is the distance in the vertical direction between the center of the bogie 12a, 12b of the center of gravity and the air spring (pillow spring).
- y b is a displacement of the vehicle body 11 in the left-right direction.
- ⁇ b is the amount of rotation (angular displacement) in the yawing direction of the vehicle body 11.
- h 3 is the distance in the vertical direction between the center of gravity and the center of the vehicle body 11 of the air spring (pillow spring).
- ⁇ b is the amount of rotation (angular displacement) in the rolling direction of the vehicle body 11.
- Equations of motion describing the yawing of the carriages 12a and 12b are expressed by the following equations (11) and (12).
- I Tz is a moment of inertia in the yawing direction of the bogies 12a, 12b.
- ⁇ t1 ⁇ is the angular acceleration in the yawing direction of the carriage 12a.
- [psi w2 ⁇ is the angular velocity in the yawing direction of the wheel axle 13b.
- W w2 is the amount of rotation (angular displacement) of the wheel set 13b in the yawing direction.
- y w2 is a displacement of the wheel set 13b in the left-right direction.
- k ' 0 is the rubber bushing stiffness of the yaw damper.
- b ' 0 represents one half of the interval in the left and right direction of the two yaw dampers disposed on the left and right with respect to the carriages 12a and 12b (the interval in the left and right direction of the two yaw dampers disposed on the left and right with respect to the carriages 12a and 12b Becomes 2b 0 0 ).
- ⁇ y1 is the amount of rotation (angular displacement) in the yawing direction of the yaw damper disposed on the carriage 12a.
- k ′ ′ 2 is a spring constant in the left-right direction of the air spring (pillow spring).
- b 2 is carriage 12a, 12b to represent the 1/2 distance in the lateral direction of the two air springs which are disposed on the left and right (pillow spring) (carriage 12a, two air springs which are disposed on the left and right with respect to 12b (The distance between the pillow springs in the lateral direction is 2 b 2 ).
- Each variable of the equation (12) is expressed by replacing the variable of the equation (11) according to the meaning of the subscripts described above.
- I Tx is a moment of inertia in the rolling direction of the carriages 12a and 12b.
- ⁇ t1 ⁇ ⁇ ⁇ is the angular acceleration in the rolling direction of the carriage 12a.
- c 1 is a damping constant in the vertical direction of the axial damper.
- b ' 1 represents 1/2 of the interval in the left and right direction of the two axis dampers disposed on the left and right with respect to the bogies 12a and 12b (the left and right direction of the two axis dampers disposed on the left and right with respect to the bogies 12a and 12b The interval at is 2 b ' 1 )).
- c 2 is a damping constant in the vertical direction of the air spring (pillow spring).
- ⁇ is the angular velocity in the rolling direction of the air spring disposed carriage 12a (pillow spring).
- k 1 is a vertical spring constant of the axial spring.
- ⁇ is a value obtained by dividing the volume of the air spring (pillow spring) main body by the volume of the auxiliary air chamber.
- k 2 is a vertical spring constant of the air spring (pillow spring).
- ⁇ a1 is the amount of rotation (angular displacement) in the rolling direction of the air spring (pillow spring) disposed on the carriage 12a.
- k 3 is an equivalent stiffness due to the change of the effective pressure receiving area of the air spring (pillow spring).
- ⁇ a2 is the amount of rotation (angular displacement) in the rolling direction of the air spring (pillow spring) disposed on the carriage 12 b.
- m B is the mass of the carriages 12a and 12b.
- y b ⁇ ⁇ is the acceleration in the lateral direction of the vehicle body 11.
- y t2 ⁇ is the velocity in the left-right direction of the carriage 12 b.
- ⁇ t2 ⁇ is the angular velocity in the rolling direction of the carriage 12b.
- y t2 is a displacement in the left-right direction of the carriage 12 b.
- ⁇ t2 is the amount of rotation (angular displacement) in the rolling direction of the carriage 12b.
- I Bz is a moment of inertia in the yawing direction of the vehicle body 11.
- [psi b ⁇ ⁇ is the angular acceleration in the yawing direction of the vehicle body 11.
- c 0 is a damping constant in the front-rear direction of the yaw damper.
- ⁇ y1 ⁇ is the angular velocity in the yawing direction of the yaw damper disposed on the carriage 12a.
- ⁇ y2 ⁇ is the angular velocity in the yawing direction of the yaw damper disposed on the carriage 12b.
- ⁇ t2 is the amount of rotation (angular displacement) in the yawing direction of the carriage 12b.
- I Bx is a moment of inertia in the rolling direction of the vehicle body 11.
- phi b ⁇ ⁇ is the angular acceleration in the rolling direction of the vehicle body 11.
- ⁇ y2 is the amount of rotation (angular displacement) in the yawing direction of the yaw damper disposed on the carriage 12b.
- ⁇ a2 ⁇ is the angular velocity in the rolling direction of the air spring (pillow spring) disposed on the carriage 12b.
- FIG. 4 is a diagram showing an example of the interaction between the amount of run-in and the movement of the components of the railway vehicle. Arrows drawn by solid lines indicate the working relationship between different movements in the same component. Arrows drawn with line types other than solid lines indicate the working relationship between the movements of different components.
- Each motion is accompanied by the number of motion equation that describes the motion described in this embodiment. For example, the yawing of the wheel sets 13a to 13d is described by the equations (5) to (8).
- the yawing of the wheel sets 13a to 13d is directly affected by the amount of deviation y R1 to y R4 , the lateral vibration of the wheel sets 13a to 13d, the lateral vibration of the bogies 12a and 12b, and the yawing of the bogies 12a and 12b.
- the lateral vibration of the carriages 12a and 12b is described by the equations (9) to (10).
- the lateral vibration of the carriages 12a and 12b is directly affected by the lateral vibrations of the wheel sets 13a to 13d, the rolling of the carriages 12a and 12b, the lateral vibration of the vehicle body 11, the yawing of the vehicle body 11, the yawing of the carriages 12a and 12b, and the rolling of the vehicle body 11. It receives no direct action from the yawing of the wheel sets 13a to 13d.
- the amount of deviation y R1 to y R4 directly acts on the yawing of the wheel sets 13a to 13d. This action propagates to the movement of the other components.
- An equation of state is created from the equation of motion relating to the motion of a component that is directly or indirectly acted on from the amount of deviation y R1 to y R4 .
- an observation equation is set by measuring a measurable state variable from among motions related to the amount of deviation y R1 to y R4 . Then, by performing an operation using a filter that performs data assimilation, such as a Kalman filter, it is possible to calculate the amount of deviation y R1 to y R4 .
- a filter that performs data assimilation such as a Kalman filter
- the present inventors can perform the yawing of the wheel sets 13 a to 13 d on which the misalignment amounts y R1 to y R4 directly act, and the wheel sets 13 a to 13 d. and calculating accurately and factors acting directly (including the movement of the component) to yawing, and calculating the streets deviation amount y R1 ⁇ y R4 using equations of motion describing the yawing axle 13a ⁇ 13d I thought it would be better to Further, the creep force is decomposed into a longitudinal creep force which is a component in the longitudinal direction and a lateral creep force which is a component in the lateral direction.
- the present inventors obtained the finding that the longitudinal creep force has a high correlation with the amount of misalignment y R1 to y R4 .
- Longitudinal creep force is a force in the front-rear direction generated in a member disposed between the wheel sets 13a to 13b (13c to 13d) and the carriage 12a (12b) on which the wheel sets 13a to 13b (13c to 13d) are provided Direction force). From the above, the inventors have conceived of a method of calculating the amounts of deviation y R1 to y R4 using the measured values of the longitudinal force.
- the component of the same phase as the longitudinal creeping force at one of the left and right wheels of one wheelset and the longitudinal creeping force at the other wheel is a component corresponding to the braking force and the driving force. Therefore, in order to calculate the amounts of deviation y R1 to y R4 even when the railway vehicle is accelerating or decelerating, it is preferable to determine the longitudinal force so as to correspond to the reverse phase component of the longitudinal creep force.
- the reverse phase component of the longitudinal creep force is a component in which the longitudinal creep force at one of the left and right wheels of one wheelset is in opposite phase to the longitudinal creep force at the other wheel. That is, the reverse phase component of the longitudinal creep force is a component of the longitudinal creep force in the direction in which the axle is twisted.
- the front-rear direction force is a component in the opposite phase to each other among the components in the front-rear direction of the force generated in the two members attached to both sides in the left-right direction of one wheelset.
- the axle box support device is a monolink type axle box support device
- the axle box support device includes a link
- the axle box and the carriage frame are connected by the link. Rubber bushes are attached to both ends of this link.
- the front-rear direction force is a component in opposite phase to each other among the components in the front-rear direction of the load received by each of the two links attached respectively to the left-right direction end of one wheelset.
- the link mainly receives the load in the front-rear direction among the loads in the front-rear direction, the left-right direction and the front-rear direction. Therefore, for example, one strain gauge may be attached to each link. By using the measurement value of the strain gauge to derive the component of the load received by the link in the front-rear direction, a measurement value of the front-rear direction force is obtained. Also, instead of doing this, the longitudinal displacement of the rubber bush attached to the link may be measured by a displacement gauge. In this case, the product of the measured displacement and the spring constant of the rubber bush is taken as the measured value of the longitudinal force.
- the axle box support device is a monolink axle box support device
- the above-described member for supporting the axle box is a link or a rubber bush.
- the load measured by the strain gauge attached to the link may include not only the longitudinal component but also at least one of the lateral component and the vertical component.
- the load of the component in the lateral direction and the load of the component in the vertical direction received by the link are sufficiently smaller than the load of the component in the longitudinal direction. Therefore, it is possible to obtain the measurement value of the front-rear direction force with the accuracy required practically by only attaching one strain gauge to each link.
- the measured value of the front-rear direction force may include components other than the front-rear direction component.
- more than two strain gauges may be attached to each link so that vertical and horizontal distortion is cancelled. In this way, it is possible to improve the accuracy of the measured value of the longitudinal force.
- the axle box support device is an axle beam type axle box support device
- the axle box support device includes an axle beam
- the axle box and the bogie frame are connected by the axle beam.
- the axle beam may be integrally formed with the axle box.
- a rubber bush is attached to the end on the carriage frame side of the shaft beam.
- the longitudinal force is a component in opposite phase to each other out of the longitudinal components of the load received by each of the two shaft beams respectively attached to the left and right ends of one wheelset.
- the shaft beam is likely to receive the load in the lateral direction in addition to the load in the longitudinal direction among the loads in the longitudinal direction, the lateral direction, and the vertical direction.
- two or more strain gauges are attached to each shaft beam so that lateral distortion is canceled.
- a measurement value of the longitudinal force is obtained.
- the longitudinal displacement of the rubber bush attached to the shaft beam may be measured with a displacement gauge.
- the product of the measured displacement and the spring constant of the rubber bush is taken as the measured value of the longitudinal force.
- the load measured by a strain gauge attached to the shaft beam may include not only components in the front-rear direction and left-right direction but also components in the vertical direction.
- the vertical component load applied to the shaft beam is sufficiently smaller than the longitudinal component load and the horizontal component load. . Therefore, it is possible to obtain the measurement value of the front / rear direction force having the accuracy required practically, without attaching the strain gauge so as to cancel the load of the vertical component received by the shaft beam.
- the measured longitudinal force may include components other than the longitudinal component, and in addition to the lateral distortion, the distortion in the vertical direction is also canceled by three or more strain gauges May be attached to each shaft beam. In this way, it is possible to improve the accuracy of the measured value of the longitudinal force.
- the axle box support device When the axle box support device is a leaf spring type axle box support device, the axle box support device includes a leaf spring, and the axle box and the carriage frame are connected by the leaf spring. A rubber bush is attached to the end of the leaf spring.
- the front-rear direction force is a component in opposite phase to each other among the components in the front-rear direction of the load received by each of the two plate springs respectively attached to the left-right direction end of one wheelset.
- the leaf spring due to the arrangement configuration of the leaf spring, the leaf spring is likely to receive the load in the lateral direction and the load in the vertical direction in addition to the load in the longitudinal direction among the loads in the longitudinal direction, the lateral direction, and the vertical direction.
- the axle box support device is a leaf spring type axle box support device
- the above-described member for supporting the axle box is a leaf spring or a rubber bush.
- axle box support device As a displacement meter mentioned above, a well-known laser displacement meter and an eddy current displacement meter can be used.
- the method of the axle box support device is a monolink type, an axial beam type, and a leaf spring type has been described as an example, and the longitudinal force has been described.
- the type of axle box support device is not limited to the monolink type, the axial beam type, and the leaf spring type.
- the longitudinal force can be determined in the same manner as the monolink type, the axial beam type, and the leaf spring type in accordance with the method of the axle box support device.
- FIG. 5 is a diagram showing an example of a mutual action relationship between the amount of misalignment y R1 to y R4 and the motion of the component of the railway vehicle using the longitudinal force T 1 to T 4 .
- Formulas for calculating the longitudinal forces T 1 to T 4 formulas for the conversion variables e 1 to e 4 , equations of motion describing lateral vibrations of the wheel sets 13 a to 13 d using the transformation variables e 1 to e 4 , front and back directions
- equations of motion describing the yawing of the wheel sets 13a to 13d when the forces T 1 to T 4 are used will be described later (each of equations (40) to (43) and (26) to (29) , (34) to (37), (64) to (67)).
- FIG. 6 is a diagram showing, from the operational relationship of FIG. 5, the operational relationship necessary for determining the movement of the component that directly acts on the yawing of the wheel sets 13a to 13d.
- the degree of freedom of movement decreases as the yawing of the wheel sets 13a to 13d is eliminated.
- the measured values used in the data assimilation filter such as the Kalman filter increase by the amount of the front-rear direction forces T 1 to T 4 . Therefore, the accuracy of motion information calculated by performing an operation using a filter that performs data assimilation, such as a Kalman filter, is improved.
- FIG. 7 is a diagram showing the operational relationship necessary for determining the deviation amounts y R1 to y R4 from the operational relationship of FIG. 5.
- the transformation variables e 1 to e 4 and the yawing information of the carriages 12 a, 12 b are known. Therefore, the yawing information of the wheel sets 13a to 13d is calculated by using the calculation formulas of the conversion variables e 1 to e 4 (in the example described later, the equations (26) to (29)).
- the conversion variables e 1 to e 4 at this time are directly derived from the values of the front-rear direction forces T 1 to T 4 . Further, the information on the yawing of the bogies 12a and 12b is calculated using the operation relationship of FIG.
- yawing information wheel sets 13a ⁇ 13d the longitudinal direction forces T 1 ⁇ T 4, lateral vibration and carriage 12a constituent movement elements (wheel axis 13a ⁇ 13d that act directly on yawing axle 13a ⁇ 13d, 12b of the Information of the lateral vibration) is known.
- the deviation amounts y R1 to y R4 are calculated by using equations of motion (in the example described later, equations (64) to (67) in the example described below) that describe the yawing of the wheel sets 13a to 13d.
- the accuracy of the information on the yawing of the wheel sets 13a to 13d at this time is improved as compared with the case of calculation using the operational relationship of FIG. 4 as described above.
- the longitudinal forces T 1 to T 4 are measured values.
- the accuracy of the amount of deviation y R1 to y R4 is improved as calculated as described above.
- the case where the amounts of deviation y R1 to y R4 are calculated using the above equations will be described as an example.
- FIG. 8 is a diagram showing an example of a functional configuration of the inspection apparatus 800.
- FIG. 9 is a diagram showing an example of a hardware configuration of the inspection apparatus 800.
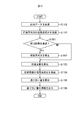
- FIG. 10 is a flowchart showing an example of pre-processing in the inspection apparatus 800.
- FIG. 11 is a flowchart showing an example of this process in the inspection apparatus 800.
- the case where the inspection apparatus 800 is mounted in a railway vehicle is shown as an example.
- the inspection apparatus 800 has, as its functions, a state equation storage unit 801, an observation equation storage unit 802, a data acquisition unit 803, a first frequency adjustment unit 804, a filter operation unit 805, and a second frequency adjustment unit 806. , An orbital state calculation unit 807, and an output unit 808.
- the inspection apparatus 800 includes a CPU 901, a main storage device 902, an auxiliary storage device 903, a communication circuit 904, a signal processing circuit 905, an image processing circuit 906, an I / F circuit 907, a user interface 908, a display 909, and a bus. It has 910.
- the CPU 901 centrally controls the entire inspection apparatus 800.
- the CPU 901 executes a program stored in the auxiliary storage device 903 using the main storage device 902 as a work area.
- the main storage unit 902 temporarily stores data.
- the auxiliary storage device 903 stores various data in addition to the program executed by the CPU 901.
- the auxiliary storage device 903 stores state equations and observation equations described later.
- the state equation storage unit 801 and the observation equation storage unit 802 are realized by using, for example, the CPU 901 and the auxiliary storage device 903.
- the communication circuit 904 is a circuit for communicating with the outside of the inspection apparatus 800.
- the communication circuit 904 receives, for example, information of measured values of longitudinal force and measured values of acceleration in the left-right direction of the vehicle body 11, the bogies 12a and 12b, and the wheel sets 13a to 13d.
- the communication circuit 904 may perform wireless communication with the outside of the inspection apparatus 800 or wire communication.
- the communication circuit 904 is connected to an antenna provided on a railway vehicle when performing wireless communication.
- the signal processing circuit 905 performs various types of signal processing on the signal received by the communication circuit 904 and the signal input according to the control of the CPU 901.
- the data acquisition unit 803 is realized by using, for example, the CPU 901, the communication circuit 904, and the signal processing circuit 905.
- the first frequency adjustment unit 804, the filter operation unit 805, the second frequency adjustment unit 806, and the orbit state calculation unit 807 are realized by using, for example, the CPU 901 and the signal processing circuit 905.
- An image processing circuit 906 performs various types of image processing on signals input according to control by the CPU 901.
- the signal subjected to the image processing is output to the display 909.
- the user interface 908 is a portion where the operator instructs the inspection apparatus 800.
- the user interface 908 includes, for example, buttons, switches, and dials.
- the user interface 908 may also have a graphical user interface using the display 909.
- the display 909 displays an image based on the signal output from the image processing circuit 906.
- the I / F circuit 907 exchanges data with a device connected to the I / F circuit 907.
- a user interface 908 and a display 909 are shown as devices connected to the I / F circuit 907.
- devices connected to the I / F circuit 907 are not limited to these.
- a portable storage medium may be connected to the I / F circuit 907.
- at least a portion of user interface 908 and display 909 may be external to inspection apparatus 800.
- the output unit 808 is realized, for example, by using at least one of the communication circuit 904 and the signal processing circuit 905, and the image processing circuit 906, the I / F circuit 907, and the display 909.
- the CPU 901, the main storage device 902, the auxiliary storage device 903, the signal processing circuit 905, the image processing circuit 906, and the I / F circuit 907 are connected to the bus 910. Communication between these components takes place via a bus 910.
- the hardware of the inspection apparatus 800 is not limited to that shown in FIG. 9 as long as the functions of the inspection apparatus 800 described later can be realized.
- the state equation storage unit 801 stores a state equation.
- equations of motion describing the yawing of the wheel axles 13a to 13d of the equations (5) to (8) are not included in the equation of state.
- the equations (5) to (8) include the amount of deviation y R1 to y R4 .
- a model of the trajectory 16 is required. Passage can not be described according to physical laws.
- the equation of state is configured as follows without including the equation of motion describing the yawing of the wheelset 13a to 13d of the equations (5) to (8) in the following equation. .
- an equation of motion describing the lateral vibration (movement in the horizontal direction) of the carriages 12a and 12b of the equations (9) and (10) and the rolling of the carriages 12a and 12b of the equations (13) and (14) are described Equation of motion, equation of motion describing lateral vibration (movement in the lateral direction) of the vehicle body 11 of equation (15), equation of motion describing yawing of vehicle body 11 of equation (16), and vehicle body of equation (17) Equation (18), equation (19), the yaw damper disposed on the carriage 12a, equation of motion describing the yawing of the yaw damper disposed on the carriage 12b, equation (20), 21)
- the equations of motion describing the lateral vibration (movement in the horizontal direction) of the wheel sets 13a to 13d of the equations (1) to (4) and the yawing of the carriages 12a and 12b of the equations (11) and (12) are described.
- the equations of motion to be performed include rotational amounts (angular displacements) ⁇ w1 to ⁇ w4 and angular velocities ⁇ w1 to ⁇ w4 in the yawing direction of the wheel sets 13a to 13d.
- an equation of motion that describes the yawing of the wheel sets 13a to 13d in the equations (5) to (8) is not included in the state equation. Therefore, in the present embodiment, a state equation is configured using the ones obtained by eliminating these variables from the equations (1) to (4) and the equations (11) and (12) as follows.
- the longitudinal forces T 1 to T 4 at the wheel sets 13 a to 13 d are expressed by the following equations (22) to (25).
- the front-rear direction force T 1 ⁇ T 4 according to the difference between the yawing direction angular displacement ⁇ w1 ⁇ ⁇ w4 wheelset, the angular displacement ⁇ t1 ⁇ ⁇ t2 in the yawing direction of the truck in which the wheel sets are provided It becomes settled.
- the conversion variables e 1 to e 4 are defined as in the following equations (26) to (29).
- the conversion variables e 1 ⁇ e 4 is defined by the difference between the yawing direction angular displacement ⁇ t1 ⁇ ⁇ t2 and Wajiku the yawing direction angular displacement ⁇ w1 ⁇ ⁇ w4 of the truck.
- Converting the variable e 1 ⁇ e 4 is a variable for converting the yawing direction angular displacement ⁇ w1 ⁇ ⁇ w4 in the yawing direction angular displacement ⁇ t1 ⁇ ⁇ t2 and Wajiku bogie another.
- the equation of motion describing the lateral vibration (movement in the left-right direction) of the wheel sets 13a to 13d in the equations (1) to (4) is expressed using the conversion variables e 1 to e 4 to
- the amount of rotation (angular displacement) ⁇ w1 to ⁇ w4 in the yawing direction of the wheel sets 13a to 13d included in the equation of motion can be eliminated.
- equations (26) to (29) are substituted into equations (22) to (25), the following equations (40) to (43) are obtained.
- an equation of motion that describes the lateral vibration (movement in the left and right direction) of the wheel sets 13a to 13d is represented as in Eqs. (34) to (37), and Eq. 39)
- the equations of motion describing the yawing of the carriages 12a and 12b are expressed as in the equation 39, and these are used to construct a state equation.
- the equations (40) to (43) are ordinary differential equations, and the actual values of the conversion variables e 1 to e 4 which are the solutions thereof are the values of the longitudinal forces T 1 to T 4 at the wheelset 13 a to 13 d.
- the values of the longitudinal forces T 1 to T 4 are attributed to the railway vehicle traveling along the curved portion of the track based on the time-series data of the measured values of the longitudinal force by the first frequency adjustment unit 804 described later. Signal strength of the low frequency component that is generated.
- the actual values of the conversion variables e 1 to e 4 thus obtained are given to the equations (34) to (37). Further, the values of the longitudinal forces T 1 to T 4 at the wheel sets 13 a to 13 d are given to the equations (38) and (39).
- the values of the longitudinal forces T 1 to T 4 are attributed to the railway vehicle traveling along the curved portion of the track based on the time-series data of the measured values of the longitudinal force by the first frequency adjustment unit 804 described later. Signal strength of the low frequency component that is generated.
- the variables represented by the following equation (44) are state variables, and the motions of the equations (9), (10), (13) to (21), and (34) to (39) Construct a state equation using an equation.
- the state equation storage unit 801 inputs and stores the state equation configured as described above based on the operation of the user interface 908 by the operator.
- observation equation storage unit 802 stores an observation equation.
- the acceleration in the lateral direction of the vehicle body 11, the acceleration in the lateral direction of the bogies 12a and 12b, and the acceleration in the lateral direction of the wheel sets 13a to 13d are used as observation variables.
- This observation variable is an observation variable of the filtering by the Kalman filter mentioned later.
- observation equations are configured using the motion equations describing the lateral vibration of the equations (34) to (37), (9), (10), and (15).
- the observation equation storage unit 802 for example, inputs and stores an observation equation configured in this way based on the operation of the user interface 908 by the operator.
- the data acquisition unit 803, the first frequency adjustment unit 804, the filter operation unit 805, the second frequency adjustment unit 806, and the trajectory state calculation The unit 807 and the output unit 808 are activated. That is, after the pre-processing according to the flowchart of FIG. 10 is completed, the main processing according to the flowchart of FIG. 11 is started.
- the data acquisition unit 803 acquires measurement data at a predetermined sampling cycle.
- the data acquisition unit 803 uses, as measurement data, time-series data of measured values of acceleration in the left-right direction of the vehicle body 11, time-series data of measured values of acceleration in the left-right direction of the carts 12a and 12b, and the wheel shaft 13a. Time series data of measured values of acceleration in the left and right direction of to 13 d are acquired.
- Each acceleration is measured by using, for example, strain gauges attached to the vehicle body 11, the bogies 12a and 12b, and the wheel sets 13a to 13d, and a computing device that calculates acceleration using the measurement values of the strain gauges. Ru.
- the measurement of acceleration can be realized by a known technique, the detailed description thereof is omitted.
- the data acquisition unit 803 acquires, as measurement data, time-series data of measured values of longitudinal force.
- the method of measuring the longitudinal force is as described above.
- the data acquisition unit 803 can acquire measurement data, for example, by communicating with the above-described arithmetic device.
- the first frequency adjustment unit 804 reduces (preferably eliminates) the signal strength of the low frequency component included in the time series data of the measurement value of the longitudinal force among the measurement data acquired by the data acquisition unit 803.
- the low frequency component signal is not measured when the railway vehicle travels on a straight track, but is measured when the railway vehicle travels on a curved trajectory. That is, the signal measured when the railway vehicle travels on a curved track is a signal obtained by superimposing the low frequency component signal on the signal measured when the railway vehicle travels on a straight track. It can be considered.
- the present inventors devised a model in which an autoregressive model (AR (Auto-regressive) model) was modified. Then, the present inventors considered using this model to reduce the signal strength of the low frequency component included in the time series data of the measured values of the longitudinal force.
- AR Auto-regressive
- the model devised by the present inventors is referred to as a modified autoregressive model.
- known autoregressive models are simply referred to as autoregressive models.
- an example of the modified autoregressive model will be described.
- M is a number indicating the time until which time series data y of the physical quantity includes data, and is set in advance.
- time series data of physical quantities will be abbreviated as data y as necessary.
- An autoregressive model that approximates the value y k of the data y is, for example, as the following equation (45).
- the autoregressive model is the predicted value k k of the physical quantity at time k (m + 1 ⁇ k ⁇ M) in the data y, and the time k ⁇ before the time k in the data y It is an expression expressed using actual values y k-1 of physical quantities of l (1 ⁇ l ⁇ m).
- k k is represented by adding ⁇ ⁇ on yk in the equation (45).
- ⁇ in equation (45) is a coefficient of the autoregressive model.
- m is a number of values of the data y to be used to approximate the value y k of the data y at time k in the autoregressive model, the time k-1 ⁇ k-m of consecutive before that time k
- the values of the data y in y are the numbers y k-1 to y k-m .
- m is an integer less than M. For example, 1500 can be used as m.
- prediction value y ⁇ k of the physical quantity at the time k by autoregressive model determines the condition for approximating the value y k.
- a condition for the predicted value y ⁇ k of the physical quantity at the time k by autoregressive model approximates a value y k, for example, square errors between the predicted value y ⁇ k value y k of the physical quantity at the time k by autoregressive model
- the following expression (46) is a conditional expression for minimizing square error of the prediction value y ⁇ k of the physical quantity and the value y k at time k by autoregressive model.
- equation (48) can be obtained by modifying the equation (47) (in matrix notation).
- R jl in equation (48) is called autocorrelation of data y, and is a value defined by the following equation (49). This time
- equation (50) equation, derived from the condition that minimizes the prediction value y ⁇ k of the physical quantity at the time k by autoregressive model, the value y k of the physical quantity at the time k corresponding to the predicted value y ⁇ k, the error
- the equation is The equation (50) is called the Yule-Walker equation.
- equation (50) is a linear equation in which a vector composed of the coefficients of the autoregressive model is a variable vector.
- the constant vector on the left side in equation (50) is a vector whose component is the autocorrelation of data y with a time difference of 1 to m.
- the constant vector on the left side in equation (50) will be referred to as an autocorrelation vector as necessary.
- the coefficient matrix on the right side in the equation (50) is a matrix having autocorrelation of data y with a time difference of 0 to m ⁇ 1 as a component.
- the coefficient matrix on the right side in the equation (50) is referred to as an autocorrelation matrix as necessary.
- the autocorrelation matrix on the right side of the equation (50) (m ⁇ m matrix composed of R jl ) is expressed as an autocorrelation matrix R as in the following equation (51).
- the frequency characteristics of the autoregressive model include many frequency components included in the value y k of the data y at each time.
- the present inventors have intensively studied the autocorrelation matrix R to be multiplied by the coefficient ⁇ of the autoregressive model. As a result, the present inventors have found that a part of the eigenvalues of the autocorrelation matrix R can be used to reduce the influence of high frequency components included in the data y. That is, the present inventors have found that the autocorrelation matrix R can be rewritten so that low frequency components are emphasized.
- the diagonal matrix ⁇ in the equation (52) is a matrix whose diagonal components are eigenvalues of the autocorrelation matrix R, as shown in the following equation (53).
- the orthogonal matrix U is a matrix in which each column component vector is an eigenvector of the autocorrelation matrix R. Let u 1 , u 2 ,..., U m be column component vectors of the orthogonal matrix U. There is a correspondence relation that the eigenvalues for the eigenvector u j of the autocorrelation matrix R are ⁇ jj .
- the eigenvalues of the autocorrelation matrix R are variables that reflect the strength of the component of each frequency included in the time waveform of the predicted value ⁇ k of the physical quantity at time k by the autoregression model.
- ⁇ 11 , ⁇ 22 ,..., ⁇ mm which are diagonal components of the diagonal matrix ⁇ ⁇ ⁇ obtained from the result of singular value decomposition of the autocorrelation matrix R, are in descending order and in order to simplify the expression of equations.
- a matrix R ′ is defined as in the following equation (54) using s eigenvalues from the largest one. s is a number greater than or equal to 1 and less than m. In the present embodiment, s is predetermined.
- the matrix R ′ is a matrix obtained by approximating the autocorrelation matrix R using s eigenvalues of the eigenvalues of the autocorrelation matrix R.
- the matrix U s in the equation (54) is an m ⁇ s matrix composed of s column component vectors (eigenvectors corresponding to the used eigenvalues) from the left of the orthogonal matrix U in the equation (52). That is, the matrix U s is a submatrix configured by extracting the left m ⁇ s elements from the orthogonal matrix U. Also, U s T in equation (54) is the transpose matrix of U s . U s T is an s ⁇ m matrix composed of s row component vectors from the top of the matrix U T in equation (52).
- the matrix s s in the equation (54) is an s ⁇ s matrix composed of s columns from the left of the diagonal matrix ⁇ in the equation (52) and s rows from the top. That is, the matrix s s is a submatrix configured by extracting the upper left s ⁇ s elements from the diagonal matrix ⁇ . If the matrix s s and the matrix U s are represented by matrix elements, the following equation (55) is obtained.
- the following equation (57) can be obtained as an equation for obtaining the coefficient ⁇ .
- the model which calculates the predicted value ⁇ k of the physical quantity at time k by the equation (45) using the coefficient ⁇ determined by the equation (57) is a “corrected autoregressive model”.
- the diagonal elements of the diagonal matrix ⁇ ⁇ 11, ⁇ 22, ⁇ has been described as an example the case where the descending values of sigma mm.
- the diagonal components of the diagonal matrix ⁇ need not be in descending order in the process of calculating the coefficient ⁇ .
- the matrix U s is constructed by extracting column component vectors (eigenvectors) corresponding to the used eigenvalues, not the submatrix constructed by extracting the left m ⁇ s elements from the orthogonal matrix U. Submatrix.
- the matrix ⁇ s is not a submatrix constructed by cutting out the upper left s ⁇ s element from the diagonal matrix ⁇ , but the eigenvalues used for determining the coefficients of the modified autoregressive model are made to be diagonal elements It becomes a submatrix to be cut out.
- Equation (57) is an equation used to determine the coefficients of the modified autoregressive model.
- the matrix U s in Eq. (57) is a submatrix of the orthogonal matrix U obtained by singular value decomposition of the autocorrelation matrix R, and is a column of eigenvectors corresponding to the eigenvalues used for determining the coefficients of the modified autoregressive model It is a matrix (third matrix) to be a component vector.
- the matrix ⁇ s of the equation (57) is a submatrix of a diagonal matrix obtained by singular value decomposition of the autocorrelation matrix R, and the eigenvalues used to determine the coefficients of the modified autoregressive model are diagonal components And the second matrix.
- the matrix U s s s U s T in equation (57) is a matrix (first matrix) derived from the matrix s s and the matrix U s .
- the coefficient ⁇ of the modified autoregressive model can be obtained.
- an example of the method for deriving the coefficient ⁇ of the modified autoregressive model has been described.
- the method of deriving the coefficients of the autoregressive model on which to base modification autoregressive model intuitively easy understanding, and the method of using the least squares method to the prediction value y ⁇ k of the physical quantity at the time k .
- autocorrelation is expressed as autocorrelation of a stochastic process (population).
- the autocorrelation of this stochastic process is expressed as a function of time difference. Therefore, the autocorrelation of the data y in the present embodiment may be replaced with a value calculated by another formula as long as it approximates the autocorrelation of the stochastic process.
- R 22 to R mm are autocorrelations with a time difference of 0 (zero), but they may be replaced with R 11 .
- the number s of eigenvalues extracted from the autocorrelation matrix R shown in the equation (53) can be determined, for example, from the distribution of the eigenvalues of the autocorrelation matrix R.
- the physical quantities in the description of the above-described modified autoregressive model are forces in the back and forth direction.
- the value of the longitudinal force fluctuates according to the state of the railway vehicle. Therefore, first, the railway vehicle is made to travel on the track 16 to obtain data y on the measurement value of the longitudinal force.
- the autocorrelation matrix R is determined for each of the obtained data y using the equations (49) and (51).
- the eigenvalues of the autocorrelation matrix R are determined by performing singular value decomposition represented by the equation (52) on the autocorrelation matrix R.
- FIG. 12 is a diagram showing an example of the distribution of eigenvalues of the autocorrelation matrix R.
- the eigenvalues ⁇ 11 to ⁇ mm obtained by singular value decomposition of the autocorrelation matrix R for each of the data y of the measured values of the longitudinal force T 1 in the wheel 13 a are rearranged in ascending order and plotted ing.
- the horizontal axis of FIG. 12 is the index of the eigenvalue, and the vertical axis is the value of the eigenvalue.
- the first frequency adjustment unit 804 performs the following processing each time the data acquisition unit 803 acquires the value y k at time k of the data y of the measurement value of the back and forth direction force at a predetermined sampling cycle. First, the first frequency adjustment unit 804 uses the equations (49) and (51) based on the data y of the measured values of the longitudinal force and the numbers M and m set in advance. Generate an autocorrelation matrix R.
- the first frequency adjustment unit 804 derives the orthogonal matrix U and the diagonal matrix ⁇ of equation (52) by performing singular value decomposition on the autocorrelation matrix R, and the autocorrelation matrix R is derived from the diagonal matrix ⁇ . Derive the eigenvalues ⁇ 11 to ⁇ mm of Then, the first frequency adjustment unit 804, among the plurality of eigenvalues ⁇ 11 ⁇ ⁇ mm autocorrelation matrix R, the s eigenvalues ⁇ 11 ⁇ ⁇ ss from largest, the coefficient correction autoregressive model ⁇ It is selected as an eigenvalue of the autocorrelation matrix R used to obtain.
- the first frequency adjustment unit 804 is based on the data y of measured values of the longitudinal force, the eigenvalues ⁇ 11 to ⁇ ss, and the orthogonal matrix U obtained by singular value decomposition of the autocorrelation matrix R. Equation (57) is used to determine the coefficient ⁇ of the corrected autoregressive model.
- the first frequency adjustment unit 804 uses the coefficient ⁇ of the modified autoregressive model and the data y of the measured value of the longitudinal force according to equation (45) to obtain the data y of the measured value of the longitudinal force Derive a predicted value ⁇ k at time k of
- the time series data of the predicted value y ⁇ k of the longitudinal force is the time series data obtained by extracting the low frequency component contained in the data y of the measured value of the longitudinal force.
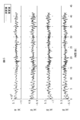
- FIG. 13 is a diagram showing an example of time-series data (measurement value) of measured values of longitudinal force and time-series data (calculated value) of predicted values of longitudinal force.
- four measured values of the longitudinal forces T 1 to T 4 are obtained. That is, four data y are obtained for the front-rear direction force.
- FIG. 13 shows measured values and calculated values in each of the four data y.
- the horizontal axis in FIG. 13 represents the measurement time / calculation time of the longitudinal forces T 1 to T 4 in an elapsed time (seconds) from the reference time when the reference time is 0 (zero).
- the vertical axis is the longitudinal force T 1 to T 4 (Nm).
- the calculated value of the longitudinal force T 1 at wheel shaft 13a (shown i.e., a value greater than other times) in approximately 15 seconds to 35 seconds, bias is applied. This period corresponds to the period in which the wheel set 13a passes a curved track.
- the wheel shafts 13b, 13c and 13d are biased during the passage of the curved track.
- the first frequency adjustment unit 804 subtracts the time-series data of the predicted value y ⁇ k of the longitudinal force from the time-series data (data y) of the measured value y k of the longitudinal force.
- the time-series data obtained by subtracting the time-series data of the predicted value y ⁇ k of the longitudinal force from the time-series data (data y) of the measured value y k of the longitudinal force is the longitudinal direction as necessary It is called time series data of high frequency components of force.
- the value in each sampling time of the time series data of the high frequency component of front and back direction force is called the value of the high frequency component of front and back direction force as needed.
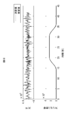
- FIG. 14 is a diagram showing an example of time series data of high frequency components of front and rear direction force.
- the vertical axis in FIG. 14 represents time-series data of high-frequency components of longitudinal forces T 1 , T 2 , T 3 , and T 4 . That is, the high frequency component of the longitudinal force T 1, T 2, T 3 , T 4 indicated on the vertical axis of FIG. 14, respectively, shown in FIG. 13, wheel sets 13a, 13b, 13c, anteroposterior 13d directed force T 1 , T 2 , T 3 and T 4 are obtained by subtracting the calculated values from the measured values.
- the horizontal axis, horizontal like the shaft, the longitudinal direction forces in the time of the reference 0 (zero) and elapsed time from the time of the standard for the (s) T 1 ⁇ T 4 in FIG. 13 in FIG. 14 Indicates the measurement time / calculation time of As described above, the first frequency adjustment unit 804 derives time-series data of high-frequency components of the longitudinal forces T 1 to T 4 .
- the filter operation unit 805 sets the observation equation as the observation equation stored by the observation equation storage unit 802, and the state equation as the state equation stored by the state equation storage unit 801 by the Kalman filter. Determine the estimated value. At this time, the filter operation unit 805 measures the measurement data excluding the longitudinal forces T 1 to T 4 among the measurement data acquired by the data acquisition unit 803 and the longitudinal force generated by the first frequency adjustment unit 804. The time series data of high frequency components T 1 to T 4 are used.
- the measurement data includes measured values of acceleration in the left-right direction of the vehicle body 11, measured values of acceleration in the left-right direction of the bogies 12a and 12b, and measurement of acceleration in the left-right direction of the wheel axles 13a to 13d. Contains the value.
- the longitudinal forces T 1 to T 4 on the wheelset 13 a to 13 d do not use the measurement data (measurement values) acquired by the data acquisition unit 803, but generate the longitudinal force T generated by the first frequency adjustment unit 804.
- Use time series data of high frequency components 1 to T 4 are used.
- the Kalman filter is one of the methods of data assimilation. That is, the Kalman filter is an example of a method of determining an estimated value of an unobserved variable (state variable) such that the difference between the measured value of the observable variable (observed variable) and the estimated value is small (minimum). .
- the filter operation unit 805 obtains a Kalman gain with which the difference between the measured value of the observed variable and the estimated value is small (minimum), and obtains an estimated value of the unobserved variable (state variable) at that time.
- the following observation equation (58) and state equation (59) are used.
- Y HX + V (58)
- X ⁇ ⁇ X + W (59)
- Y is a vector storing the measured value of the observation variable.
- H is an observation model.
- X is a vector that stores state variables.
- V is observation noise.
- X ⁇ represents a time derivative of X.
- ⁇ is a linear model.
- W is system noise.
- the filter operation unit 805 generates time series data of estimated values of the state variable shown in equation (44) by determining the estimated value of the state variable shown in equation (44) with a predetermined sampling cycle.
- the second frequency adjustment unit 806 reduces (preferably eliminates) the signal strength of the low frequency component included in the time series data of the estimated value of the state variable generated by the filter operation unit 805.
- the first frequency adjustment unit 804 can sufficiently remove the signal strength of the low frequency component included in the time series data of the measured values of the longitudinal force. If the number s of unique values to be extracted can be determined, the processing of the second frequency adjustment unit 806 is unnecessary.
- the second frequency adjustment unit 806 uses a modified autoregressive model to generate a low frequency component signal included in time series data of estimated values of state variables. Reduce the strength.
- the second frequency adjustment unit 806 performs the following processing for each state variable at a predetermined sampling cycle.
- the physical quantities in the description of the above-described modified autoregressive model are state variables. That is, data y of the state variable is time-series data of estimated values of the state variable generated by the filter operation unit 805. The estimated values of the state variables all change according to the state of the railway vehicle.
- the second frequency adjustment unit 806 uses the equations (49) and (51) based on the data y of the estimated value of the state variable and the numbers M and m set in advance. Generate a correlation matrix R.
- the second frequency adjustment unit 806 derives the orthogonal matrix U and the diagonal matrix ⁇ of equation (52) by performing singular value decomposition on the autocorrelation matrix R, and the autocorrelation matrix R is derived from the diagonal matrix ⁇ . Derive the eigenvalues ⁇ 11 to ⁇ mm of Then, second frequency adjusting unit 806, among the plurality of eigenvalues ⁇ 11 ⁇ ⁇ mm autocorrelation matrix R, the s eigenvalues ⁇ 11 ⁇ ⁇ ss from largest, the coefficient correction autoregressive model ⁇ It is selected as an eigenvalue of the autocorrelation matrix R used to obtain. s is predetermined for each state variable.
- a rail car is run on the track 16 to obtain data y of estimated values of each state variable as described above. Then, distributions of eigenvalues of the autocorrelation matrix R are individually created for each state variable. From the distribution of the eigenvalues of the autocorrelation matrix R, the number s of the eigenvalues extracted from the autocorrelation matrix R shown in the equation (53) is determined for each of the state variables.
- the second frequency adjustment unit 806 is based on data y of estimated values of state variables, eigenvalues ⁇ 11 to ⁇ ss, and orthogonal matrix U obtained by singular value decomposition of autocorrelation matrix R.
- the equation (57) is used to determine the coefficient ⁇ of the modified autoregressive model.
- the second frequency adjustment unit 806 determines the time of the data y of the estimated value of the state variable according to the equation (45) based on the coefficient ⁇ of the modified autoregressive model and the data y of the estimated value of the state variable We derive the prediction value ⁇ k at k .
- the time series data of the predicted value ⁇ k of the state variable is time series data obtained by extracting the low frequency component contained in the data y of the estimated value of the state variable.
- the second frequency adjustment unit 806 subtracts the time-series data of the predicted value k k of the state variable from the data y of the estimated value of the state variable.
- the value at each sampling time of the time series data obtained by subtracting the time series data of the predicted value ⁇ k of the state variable from the data y of the estimated value of the state variable is the high frequency component of the state variable as necessary. It is called the value of.
- the track state calculation unit 807 calculates estimated values of the amount of rotation (angular displacement) ⁇ w1 to ⁇ w4 in the yawing direction of the wheel sets 13 a to 13 d from the equations (30) to (33).
- the track state calculation unit 807 calculates estimated values of rotational amounts (angular displacements) ⁇ w1 to ⁇ w4 in the yawing direction of the wheel sets 13a to 13d and the high frequency components of the state variable generated by the second frequency adjustment unit 806.
- the positions of the wheel sets 13a to 13d are obtained.
- the amount of deviation y R1 to y R4 is calculated as in the above.
- the trajectory state calculating unit 807 obtains time series data of the passing amounts y R1 to y R4 by performing the calculation of the off amounts y R1 to y R4 as described above in a predetermined sampling cycle.
- the track state calculation unit 807 calculates the final streets deviation amount y R.
- the orbit state calculation unit 807 matches the phase of the time-series data of the amount of deviation y R2 to y R4 with the phase of the time-series data of the amount of deviation y R1 . That is, from the distance between the wheel 13a and the wheels 13b to 13d in the front-rear direction and the speed of the railway vehicle, the track state calculation unit 807 determines the position relative to the time when the wheel 13a passes a certain position. Calculate the delay time of the passing time of The orbit state calculation unit 807 shifts the phase by the delay time with respect to the time-series data of the deviation amounts y R2 to y R4 .
- FIG. 15 is a diagram showing an example of time-series data of the amounts of deviation y R1 to y R4 in the wheelset 13a to 13d.
- the phase of the time-series data of the wheel as deviations amount of shaft 13b ⁇ 13d y R2 ⁇ y R4 are in accordance with the phase of the time-series data of the street deviation amount y R1 in axle 13a.
- the horizontal axis of FIG. 15 represents the detection time of the street deviation amount y R1 time reference at 0 time elapsed from the time of the reference in the case of a (zero) seconds.
- the vertical axis in FIG. 25 is the amount of deviation y R1 to y R4 (m) in the wheel sets 13a to 13d.
- Track state calculation unit 807 calculates an arithmetic mean value of the sum of the values at the same sampling time as deviation amount y R1 ⁇ y R4 the combined phase as the final streets deviation amount y R at the sampling time. Track state calculation unit 807, by performing such calculation at each sampling time to obtain time-series data of the final as deviation amount y R.
- the phase of the street deviation amount y R2 ⁇ y R4 so match the phase of the street deviation amount y R1, it is possible to offset the disturbance factors present in common to time-series data of the street deviation amount y R1 ⁇ y R4.
- FIG. 16 is a diagram showing an example of time-series data of the final amount of deviation y R and the curvature 1 / R of the track 16 (rail). Similar to the vertical axis in FIG. 15, the horizontal axis in FIG. 16 indicates the final passing error y R in the elapsed time (seconds) from the reference time when the reference time is 0 (zero). Represents the time of day.
- the vertical axis in the upper part of FIG. 16 represents the final amount of deviation y R (m) at each detection time.
- a curvature 1 / R of the track 16 is a curvature 1 / R of the track 16 at the point where wheel shaft 13a of the rail vehicle on the detection time of the last streets deviation amount y R is located (rail) (1 / m) .
- a curvature 1 / R of 0 (zero) indicates a linear trajectory
- a curvature 1 / R of values other than 0 (zero) indicates a curved trajectory.
- the measured value is the amount of deviation y R as actually measured.
- the estimated value is the final amount of deviation y R calculated by the orbit state calculation unit 807. As shown in the upper part of FIG. 16, it can be understood that the estimated value of the deviation amount y R well matches the measured value in both the linear orbit and the curved orbit.
- the orbit state calculation unit 807 takes a moving average (that is, passes a low-pass filter) for each of the phase deviation matched amounts y R1 to y R4 and passes the phase difference calculated as the movement averages y R1 to y From R4 , you may calculate the final amount of deviation y R. Further, the orbit state calculation unit 807 is a final deviation of the arithmetic mean value of the two values excluding the maximum value and the minimum value among the values at the same sampling time of the misalignment amounts y R1 to y R4 according to the phase alignment. it may be calculated as the amount y R.
- the output unit 808 outputs information on the final amount of deviation y R calculated by the trajectory state calculation unit 807. At this time, the output unit 808 may output information indicating that the trajectory 16 is abnormal if the final amount of deviation y R is larger than a preset value.
- a preset value for example, at least one of display on a computer display, transmission to an external device, and storage on an internal or external storage medium can be adopted.
- the inspection apparatus 800 reduces the signal strength of the low-frequency component contained in the time-series data of the measured values of the longitudinal force T 1 ⁇ T 4, the front-rear direction force T 1 ⁇ T 4 Generate time series data of high frequency components of Inspection apparatus 800, the time-series data of the high-frequency component of the longitudinal force T 1 ⁇ T 4, the relationship between the street deviation amount y R1 ⁇ y R4 in position in the longitudinal direction forces T 1 ⁇ T 4 and Wajiku 13a ⁇ 13d By giving the equations, the amounts of deviation y R1 to y R4 at the positions of the wheel sets 13a to 13d are calculated.
- This relational expression is an expression based on an equation of motion (i.e., an equation not including the radius of curvature R of the track 16 (rail)) that describes the movement of the straight track of the railway vehicle when traveling. Therefore, irregularities in the curved trajectory can be detected with high accuracy without using a special measuring device.
- the inspection apparatus 800 generates the autocorrelation matrix R from the data y of the measurement values of the longitudinal force, and the largest of the eigenvalues obtained by singular value decomposition of the autocorrelation matrix R.
- the inspection apparatus 800 uses the predicted value y ⁇ k of the longitudinal force at the time k to the corrected autoregressive model with the coefficient ⁇ thus determined, before the time k ⁇ 1 (1 ⁇ l ⁇ m) Calculated by giving data y of the measured value of the longitudinal force. Therefore, the signal of the low frequency component resulting from the traveling of the curved track of the railway vehicle can be reduced from the data y of the measurement values of the longitudinal force without assuming the cutoff frequency in advance.
- the inspection apparatus 800 generates measurement data excluding the longitudinal forces T 1 to T 4 among the measurement data acquired by the data acquisition unit 803 and the measurement data generated by the first frequency adjustment unit 804. and time-series data of the high-frequency component of the longitudinal force T 1 ⁇ T 4, the giving the Kalman filter, state variables (y w1 ⁇ ⁇ y w4 ⁇ , y w1 ⁇ y w4, y t1 ⁇ ⁇ y t2 ⁇ , y t1 ⁇ ⁇ y t2, ⁇ t1 ⁇ ⁇ ⁇ t2 ⁇ , ⁇ t1 ⁇ ⁇ t2, ⁇ t1 ⁇ ⁇ ⁇ t2 ⁇ , ⁇ t1 ⁇ ⁇ t2, y b ⁇ , y b, ⁇ b ⁇ , ⁇ b, ⁇ b ⁇ , Derive ⁇ b , y y 1 , y y 2 , ⁇ a
- the inspection apparatus 800 calculates the value of the high frequency component of the state variable by reducing (preferably removing) the signal strength of the low frequency component included in the time series data of the estimated value of the state variable.
- the inspection apparatus 800 uses the values of the high-frequency components of the rotational amounts (angular displacements) ⁇ t1 to ⁇ t2 of the carriages 12a and 12b in the yawing direction and the actual values of the conversion variables e 1 to e 4
- the rotational amounts (angular displacements) ⁇ w1 to ⁇ w4 in the yawing direction of the wheel sets 13a to 13d are derived.
- the inspection apparatus 800 uses the equation of motion describing the yawing of the wheel sets 13a to 13d, the amount of rotation (angular displacement) ⁇ w1 to ⁇ w4 in the yawing direction of the wheel sets 13a to 13 d
- the inspection apparatus 800 uses the equation of motion describing the yawing of the wheel sets 13a to 13d, the amount of rotation (angular displacement) ⁇ w1 to ⁇ w4 in the yawing direction of the wheel sets 13a to 13 d
- the inspection apparatus 800 from the street deviation amount y R1 ⁇ y R4 in position of the wheel shaft 13a ⁇ 13d, and calculates the final streets deviation amount y R.
- a strain gauge can be used as a sensor, no special sensor is required. Therefore, it is possible to detect an abnormality (trajectory irregularity) of the track 16 with high accuracy without increasing the cost.
- a strain gauge may be attached to the sales vehicle and the inspection device 800 may be mounted on the sales vehicle to detect irregularities in the track 16 in real time while the sales vehicle is traveling. it can. Therefore, even if the inspection vehicle does not travel, irregularities in the track 16 can be detected.
- a strain gauge may be attached to the inspection vehicle, and the inspection device 800 may be mounted on the inspection vehicle.
- ⁇ Modification> the case of using the modified autoregressive model has been described as an example. However, it is not always necessary to reduce the low frequency component signal caused by the traveling of the curved track of the railway vehicle from the data y of the longitudinal force measurement value using the modified autoregressive model. For example, when it is possible to specify a frequency band resulting from the traveling of the curved track of the rail vehicle, it is derived from the traveling of the curved track of the railway vehicle from data y of measured values of longitudinal force using a high pass filter. Low frequency components may be reduced.
- the wheelset serving as a reference at the time of phase alignment is the wheelset 13a
- the wheelset serving as a reference may be a wheelset 13b, 13c or 13d other than the wheelset 13a.
- a filter that is, a filter that performs data assimilation
- a particle filter may be used.
- the error between the measured value of the observed variable and the estimated value may be, for example, the squared error between the measured value of the observed variable and the estimated value.
- the case where the amount of deviation is derived is described as an example.
- the information reflecting the track irregularity (defect on the appearance of the track 16) is derived as the information reflecting the state of the track 16, it is not necessary to derive the deviation amount as it is.
- the lateral pressure (wheel and rail The stress in the left-right direction in between may be derived.
- Q 1 , Q 2 , Q 3 and Q 4 are lateral pressures at the wheels 14 a, 14 b, 14 c and 14 d respectively.
- f 3 represents a spin creep coefficient.
- the state variable indicating the state of the vehicle body 11 is included as an example.
- the vehicle body 11 is a portion to which the propagation of the vibration due to the action force (creep force) between the wheels 14a to 14d and the track 16 is finally transmitted. Therefore, for example, when it is determined that the influence of the propagation is small in the vehicle body 11, it is not necessary to include the state variable indicating the state of the vehicle body 11.
- the state quantities related to the vehicle body (state quantities including the subscript b) and the state quantities related to the vehicle body (state quantities including the subscript b)
- a value (eg, ⁇ a2 ⁇ b ⁇ of the third term on the left side of the equation (21)) is set to 0 (zero).
- the bogies 12a and 12b are bolsterless bogies.
- the bogies 12a and 12b are not limited to bolsterless bogies.
- the equation of motion can be rewritten as appropriate according to the components of the railway vehicle, the force received by the railway vehicle, the direction of movement of the railway vehicle, and the like. That is, the equation of motion is not limited to that exemplified in the present embodiment.
- the final street deviation amount y R which is calculated by the method of the first embodiment, referred to as the estimated value of the street deviation amount y R if necessary, actually measured as deviation amount y R Is referred to as a measurement of the amount of deviation y R as required.
- measurement data used when calculating time-series data of the estimated value of the deviation amount y R is not data actually measured but simulation data that simulates the vibration of a railway vehicle. Therefore, the present inventors confirmed whether there is a difference between the estimated value of the deviation amount y R and the measured value, using the actually measured data.
- the present inventors have found that a large deviation occurs between the estimated value and the measured value of the deviation amount y R at the seam of the rail in the curved track.
- the large deviation indicates that the time waveform of the estimated value of the amount of deviation y R and the time waveform of the measurement value are inverted.
- the time waveform of the estimated value of the deviation amount y R is upwardly convex
- the estimated value of the deviation amount y R is corrected by correcting the time-series data of the measured values of the longitudinal forces T 1 to T 4 corresponding to the area including the seam portion of the rail in the curved track. Control the occurrence of large deviations between As described above, in the present embodiment, processing for correcting the estimated value of the deviation amount y R is added to the first embodiment. Accordingly, in the description of the present embodiment, the same parts as those of the first embodiment are denoted by the same reference numerals as those of FIGS. 1 to 16, and the detailed description will be omitted.
- FIG. 17 is a diagram showing an example of a functional configuration of the inspection apparatus 1700.
- FIG. 18 is a flowchart showing an example of pre-processing in the inspection apparatus 1700.
- FIG. 19 is a flowchart showing an example of this process in the inspection apparatus 1700. Also in the present embodiment, as in the first embodiment, the case where the inspection device 1700 is mounted on a railway vehicle will be described as an example.
- the inspection apparatus 1700 has, as its functions, a state equation storage unit 801, an observation equation storage unit 802, a trajectory data storage unit 1701, a data acquisition unit 803, a first frequency adjustment unit 804, a seam determination unit 1702, correction. It has a unit 1703, a filter operation unit 805, a second frequency adjustment unit 806, a trajectory state calculation unit 807, and an output unit 808.
- the hardware configuration of the inspection apparatus 1700 can be realized, for example, by the one shown in FIG.
- the trajectory data storage unit 1701 stores trajectory data.
- the track data includes data indicating the relationship between the position of the track on which the railcar travels and the curvature 1 / R of the rail at the position.
- the position where the curvature 1 / R is 0 (zero) is a linear trajectory.
- the position where the curvature 1 / R is not 0 (zero) is a curved trajectory.
- data for example, data managed by a railway company for each route can be used.
- the current traveling position of the railcar can be obtained by determining the traveling distance from the speed of the railcar and the traveling time.
- the method of determining the current travel position of the railway vehicle is not limited to such a method.
- the data acquisition unit 803 may have a GPS receiver. In this case, the GPS receiver acquires the current travel position of the railway vehicle.
- the seam determination unit 1702 determines whether the railway vehicle has passed a section including a seam of a rail in a curved track. In the following description, this area is referred to as a seam section as needed. In the present embodiment, the seam determination unit 1702 calculates a seam interval as follows. First, the joint judging unit 1702 aligns the phases of the accelerations y w2 ... Y w4 ... In the left and right direction of the wheel sets 13 b to 13 d with the acceleration y w1 .
- the joint judging unit 1702 determines the wheel 13b to 13d for the time when the wheel 13a passes a certain position. Calculate the delay time of the passing time. Seam determination unit 1702, to the acceleration y w2 ⁇ ⁇ y w4 ⁇ time series data in the lateral direction of the wheel shaft 13b ⁇ 13d, shifting the phase by the delay time. Seam determination unit 1702 calculates an acceleration y w1 ⁇ ⁇ y w4 ⁇ calculated average value y w ⁇ ⁇ of the lateral direction of the combined phase wheelset 13a ⁇ 13d.
- the joint judgment unit 1702 sets the wheel axis 13a of the rail car to a time when the absolute value of the arithmetic mean value y w of the accelerations y w1 to y w4 in the left-right direction of the wheel sets 13a to 13 d exceeds the threshold. It is the time when the rail joint in the track is passed.
- the threshold is predetermined.
- the acceleration y w1 ... y w4 ... in the lateral direction of the wheel sets 13a to 13 d when the rail vehicle passes the joint of the rail in the curved track is investigated, and the result of the investigation shows that the rail vehicle in the curved track A value that can be determined to have passed the seam of is adopted as the threshold.
- values of 3 (m / s 2 ) to 6 (m / s 2 ) are set as the threshold.
- the joint determination unit 1702 sets a section in which the wheel shaft 13a of the rail vehicle passes between t (seconds) before and after the time when the wheel shaft 13a of the rail vehicle passes the seam of the rail in the curved track as a seam section.
- t is a predetermined time, and for example, a value less than 0.2 (seconds) is determined as the value of t.
- the correction unit 1703 is activated when it is determined by the seam determination unit 1702 that the wheelset 13a of the railway vehicle has passed the seam section.
- the correction unit 1703 corrects the values of the high frequency components of the longitudinal forces T 1 to T 4 at the time corresponding to the time when the wheelset 13 a of the railcar passes the joint section.
- the correction unit 1703 the value of the high-frequency component of the longitudinal force T 1 at time of wheel sets 13a railcar corresponds to the beginning of the time which has passed through the seam section axle 13a of the rail vehicle has passed the seam section linearly interpolating a value of the high-frequency component of the longitudinal force T 1 at time corresponding to the end time. That is, the correction unit 1703 connects these values by a straight line.
- the correction unit 1703 aligns the phase of the time-series data of the high frequency components of the longitudinal forces T 2 to T 4 with the phase of the time-series data of the longitudinal force T 1 . That is, from the distance between the wheelset 13a and the wheelset 13b to 13d in the front-rear direction and the speed of the railway vehicle, the correction unit 1703 passes the wheelset 13b to 13d for the time when the wheelset 13a passes a certain position. Calculate the delay time of the time to The correction unit 1703 shifts the phase of the time series data of the high frequency components of the longitudinal forces T 2 to T 4 by this delay time.
- the correction unit 1703 performs the longitudinal force at the time corresponding to the time when the wheel shaft 13 a of the railway vehicle passes the seam section.
- the value of the high-frequency component of T 2 ⁇ T 4 respectively linear interpolation wheel shaft 13a of the railway vehicle and the value of the high-frequency component of the longitudinal force T 2 ⁇ T 4 at the time corresponding to the end of the time which has passed through the seam section Do.
- the correction method by the correction unit 1703 is not limited to linear interpolation.
- the correction unit 1703 may perform spline interpolation.
- the detection device 1800 corrects the values of the high frequency components of the longitudinal forces T 1 to T 4 at the time corresponding to the time when the wheelset 13 a of the railcar passes the joint section. Therefore, the accuracy of the final estimated value of the deviation amount y R can be further improved.
- the seam section is set only for the curved track has been described as an example.
- the seam section may be set for the linear trajectory.
- the case of correcting the values of the high frequency components of the longitudinal forces T 1 to T 4 has been described as an example.
- the measurement values of the longitudinal forces T 1 to T 4 acquired by the data acquisition unit 803 may be corrected as described in the present embodiment.
- the first frequency adjustment unit 804 reduces the signal strength of the low frequency component included in the time series data of the measured values of the longitudinal forces T 1 to T 4 after the correction.
- the acceleration y w1 ⁇ ⁇ y w4 ⁇ in the lateral direction of the wheel shaft 13a ⁇ 13d an example in which axle 13a of the rail vehicle to determine whether passing through the seam section I mentioned and explained.
- the acceleration y w1 ... Y w4 ... In the lateral direction of the wheel sets 13a to 13 d does not necessarily have to be used as long as it is data representing the vibration of a railway vehicle.
- carriage 12a, the acceleration y t1 ⁇ ⁇ in the lateral direction of 12b may be used y t2 ⁇ ⁇ .
- the acceleration in the vertical direction of the wheel sets 13a to 13d or the carriages 12a and 12b may be used.
- the data acquisition unit 803 acquires measurement values of acceleration in the vertical direction of the wheel sets 13a to 13d or the carriages 12a and 12b as measurement data.
- various modified examples described in the first embodiment can be adopted.
- the inspection apparatus 800 mounted on a railway vehicle calculates the final amount of deviation y R has been described as an example.
- a data processing device in which a part of the functions of the inspection device 800 is implemented is disposed at the command center.
- the data processing apparatus receives the measurement data transmitted from the railway vehicle, and calculates the final streets deviation amount y R by using the measurement data received.
- the functions possessed by the inspection device 800 of the first embodiment are shared and executed between the railway vehicle and the command center.
- the present embodiment and the first embodiment mainly differ in the configuration and processing based on this. Accordingly, in the description of the present embodiment, the same parts as those of the first embodiment are denoted by the same reference numerals as those of FIGS. 1 to 16, and the detailed description will be omitted.
- FIG. 20 is a diagram showing an example of the configuration of the inspection system.
- the inspection system includes data collection devices 2010a and 2010b and a data processing device 2020.
- FIG. 20 also shows an example of the functional configuration of the data collection devices 2010a and 2010b and the data processing device 2020.
- the hardware of the data collection devices 2010a and 2010b and the data processing device 2020 can be realized, for example, by the one shown in FIG. Therefore, the detailed description of the hardware configuration of the data collection devices 2010a and 2010b and the data processing device 2020 is omitted.
- One data collection device 2010a, one 2010b is mounted on each of the railway vehicles.
- the data processing device 2020 is disposed at the command center.
- the command center centrally manages, for example, the operation of a plurality of rail vehicles.
- the data collection devices 2010a, 2010b can be realized with the same.
- the data collection devices 2010a and 2010b include data acquisition units 2011a and 2011b, and data transmission units 2012a and 2012b.
- the data acquisition units 2011 a and 2011 b have the same function as the data acquisition unit 803. That is, the data acquisition units 2011 a and 2011 b acquire the same measurement data as the measurement data acquired by the data acquisition unit 803. Specifically, the data acquisition units 2011a and 2011b measure the measured values of acceleration in the left-right direction of the vehicle body 11, measured values of the acceleration in the left-right direction of the carts 12a and 12b, and measure the acceleration in the left-right direction of the wheel axles 13a to 13d as measurement data. Obtain values and measurements of the fore-aft force. The strain gauges and arithmetic unit for obtaining these measurement values are the same as those described in the first embodiment.
- the data transmission units 2012a and 2012b transmit the measurement data acquired by the data acquisition units 2011a and 2011b to the data processing device 2020.
- the data transmission units 2012a and 2012b transmit the measurement data acquired by the data acquisition units 2011a and 2011b to the data processing apparatus 2020 by wireless communication.
- the data transmission units 2012a and 2012b add the identification numbers of the railway vehicles on which the data collection devices 2010a and 2010b are mounted to the measurement data acquired by the data acquisition units 2011a and 2011b.
- the data transmission units 2012a and 2012b transmit the measurement data to which the identification number of the railway vehicle is added.
- the data reception unit 2021 receives the measurement data transmitted by the data transmission units 2012 a and 2012 b.
- the identification number of the railway vehicle that is the transmission source of the measurement data is added to the measurement data.
- the data storage unit 2022 stores the measurement data received by the data receiving unit 2021.
- the data storage unit 2022 stores measurement data for each identification number of a railway vehicle.
- the data storage unit 2022 identifies the position of the railway vehicle at the reception time of the measurement data based on the current operation status of the railway vehicle and the reception time of the measurement data, and the information of the identified position and the measurement data Are associated with each other and stored.
- the data collection devices 2010a and 2010b may collect information on the current position of the railway vehicle and include the collected information in the measurement data.
- the data reading unit 2023 reads the measurement data stored by the data storage unit 2022.
- the data reading unit 2023 can read measurement data designated by the operator among the measurement data stored by the data storage unit 2022.
- the data reading unit 2023 can also read measurement data that matches a predetermined condition at a predetermined timing.
- the measurement data read by the data reading unit 2023 is determined based on, for example, at least one of the identification number and the position of the railcar.
- the state equation storage unit 801, the observation equation storage unit 802, the first frequency adjustment unit 804, the filter operation unit 805, the second frequency adjustment unit 806, the trajectory state calculation unit 807, and the output unit 808 are the first embodiment. Is the same as described. Therefore, the detailed description of these is omitted here.
- the filter operation unit 805 determines the estimated value of the state variable shown in equation (44) by using the measurement data read by the data read unit 2023 instead of the measurement data obtained by the data acquisition unit 803. .
- the data collection devices 2010a and 2010b mounted on the railcar collect measurement data and transmit it to the data processing device 2020.
- Data processor 2020 disposed control center, the data collection device 2010a, and stores the measurement data received from 2010b, using the stored measurement data to calculate a final streets deviation amount y R. Therefore, in addition to the effects described in the first embodiment, for example, the following effects are achieved. That is, the data processing device 2020 can calculate the final amount of deviation y R at any timing by reading the measurement data at any timing. In addition, the data processing device 2020 can output a time-series change of the final runoff amount y R at the same position. In addition, the data processing device 2020 can output the final amount of deviation y R in the plurality of routes for each route.
- the case where the measurement data is directly transmitted from the data collection devices 2010a and 2010b to the data processing device 2020 has been described as an example. However, this is not necessary.
- cloud computing may be used to construct an inspection system.
- the data processor 2020 disposed at the command center may calculate the final deviation amount y R as described in the second embodiment.
- the data processing device 2020 further includes a seam determination unit 1702 and a correction unit 1703.
- various modifications described in the first embodiment and the second embodiment can be adopted.
- the case where the unit 807 and the output unit 808 are included in one device has been described as an example. However, this is not necessary.
- the functions of the state equation storage unit 801, the observation equation storage unit 802, the first frequency adjustment unit 804, the filter operation unit 805, the second frequency adjustment unit 806, the orbit state calculation unit 807, and the output unit 808 are implemented by a plurality of devices. It may be realized. In this case, the inspection system is configured by using the plurality of devices.
- the embodiments of the present invention described above can be realized by a computer executing a program.
- a computer readable recording medium recording the program and a computer program product such as the program can be applied as an embodiment of the present invention.
- the recording medium for example, a flexible disk, a hard disk, an optical disk, a magneto-optical disk, a CD-ROM, a magnetic tape, a non-volatile memory card, a ROM or the like can be used.
- any of the embodiments of the present invention described above is merely an example of implementation for carrying out the present invention, and the technical scope of the present invention should not be interpreted limitedly by these. It is a thing. That is, the present invention can be implemented in various forms without departing from the technical idea or the main features thereof.
- the present invention can be used, for example, to inspect the track of a railway vehicle.
Abstract
An inspection apparatus (800) reduces the signal intensity of a low-frequency component included in chronological data for the measured value of longitudinal force and generates chronological data for a high-frequency component of the longitudinal force. The inspection apparatus (800) calculates the amount of deviation in line on the basis of the chronological data for the high-frequency component of the longitudinal force.
Description
本発明は、検査システム、検査方法、およびプログラムに関し、特に、鉄道車両の軌道を検査するために用いて好適なものである。
The present invention relates to an inspection system, an inspection method, and a program, and is particularly suitable for use in inspecting a track of a railway vehicle.
軌道上を鉄道車両が走行すると鉄道車両からの荷重により軌道の位置が変化する。このような軌道の変化が生じると、鉄道車両が異常な挙動を示す虞がある。そこで、従来から、鉄道車両を軌道上で走行させることにより、軌道の異常を検出することが行われている。
When a railway vehicle travels on the track, the load from the railway vehicle changes the position of the track. When such a change in track occurs, there is a possibility that the railway vehicle may exhibit anomalous behavior. Therefore, conventionally, by making a railway vehicle travel on a track, it is performed to detect an abnormality in the track.
特許文献1には、レーザ光の照射部と、走行部と、受光部とを備える測定装置が記載されている。照射部は、1本のレールに固定される。走行部は、照射部が固定されたレール上を走行する。受光部は、走行部に取り付けられる。受光部は、レーザ光の受光位置を検出する検出部を有する。この検出部の形状は、レールの延伸方向に略直交する断面において面状となっている。走行部を距離Lだけ前進させることと、走行部を距離L/2だけ後退させることと、走行部を距離Lだけ前進させることとを繰り返し行う。このように受光部による測定範囲の一部が重複するように走行部を走行させることにより、軌道の曲線部での軌道狂いの量を測定する。
Patent Document 1 describes a measurement apparatus including a laser light irradiation unit, a traveling unit, and a light receiving unit. The irradiation unit is fixed to one rail. The traveling unit travels on a rail to which the irradiation unit is fixed. The light receiving unit is attached to the traveling unit. The light receiving unit has a detection unit that detects a light receiving position of the laser light. The shape of the detection portion is planar in a cross section substantially orthogonal to the extending direction of the rail. The advancing of the traveling portion by the distance L, the retraction of the traveling portion by the distance L / 2, and the advancing of the traveling portion by the distance L are repeatedly performed. By running the traveling unit such that a part of the measurement range of the light receiving unit overlaps, the amount of track deviation at the curved portion of the track is measured.
しかしながら、特許文献1に記載の方法は、軌道不整を直接測定する手法である。このため、高価な測定装置が必要になる。また、特許文献1に記載の方法は、走行部が前進と後退とを繰り返す。このため、営業車両の走行中に軌道不整を検知することができない。
However, the method described in Patent Document 1 is a method of directly measuring the orbital irregularity. This requires expensive measuring equipment. Further, in the method described in Patent Document 1, the traveling unit repeats forward and backward. For this reason, it is not possible to detect track irregularities while the sales vehicle is traveling.
本発明は、以上のような問題点に鑑みてなされたものであり、鉄道車両の軌道の曲線部における不整を特別な測定装置を用いることなく検出することができるようにすることを目的とする。
The present invention has been made in view of the above problems, and it is an object of the present invention to be able to detect irregularities in a curved portion of a track of a railway vehicle without using a special measuring device. .
本発明の検査システムは、車体と台車と輪軸とを有する鉄道車両を軌道上で走行させることにより測定される測定値の時系列データである計測データを取得するデータ取得手段と、前記鉄道車両の状態に応じて値が変動する物理量の時系列データから、前記鉄道車両が前記軌道の曲線部を走行することに起因して生じる低周波成分の信号強度を低減する周波数調整手段と、前記軌道の状態を反映する情報を導出する軌道状態導出手段と、を有し、前記計測データは、前後方向力の測定値を含み、前記前後方向力は、前記輪軸と、当該輪軸が設けられる前記台車との間に配置される部材に生じる前後方向の力であり、前記部材は、軸箱を支持するための部材であり、前記前後方向は、前記鉄道車両の走行方向に沿う方向であり、前記周波数調整手段は、前記物理量である前記前後方向力の測定値の時系列データから、前記鉄道車両が前記軌道の曲線部を走行することに起因して生じる低周波成分の信号強度を低減する第1の周波数調整手段を有し、前記軌道状態導出手段は、前記輪軸の位置での前記軌道の状態を反映する情報と前記前後方向力との関係を示す関係式と、前記第1の周波数調整手段により低周波成分の信号強度が低減された前記前後方向力の値と、を用いて、前記軌道の状態を反映する情報を導出し、前記関係式は、レールの曲率半径を含まない式であることを特徴とする。
An inspection system according to the present invention comprises: data acquisition means for acquiring measurement data which is time-series data of measurement values measured by causing a railway vehicle having a vehicle body, a bogie and a wheelset to travel on a track; Frequency adjustment means for reducing the signal strength of low frequency components generated due to the railway vehicle traveling in the curved portion of the track from time series data of physical quantities whose values change according to the state; Track condition deriving means for deriving information reflecting the condition, the measurement data including a measurement value of longitudinal force, the longitudinal force comprising the wheel axle and the carriage provided with the wheel axle The force is a force in the front-rear direction generated in the member disposed between the two, the member is a member for supporting the axle box, the front-rear direction is a direction along the traveling direction of the railway vehicle, and the frequency Key The first means reduces the signal strength of the low frequency component generated due to the railway vehicle traveling on the curved portion of the track from the time series data of the measured values of the longitudinal force which is the physical quantity. The track state deriving means includes frequency adjustment means, and a relational expression indicating a relation between the information reflecting the state of the track at the position of the wheelset and the longitudinal force, and the first frequency adjustment means. Information that reflects the state of the orbit is derived using the value of the front-back direction force in which the signal strength of the low frequency component is reduced, and the relational expression is an expression that does not include the radius of curvature of the rail It is characterized by
本発明の検査方法は、車体と台車と輪軸とを有する鉄道車両を軌道上で走行させることにより測定される測定値の時系列データである計測データを取得するデータ取得工程と、前記鉄道車両の状態に応じて値が変動する物理量の時系列データから、前記鉄道車両が前記軌道の曲線部を走行することに起因して生じる低周波成分の信号強度を低減する周波数調整工程と、前記軌道の状態を反映する情報を導出する軌道状態導出工程と、を有し、前記計測データは、前後方向力の測定値を含み、前記前後方向力は、前記輪軸と、当該輪軸が設けられる前記台車との間に配置される部材に生じる前後方向の力であり、前記部材は、軸箱を支持するための部材であり、前記前後方向は、前記鉄道車両の走行方向に沿う方向であり、前記周波数調整工程は、前記物理量である前記前後方向力の測定値の時系列データから、前記鉄道車両が前記軌道の曲線部を走行することに起因して生じる低周波成分の信号強度を低減する第1の周波数調整工程を有し、前記軌道状態導出工程は、前記輪軸の位置での前記軌道の状態を反映する情報と前記前後方向力との関係を示す関係式と、前記第1の周波数調整工程により低周波成分の信号強度が低減された前記前後方向力の値と、を用いて、前記軌道の状態を反映する情報を導出し、前記関係式は、レールの曲率半径を含まない式に基づく式であることを特徴とする。
The inspection method according to the present invention includes a data acquisition step of acquiring measurement data which is time-series data of measurement values measured by causing a railway vehicle having a vehicle body, a bogie, and a wheelset to travel on a track. The frequency adjustment step of reducing the signal strength of the low frequency component generated due to the railway vehicle traveling on the curved portion of the track from the time series data of the physical quantity whose value fluctuates according to the state; A track state deriving step of deriving information reflecting the state, the measurement data including a measurement value of front and rear direction force, the front and rear direction force including the wheel shaft and the bogie provided with the wheel shaft The force is a force in the front-rear direction generated in the member disposed between the two, the member is a member for supporting the axle box, the front-rear direction is a direction along the traveling direction of the railway vehicle, and the frequency Adjuster A first frequency for reducing the signal strength of low frequency components generated due to the railway vehicle traveling on the curved portion of the track from time series data of the measured values of the longitudinal force which is the physical quantity. An adjustment step, wherein the track state derivation step is a relational expression indicating a relationship between information reflecting the state of the track at the position of the wheelset and the longitudinal force, and a low value by the first frequency adjustment step. Information that reflects the state of the trajectory is derived using the value of the front-back direction force in which the signal strength of the frequency component is reduced, and the relational expression is an expression based on an expression that does not include the radius of curvature of the rail. It is characterized by
本発明のプログラムは、車体と台車と輪軸とを有する鉄道車両を軌道上で走行させることにより測定される測定値の時系列データである計測データを取得するデータ取得工程と、前記鉄道車両の状態に応じて値が変動する物理量の時系列データから、前記鉄道車両が前記軌道の曲線部を走行することに起因して生じる低周波成分の信号強度を低減する周波数調整工程と、前記軌道の状態を反映する情報を導出する軌道状態導出工程と、をコンピュータに実行させ、前記計測データは、前後方向力の測定値を含み、前記前後方向力は、前記輪軸と、当該輪軸が設けられる前記台車との間に配置される部材に生じる前後方向の力であり、前記部材は、軸箱を支持するための部材であり、前記前後方向は、前記鉄道車両の走行方向に沿う方向であり、前記周波数調整工程は、前記物理量である前記前後方向力の測定値の時系列データから、前記鉄道車両が前記軌道の曲線部を走行することに起因して生じる低周波成分の信号強度を低減する第1の周波数調整工程を有し、前記軌道状態導出工程は、前記輪軸の位置での前記軌道の状態を反映する情報と前記前後方向力との関係を示す関係式と、前記第1の周波数調整工程により低周波成分の信号強度が低減された前記前後方向力の値と、を用いて、前記軌道の状態を反映する情報を導出し、前記関係式は、レールの曲率半径を含まない式に基づく式であることを特徴とする。
A program according to the present invention comprises a data acquisition step of acquiring measurement data which is time-series data of measurement values measured by causing a railway vehicle having a car body, a bogie and a wheelset to travel on a track, and a state of the railway vehicle The frequency adjustment step of reducing the signal strength of the low frequency component generated due to the railway vehicle traveling on the curved portion of the track from the time series data of the physical quantity whose value fluctuates according to the state of the track A track state deriving step of deriving information reflecting the above, the measurement data includes a measurement value of longitudinal force, and the longitudinal force includes the wheel shaft and the bogie provided with the wheel shaft And a member for supporting the axle box, wherein the fore-and-aft direction is a direction along the traveling direction of the railway vehicle. The frequency adjustment step reduces signal strength of low frequency components generated due to the railway vehicle traveling along a curved portion of the track from time-series data of measured values of the longitudinal force which is the physical quantity. A first frequency adjustment step, and the trajectory state derivation step is a relational expression indicating a relationship between information reflecting the condition of the trajectory at the position of the wheelset and the longitudinal force, and the first Information that reflects the state of the trajectory is derived using the value of the longitudinal force in which the signal strength of the low frequency component is reduced by the frequency adjustment step, and the relational expression does not include the radius of curvature of the rail It is characterized by being an expression based on an expression.
以下、図面を参照しながら、本発明の実施形態を説明する。
(概要)
まず、本発明の実施形態の概要を説明する。
図1は、鉄道車両の概略の一例を示す図である。尚、図1において、鉄道車両は、x軸の正の方向に進むものとする(x軸は、鉄道車両の走行方向に沿う軸である)。また、z軸は、軌道16(地面)に対し垂直方向(鉄道車両の高さ方向)であるものとする。y軸は、鉄道車両の走行方向に対して垂直な水平方向(鉄道車両の走行方向と高さ方向との双方に垂直な方向)であるものとする。また、鉄道車両は、営業車両であるものとする。尚、図1および図3において、○の中に●が付されているものは、紙面の奥側から手前側に向かう方向を示す。図1では、この方向は、y軸の正の方向である。図3では、この方向は、z軸の正の方向である。 Hereinafter, embodiments of the present invention will be described with reference to the drawings.
(Overview)
First, an outline of an embodiment of the present invention will be described.
FIG. 1 is a diagram showing an example of a railway vehicle. In addition, in FIG. 1, a railway vehicle is assumed to travel in the positive direction of the x-axis (the x-axis is an axis along the traveling direction of the railway vehicle). In addition, the z axis is perpendicular to the track 16 (ground) (in the height direction of the railway vehicle). The y-axis is assumed to be a horizontal direction perpendicular to the traveling direction of the railcar (a direction perpendicular to both the traveling direction and the height direction of the railcar). Moreover, a railway vehicle shall be a sales vehicle. In FIGS. 1 and 3, a circle with a circle indicates a direction from the back side to the front side of the drawing. In FIG. 1, this direction is the positive direction of the y-axis. In FIG. 3, this direction is the positive direction of the z-axis.
図1に示すように本実施形態では、鉄道車両は、車体11と、台車12a、12bと、輪軸13a~13dとを有する。このように本実施形態では、1つの車体11に、2つの台車12a、12bと4組の輪軸13a~13dとが備わる鉄道車両を例に挙げて説明する。輪軸13a~13dは、車軸15a~15dとその両端に設けられた車輪14a~14dとを有する。本実施形態では、台車12a、12bが、ボルスタレス台車である場合を例に挙げて説明する。尚、図1では、表記の都合上、輪軸13a~13dの一方の車輪14a~14dのみを示すが、輪軸13a~13dの他方にも車輪が設けられている(図1に示す例では、車輪は合計8個ある)。また、鉄道車両は、図1に示す構成要素以外の構成要素(後述する運動方程式で説明する構成要素等)を有するが、表記の都合上、図1では、当該構成要素の図示を省略する。例えば、台車12a、12bは、台車枠および枕バネなどを有する。また、各輪軸13a~13dの左右方向の両側には、軸箱が配置される。また、台車枠と軸箱は、軸箱支持装置により相互に結合される。軸箱支持装置は、軸箱および台車枠との間に配置される装置(サスペンション)である。軸箱支持装置は、軌道16から鉄道車両に伝わる振動を吸収する。また、軸箱支持装置は、軸箱が台車枠に対してx軸に沿う方向およびy軸に沿う方向に移動することを抑制するように(好ましくは、当該移動が生じないように)軸箱の台車枠に対する位置を規制した状態で軸箱を支持する。軸箱支持装置は、各輪軸13a~13dのy軸に沿う方向の両側に配置される。尚、鉄道車両自体は公知の技術で実現できるので、ここでは、その詳細な説明を省略する。
As shown in FIG. 1, in the present embodiment, the railway vehicle has a vehicle body 11, bogies 12a and 12b, and wheel sets 13a to 13d. As described above, in the present embodiment, a railway vehicle including two bogies 12a and 12b and four sets of wheel sets 13a to 13d in one vehicle body 11 will be described as an example. The wheelset 13a-13d has axles 15a-15d and wheels 14a-14d provided at both ends thereof. In this embodiment, the case where bogies 12a and 12b are bolsterless bogies will be described as an example. In FIG. 1, only one of the wheels 14a to 14d of the wheel sets 13a to 13d is shown for convenience of description, but wheels are provided on the other of the wheel sets 13a to 13d (in the example shown in FIG. There are a total of eight). Moreover, although a rail vehicle has components (A component etc. which are demonstrated by the equation of motion mentioned later) other than the component shown in FIG. 1, illustration of the said component is abbreviate | omitted in FIG. For example, the carriages 12a and 12b have a carriage frame, a pillow spring, and the like. Further, axle boxes are disposed on both sides in the left-right direction of the respective wheel sets 13a to 13d. In addition, the bogie frame and the axle box are mutually coupled by the axle box support device. The axle box support device is a device (suspension) disposed between the axle box and the bogie frame. The axle box supporting device absorbs the vibration transmitted from the track 16 to the railway vehicle. Also, the axle box support device is configured to prevent the axle box from moving in the direction along the x-axis and the direction along the y-axis with respect to the bogie frame (preferably, so that the movement does not occur) The axle box is supported in a state where the position of the wheel with respect to the bogie frame is restricted The axle box support devices are disposed on both sides in the direction along the y-axis of each wheelset 13a-13d. In addition, since a railway vehicle itself can be realized by a known technique, the detailed description thereof is omitted here.
鉄道車両が軌道16上を走行すると、車輪14a~14dと軌道16との間の作用力(クリープ力)が振動源となり、輪軸13a~13d、台車12a、12b、車体11に振動が順次伝搬する。図2は、鉄道車両の構成要素(輪軸13a~13d、台車12a、12b、車体11)の主な運動の方向を概念的に示す図である。図2に示すx軸、y軸、z軸は、それぞれ、図1に示したx軸、y軸、z軸に対応する。
When the railway vehicle travels on the track 16, the acting force (creep force) between the wheels 14a to 14d and the track 16 becomes a vibration source, and the vibrations are sequentially transmitted to the wheel sets 13a to 13d, the bogies 12a and 12b, and the vehicle body 11. . FIG. 2 is a view conceptually showing the main movement directions of the components of the railway vehicle (wheel axles 13a to 13d, carriages 12a and 12b, and vehicle body 11). The x-axis, y-axis and z-axis shown in FIG. 2 correspond to the x-axis, y-axis and z-axis shown in FIG. 1, respectively.
図2に示すように本実施形態では、輪軸13a~13d、台車12a、12b、および車体11が、x軸を回動軸として回動する運動と、z軸を回動軸として回動する運動と、y軸に沿う方向の運動とを行う場合を例に挙げて説明する。以下の説明では、x軸を回動軸として回動する運動を必要に応じてローリングと称し、x軸を回動軸とする回動方向を必要に応じてローリング方向と称し、x軸に沿う方向を必要に応じて前後方向と称する。尚、前後方向は、鉄道車両の走行方向である。本実施形態では、x軸に沿う方向が鉄道車両の走行方向であるものとする。また、z軸を回動軸として回動する運動を必要に応じてヨーイングと称し、z軸を回動軸とする回動方向を必要に応じてヨーイング方向と称し、z軸に沿う方向を必要に応じて上下方向と称する。尚、上下方向は、軌道16に対し垂直な方向である。また、y軸に沿う方向の運動を必要に応じて横振動と称し、y軸に沿う方向を必要に応じて左右方向と称する。尚、左右方向は、前後方向(鉄道車両の走行方向)と上下方向(軌道16に対し垂直な方向)との双方に垂直な方向である。尚、鉄道車両は、この他の運動も行うが、各実施形態では説明を簡単にするため、これらの運動については考慮しないものとする。しかしながら、これらの運動を考慮してもよい。
As shown in FIG. 2, in the present embodiment, the wheel shafts 13a to 13d, the bogies 12a and 12b, and the vehicle body 11 rotate with the x axis as a rotation axis and with the z axis as a rotation axis. The case of performing movement in the direction along the y-axis will be described as an example. In the following description, the movement of rotating about the x axis as the rotation axis is referred to as rolling if necessary, and the rotation direction about the x axis as the rotation axis is referred to as the rolling direction as needed along the x axis The direction is referred to as the front-rear direction as needed. In addition, the front-rear direction is the traveling direction of the railway vehicle. In the present embodiment, it is assumed that the direction along the x-axis is the traveling direction of the railway vehicle. In addition, the movement of rotating about the z axis as the rotation axis is referred to as yawing as required, and the rotation direction about the z axis as the rotation axis is referred to as the yawing direction as necessary, and a direction along the z axis is required. It is called up and down direction according to. The vertical direction is a direction perpendicular to the track 16. In addition, movement in a direction along the y-axis is referred to as lateral vibration as needed, and a direction along the y-axis is referred to as left-right direction as needed. The left-right direction is a direction perpendicular to both the front-rear direction (the running direction of the railway vehicle) and the vertical direction (the direction perpendicular to the track 16). The railcar also performs other exercises, but in each embodiment, these exercises are not considered in order to simplify the description. However, these movements may be taken into account.
本発明者らは、輪軸13a~13b(13c~13d)と、当該輪軸13a~13b(13c~13d)が設けられる台車12a(12b)との間に配置される部材に生じる前後方向の力の測定値を用いて、軌道不整(軌道16の外観上の不良)を反映する情報の一例として通り狂い量を算出する方法に想到した。以下の説明では、この部材に生じる前後方向の力を、必要に応じて前後方向力と称する。
The inventors of the present invention have the force in the front-rear direction generated in the member disposed between the wheel sets 13a to 13b (13c to 13d) and the carriage 12a (12b) on which the wheel sets 13a to 13b (13c to 13d) are provided. A method of calculating the amount of deviation as an example of information reflecting the track irregularity (defect on the appearance of the track 16) using the measured values was conceived. In the following description, the force in the front-rear direction generated in this member will be referred to as the front-rear direction force as needed.
通り狂い量は、鉄道車両の直線軌道の走行時における運動を記述する運動方程式に基づく式であって、通り狂い量と前後方向力との関係を示す式を用いて算出される。軌道16には、直線部と曲線部とが含まれる。以下の説明では、軌道16の直線部を必要に応じて直線軌道と称し、軌道16の曲線部を必要に応じて曲線軌道と称する。曲線軌道を走行する鉄道車両の運動を記述する運動方程式では、走行時に鉄道車両が受ける遠心力等を考慮する必要がある。従って、曲線軌道を走行する鉄道車両の運動を記述する運動方程式には、レールの曲率半径を含む項が含まれる。よって、前後方向力の測定誤差が通り狂い量の精度に反映され易くなり、通り狂い量を高精度に算出することができなくなる虞がある。
The amount of deviation is an equation based on an equation of motion that describes the movement of the railway vehicle when traveling on a straight track, and is calculated using an equation that indicates the relationship between the amount of deviation and the longitudinal force. The track 16 includes straight and curved portions. In the following description, the straight part of the track 16 will be referred to as a straight track as required, and the curved part of the track 16 will be referred to as a curved track as required. In the equation of motion describing the motion of a railway vehicle traveling on a curved track, it is necessary to take into consideration the centrifugal force or the like that the railway vehicle receives when traveling. Thus, the equation of motion describing the motion of a railcar traveling on a curved track includes a term that includes the radius of curvature of the rail. Therefore, the measurement error of the front-rear direction force is likely to be reflected on the accuracy of the deviation amount, and there is a possibility that the deviation amount can not be calculated with high accuracy.
本発明者らは、鉄道車両が曲線軌道を走行する場合には、直線軌道を走行しているときに対し、前後方向力の測定値が或るバイアスを持つことに着目した。通り狂いによる前後方向力の成分自体は、曲線軌道であっても直線軌道であっても同じように生じる。そこで、本発明者らは、通り狂い量自体は、前記バイアスの量とは無関係であると考え、前後方向力の測定値の時系列データから低周波成分(前記バイアスの挙動)を低減させればよいと考えた。このことから、本発明者らは、低周波成分が低減された前後方向力の値の時系列データを、鉄道車両の直線軌道の走行時における運動を記述する運動方程式に基づく式であって、通り狂い量と前後方向力との関係を示す式に与えることによって、通り狂い量を算出することに想到した。このようにして通り狂い量を算出することによって、鉄道車両の直線軌道の走行時における運動を記述する運動方程式に基づく式を用いているのにも関わらず、曲線軌道における通り狂い量を算出することができる。また、通り狂い量の算出式は、曲線軌道であっても直線軌道であっても同じ算出式になる。
The present inventors focused on the fact that when the railway vehicle travels on a curved track, the measured value of the longitudinal force has a certain bias, as opposed to traveling on a straight track. The component of the fore-aft direction force due to the deviation is the same whether it is a curvilinear trajectory or a linear trajectory. Therefore, the inventors consider that the amount of deviation as such is irrelevant to the amount of the bias, and reduces the low frequency component (the behavior of the bias) from the time series data of the measured values of the back and forth force. I thought it would be fine. From this, the inventors of the present invention are time-series data of the value of the longitudinal force with reduced low frequency components, an equation based on an equation of motion that describes the motion during traveling of the straight track of the railway vehicle, By giving an equation showing the relationship between the amount of deviation and the force in the back and forth direction, I thought of calculating the amount of deviation. By calculating the amount of deviation as described above, the amount of deviation in a curved track is calculated despite the use of an equation based on an equation of motion that describes the movement of the railway vehicle when traveling in a straight track. be able to. Further, the formula for calculating the amount of deviation is the same formula whether it is a curved track or a straight track.
(運動方程式)
以上のことを前提として、鉄道車両の直線軌道の走行時における運動を記述する運動方程式の一例を説明する。本実施形態では、鉄道車両が21自由度を有する場合を例に挙げて説明する。即ち、輪軸13a~13dが、左右方向における運動(横振動)とヨーイング方向における運動(ヨーイング)とを行うものとする(2×4セット=8自由度)。また、台車12a、12bが、左右方向における運動(横振動)とヨーイング方向における運動(ヨーイング)とローリング方向における運動(ローリング)とを行うものとする(3×2セット=6自由度)。また、車体11が、左右方向における運動(横振動)とヨーイング方向における運動(ヨーイング)とローリング方向における運動(ローリング)とを行うものとする(3×1セット=3自由度)。また、台車12a、12bに対してそれぞれ設けられている空気バネ(枕バネ)が、ローリング方向における運動(ローリング)を行うものとする(1×2セット=2自由度)。また、台車12a、12bに対してそれぞれ設けられているヨーダンパが、ヨーイング方向における運動(ヨーイング)を行うものとする(1×2セット=2自由度)。 (Equation of motion)
On the premise of the above, an example of an equation of motion that describes the movement of the railway vehicle when traveling on a straight track will be described. In the present embodiment, a case where a railway vehicle has 21 degrees of freedom will be described as an example. That is, it is assumed that the wheel sets 13a to 13d perform movement in the lateral direction (lateral vibration) and movement in the yawing direction (yawing) (2 × 4 sets = 8 degrees of freedom). Further, it is assumed that the bogies 12a and 12b perform movement in the lateral direction (lateral vibration), movement in the yawing direction (yawing), and movement in the rolling direction (rolling) (3 × 2 sets = 6 degrees of freedom). Further, it is assumed that the vehicle body 11 performs movement in the lateral direction (lateral vibration), movement in the yawing direction (yawing), and movement in the rolling direction (rolling) (3 × 1 set = 3 degrees of freedom). In addition, air springs (pillow springs) provided respectively for the carriages 12a and 12b perform movement (rolling) in the rolling direction (1 × 2 set = 2 degrees of freedom). In addition, it is assumed that yaw dampers provided respectively for the carriages 12a and 12b perform movement (yawing) in the yawing direction (1 × 2 sets = 2 degrees of freedom).
以上のことを前提として、鉄道車両の直線軌道の走行時における運動を記述する運動方程式の一例を説明する。本実施形態では、鉄道車両が21自由度を有する場合を例に挙げて説明する。即ち、輪軸13a~13dが、左右方向における運動(横振動)とヨーイング方向における運動(ヨーイング)とを行うものとする(2×4セット=8自由度)。また、台車12a、12bが、左右方向における運動(横振動)とヨーイング方向における運動(ヨーイング)とローリング方向における運動(ローリング)とを行うものとする(3×2セット=6自由度)。また、車体11が、左右方向における運動(横振動)とヨーイング方向における運動(ヨーイング)とローリング方向における運動(ローリング)とを行うものとする(3×1セット=3自由度)。また、台車12a、12bに対してそれぞれ設けられている空気バネ(枕バネ)が、ローリング方向における運動(ローリング)を行うものとする(1×2セット=2自由度)。また、台車12a、12bに対してそれぞれ設けられているヨーダンパが、ヨーイング方向における運動(ヨーイング)を行うものとする(1×2セット=2自由度)。 (Equation of motion)
On the premise of the above, an example of an equation of motion that describes the movement of the railway vehicle when traveling on a straight track will be described. In the present embodiment, a case where a railway vehicle has 21 degrees of freedom will be described as an example. That is, it is assumed that the wheel sets 13a to 13d perform movement in the lateral direction (lateral vibration) and movement in the yawing direction (yawing) (2 × 4 sets = 8 degrees of freedom). Further, it is assumed that the
尚、自由度は、21自由度に限定されない。自由度を大きくすれば計算精度は向上するが、計算負荷が高くなる。また、後述するカルマンフィルタの動作が安定しなくなる虞がある。これらの点を考慮して自由度を適宜決定することができる。また、以下の運動方程式は、それぞれの構成要素(車体11、台車12a、12b、輪軸13a~13d)のそれぞれの方向(左右方向、ヨーイング方向、ローリング方向)の動作を、例えば、非特許文献1、2の記載に基づいて表すことにより実現することができる。従って、ここでは、それぞれの運動方程式の概要を説明し、詳細な説明を省略する。尚、以下の各式には、軌道16(レール)の曲率半径(曲率)を含む項が存在しない。即ち、以下の各式は、鉄道車両が直線軌道を走行することを表現する式となる。鉄道車両が曲線軌道を走行することを表現する式において、軌道16(レール)の曲率半径を無限大(曲率を0(ゼロ))とすることにより、鉄道車両が直線軌道を走行することを表現する式が得られる。
The degree of freedom is not limited to 21 degrees of freedom. Increasing the degree of freedom improves the calculation accuracy but increases the calculation load. In addition, there is a possibility that the operation of a Kalman filter described later may not be stable. The degree of freedom can be appropriately determined in consideration of these points. Further, the following equation of motion is for example, non-patent document 1 to operate the respective components (the vehicle body 11, the carriages 12a and 12b, and the wheel axles 13a to 13d) in the respective directions (horizontal direction, yawing direction and rolling direction). This can be realized by expressing based on the description of 2). Therefore, here, the outline of each equation of motion will be described, and the detailed description will be omitted. In each of the following equations, there is no term including the radius of curvature (curvature) of the track 16 (rail). That is, each of the following equations is an equation expressing that a railway vehicle travels on a straight track. In the expression expressing that a railway vehicle travels on a curved track, expressing that the railway vehicle travels on a straight track by setting the curvature radius of the track 16 (rail) to infinity (curvature is 0 (zero)) The equation to obtain is obtained.
以下の各式において、添え字wは、輪軸13a~13dを表す。添え字w(のみ)が付されている変数は、輪軸13a~13dで共通であることを表す。添え字w1、w2、w3、w4はそれぞれ、輪軸13a、13b、13c、13dを表す。
添え字t、Tは、台車12a、12bを表す。添え字t、T(のみ)が付されている変数は、台車12a、12bで共通であることを表す。添え字t1、t2はそれぞれ、台車12a、12bを表す。
添え字b、Bは、車体11であることを表す。 In each of the following formulas, the suffix w represents the wheel sets 13a to 13d. The variable with the suffix w (only) indicates that it is common to the wheel sets 13a to 13d. The suffixes w1, w2, w3 and w4 represent the wheel sets 13a, 13b, 13c and 13d, respectively.
The subscripts t and T represent the carriages 12a and 12b. The variables with suffixes t and T (only) indicate that they are common to the bogies 12a and 12b. The subscripts t1 and t2 represent the carriages 12a and 12b, respectively.
The suffixes b and B indicate that thevehicle body 11 is used.
添え字t、Tは、台車12a、12bを表す。添え字t、T(のみ)が付されている変数は、台車12a、12bで共通であることを表す。添え字t1、t2はそれぞれ、台車12a、12bを表す。
添え字b、Bは、車体11であることを表す。 In each of the following formulas, the suffix w represents the wheel sets 13a to 13d. The variable with the suffix w (only) indicates that it is common to the wheel sets 13a to 13d. The suffixes w1, w2, w3 and w4 represent the
The subscripts t and T represent the
The suffixes b and B indicate that the
添え字xは、前後方向またはローリング方向を表し、添え字yは、左右方向を表し、添え字zは、上下方向またはヨーイング方向を表す。
また、変数の上に付している「・・」、「・」はそれぞれ、2階時間微分、1階時間微分を表す。
尚、以下の運動方程式の説明に際し、必要に応じて、既出の変数の説明を省略する。 The subscript x represents the longitudinal direction or the rolling direction, the subscript y represents the lateral direction, and the subscript z represents the vertical direction or the yawing direction.
Also, “····························· above the variable represents the second order time derivative and the first order time derivative, respectively.
In the following description of the equation of motion, the explanations of the variables already described will be omitted as necessary.
[輪軸の横振動]
輪軸13a~13dの横振動(左右方向における運動)を記述する運動方程式は、以下の(1)式~(4)式で表される。 [Lateral vibration of wheelset]
Equations of motion describing the lateral vibrations (movement in the left and right direction) of the wheel sets 13a to 13d are expressed by the following equations (1) to (4).
輪軸13a~13dの横振動(左右方向における運動)を記述する運動方程式は、以下の(1)式~(4)式で表される。 [Lateral vibration of wheelset]
Equations of motion describing the lateral vibrations (movement in the left and right direction) of the wheel sets 13a to 13d are expressed by the following equations (1) to (4).
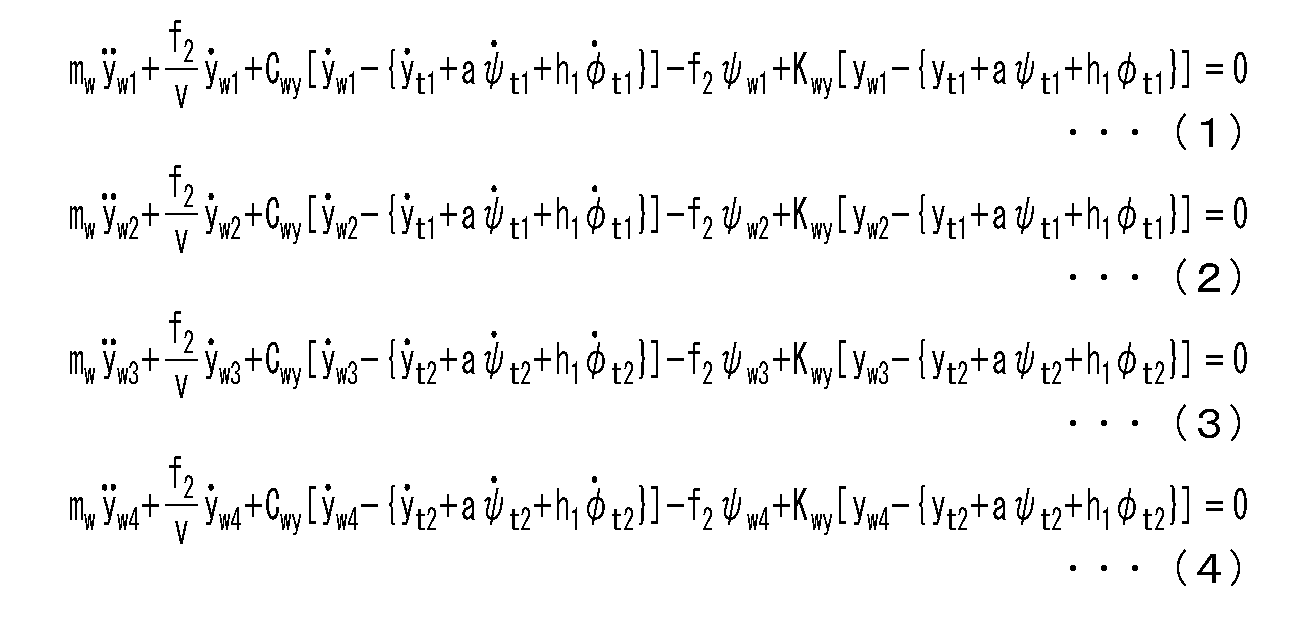
mwは、輪軸13a~13dの質量である。yw1・・(式において・・はyw1の上に付される(以下、その他の変数についても同様))は、輪軸13aの左右方向における加速度である。f2は、横クリープ係数である。vは、鉄道車両の走行速度である。yw1・(式において・はyw1の上に付される(以下、その他の変数についても同様))は、輪軸13aの左右方向における速度である。Cwyは、軸箱と輪軸とをつなぐ軸箱支持装置の左右方向におけるダンピング定数である。yt1・は、台車12aの左右方向における速度である。aは、台車12a、12bに設けられている輪軸13a・13b、13c・13d間の前後方向における距離の1/2を表す(台車12a、12bに設けられている輪軸13a・13b、13c・13d間の距離は2aになる)。ψt1・は、台車12aのヨーイング方向における角速度である。h1は、車軸の中心と台車12aの重心との上下方向における距離である。φt1・は、台車12aのローリング方向における角速度である。ψw1は、輪軸13aのヨーイング方向における回動量(角変位)である。Kwyは、軸箱支持装置の左右方向のバネ定数である。yw1は、輪軸13aの左右方向における変位である。yt1は、台車12aの左右方向における変位である。ψt1は、台車12aのヨーイング方向における回動量(角変位)である。φt1は、台車12aのローリング方向における回動量(角変位)である。尚、(2)式~(4)式の各変数は、前述した添え字の意味に従って(1)式の変数を読み替えることにより表される。
m w is the mass of the wheel sets 13a to 13d. y w1 ... (where in the formula... is added above y w1 (hereinafter, the same applies to other variables as well)) is an acceleration in the left-right direction of the wheel shaft 13a. f 2 is a lateral creep coefficient. v is the traveling speed of the railway vehicle. y w1 · (in the formula, · · added above y w1 (hereinafter, the same applies to other variables)) is the velocity in the left-right direction of the wheel set 13a. C wy is a damping constant in the left-right direction of an axle box supporting device connecting the axle box and the wheelset . y t1 · is the velocity in the left-right direction of the carriage 12a. “a” represents one half of the distance between the wheelset 13a, 13b, 13c, 13d provided on the carriages 12a, 12b in the front-rear direction ( wheelset 13a, 13b, 13c, 13d provided on the carriages 12a, 12b The distance between will be 2a). [psi t1 · is the angular velocity in the yawing direction of the carriage 12a. h 1 is the distance in the vertical direction between the center of gravity and the center of the truck 12a of the axle. φ t1 · is the angular velocity in the rolling direction of the carriage 12a. W w1 is the amount of rotation (angular displacement) in the yawing direction of the wheel set 13a. K wy is a spring constant in the lateral direction of the axle box support device. y w1 is a displacement of the wheel set 13 a in the left-right direction. y t1 is a displacement in the left-right direction of the carriage 12a. ψ t1 is the amount of rotation (angular displacement) in the yawing direction of the carriage 12a. φ t1 is the amount of rotation (angular displacement) in the rolling direction of the carriage 12a. The variables in the equations (2) to (4) are expressed by replacing the variables in the equation (1) according to the meaning of the subscripts described above.
[輪軸のヨーイング]
輪軸13a~13dのヨーイングを記述する運動方程式は、以下の(5)式~(8)式で表される。 [Yaw of wheelset]
The equations of motion describing the yawing of the wheel sets 13a to 13d are expressed by the following equations (5) to (8).
輪軸13a~13dのヨーイングを記述する運動方程式は、以下の(5)式~(8)式で表される。 [Yaw of wheelset]
The equations of motion describing the yawing of the wheel sets 13a to 13d are expressed by the following equations (5) to (8).
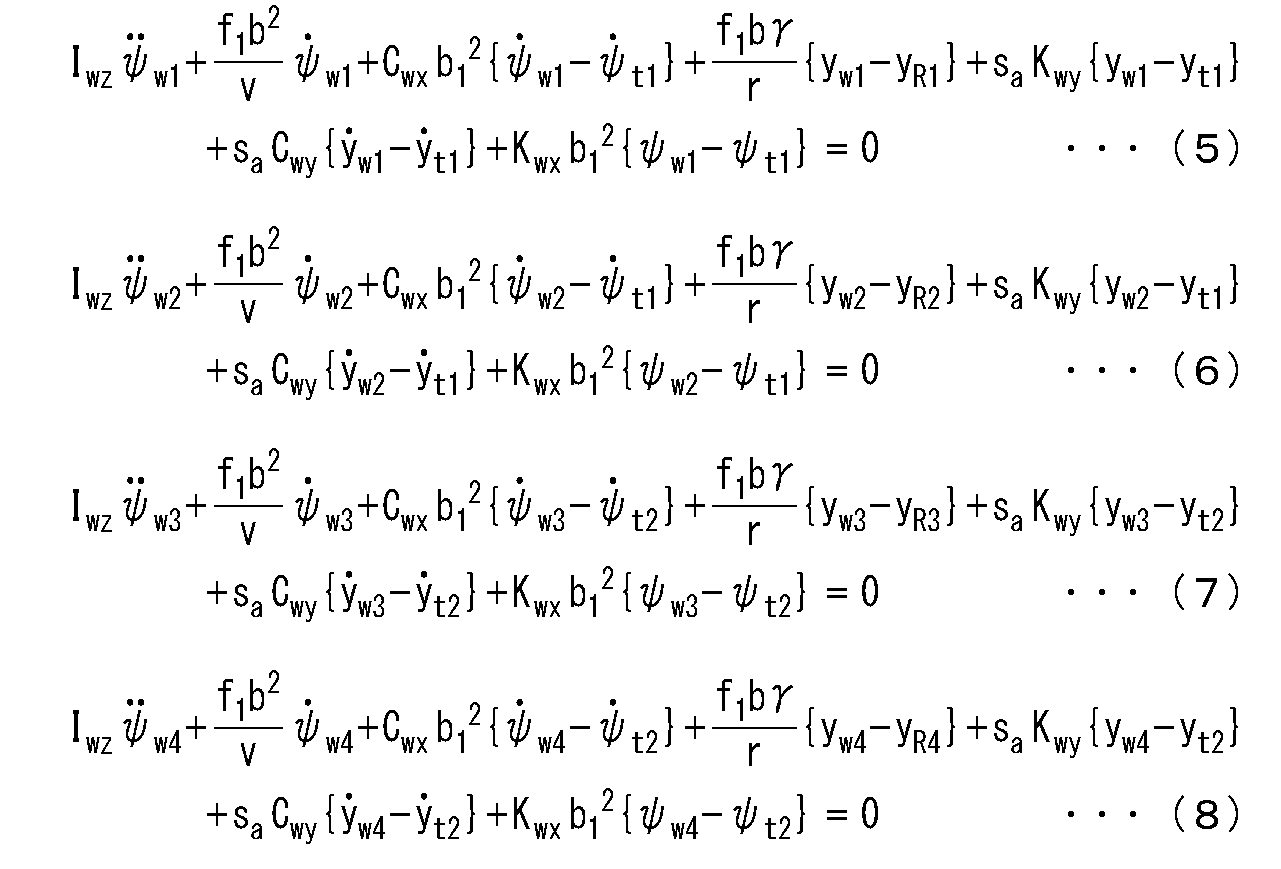
Iwzは、輪軸13a~13dのヨーイング方向における慣性モーメントである。ψw1・・は、輪軸13aのヨーイング方向における角加速度である。f1は、縦クリープ係数である。bは、輪軸13a~13dに取り付けられている2つの車輪と軌道16(レール)との接点の間の左右方向における距離である。ψw1・は、輪軸13aのヨーイング方向における角速度である。Cwxは、軸箱支持装置の前後方向のダンピング定数である。b1は、軸箱支持装置の左右方向における間隔の1/2を表す(1つの輪軸に対して左右に設けられている2つの軸箱支持装置の左右方向における間隔は2b1になる)。γは、踏面勾配である。rは、車輪14a~14dの半径である。yR1は、輪軸13aの位置での通り狂い量である。saは、車軸15a~15dの中心から軸箱支持バネまでの前後方向におけるオフセット量である。yt1は、台車12aの左右方向における変位である。Kwxは、軸箱支持装置の前後方向のバネ定数である。尚、(6)式~(8)式の各変数は、前述した添え字の意味に従って(5)式の変数を読み替えることにより表される。ただし、yR2、yR3、yR4はそれぞれ、輪軸13b、13c、13dの位置での通り狂い量である。
I wz is a moment of inertia in the yawing direction of the wheel sets 13a to 13d. [psi w1 · · is the angular acceleration in the yawing direction of the wheel shaft 13a. f 1 is the longitudinal creep factor. b is the distance in the left-right direction between the contact points of the two wheels attached to the wheel sets 13a to 13d and the track 16 (rail). [psi w1 · is the angular velocity in the yawing direction of the wheel shaft 13a. C wx is a damping constant in the longitudinal direction of the axle box support device. b 1 is the left-right direction represents the 1/2 of the interval in the axle box support device (spacing in the lateral direction of the two axle box support device which is provided to the left and right with respect to a single wheel set will 2b 1). γ is a tread slope. r is the radius of the wheels 14a-14d. y R1 is a deviation amount at the position of the wheel set 13a. s a is an offset amount in the front-rear direction from the center of the axles 15a to 15d to the axle box support spring. y t1 is a displacement in the left-right direction of the carriage 12a. K wx is a longitudinal spring constant of the axle box support device. The variables in the equations (6) to (8) are expressed by replacing the variables in the equation (5) according to the meaning of the subscripts described above. However, y R2 , y R3 and y R4 are the amounts of deviation at the positions of the wheel sets 13 b, 13 c and 13 d, respectively.
ここで、通り狂いとは、日本工業規格(JIS E 1001:2001)に記載されているように、レールの長手方向の左右の変位である。通り狂い量は、その変位の量である。図3Aおよび図3Bに、輪軸13aの位置での通り狂い量yR1の一例を示す。図3Aでは、軌道16が、直線軌道である場合を例に挙げて説明する。図3Bでは、軌道16が、曲線軌道である場合を例に挙げて説明する。図3Aおよび図3Bにおいて、16aは、レールを示し、16bは、枕木を示す。図3Aでは、輪軸13aの車輪14aが位置301でレール16aと接触しているとする。図3Bでは、輪軸13aの車輪14aが位置302でレール16aと接触しているとする。輪軸13aの位置での通り狂い量yR1は、輪軸13aの車輪14aとレール16aとの接触位置と、正規の状態であると仮定した場合のレール16aの位置と、の左右方向の距離である。輪軸13aの位置とは、輪軸13aの車輪14aとレール16aとの接触位置である。輪軸13b、13c、13dの位置での通り狂い量yR2、yR3、yR4も、輪軸13aの位置での通り狂い量yR1と同様に定義される。
Here, as described in Japanese Industrial Standard (JIS E 1001: 2001), as used herein, the term "deviation" refers to the lateral displacement of the rail in the longitudinal direction. The amount of deviation is the amount of displacement. FIGS. 3A and 3B show an example of the amount of deviation y R1 at the position of the wheel set 13a. In FIG. 3A, the case where the orbit 16 is a linear orbit will be described as an example. In FIG. 3B, the case where the orbit 16 is a curved orbit will be described as an example. In FIG. 3A and 3B, 16a shows a rail and 16b shows a tie. In FIG. 3A, it is assumed that the wheel 14a of the wheelset 13a is in contact with the rail 16a at the position 301. In FIG. 3B, it is assumed that the wheel 14a of the wheelset 13a is in contact with the rail 16a at the position 302. The amount of deviation y R1 at the position of the wheel set 13a is the distance between the contact position of the wheel 14a of the wheel set 13a and the rail 16a and the position of the rail 16a when assuming the normal state. . The position of the wheelset 13a is the contact position between the wheel 14a of the wheelset 13a and the rail 16a. Wheel shaft 13b, 13c, as deviation amount at the position of 13d y R2, y R3, y R4 is also defined as in as deviation amount y R1 at the position of the wheel shaft 13a.
[台車の横振動]
台車12a、12bの横振動(左右方向における運動)を記述する運動方程式は、以下の(9)式、(10)式で表される。 [Horizontal vibration of the dolly]
Equations of motion describing the lateral vibrations (movement in the left and right direction) of the carriages 12a and 12b are expressed by the following equations (9) and (10).
台車12a、12bの横振動(左右方向における運動)を記述する運動方程式は、以下の(9)式、(10)式で表される。 [Horizontal vibration of the dolly]
Equations of motion describing the lateral vibrations (movement in the left and right direction) of the
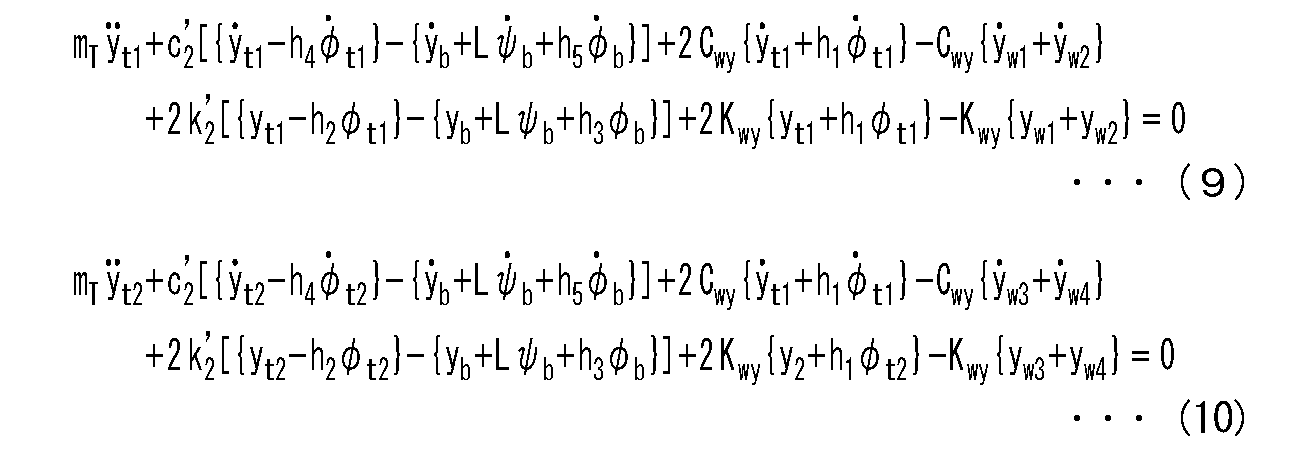
mTは、台車12a、12bの質量である。yt1・・は、台車12aの左右方向における加速度である。c´2は、左右動ダンパのダンピング定数である。h4は、台車12aの重心と左右動ダンパとの上下方向における距離である。yb・は、車体11の左右方向における速度である。Lは、台車12a、12bの中心間の前後方向における間隔の1/2を表す(台車12a、12bの中心間の前後方向における間隔は2Lになる)。ψb・は、車体11のヨーイング方向における角速度である。h5は、左右動ダンパと車体11の重心との間の上下方向における距離である。φb・は、車体11のローリング方向における角速度である。yw2・は、輪軸13bの左右方向における速度である。k´2は、空気バネ(枕バネ)の左右方向のバネ定数である。h2は、台車12a、12bの重心と空気バネ(枕バネ)の中心との間の上下方向における距離である。ybは、車体11の左右方向における変位である。ψbは、車体11のヨーイング方向における回動量(角変位)である。h3は、空気バネ(枕バネ)の中心と車体11の重心との間の上下方向における距離である。φbは、車体11のローリング方向における回動量(角変位)である。尚、(10)式の各変数は、前述した添え字の意味に従って(9)式の変数を読み替えることにより表される。
m T is the mass of the carriages 12a and 12b. y t1 .. is the acceleration in the left-right direction of the carriage 12a. c ' 2 is a damping constant of the left and right movement damper. h 4 is the distance in the vertical direction between the center of gravity of the carriage 12a and lateral movement damper. y b · is the velocity in the left-right direction of the vehicle body 11. L represents one half of the distance between the centers of the bogies 12a and 12b in the front-rear direction (the distance between the centers of the bogies 12a and 12b in the front-rear direction is 2L). [psi b · is an angular velocity in the yawing direction of the vehicle body 11. h 5 is the distance in the vertical direction between the center of gravity of the lateral movement damper and the vehicle body 11. φ b is the angular velocity in the rolling direction of the vehicle body 11. y w2 · is the speed in the left-right direction of the wheel set 13b. k ' 2 is the spring constant of the air spring (pillow spring) in the left-right direction. h 2 is the distance in the vertical direction between the center of the bogie 12a, 12b of the center of gravity and the air spring (pillow spring). y b is a displacement of the vehicle body 11 in the left-right direction. ψ b is the amount of rotation (angular displacement) in the yawing direction of the vehicle body 11. h 3 is the distance in the vertical direction between the center of gravity and the center of the vehicle body 11 of the air spring (pillow spring). φ b is the amount of rotation (angular displacement) in the rolling direction of the vehicle body 11. Each variable of the equation (10) is expressed by replacing the variable of the equation (9) according to the meaning of the subscripts described above.
[台車のヨーイング]
台車12a、12bのヨーイングを記述する運動方程式は、以下の(11)式、(12)式で表される。 [Yawing of the dolly]
Equations of motion describing the yawing of the carriages 12a and 12b are expressed by the following equations (11) and (12).
台車12a、12bのヨーイングを記述する運動方程式は、以下の(11)式、(12)式で表される。 [Yawing of the dolly]
Equations of motion describing the yawing of the
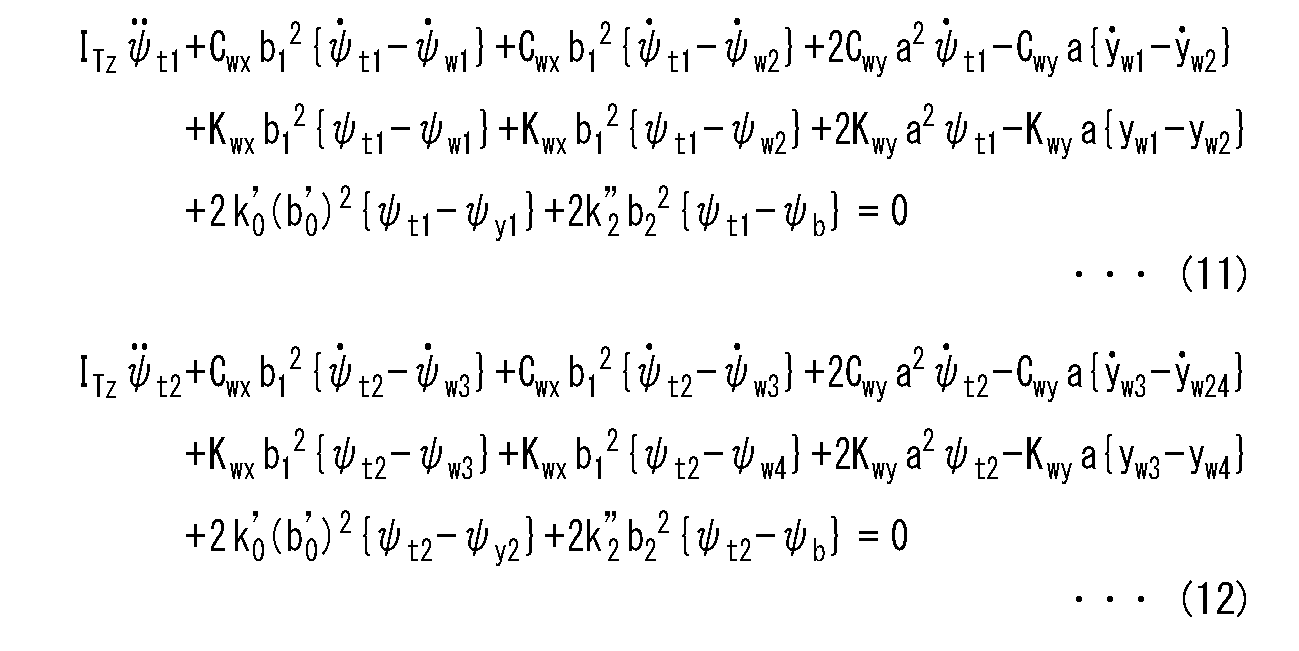
ITzは、台車12a、12bのヨーイング方向における慣性モーメントである。ψt1・・は、台車12aのヨーイング方向における角加速度である。ψw2・は、輪軸13bのヨーイング方向における角速度である。ψw2は、輪軸13bのヨーイング方向における回動量(角変位)である。yw2は、輪軸13bの左右方向における変位である。k´0は、ヨーダンパのゴムブッシュ剛性である。b´0は、台車12a、12bに対し左右に配置された2つのヨーダンパの左右方向における間隔の1/2を表す(台車12a、12bに対し左右に配置された2つのヨーダンパの左右方向における間隔は2b´0になる)。ψy1は、台車12aに配置されたヨーダンパのヨーイング方向における回動量(角変位)である。k´´2は、空気バネ(枕バネ)の左右方向のバネ定数である。b2は、台車12a、12bに対し左右に配置された2つの空気バネ(枕バネ)の左右方向における間隔の1/2を表す(台車12a、12bに対し左右に配置された2つの空気バネ(枕バネ)の左右方向における間隔は2b2になる)。尚、(12)式の各変数は、前述した添え字の意味に従って(11)式の変数を読み替えることにより表される。
I Tz is a moment of inertia in the yawing direction of the bogies 12a, 12b. ψ t1・ is the angular acceleration in the yawing direction of the carriage 12a. [psi w2 · is the angular velocity in the yawing direction of the wheel axle 13b. W w2 is the amount of rotation (angular displacement) of the wheel set 13b in the yawing direction. y w2 is a displacement of the wheel set 13b in the left-right direction. k ' 0 is the rubber bushing stiffness of the yaw damper. b ' 0 represents one half of the interval in the left and right direction of the two yaw dampers disposed on the left and right with respect to the carriages 12a and 12b (the interval in the left and right direction of the two yaw dampers disposed on the left and right with respect to the carriages 12a and 12b Becomes 2b 0 0 ). ψ y1 is the amount of rotation (angular displacement) in the yawing direction of the yaw damper disposed on the carriage 12a. k ′ ′ 2 is a spring constant in the left-right direction of the air spring (pillow spring). b 2 is carriage 12a, 12b to represent the 1/2 distance in the lateral direction of the two air springs which are disposed on the left and right (pillow spring) (carriage 12a, two air springs which are disposed on the left and right with respect to 12b (The distance between the pillow springs in the lateral direction is 2 b 2 ). Each variable of the equation (12) is expressed by replacing the variable of the equation (11) according to the meaning of the subscripts described above.
[台車のローリング]
台車12a、12bのローリングを記述する運動方程式は、以下の(13)式、(14)式で表される。 [Rolling truck]
Equations of motion describing the rolling of the carriages 12a and 12b are expressed by the following equations (13) and (14).
台車12a、12bのローリングを記述する運動方程式は、以下の(13)式、(14)式で表される。 [Rolling truck]
Equations of motion describing the rolling of the
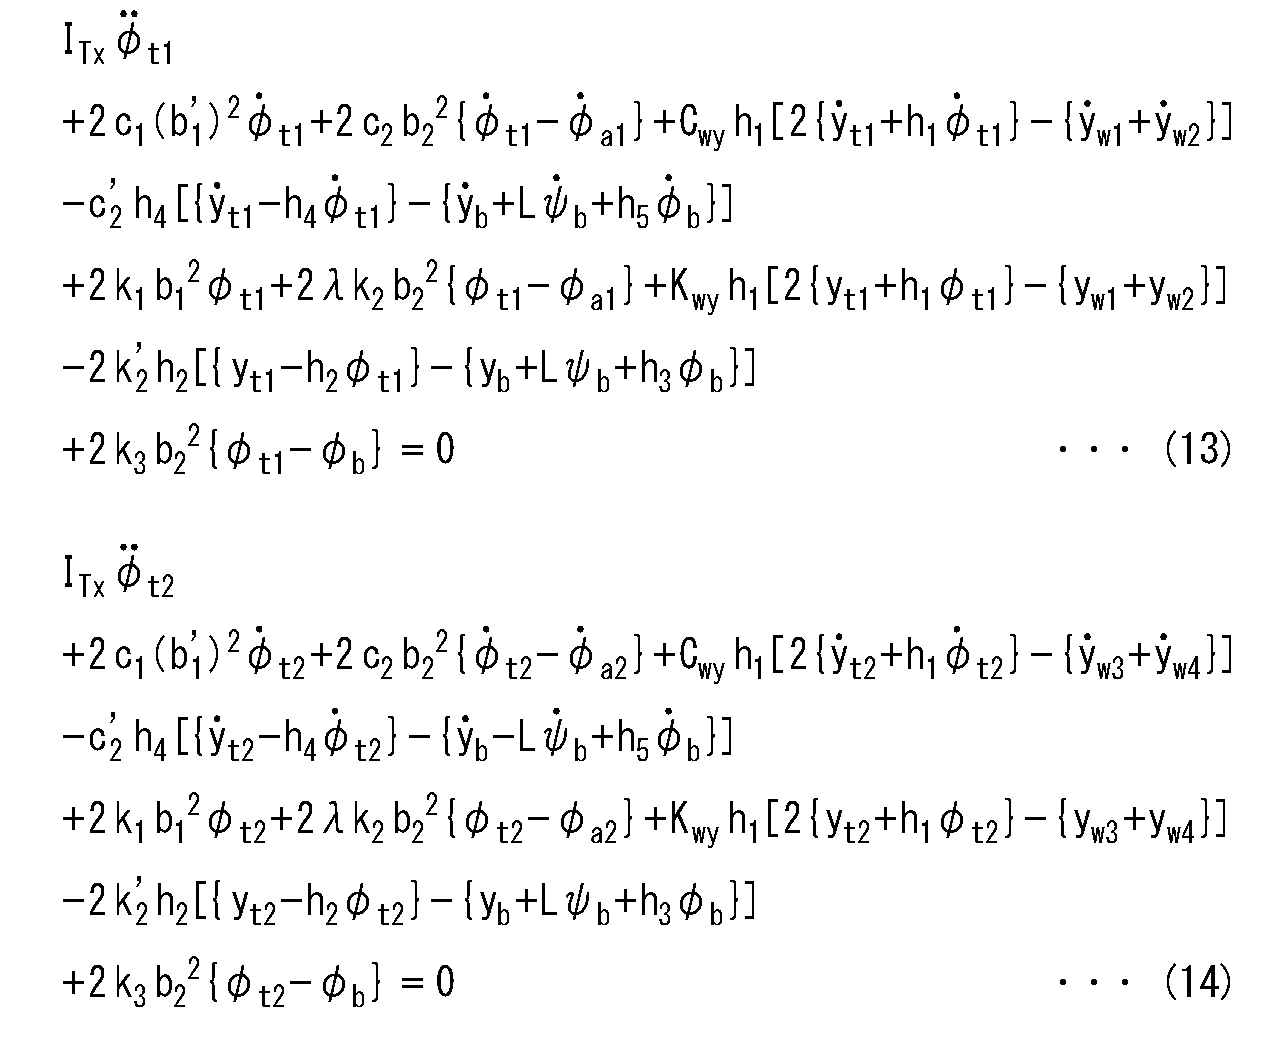
ITxは、台車12a、12bのローリング方向における慣性モーメントである。φt1・・は、台車12aのローリング方向における角加速度である。c1は、軸ダンパの上下方向のダンピング定数である。b´1は、台車12a、12bに対し左右に配置された2つの軸ダンパの左右方向における間隔の1/2を表す(台車12a、12bに対し左右に配置された2つの軸ダンパの左右方向における間隔は2b´1になる)。c2は、空気バネ(枕バネ)の上下方向のダンピング定数である。φa1・は、台車12aに配置された空気バネ(枕バネ)のローリング方向における角速度である。k1は、軸バネの上下方向のバネ定数である。λは、空気バネ(枕バネ)の本体の容積を補助空気室の容積で割った値である。k2は、空気バネ(枕バネ)の上下方向のバネ定数である。φa1は、台車12aに配置された空気バネ(枕バネ)のローリング方向における回動量(角変位)である。k3は、空気バネ(枕バネ)の有効受圧面積の変化による等価剛性である。尚、(14)式の各変数は、前述した添え字の意味に従って(13)式の変数を読み替えることにより表される。ただし、φa2は、台車12bに配置された空気バネ(枕バネ)のローリング方向における回動量(角変位)である。
I Tx is a moment of inertia in the rolling direction of the carriages 12a and 12b. φ t1 · · · is the angular acceleration in the rolling direction of the carriage 12a. c 1 is a damping constant in the vertical direction of the axial damper. b ' 1 represents 1/2 of the interval in the left and right direction of the two axis dampers disposed on the left and right with respect to the bogies 12a and 12b (the left and right direction of the two axis dampers disposed on the left and right with respect to the bogies 12a and 12b The interval at is 2 b ' 1 )). c 2 is a damping constant in the vertical direction of the air spring (pillow spring). phi a1 · is the angular velocity in the rolling direction of the air spring disposed carriage 12a (pillow spring). k 1 is a vertical spring constant of the axial spring. λ is a value obtained by dividing the volume of the air spring (pillow spring) main body by the volume of the auxiliary air chamber. k 2 is a vertical spring constant of the air spring (pillow spring). φ a1 is the amount of rotation (angular displacement) in the rolling direction of the air spring (pillow spring) disposed on the carriage 12a. k 3 is an equivalent stiffness due to the change of the effective pressure receiving area of the air spring (pillow spring). Each variable of the equation (14) is expressed by replacing the variable of the equation (13) according to the meaning of the subscripts described above. However, φ a2 is the amount of rotation (angular displacement) in the rolling direction of the air spring (pillow spring) disposed on the carriage 12 b.
[車体の横振動]
車体11の横振動(左右方向における運動)を記述する運動方程式は、以下の(15)式で表される。 [Lateral vibration of the car body]
An equation of motion describing the lateral vibration (movement in the left and right direction) of thevehicle body 11 is expressed by the following equation (15).
車体11の横振動(左右方向における運動)を記述する運動方程式は、以下の(15)式で表される。 [Lateral vibration of the car body]
An equation of motion describing the lateral vibration (movement in the left and right direction) of the

mBは、台車12a、12bの質量である。yb・・は、車体11の左右方向における加速度である。yt2・は、台車12bの左右方向における速度である。φt2・は、台車12bのローリング方向における角速度である。yt2は、台車12bの左右方向における変位である。φt2は、台車12bのローリング方向における回動量(角変位)である。
m B is the mass of the carriages 12a and 12b. y b · · is the acceleration in the lateral direction of the vehicle body 11. y t2 · is the velocity in the left-right direction of the carriage 12 b. φ t2 · is the angular velocity in the rolling direction of the carriage 12b. y t2 is a displacement in the left-right direction of the carriage 12 b. φ t2 is the amount of rotation (angular displacement) in the rolling direction of the carriage 12b.
[車体のヨーイング]
車体11のヨーイングを記述する運動方程式は、以下の(16)式で表される。 [Yawing of the car body]
An equation of motion describing the yawing of thevehicle body 11 is expressed by the following equation (16).
車体11のヨーイングを記述する運動方程式は、以下の(16)式で表される。 [Yawing of the car body]
An equation of motion describing the yawing of the
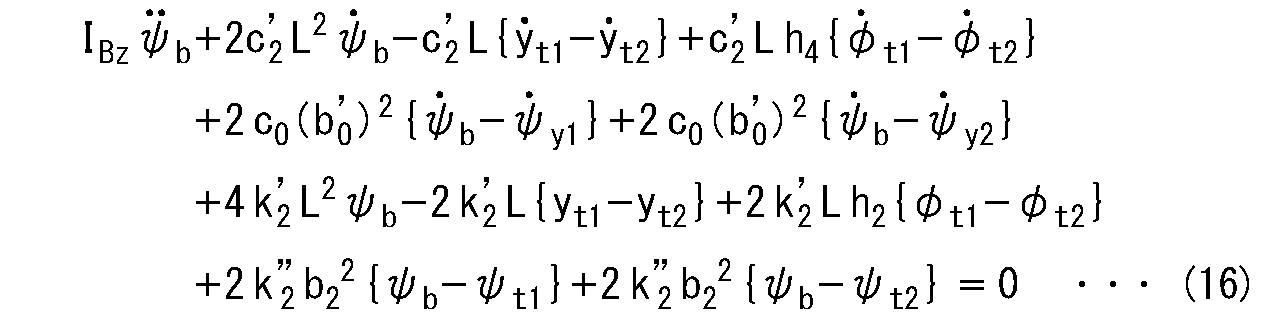
IBzは、車体11のヨーイング方向における慣性モーメントである。ψb・・は、車体11のヨーイング方向における角加速度である。c0は、ヨーダンパの前後方向のダンピング定数である。ψy1・は、台車12aに配置されたヨーダンパのヨーイング方向における角速度である。ψy2・は、台車12bに配置されたヨーダンパのヨーイング方向における角速度である。ψt2は、台車12bのヨーイング方向における回動量(角変位)である。
I Bz is a moment of inertia in the yawing direction of the vehicle body 11. [psi b · · is the angular acceleration in the yawing direction of the vehicle body 11. c 0 is a damping constant in the front-rear direction of the yaw damper. ψ y1 · is the angular velocity in the yawing direction of the yaw damper disposed on the carriage 12a. ψ y2 は is the angular velocity in the yawing direction of the yaw damper disposed on the carriage 12b. ψ t2 is the amount of rotation (angular displacement) in the yawing direction of the carriage 12b.
[車体のローリング]
車体11のローリングを記述する運動方程式は、以下の(17)式で表される。 [Rolling car body]
An equation of motion describing the rolling of thevehicle body 11 is expressed by the following equation (17).
車体11のローリングを記述する運動方程式は、以下の(17)式で表される。 [Rolling car body]
An equation of motion describing the rolling of the

IBxは、車体11のローリング方向における慣性モーメントである。φb・・は、車体11のローリング方向における角加速度である。
I Bx is a moment of inertia in the rolling direction of the vehicle body 11. phi b · · is the angular acceleration in the rolling direction of the vehicle body 11.
[ヨーダンパのヨーイング]
台車12aに配置されたヨーダンパ、台車12bに配置されたヨーダンパのヨーイングを記述する運動方程式は、それぞれ以下の(18)式、(19)式で表される。 [Yaw damper yawing]
The equations of motion describing the yawing of the yaw damper disposed on thecarriage 12a and the yaw damper disposed on the carriage 12b are expressed by the following equations (18) and (19), respectively.
台車12aに配置されたヨーダンパ、台車12bに配置されたヨーダンパのヨーイングを記述する運動方程式は、それぞれ以下の(18)式、(19)式で表される。 [Yaw damper yawing]
The equations of motion describing the yawing of the yaw damper disposed on the
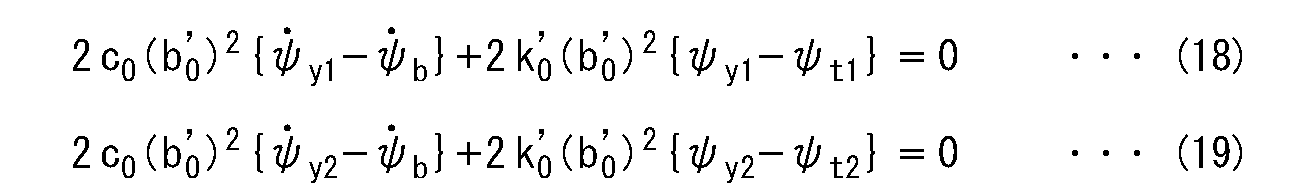
ψy2は、台車12bに配置されたヨーダンパのヨーイング方向における回動量(角変位)である。
ψ y2 is the amount of rotation (angular displacement) in the yawing direction of the yaw damper disposed on the carriage 12b.
[空気バネ(枕バネ)のローリング]
台車12aに配置された空気バネ(枕バネ)、台車12bに配置された空気バネ(枕バネ)のローリングを記述する運動方程式は、それぞれ以下の(20)式、(21)式で表される。 [Rolling of air spring (pillow spring)]
Equations of motion describing the rolling of the air spring (pillow spring) disposed on thecarriage 12a and the air spring (pillow spring) disposed on the carriage 12b are expressed by the following equations (20) and (21), respectively. .
台車12aに配置された空気バネ(枕バネ)、台車12bに配置された空気バネ(枕バネ)のローリングを記述する運動方程式は、それぞれ以下の(20)式、(21)式で表される。 [Rolling of air spring (pillow spring)]
Equations of motion describing the rolling of the air spring (pillow spring) disposed on the

φa2・は、台車12bに配置された空気バネ(枕バネ)のローリング方向における角速度である。
φa2 · is the angular velocity in the rolling direction of the air spring (pillow spring) disposed on the carriage 12b.
<軌道の通り狂い量と鉄道車両の運動との関係>
次に、通り狂い量yR1~yR4の精度を向上させるための本発明者らが得た知見について説明する。
図4は、通り狂い量と鉄道車両の構成要素の運動との相互の作用関係の一例を示す図である。実線で描かれている矢線は、同一構成要素内の異なる運動間の作用関係を示す。実線以外の線種で描かれている矢線は異なる構成要素の運動間の作用関係を示す。各運動には、本実施形態で説明するその運動を記述する運動方程式の番号を添えている。例えば、輪軸13a~13dのヨーイングは、(5)式~(8)式で記述される。輪軸13a~13dのヨーイングは、通り狂い量yR1~yR4、輪軸13a~13dの横振動、台車12a、12bの横振動、台車12a、12bのヨーイングから直接作用を受ける。台車12a、12bの横振動は、(9)式~(10)式で記述される。台車12a、12bの横振動は、輪軸13a~13dの横振動、台車12a、12bのローリング、車体11の横振動、車体11のヨーイング、台車12a、12bのヨーイング、車体11のローリングから直接作用を受け、輪軸13a~13dのヨーイングからは直接作用を受けない。 <Relationship between the amount of deviation along the track and the movement of the railway car>
Next, the knowledge obtained by the present inventors for improving the accuracy of the deviation amounts y R1 to y R4 will be described.
FIG. 4 is a diagram showing an example of the interaction between the amount of run-in and the movement of the components of the railway vehicle. Arrows drawn by solid lines indicate the working relationship between different movements in the same component. Arrows drawn with line types other than solid lines indicate the working relationship between the movements of different components. Each motion is accompanied by the number of motion equation that describes the motion described in this embodiment. For example, the yawing of the wheel sets 13a to 13d is described by the equations (5) to (8). The yawing of the wheel sets 13a to 13d is directly affected by the amount of deviation y R1 to y R4 , the lateral vibration of the wheel sets 13a to 13d, the lateral vibration of the bogies 12a and 12b, and the yawing of the bogies 12a and 12b. The lateral vibration of the carriages 12a and 12b is described by the equations (9) to (10). The lateral vibration of the carriages 12a and 12b is directly affected by the lateral vibrations of the wheel sets 13a to 13d, the rolling of the carriages 12a and 12b, the lateral vibration of the vehicle body 11, the yawing of the vehicle body 11, the yawing of the carriages 12a and 12b, and the rolling of the vehicle body 11. It receives no direct action from the yawing of the wheel sets 13a to 13d.
次に、通り狂い量yR1~yR4の精度を向上させるための本発明者らが得た知見について説明する。
図4は、通り狂い量と鉄道車両の構成要素の運動との相互の作用関係の一例を示す図である。実線で描かれている矢線は、同一構成要素内の異なる運動間の作用関係を示す。実線以外の線種で描かれている矢線は異なる構成要素の運動間の作用関係を示す。各運動には、本実施形態で説明するその運動を記述する運動方程式の番号を添えている。例えば、輪軸13a~13dのヨーイングは、(5)式~(8)式で記述される。輪軸13a~13dのヨーイングは、通り狂い量yR1~yR4、輪軸13a~13dの横振動、台車12a、12bの横振動、台車12a、12bのヨーイングから直接作用を受ける。台車12a、12bの横振動は、(9)式~(10)式で記述される。台車12a、12bの横振動は、輪軸13a~13dの横振動、台車12a、12bのローリング、車体11の横振動、車体11のヨーイング、台車12a、12bのヨーイング、車体11のローリングから直接作用を受け、輪軸13a~13dのヨーイングからは直接作用を受けない。 <Relationship between the amount of deviation along the track and the movement of the railway car>
Next, the knowledge obtained by the present inventors for improving the accuracy of the deviation amounts y R1 to y R4 will be described.
FIG. 4 is a diagram showing an example of the interaction between the amount of run-in and the movement of the components of the railway vehicle. Arrows drawn by solid lines indicate the working relationship between different movements in the same component. Arrows drawn with line types other than solid lines indicate the working relationship between the movements of different components. Each motion is accompanied by the number of motion equation that describes the motion described in this embodiment. For example, the yawing of the wheel sets 13a to 13d is described by the equations (5) to (8). The yawing of the wheel sets 13a to 13d is directly affected by the amount of deviation y R1 to y R4 , the lateral vibration of the wheel sets 13a to 13d, the lateral vibration of the
図4から分かるように、通り狂い量yR1~yR4は輪軸13a~13dのヨーイングに直接的に作用する。この作用が、その他の構成要素の運動に作用が伝播する。通り狂い量yR1~yR4から直接的・間接的に作用を受ける構成要素の運動に関する運動方程式から状態方程式を作成する。また、通り狂い量yR1~yR4に関連する運動の中から計測可能な状態変数を計測して観測方程式を設定する。そして、カルマンフィルタ等のデータ同化を行うフィルタを用いた演算を行うことにより、通り狂い量yR1~yR4を算出することが可能である。しかしながら、この方法では運動の自由度が大きいため、フィルタの動作が安定しなくなる虞がある。
As can be seen from FIG. 4, the amount of deviation y R1 to y R4 directly acts on the yawing of the wheel sets 13a to 13d. This action propagates to the movement of the other components. An equation of state is created from the equation of motion relating to the motion of a component that is directly or indirectly acted on from the amount of deviation y R1 to y R4 . In addition, an observation equation is set by measuring a measurable state variable from among motions related to the amount of deviation y R1 to y R4 . Then, by performing an operation using a filter that performs data assimilation, such as a Kalman filter, it is possible to calculate the amount of deviation y R1 to y R4 . However, in this method, there is a possibility that the operation of the filter may not be stable because the degree of freedom of movement is large.
そこで、本発明者らは、通り狂い量yR1~yR4の精度を向上させるためには、通り狂い量yR1~yR4が直接作用する輪軸13a~13dのヨーイングと、輪軸13a~13dのヨーイングに直接作用する因子(構成要素の運動を含む)とを精度良く算出することと、輪軸13a~13dのヨーイングを記述する運動方程式を用いて通り狂い量yR1~yR4を算出することとを行えば良いと考えた。また、クリープ力は、前後方向の成分である縦クリープ力と左右方向の成分である横クリープ力とに分解される。本発明者らは、縦クリープ力は、通り狂い量yR1~yR4と高い相関を有するという知見を得た。縦クリープ力は、輪軸13a~13b(13c~13d)と、当該輪軸13a~13b(13c~13d)が設けられる台車12a(12b)との間に配置される部材に生じる前後方向の力(前後方向力)により測定される。以上のことから、発明者らは、前後方向力の測定値を用いて通り狂い量yR1~yR4を算出する方法を想到するに至った。
Therefore, in order to improve the accuracy of the misalignment amounts y R1 to y R4 , the present inventors can perform the yawing of the wheel sets 13 a to 13 d on which the misalignment amounts y R1 to y R4 directly act, and the wheel sets 13 a to 13 d. and calculating accurately and factors acting directly (including the movement of the component) to yawing, and calculating the streets deviation amount y R1 ~ y R4 using equations of motion describing the yawing axle 13a ~ 13d I thought it would be better to Further, the creep force is decomposed into a longitudinal creep force which is a component in the longitudinal direction and a lateral creep force which is a component in the lateral direction. The present inventors obtained the finding that the longitudinal creep force has a high correlation with the amount of misalignment y R1 to y R4 . Longitudinal creep force is a force in the front-rear direction generated in a member disposed between the wheel sets 13a to 13b (13c to 13d) and the carriage 12a (12b) on which the wheel sets 13a to 13b (13c to 13d) are provided Direction force). From the above, the inventors have conceived of a method of calculating the amounts of deviation y R1 to y R4 using the measured values of the longitudinal force.
また、1つの輪軸における左右の車輪のうち一方の車輪における縦クリープ力と他方の車輪における縦クリープ力との同相の成分は、ブレーキ力や駆動力に対応する成分である。従って、鉄道車両が加減速を行っているときにも通り狂い量yR1~yR4を算出するために、縦クリープ力の逆相成分に対応するように前後方向力を定めるのが好ましい。縦クリープ力の逆相成分とは、1つの輪軸における左右の車輪のうち一方の車輪における縦クリープ力と他方の車輪における縦クリープ力との相互に逆位相となる成分である。即ち、縦クリープ力の逆相成分とは、縦クリープ力の、車軸をねじる方向の成分である。この場合、前後方向力は、1つの輪軸の左右方向の両側に取り付けられた2つの前記部材に生じる力の前後方向の成分のうち、相互に逆位相となる成分となる。
Further, the component of the same phase as the longitudinal creeping force at one of the left and right wheels of one wheelset and the longitudinal creeping force at the other wheel is a component corresponding to the braking force and the driving force. Therefore, in order to calculate the amounts of deviation y R1 to y R4 even when the railway vehicle is accelerating or decelerating, it is preferable to determine the longitudinal force so as to correspond to the reverse phase component of the longitudinal creep force. The reverse phase component of the longitudinal creep force is a component in which the longitudinal creep force at one of the left and right wheels of one wheelset is in opposite phase to the longitudinal creep force at the other wheel. That is, the reverse phase component of the longitudinal creep force is a component of the longitudinal creep force in the direction in which the axle is twisted. In this case, the front-rear direction force is a component in the opposite phase to each other among the components in the front-rear direction of the force generated in the two members attached to both sides in the left-right direction of one wheelset.
以下に、縦クリープ力の逆相成分に対応するように前後方向力を定める場合の前後方向力の具体例について説明する。
軸箱支持装置が、モノリンク式の軸箱支持装置である場合、軸箱支持装置は、リンクを備えており、軸箱と台車枠とがリンクにより連結されている。このリンクの両端にはゴムブッシュが取り付けられる。この場合、前後方向力は、1つの輪軸の左右方向の端にそれぞれ1つずつ取り付けられる2つのリンクのそれぞれが受ける荷重の前後方向の成分のうち、相互に逆位相となる成分になる。また、リンクの配置および構成により、リンクは、前後方向、左右方向、前後方向の荷重のうち主に前後方向の荷重を受ける。従って、例えば、各リンクに歪ゲージを1つ取り付ければよい。この歪みゲージの測定値を用いて、当該リンクが受ける荷重の前後方向の成分を導出することにより、前後方向力の測定値を得る。また、このようにすることに替えて、リンクに取り付けられたゴムブッシュの前後方向の変位を変位計で測定してもよい。この場合、測定した変位と当該ゴムブッシュのバネ定数との積を、前後方向力の測定値とする。軸箱支持装置が、モノリンク式の軸箱支持装置である場合、前述した、軸箱を支持するための部材は、リンクまたはゴムブッシュになる。 Hereinafter, a specific example of the front-rear direction force when the front-rear direction force is determined to correspond to the reverse phase component of the longitudinal creep force will be described.
When the axle box support device is a monolink type axle box support device, the axle box support device includes a link, and the axle box and the carriage frame are connected by the link. Rubber bushes are attached to both ends of this link. In this case, the front-rear direction force is a component in opposite phase to each other among the components in the front-rear direction of the load received by each of the two links attached respectively to the left-right direction end of one wheelset. Further, due to the arrangement and configuration of the link, the link mainly receives the load in the front-rear direction among the loads in the front-rear direction, the left-right direction and the front-rear direction. Therefore, for example, one strain gauge may be attached to each link. By using the measurement value of the strain gauge to derive the component of the load received by the link in the front-rear direction, a measurement value of the front-rear direction force is obtained. Also, instead of doing this, the longitudinal displacement of the rubber bush attached to the link may be measured by a displacement gauge. In this case, the product of the measured displacement and the spring constant of the rubber bush is taken as the measured value of the longitudinal force. When the axle box support device is a monolink axle box support device, the above-described member for supporting the axle box is a link or a rubber bush.
尚、リンクに取り付けられる歪ゲージにより測定される荷重には、前後方向の成分だでけなく、左右方向の成分および上下方向の成分のうち少なくとも何れか一方の成分が含まれる場合がある。しかしながら、このような場合であっても、軸箱支持装置の構造上、リンクが受ける左右方向の成分の荷重および上下方向の成分の荷重は、前後方向の成分の荷重に比べて十分に小さい。従って、各リンクに歪ゲージを1つ取り付けるだけで、実用上要求される精度を有する前後方向力の測定値を得ることができる。このように、前後方向力の測定値には、前後方向の成分以外の成分が含まれることがある。従って、上下方向および左右方向の歪みがキャンセルされるように3つ以上の歪みゲージを各リンクに取り付けてもよい。このようにすれば、前後方向力の測定値の精度を向上させることができる。
The load measured by the strain gauge attached to the link may include not only the longitudinal component but also at least one of the lateral component and the vertical component. However, even in such a case, due to the structure of the axle box support device, the load of the component in the lateral direction and the load of the component in the vertical direction received by the link are sufficiently smaller than the load of the component in the longitudinal direction. Therefore, it is possible to obtain the measurement value of the front-rear direction force with the accuracy required practically by only attaching one strain gauge to each link. As described above, the measured value of the front-rear direction force may include components other than the front-rear direction component. Thus, more than two strain gauges may be attached to each link so that vertical and horizontal distortion is cancelled. In this way, it is possible to improve the accuracy of the measured value of the longitudinal force.
軸箱支持装置が、軸はり式の軸箱支持装置である場合、軸箱支持装置は、軸はりを備えており、軸箱と台車枠とが、軸はりにより連結されている。軸はりは、軸箱と一体に構成されていてもよい。この軸はりの台車枠側の端にはゴムブッシュが取り付けられる。この場合、前後方向力は、1つの輪軸の左右方向の端にそれぞれ1つずつ取り付けられる2つの軸はりのそれぞれが受ける荷重の前後方向の成分のうち、相互に逆位相となる成分になる。また、軸はりの配置構成により、軸はりは、前後方向、左右方向、上下方向の荷重のうち前後方向の荷重に加えて、左右方向の荷重も受けやすい。従って、例えば、左右方向の歪みがキャンセルされるように2つ以上の歪ゲージを各軸はりに取り付ける。これらの歪ゲージの測定値を用いて、軸はりが受ける荷重の前後方向の成分を導出することにより、前後方向力の測定値を得る。また、このようにすることに替えて、軸はりに取り付けられたゴムブッシュの前後方向の変位を変位計で測定してもよい。この場合、測定した変位と当該ゴムブッシュのバネ定数との積を、前後方向力の測定値とする。軸箱支持装置が、軸はり式の軸箱支持装置である場合、前述した、軸箱を支持するための部材は、軸はりまたはゴムブッシュになる。
When the axle box support device is an axle beam type axle box support device, the axle box support device includes an axle beam, and the axle box and the bogie frame are connected by the axle beam. The axle beam may be integrally formed with the axle box. A rubber bush is attached to the end on the carriage frame side of the shaft beam. In this case, the longitudinal force is a component in opposite phase to each other out of the longitudinal components of the load received by each of the two shaft beams respectively attached to the left and right ends of one wheelset. Further, due to the arrangement configuration of the shaft beam, the shaft beam is likely to receive the load in the lateral direction in addition to the load in the longitudinal direction among the loads in the longitudinal direction, the lateral direction, and the vertical direction. Thus, for example, two or more strain gauges are attached to each shaft beam so that lateral distortion is canceled. By using the measurement values of these strain gauges to derive the longitudinal component of the load received by the shaft beam, a measurement value of the longitudinal force is obtained. Also, instead of doing this, the longitudinal displacement of the rubber bush attached to the shaft beam may be measured with a displacement gauge. In this case, the product of the measured displacement and the spring constant of the rubber bush is taken as the measured value of the longitudinal force. When the axle box support device is an axle-type axle box support device, the above-described member for supporting the axle box is an axle beam or a rubber bush.
尚、軸はりに取り付けられる歪ゲージにより測定される荷重には、前後方向および左右方向の成分だでけなく、上下方向の成分が含まれる場合がある。しかしながら、このような場合であっても、軸箱支持装置の構造上、軸はりが受ける上下方向の成分の荷重は、前後方向の成分の荷重および左右方向の成分の荷重に比べて十分に小さい。従って、軸はりが受ける上下方向の成分の荷重をキャンセルするように歪みゲージを取り付けなくても、実用上要求される精度を有する前後方向力の測定値を得ることができる。このように、計測された前後方向力には、前後方向の成分以外の成分が含まれることがあり、左右方向の歪みに加えて上下方向の歪みもキャンセルされるように3つ以上の歪みゲージを各軸はりに取り付けてもよい。このようにすれば、前後方向力の測定値の精度を向上させることができる。
The load measured by a strain gauge attached to the shaft beam may include not only components in the front-rear direction and left-right direction but also components in the vertical direction. However, even in such a case, due to the structure of the axle box support device, the vertical component load applied to the shaft beam is sufficiently smaller than the longitudinal component load and the horizontal component load. . Therefore, it is possible to obtain the measurement value of the front / rear direction force having the accuracy required practically, without attaching the strain gauge so as to cancel the load of the vertical component received by the shaft beam. Thus, the measured longitudinal force may include components other than the longitudinal component, and in addition to the lateral distortion, the distortion in the vertical direction is also canceled by three or more strain gauges May be attached to each shaft beam. In this way, it is possible to improve the accuracy of the measured value of the longitudinal force.
軸箱支持装置が、板バネ式の軸箱支持装置である場合、軸箱支持装置は、板バネを備えており、軸箱と台車枠とが、板バネにより連結されている。この板バネの端にはゴムブッシュが取り付けられる。この場合、前後方向力は、1つの輪軸の左右方向の端にそれぞれ1つずつ取り付けられる2つの板バネのそれぞれが受ける荷重の前後方向の成分のうち、相互に逆位相となる成分になる。また、板バネの配置構成により、板バネは、前後方向、左右方向、上下方向の荷重のうち前後方向の荷重に加えて、左右方向の荷重および上下方向の荷重も受けやすい。従って、例えば、左右方向および上下方向の歪みがキャンセルされるように3つ以上の歪ゲージを各板バネに取り付ける。これらの歪ゲージの測定値を用いて、板バネが受ける荷重の前後方向の成分を導出することにより、前後方向力の測定値を得る。また、このようにすることに替えて、板バネに取り付けられたゴムブッシュの前後方向の変位を変位計で測定してもよい。この場合、測定した変位と当該ゴムブッシュのバネ定数との積を、前後方向力の測定値とする。軸箱支持装置が、板バネ式の軸箱支持装置である場合、前述した、軸箱を支持するための部材は、板バネまたはゴムブッシュになる。
When the axle box support device is a leaf spring type axle box support device, the axle box support device includes a leaf spring, and the axle box and the carriage frame are connected by the leaf spring. A rubber bush is attached to the end of the leaf spring. In this case, the front-rear direction force is a component in opposite phase to each other among the components in the front-rear direction of the load received by each of the two plate springs respectively attached to the left-right direction end of one wheelset. Further, due to the arrangement configuration of the leaf spring, the leaf spring is likely to receive the load in the lateral direction and the load in the vertical direction in addition to the load in the longitudinal direction among the loads in the longitudinal direction, the lateral direction, and the vertical direction. Therefore, for example, three or more strain gauges are attached to each leaf spring so that the distortion in the left and right direction and the up and down direction is canceled. By using the measurement values of these strain gauges to derive the longitudinal component of the load received by the leaf spring, a measurement value of the longitudinal force is obtained. Moreover, it may change to doing in this way, and may measure the displacement of the front-back direction of the rubber bush attached to the leaf spring with a displacement meter. In this case, the product of the measured displacement and the spring constant of the rubber bush is taken as the measured value of the longitudinal force. When the axle box support device is a leaf spring type axle box support device, the above-described member for supporting the axle box is a leaf spring or a rubber bush.
尚、前述した変位計としては、公知のレーザ変位計や渦電流式の変位計を用いることができる。
また、ここでは、軸箱支持装置の方式が、モノリンク式、軸はり式、および板バネ式である場合を例に挙げて、前後方向力を説明した。しかしながら、軸箱支持装置の方式は、モノリンク式、軸はり式、および板バネ式に限定されない。軸箱支持装置の方式に合わせて、モノリンク式、軸はり式、および板バネ式と同様に、前後方向力を定めることができる。
また、以下では、説明を簡単にするために、1つの輪軸について1つの前後方向力の測定値が得られる場合を例に挙げて説明する。即ち、図1に示す鉄道車両は、4つの輪軸13a~13dを有する。従って、4つの前後方向力T1~T4の測定値が得られる。 In addition, as a displacement meter mentioned above, a well-known laser displacement meter and an eddy current displacement meter can be used.
In addition, here, the case where the method of the axle box support device is a monolink type, an axial beam type, and a leaf spring type has been described as an example, and the longitudinal force has been described. However, the type of axle box support device is not limited to the monolink type, the axial beam type, and the leaf spring type. The longitudinal force can be determined in the same manner as the monolink type, the axial beam type, and the leaf spring type in accordance with the method of the axle box support device.
Further, in the following, in order to simplify the description, a case in which one measured value of front and rear direction force can be obtained for one wheelset will be described as an example. That is, the railway vehicle shown in FIG. 1 has fourwheel sets 13a to 13d. Accordingly, measurements of four longitudinal forces T 1 to T 4 are obtained.
また、ここでは、軸箱支持装置の方式が、モノリンク式、軸はり式、および板バネ式である場合を例に挙げて、前後方向力を説明した。しかしながら、軸箱支持装置の方式は、モノリンク式、軸はり式、および板バネ式に限定されない。軸箱支持装置の方式に合わせて、モノリンク式、軸はり式、および板バネ式と同様に、前後方向力を定めることができる。
また、以下では、説明を簡単にするために、1つの輪軸について1つの前後方向力の測定値が得られる場合を例に挙げて説明する。即ち、図1に示す鉄道車両は、4つの輪軸13a~13dを有する。従って、4つの前後方向力T1~T4の測定値が得られる。 In addition, as a displacement meter mentioned above, a well-known laser displacement meter and an eddy current displacement meter can be used.
In addition, here, the case where the method of the axle box support device is a monolink type, an axial beam type, and a leaf spring type has been described as an example, and the longitudinal force has been described. However, the type of axle box support device is not limited to the monolink type, the axial beam type, and the leaf spring type. The longitudinal force can be determined in the same manner as the monolink type, the axial beam type, and the leaf spring type in accordance with the method of the axle box support device.
Further, in the following, in order to simplify the description, a case in which one measured value of front and rear direction force can be obtained for one wheelset will be described as an example. That is, the railway vehicle shown in FIG. 1 has four
図5は、前後方向力T1~T4を用いて、通り狂い量yR1~yR4と鉄道車両の構成要素の運動との相互の作用関係の一例を示す図である。前後方向力T1~T4の算出式、変換変数e1~e4の算出式、変換変数e1~e4を用いたときの輪軸13a~13dの横振動を記述する運動方程式、前後方向力T1~T4を用いたときの輪軸13a~13dのヨーイングを記述する運動方程式の具体例については後述する(それぞれ(40)式~(43)式、(26)式~(29)式、(34)式~(37)式、(64)式~(67)式を参照)。
FIG. 5 is a diagram showing an example of a mutual action relationship between the amount of misalignment y R1 to y R4 and the motion of the component of the railway vehicle using the longitudinal force T 1 to T 4 . Formulas for calculating the longitudinal forces T 1 to T 4 , formulas for the conversion variables e 1 to e 4 , equations of motion describing lateral vibrations of the wheel sets 13 a to 13 d using the transformation variables e 1 to e 4 , front and back directions Specific examples of equations of motion describing the yawing of the wheel sets 13a to 13d when the forces T 1 to T 4 are used will be described later (each of equations (40) to (43) and (26) to (29) , (34) to (37), (64) to (67)).
図6は、図5の作用関係から、輪軸13a~13dのヨーイングに直接作用する構成要素の運動を決定するのに必要な作用関係を取り出して示す図である。輪軸13a~13dのヨーイングが排除された分だけ運動の自由度が減る。また、前後方向力T1~T4の分だけ、カルマンフィルタ等のデータ同化を行うフィルタで用いる測定値が増える。従って、カルマンフィルタ等のデータ同化を行うフィルタを用いた演算を行うことにより算出される運動の情報の精度は向上する。
FIG. 6 is a diagram showing, from the operational relationship of FIG. 5, the operational relationship necessary for determining the movement of the component that directly acts on the yawing of the wheel sets 13a to 13d. The degree of freedom of movement decreases as the yawing of the wheel sets 13a to 13d is eliminated. Further, the measured values used in the data assimilation filter such as the Kalman filter increase by the amount of the front-rear direction forces T 1 to T 4 . Therefore, the accuracy of motion information calculated by performing an operation using a filter that performs data assimilation, such as a Kalman filter, is improved.
一方、図7は、図5の作用関係から、通り狂い量yR1~yR4を決定するのに必要な作用関係を取り出して示す図である。変換変数e1~e4と台車12a、12bのヨーイングの情報とが既知である。従って、変換変数e1~e4の算出式(後述する例では(26)式~(29)式)を用いることにより、輪軸13a~13dのヨーイングの情報が算出される。このときの変換変数e1~e4は前後方向力T1~T4の値から直接導出される。また、台車12a、12bのヨーイングの情報は図6の作用関係を用いて算出される。従って、変換変数e1~e4と台車12a、12bのヨーイングの情報とから算出される輪軸13a~13dのヨーイングの情報の精度は、図4の作用関係を用いて算出した場合と比べて向上する。さらに、輪軸13a~13dのヨーイングの情報と、前後方向力T1~T4と、輪軸13a~13dのヨーイングに直接作用する構成要素の運動(輪軸13a~13dの横振動と台車12a、12bの横振動)の情報とが既知である。従って、輪軸13a~13dのヨーイングを記述する運動方程式(後述する例では(64)式~(67)式)を用いることにより、通り狂い量yR1~yR4が算出される。このときの輪軸13a~13dのヨーイングの情報の精度は、先にも述べたように図4の作用関係を用いて算出した場合と比べて向上する。また、前後方向力T1~T4は測定値である。また、輪軸13a~13dのヨーイングに直接作用する構成要素の運動の情報は、図6の作用関係を用いて算出されるため、その精度は向上する。従って、以上のようにして算出された通り狂い量yR1~yR4の精度は向上する。以下の各実施形態では、以上の式を用いて、通り狂い量yR1~yR4を算出する場合を例に挙げて説明する。
On the other hand, FIG. 7 is a diagram showing the operational relationship necessary for determining the deviation amounts y R1 to y R4 from the operational relationship of FIG. 5. The transformation variables e 1 to e 4 and the yawing information of the carriages 12 a, 12 b are known. Therefore, the yawing information of the wheel sets 13a to 13d is calculated by using the calculation formulas of the conversion variables e 1 to e 4 (in the example described later, the equations (26) to (29)). The conversion variables e 1 to e 4 at this time are directly derived from the values of the front-rear direction forces T 1 to T 4 . Further, the information on the yawing of the bogies 12a and 12b is calculated using the operation relationship of FIG. Therefore, the accuracy of the yawing information of the wheel shafts 13a to 13d calculated from the conversion variables e 1 to e 4 and the yawing information of the bogies 12a and 12b is improved as compared with the case of calculating using the operation relationship of FIG. Do. Further, a yawing information wheel sets 13a ~ 13d, the longitudinal direction forces T 1 ~ T 4, lateral vibration and carriage 12a constituent movement elements (wheel axis 13a ~ 13d that act directly on yawing axle 13a ~ 13d, 12b of the Information of the lateral vibration) is known. Therefore, the deviation amounts y R1 to y R4 are calculated by using equations of motion (in the example described later, equations (64) to (67) in the example described below) that describe the yawing of the wheel sets 13a to 13d. The accuracy of the information on the yawing of the wheel sets 13a to 13d at this time is improved as compared with the case of calculation using the operational relationship of FIG. 4 as described above. In addition, the longitudinal forces T 1 to T 4 are measured values. Further, since the information of the motion of the components directly acting on the yawing of the wheel sets 13a to 13d is calculated using the operation relationship of FIG. 6, its accuracy is improved. Therefore, the accuracy of the amount of deviation y R1 to y R4 is improved as calculated as described above. In the following embodiments, the case where the amounts of deviation y R1 to y R4 are calculated using the above equations will be described as an example.
(第1の実施形態)
次に、本発明の第1の実施形態を説明する。 First Embodiment
Next, a first embodiment of the present invention will be described.
次に、本発明の第1の実施形態を説明する。 First Embodiment
Next, a first embodiment of the present invention will be described.
<検査装置800>
図8は、検査装置800の機能的な構成の一例を示す図である。図9は、検査装置800のハードウェアの構成の一例を示す図である。図10は、検査装置800における事前処理の一例を示すフローチャートである。図11は、検査装置800における本処理の一例を示すフローチャートである。本実施形態では、図1に示すように、検査装置800が、鉄道車両に搭載される場合を例に挙げて示す。 <Inspection apparatus 800>
FIG. 8 is a diagram showing an example of a functional configuration of theinspection apparatus 800. As shown in FIG. FIG. 9 is a diagram showing an example of a hardware configuration of the inspection apparatus 800. As shown in FIG. FIG. 10 is a flowchart showing an example of pre-processing in the inspection apparatus 800. FIG. 11 is a flowchart showing an example of this process in the inspection apparatus 800. In this embodiment, as shown in FIG. 1, the case where the inspection apparatus 800 is mounted in a railway vehicle is shown as an example.
図8は、検査装置800の機能的な構成の一例を示す図である。図9は、検査装置800のハードウェアの構成の一例を示す図である。図10は、検査装置800における事前処理の一例を示すフローチャートである。図11は、検査装置800における本処理の一例を示すフローチャートである。本実施形態では、図1に示すように、検査装置800が、鉄道車両に搭載される場合を例に挙げて示す。 <
FIG. 8 is a diagram showing an example of a functional configuration of the
図8において、検査装置800は、その機能として、状態方程式記憶部801、観測方程式記憶部802、データ取得部803、第1の周波数調整部804、フィルタ演算部805、第2の周波数調整部806、軌道状態算出部807、および出力部808を有する。
In FIG. 8, the inspection apparatus 800 has, as its functions, a state equation storage unit 801, an observation equation storage unit 802, a data acquisition unit 803, a first frequency adjustment unit 804, a filter operation unit 805, and a second frequency adjustment unit 806. , An orbital state calculation unit 807, and an output unit 808.
図9において、検査装置800は、CPU901、主記憶装置902、補助記憶装置903、通信回路904、信号処理回路905、画像処理回路906、I/F回路907、ユーザインターフェース908、ディスプレイ909、およびバス910を有する。
In FIG. 9, the inspection apparatus 800 includes a CPU 901, a main storage device 902, an auxiliary storage device 903, a communication circuit 904, a signal processing circuit 905, an image processing circuit 906, an I / F circuit 907, a user interface 908, a display 909, and a bus. It has 910.
CPU901は、検査装置800の全体を統括制御する。CPU901は、主記憶装置902をワークエリアとして用いて、補助記憶装置903に記憶されているプログラムを実行する。主記憶装置902は、データを一時的に格納する。補助記憶装置903は、CPU901によって実行されるプログラムの他、各種のデータを記憶する。補助記憶装置903は、後述する状態方程式および観測方程式を記憶する。状態方程式記憶部801および観測方程式記憶部802は、例えば、CPU901および補助記憶装置903を用いることにより実現される。
The CPU 901 centrally controls the entire inspection apparatus 800. The CPU 901 executes a program stored in the auxiliary storage device 903 using the main storage device 902 as a work area. The main storage unit 902 temporarily stores data. The auxiliary storage device 903 stores various data in addition to the program executed by the CPU 901. The auxiliary storage device 903 stores state equations and observation equations described later. The state equation storage unit 801 and the observation equation storage unit 802 are realized by using, for example, the CPU 901 and the auxiliary storage device 903.
通信回路904は、検査装置800の外部との通信を行うための回路である。通信回路904は、例えば、前後方向力の測定値や、車体11、台車12a、12b、および輪軸13a~13dの左右方向における加速度の測定値の情報を受信する。通信回路904は、検査装置800の外部と無線通信を行っても有線通信を行ってもよい。通信回路904は、無線通信を行う場合、鉄道車両に設けられるアンテナに接続される。
The communication circuit 904 is a circuit for communicating with the outside of the inspection apparatus 800. The communication circuit 904 receives, for example, information of measured values of longitudinal force and measured values of acceleration in the left-right direction of the vehicle body 11, the bogies 12a and 12b, and the wheel sets 13a to 13d. The communication circuit 904 may perform wireless communication with the outside of the inspection apparatus 800 or wire communication. The communication circuit 904 is connected to an antenna provided on a railway vehicle when performing wireless communication.
信号処理回路905は、通信回路904で受信された信号や、CPU901による制御に従って入力した信号に対し、各種の信号処理を行う。データ取得部803は、例えば、CPU901、通信回路904、および信号処理回路905を用いることにより実現される。また、第1の周波数調整部804、フィルタ演算部805、第2の周波数調整部806および軌道状態算出部807は、例えば、CPU901および信号処理回路905を用いることにより実現される。
The signal processing circuit 905 performs various types of signal processing on the signal received by the communication circuit 904 and the signal input according to the control of the CPU 901. The data acquisition unit 803 is realized by using, for example, the CPU 901, the communication circuit 904, and the signal processing circuit 905. Also, the first frequency adjustment unit 804, the filter operation unit 805, the second frequency adjustment unit 806, and the orbit state calculation unit 807 are realized by using, for example, the CPU 901 and the signal processing circuit 905.
画像処理回路906は、CPU901による制御に従って入力した信号に対し、各種の画像処理を行う。この画像処理が行われた信号は、ディスプレイ909に出力される。
ユーザインターフェース908は、オペレータが検査装置800に対して指示を行う部分である。ユーザインターフェース908は、例えば、ボタン、スイッチ、およびダイヤル等を有する。また、ユーザインターフェース908は、ディスプレイ909を用いたグラフィカルユーザインターフェースを有していてもよい。 Animage processing circuit 906 performs various types of image processing on signals input according to control by the CPU 901. The signal subjected to the image processing is output to the display 909.
Theuser interface 908 is a portion where the operator instructs the inspection apparatus 800. The user interface 908 includes, for example, buttons, switches, and dials. The user interface 908 may also have a graphical user interface using the display 909.
ユーザインターフェース908は、オペレータが検査装置800に対して指示を行う部分である。ユーザインターフェース908は、例えば、ボタン、スイッチ、およびダイヤル等を有する。また、ユーザインターフェース908は、ディスプレイ909を用いたグラフィカルユーザインターフェースを有していてもよい。 An
The
ディスプレイ909は、画像処理回路906から出力された信号に基づく画像を表示する。I/F回路907は、I/F回路907に接続される装置との間でデータのやり取りを行う。図9では、I/F回路907に接続される装置として、ユーザインターフェース908およびディスプレイ909を示す。しかしながら、I/F回路907に接続される装置は、これらに限定されない。例えば、可搬型の記憶媒体がI/F回路907に接続されてもよい。また、ユーザインターフェース908の少なくとも一部およびディスプレイ909は、検査装置800の外部にあってもよい。
出力部808は、例えば、通信回路904および信号処理回路905と、画像処理回路906、I/F回路907、およびディスプレイ909との少なくとも何れか一方を用いることにより実現される。 Thedisplay 909 displays an image based on the signal output from the image processing circuit 906. The I / F circuit 907 exchanges data with a device connected to the I / F circuit 907. In FIG. 9, a user interface 908 and a display 909 are shown as devices connected to the I / F circuit 907. However, devices connected to the I / F circuit 907 are not limited to these. For example, a portable storage medium may be connected to the I / F circuit 907. Also, at least a portion of user interface 908 and display 909 may be external to inspection apparatus 800.
Theoutput unit 808 is realized, for example, by using at least one of the communication circuit 904 and the signal processing circuit 905, and the image processing circuit 906, the I / F circuit 907, and the display 909.
出力部808は、例えば、通信回路904および信号処理回路905と、画像処理回路906、I/F回路907、およびディスプレイ909との少なくとも何れか一方を用いることにより実現される。 The
The
尚、CPU901、主記憶装置902、補助記憶装置903、信号処理回路905、画像処理回路906、およびI/F回路907は、バス910に接続される。これらの構成要素間の通信は、バス910を介して行われる。また、検査装置800のハードウェアは、後述する検査装置800の機能を実現することができれば、図9に示すものに限定されない。
The CPU 901, the main storage device 902, the auxiliary storage device 903, the signal processing circuit 905, the image processing circuit 906, and the I / F circuit 907 are connected to the bus 910. Communication between these components takes place via a bus 910. The hardware of the inspection apparatus 800 is not limited to that shown in FIG. 9 as long as the functions of the inspection apparatus 800 described later can be realized.
[状態方程式記憶部801、S1001]
状態方程式記憶部801は、状態方程式を記憶する。本実施形態では、前述した運動方程式のうち、(5)式~(8)式の輪軸13a~13dのヨーイングを記述する運動方程式を状態方程式に含めない。(5)式~(8)式には、通り狂い量yR1~yR4が含まれる。(5)式~(8)式を状態方程式に含めて、後述するカルマンフィルタによるフィルタリングを行う場合には、軌道16のモデルが必要になる。通り狂いは物理法則に則って記述できるものではない。従って、通り狂い量yR1~yR4の時間微分が例えばホワイトノイズとなるように、軌道16のモデルを作成する必要がある。そうすると、軌道16のモデルの不確かさが、後述するカルマンフィルタによるフィルタリングの結果に影響を与える虞がある。また、状態方程式を少なくし、状態変数を減らすことにより、後述するカルマンフィルタの動作を安定させることができる。 [Stateequation storage unit 801, S1001]
The stateequation storage unit 801 stores a state equation. In the present embodiment, among the above-described equations of motion, equations of motion describing the yawing of the wheel axles 13a to 13d of the equations (5) to (8) are not included in the equation of state. The equations (5) to (8) include the amount of deviation y R1 to y R4 . In the case where the equations (5) to (8) are included in the state equation and filtering is performed by a Kalman filter described later, a model of the trajectory 16 is required. Passage can not be described according to physical laws. Therefore, it is necessary to create a model of the trajectory 16 so that the time derivative of the amount of deviation y R1 to y R4 becomes, for example, white noise. Then, the uncertainty of the model of the trajectory 16 may affect the result of the filtering by the Kalman filter described later. In addition, by reducing the state equation and reducing the state variable, it is possible to stabilize the operation of the Kalman filter described later.
状態方程式記憶部801は、状態方程式を記憶する。本実施形態では、前述した運動方程式のうち、(5)式~(8)式の輪軸13a~13dのヨーイングを記述する運動方程式を状態方程式に含めない。(5)式~(8)式には、通り狂い量yR1~yR4が含まれる。(5)式~(8)式を状態方程式に含めて、後述するカルマンフィルタによるフィルタリングを行う場合には、軌道16のモデルが必要になる。通り狂いは物理法則に則って記述できるものではない。従って、通り狂い量yR1~yR4の時間微分が例えばホワイトノイズとなるように、軌道16のモデルを作成する必要がある。そうすると、軌道16のモデルの不確かさが、後述するカルマンフィルタによるフィルタリングの結果に影響を与える虞がある。また、状態方程式を少なくし、状態変数を減らすことにより、後述するカルマンフィルタの動作を安定させることができる。 [State
The state
以上の知見の下、本実施形態では、(5)式~(8)式の輪軸13a~13dのヨーイングを記述する運動方程式を状態方程式に含めずに、以下のようにして状態方程式を構成する。
まず、(9)式、(10)式の台車12a、12bの横振動(左右方向における運動)を記述する運動方程式と、(13)式、(14)式の台車12a、12bのローリングを記述する運動方程式と、(15)式の車体11の横振動(左右方向における運動)を記述する運動方程式と、(16)式の車体11のヨーイングを記述する運動方程式と、(17)式の車体11のローリングを記述する運動方程式と、(18)式、(19)式の台車12aに配置されたヨーダンパ、台車12bに配置されたヨーダンパのヨーイングを記述する運動方程式と、(20)式、(21)式の台車12aに配置された空気バネ(枕バネ)、台車12bに配置された空気バネ(枕バネ)のローリングを記述する運動方程式については、これらをそのまま用いて状態方程式を構成する。 Based on the above findings, in the present embodiment, the equation of state is configured as follows without including the equation of motion describing the yawing of thewheelset 13a to 13d of the equations (5) to (8) in the following equation. .
First, an equation of motion describing the lateral vibration (movement in the horizontal direction) of the carriages 12a and 12b of the equations (9) and (10) and the rolling of the carriages 12a and 12b of the equations (13) and (14) are described Equation of motion, equation of motion describing lateral vibration (movement in the lateral direction) of the vehicle body 11 of equation (15), equation of motion describing yawing of vehicle body 11 of equation (16), and vehicle body of equation (17) Equation (18), equation (19), the yaw damper disposed on the carriage 12a, equation of motion describing the yawing of the yaw damper disposed on the carriage 12b, equation (20), 21) For the motion equation describing the rolling of the air spring (pillow spring) disposed on the carriage 12a of the formula and the air spring (pillow spring) disposed on the carriage 12b, using these as they are Constitute the state equation.
まず、(9)式、(10)式の台車12a、12bの横振動(左右方向における運動)を記述する運動方程式と、(13)式、(14)式の台車12a、12bのローリングを記述する運動方程式と、(15)式の車体11の横振動(左右方向における運動)を記述する運動方程式と、(16)式の車体11のヨーイングを記述する運動方程式と、(17)式の車体11のローリングを記述する運動方程式と、(18)式、(19)式の台車12aに配置されたヨーダンパ、台車12bに配置されたヨーダンパのヨーイングを記述する運動方程式と、(20)式、(21)式の台車12aに配置された空気バネ(枕バネ)、台車12bに配置された空気バネ(枕バネ)のローリングを記述する運動方程式については、これらをそのまま用いて状態方程式を構成する。 Based on the above findings, in the present embodiment, the equation of state is configured as follows without including the equation of motion describing the yawing of the
First, an equation of motion describing the lateral vibration (movement in the horizontal direction) of the
一方、(1)式~(4)式の輪軸13a~13dの横振動(左右方向における運動)を記述する運動方程式と、(11)式、(12)式の台車12a、12bのヨーイングを記述する運動方程式には、輪軸13a~13dのヨーイング方向における回動量(角変位)ψw1~ψw4や角速度ψw1・~ψw4・が含まれる。前述したように本実施形態では、(5)式~(8)式の輪軸13a~13dのヨーイングを記述する運動方程式を状態方程式に含めない。そこで本実施形態では、以下のようにして(1)式~(4)式および(11)式、(12)式からこれらの変数を消去したものを用いて状態方程式を構成する。
On the other hand, the equations of motion describing the lateral vibration (movement in the horizontal direction) of the wheel sets 13a to 13d of the equations (1) to (4) and the yawing of the carriages 12a and 12b of the equations (11) and (12) are described. The equations of motion to be performed include rotational amounts (angular displacements) ψ w1 to ψ w4 and angular velocities ψ w1 to ψ w4 in the yawing direction of the wheel sets 13a to 13d. As described above, in the present embodiment, an equation of motion that describes the yawing of the wheel sets 13a to 13d in the equations (5) to (8) is not included in the state equation. Therefore, in the present embodiment, a state equation is configured using the ones obtained by eliminating these variables from the equations (1) to (4) and the equations (11) and (12) as follows.
まず、輪軸13a~13dにおける前後方向力T1~T4は、以下の(22)式~(25)式で表される。このように、前後方向力T1~T4は、輪軸のヨーイング方向の角変位ψw1~ψw4と、当該輪軸が設けられる台車のヨーイング方向の角変位ψt1~ψt2との差に応じて定まる。
First, the longitudinal forces T 1 to T 4 at the wheel sets 13 a to 13 d are expressed by the following equations (22) to (25). Thus, the front-rear direction force T 1 ~ T 4, according to the difference between the yawing direction angular displacement ψ w1 ~ ψ w4 wheelset, the angular displacement ψ t1 ~ ψ t2 in the yawing direction of the truck in which the wheel sets are provided It becomes settled.
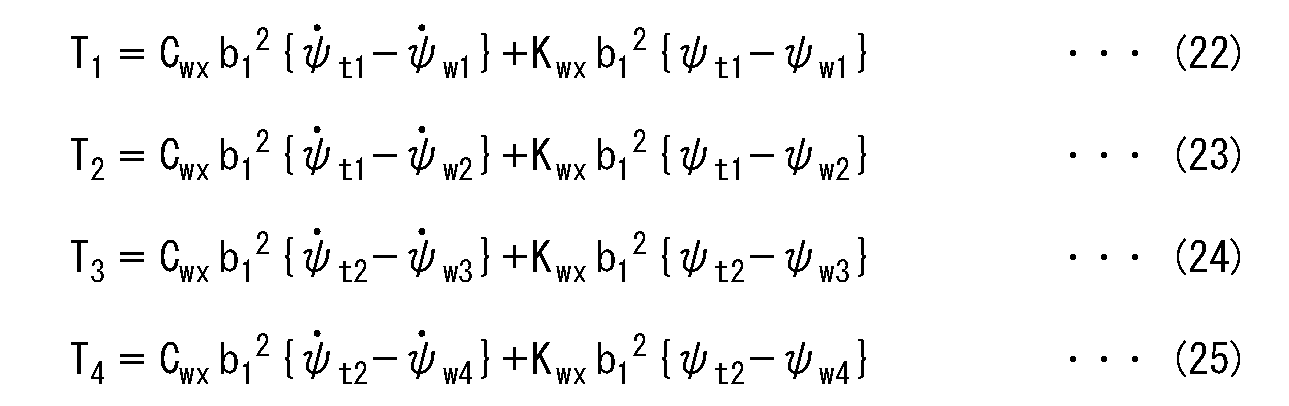
以下の(26)式~(29)式のように、変換変数e1~e4を定義する。このように、変換変数e1~e4は、台車のヨーイング方向の角変位ψt1~ψt2と輪軸のヨーイング方向の角変位ψw1~ψw4との差で定義される。変換変数e1~e4は、台車のヨーイング方向の角変位ψt1~ψt2と輪軸のヨーイング方向の角変位ψw1~ψw4とを相互に変換するための変数である。
The conversion variables e 1 to e 4 are defined as in the following equations (26) to (29). Thus, the conversion variables e 1 ~ e 4 is defined by the difference between the yawing direction angular displacement ψ t1 ~ ψ t2 and Wajiku the yawing direction angular displacement ψ w1 ~ ψ w4 of the truck. Converting the variable e 1 ~ e 4 is a variable for converting the yawing direction angular displacement ψ w1 ~ ψ w4 in the yawing direction angular displacement ψ t1 ~ ψ t2 and Wajiku bogie another.
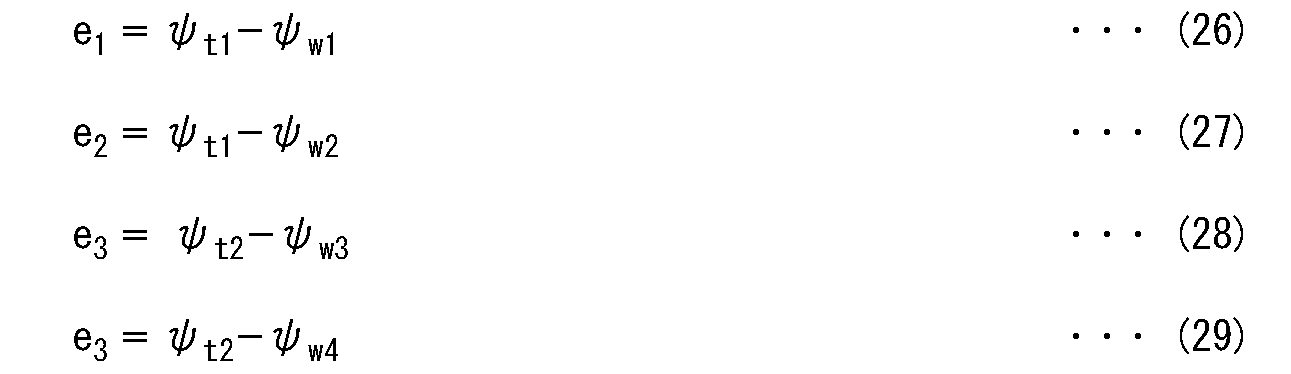
(26)式~(29)式を式変形すると、以下の(30)式~(33)式が得られる。
If the equations (26) to (29) are modified, the following equations (30) to (33) are obtained.
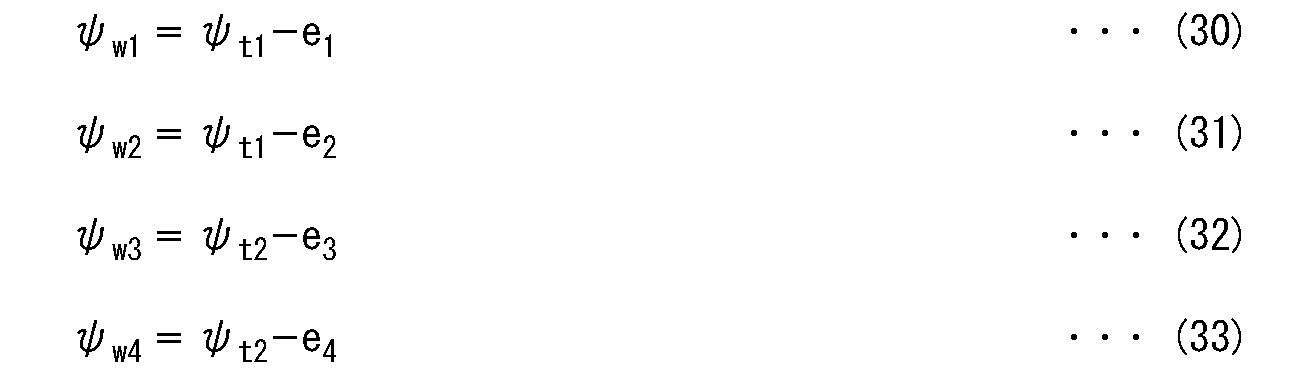
(30)式~(33)式を、(1)式~(4)式の輪軸13a~13dの横振動(左右方向における運動)を記述する運動方程式に代入すると、以下の(34)式~(37)式が得られる。
Substituting equations (30) to (33) into equations of motion describing the lateral vibrations (movement in the left-right direction) of wheel sets 13a to 13d in equations (1) to (4), the following equation (34) to Formula (37) is obtained.
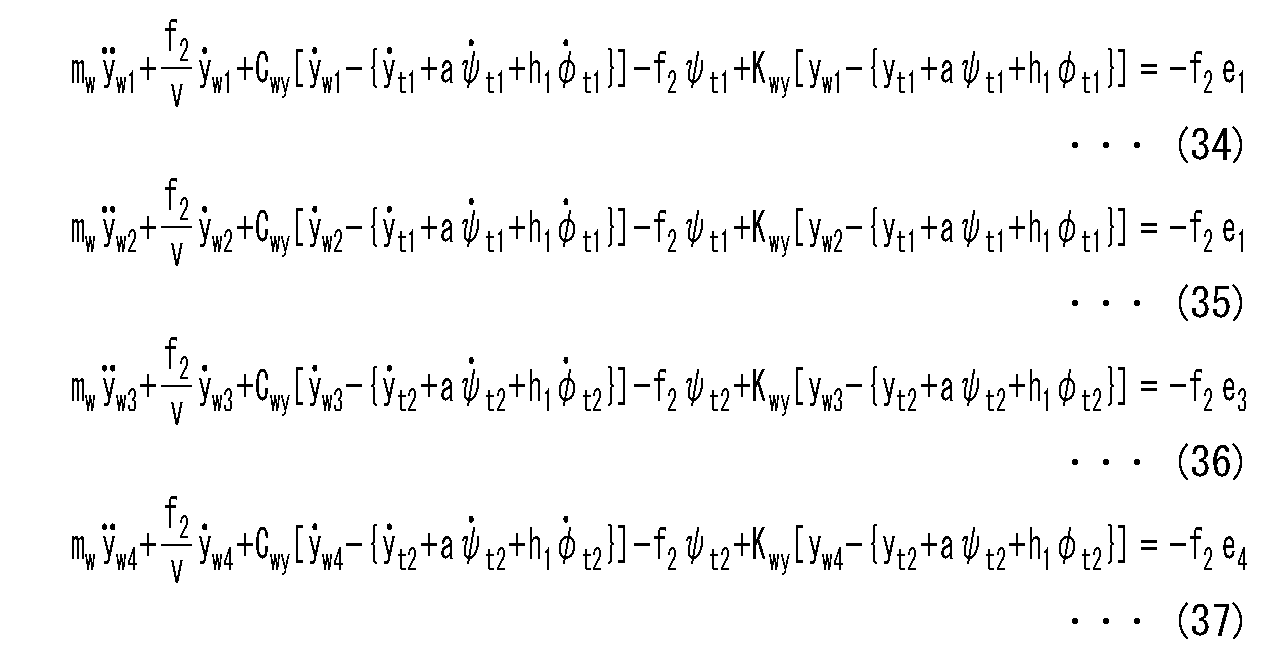
このように、(1)式~(4)式の輪軸13a~13dの横振動(左右方向における運動)を記述する運動方程式を、変換変数e1~e4を用いて表現することで、当該運動方程式に含まれていた輪軸13a~13dのヨーイング方向における回動量(角変位)ψw1~ψw4を消去することができる。
In this way, the equation of motion describing the lateral vibration (movement in the left-right direction) of the wheel sets 13a to 13d in the equations (1) to (4) is expressed using the conversion variables e 1 to e 4 to The amount of rotation (angular displacement) ψ w1 to ψ w4 in the yawing direction of the wheel sets 13a to 13d included in the equation of motion can be eliminated.
(22)式~(25)式を、(11)式、(12)式の台車12a、12bのヨーイングを記述する運動方程式に代入すると、以下の(38)式、(39)式が得られる。
Substituting the equations (22) to (25) into equations of motion describing the yawing of the carriages 12a and 12b of the equations (11) and (12), the following equations (38) and (39) can be obtained .
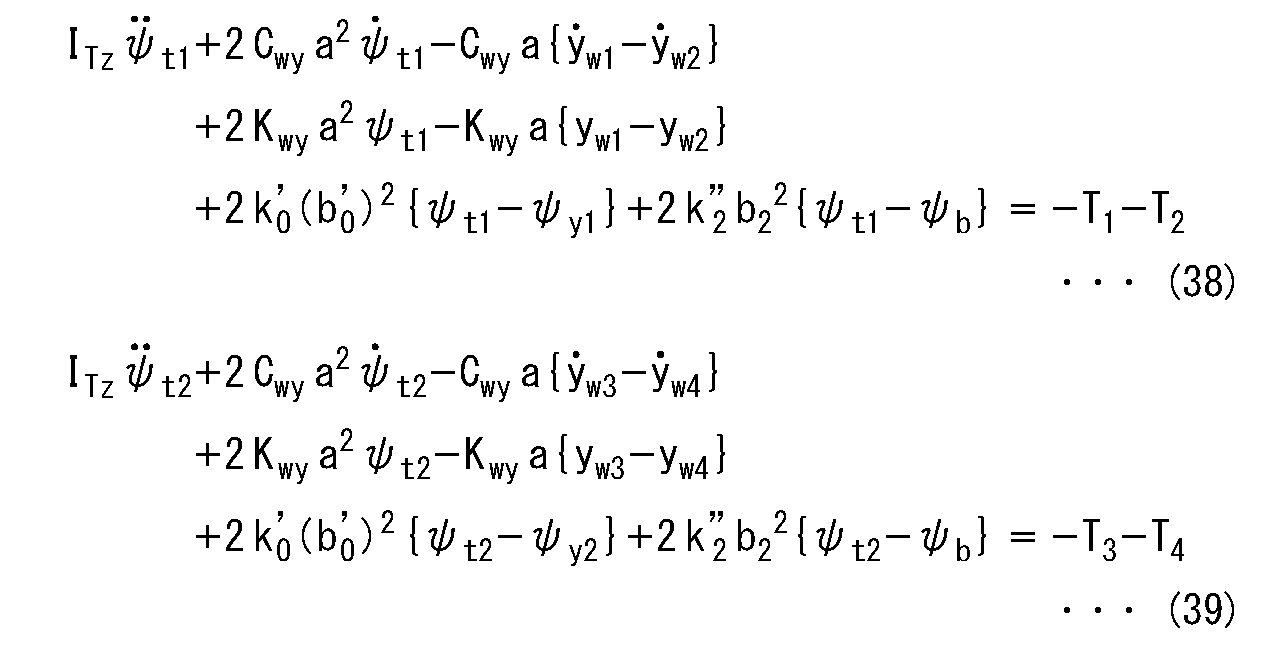
このように、(11)式、(12)式の台車12a、12bのヨーイングを記述する運動方程式を、前後方向力T1~T4を用いて表現することで、当該運動方程式に含まれていた輪軸13a~13dのヨーイング方向における角変位ψw1~ψw4および角速度ψw1・~ψw4・を消去できる。
Thus, (11), (12) of the carriage 12a, the equation of motion describing the yawing 12b, that expressed using the front-rear direction force T 1 ~ T 4, are included in the equation of motion and can be erased angular displacement ψ w1 ~ ψ w4 and the angular velocity ψ w1 · ~ ψ w4 · in the yawing direction of the wheel shaft 13a ~ 13d.
また、(26)式~(29)式を、(22)式~(25)式に代入すると、以下の(40)式~(43)式が得られる。
Further, when equations (26) to (29) are substituted into equations (22) to (25), the following equations (40) to (43) are obtained.

以上のように本実施形態では、(34)式~(37)式のようにして輪軸13a~13dの横振動(左右方向における運動)を記述する運動方程式を表すと共に、(38)式、(39)式のようにして台車12a、12bのヨーイングを記述する運動方程式を表し、これらを用いて状態方程式を構成する。また、(40)式~(43)式は、常微分方程式であり、その解である変換変数e1~e4の実績値は、輪軸13a~13dにおける前後方向力T1~T4の値を用いることにより求めることができる。ここで、前後方向力T1~T4の値は、後述する第1の周波数調整部804により、前後方向力の測定値の時系列データから鉄道車両が軌道の曲線部を走行することに起因して生じる低周波成分の信号強度を低減されたものである。
As described above, in the present embodiment, an equation of motion that describes the lateral vibration (movement in the left and right direction) of the wheel sets 13a to 13d is represented as in Eqs. (34) to (37), and Eq. 39) The equations of motion describing the yawing of the carriages 12a and 12b are expressed as in the equation 39, and these are used to construct a state equation. Further, the equations (40) to (43) are ordinary differential equations, and the actual values of the conversion variables e 1 to e 4 which are the solutions thereof are the values of the longitudinal forces T 1 to T 4 at the wheelset 13 a to 13 d. It can be determined by using Here, the values of the longitudinal forces T 1 to T 4 are attributed to the railway vehicle traveling along the curved portion of the track based on the time-series data of the measured values of the longitudinal force by the first frequency adjustment unit 804 described later. Signal strength of the low frequency component that is generated.
このようにして求めた変換変数e1~e4の実績値を、(34)式~(37)式に与える。また、輪軸13a~13dにおける前後方向力T1~T4の値を(38)式、(39)式に与える。ここで、前後方向力T1~T4の値は、後述する第1の周波数調整部804により、前後方向力の測定値の時系列データから鉄道車両が軌道の曲線部を走行することに起因して生じる低周波成分の信号強度を低減されたものである。
The actual values of the conversion variables e 1 to e 4 thus obtained are given to the equations (34) to (37). Further, the values of the longitudinal forces T 1 to T 4 at the wheel sets 13 a to 13 d are given to the equations (38) and (39). Here, the values of the longitudinal forces T 1 to T 4 are attributed to the railway vehicle traveling along the curved portion of the track based on the time-series data of the measured values of the longitudinal force by the first frequency adjustment unit 804 described later. Signal strength of the low frequency component that is generated.
本実施形態では、以下の(44)式に示す変数を状態変数とし、(9)式、(10)式、(13)式~(21)式、(34)式~(39)式の運動方程式を用いて状態方程式を構成する。
In the present embodiment, the variables represented by the following equation (44) are state variables, and the motions of the equations (9), (10), (13) to (21), and (34) to (39) Construct a state equation using an equation.

状態方程式記憶部801は、例えば、以上のようにして構成される状態方程式を、オペレータによるユーザインターフェース908の操作に基づいて入力し、記憶する。
For example, the state equation storage unit 801 inputs and stores the state equation configured as described above based on the operation of the user interface 908 by the operator.
[観測方程式記憶部802、S1002]
観測方程式記憶部802は、観測方程式を記憶する。本実施形態では、車体11の左右方向における加速度、台車12a、12bの左右方向における加速度、および輪軸13a~13dの左右方向における加速度を観測変数とする。この観測変数は、後述するカルマンフィルタによるフィルタリングの観測変数である。本実施形態では、(34)式~(37)式、(9)式、(10)式、および(15)式の横振動を記述する運動方程式を用いて観測方程式を構成する。観測方程式記憶部802は、例えば、このようにして構成される観測方程式を、オペレータによるユーザインターフェース908の操作に基づいて入力し、記憶する。 [Observationequation storage unit 802, S1002]
The observationequation storage unit 802 stores an observation equation. In the present embodiment, the acceleration in the lateral direction of the vehicle body 11, the acceleration in the lateral direction of the bogies 12a and 12b, and the acceleration in the lateral direction of the wheel sets 13a to 13d are used as observation variables. This observation variable is an observation variable of the filtering by the Kalman filter mentioned later. In the present embodiment, observation equations are configured using the motion equations describing the lateral vibration of the equations (34) to (37), (9), (10), and (15). The observation equation storage unit 802, for example, inputs and stores an observation equation configured in this way based on the operation of the user interface 908 by the operator.
観測方程式記憶部802は、観測方程式を記憶する。本実施形態では、車体11の左右方向における加速度、台車12a、12bの左右方向における加速度、および輪軸13a~13dの左右方向における加速度を観測変数とする。この観測変数は、後述するカルマンフィルタによるフィルタリングの観測変数である。本実施形態では、(34)式~(37)式、(9)式、(10)式、および(15)式の横振動を記述する運動方程式を用いて観測方程式を構成する。観測方程式記憶部802は、例えば、このようにして構成される観測方程式を、オペレータによるユーザインターフェース908の操作に基づいて入力し、記憶する。 [Observation
The observation
以上のようにして、状態方程式および観測方程式が検査装置800に記憶された後に、データ取得部803、第1の周波数調整部804、フィルタ演算部805、第2の周波数調整部806、軌道状態算出部807、および出力部808が起動する。即ち、図10のフローチャートによる事前処理が終了した後に、図11のフローチャートによる本処理が開始する。
As described above, after the state equation and the observation equation are stored in the inspection apparatus 800, the data acquisition unit 803, the first frequency adjustment unit 804, the filter operation unit 805, the second frequency adjustment unit 806, and the trajectory state calculation The unit 807 and the output unit 808 are activated. That is, after the pre-processing according to the flowchart of FIG. 10 is completed, the main processing according to the flowchart of FIG. 11 is started.
[データ取得部803、S1101]
データ取得部803は、計測データを所定のサンプリング周期で取得する。
本実施形態では、データ取得部803は、計測データとして、車体11の左右方向における加速度の測定値の時系列データ、台車12a、12bの左右方向における加速度の測定値の時系列データ、および輪軸13a~13dの左右方向における加速度の測定値の時系列データを取得する。各加速度は、例えば、車体11、台車12a、12b、および輪軸13a~13dにそれぞれ取り付けられた歪ゲージと、当該歪ゲージの測定値を用いて加速度を演算する演算装置とを用いることにより測定される。尚、加速度の測定は、公知の技術で実現することができるので、その詳細な説明を省略する。 [Data acquisition unit 803, S1101]
Thedata acquisition unit 803 acquires measurement data at a predetermined sampling cycle.
In the present embodiment, thedata acquisition unit 803 uses, as measurement data, time-series data of measured values of acceleration in the left-right direction of the vehicle body 11, time-series data of measured values of acceleration in the left-right direction of the carts 12a and 12b, and the wheel shaft 13a. Time series data of measured values of acceleration in the left and right direction of to 13 d are acquired. Each acceleration is measured by using, for example, strain gauges attached to the vehicle body 11, the bogies 12a and 12b, and the wheel sets 13a to 13d, and a computing device that calculates acceleration using the measurement values of the strain gauges. Ru. In addition, since the measurement of acceleration can be realized by a known technique, the detailed description thereof is omitted.
データ取得部803は、計測データを所定のサンプリング周期で取得する。
本実施形態では、データ取得部803は、計測データとして、車体11の左右方向における加速度の測定値の時系列データ、台車12a、12bの左右方向における加速度の測定値の時系列データ、および輪軸13a~13dの左右方向における加速度の測定値の時系列データを取得する。各加速度は、例えば、車体11、台車12a、12b、および輪軸13a~13dにそれぞれ取り付けられた歪ゲージと、当該歪ゲージの測定値を用いて加速度を演算する演算装置とを用いることにより測定される。尚、加速度の測定は、公知の技術で実現することができるので、その詳細な説明を省略する。 [
The
In the present embodiment, the
また、データ取得部803は、計測データとして、前後方向力の測定値の時系列データを取得する。前後方向力の測定の方法は、前述した通りである。
データ取得部803は、例えば、前述した演算装置との通信を行うことにより、計測データを取得することができる。 In addition, thedata acquisition unit 803 acquires, as measurement data, time-series data of measured values of longitudinal force. The method of measuring the longitudinal force is as described above.
Thedata acquisition unit 803 can acquire measurement data, for example, by communicating with the above-described arithmetic device.
データ取得部803は、例えば、前述した演算装置との通信を行うことにより、計測データを取得することができる。 In addition, the
The
[第1の周波数調整部804、S1102]
第1の周波数調整部804は、データ取得部803により取得された計測データのうち、前後方向力の測定値の時系列データに含まれる低周波成分の信号強度を低減(好ましくは除去)する。この低周波成分の信号は、鉄道車両が直線軌道を走行している場合には計測されないが、鉄道車両が曲線軌道を走行している場合に計測される信号である。即ち、鉄道車両が曲線軌道を走行している場合に計測される信号は、鉄道車両が直線軌道を走行している場合に計測される信号に、この低周波成分の信号が重畳された信号と見なすことができる。 [FirstFrequency Adjustment Unit 804, S1102]
The firstfrequency adjustment unit 804 reduces (preferably eliminates) the signal strength of the low frequency component included in the time series data of the measurement value of the longitudinal force among the measurement data acquired by the data acquisition unit 803. The low frequency component signal is not measured when the railway vehicle travels on a straight track, but is measured when the railway vehicle travels on a curved trajectory. That is, the signal measured when the railway vehicle travels on a curved track is a signal obtained by superimposing the low frequency component signal on the signal measured when the railway vehicle travels on a straight track. It can be considered.
第1の周波数調整部804は、データ取得部803により取得された計測データのうち、前後方向力の測定値の時系列データに含まれる低周波成分の信号強度を低減(好ましくは除去)する。この低周波成分の信号は、鉄道車両が直線軌道を走行している場合には計測されないが、鉄道車両が曲線軌道を走行している場合に計測される信号である。即ち、鉄道車両が曲線軌道を走行している場合に計測される信号は、鉄道車両が直線軌道を走行している場合に計測される信号に、この低周波成分の信号が重畳された信号と見なすことができる。 [First
The first
本発明者らは、自己回帰モデル(AR(Auto-regressive)モデル)を修正したモデルを考案した。そして、本発明者らは、このモデルを用いて、前後方向力の測定値の時系列データに含まれる低周波成分の信号強度を低減することに想到した。以下の説明では、本発明者らが考案したモデルを、修正自己回帰モデルと称する。これに対し、公知の自己回帰モデルを、単に自己回帰モデルと称する。以下、修正自己回帰モデルの一例について説明する。
The present inventors devised a model in which an autoregressive model (AR (Auto-regressive) model) was modified. Then, the present inventors considered using this model to reduce the signal strength of the low frequency component included in the time series data of the measured values of the longitudinal force. In the following description, the model devised by the present inventors is referred to as a modified autoregressive model. On the other hand, known autoregressive models are simply referred to as autoregressive models. Hereinafter, an example of the modified autoregressive model will be described.
時刻k(1≦k≦M)における物理量の時系列データyの値をykとする。Mは、物理量の時系列データyがどの時刻までのデータを含むかを示す数であり、予め設定されている。以下の説明では、物理量の時系列データを必要に応じてデータyと略称する。データyの値ykを近似する自己回帰モデルは、例えば、以下の(45)式のようになる。(45)式に示すように、自己回帰モデルとは、データyにおける時刻k(m+1≦k≦M)の物理量の予測値y^kを、データyにおけるその時刻kよりも前の時刻k-l(1≦l≦m)の物理量の実績値yk-lを用いて表す式である。尚、y^kは、(45)式において、ykの上に^を付けて表記したものである。
The value of the time series data y of the physical quantity and y k at time k (1 ≦ k ≦ M) . M is a number indicating the time until which time series data y of the physical quantity includes data, and is set in advance. In the following description, time series data of physical quantities will be abbreviated as data y as necessary. An autoregressive model that approximates the value y k of the data y is, for example, as the following equation (45). As shown in the equation (45), the autoregressive model is the predicted value k k of the physical quantity at time k (m + 1 ≦ k ≦ M) in the data y, and the time k− before the time k in the data y It is an expression expressed using actual values y k-1 of physical quantities of l (1 ≦ l ≦ m). In addition, k k is represented by adding の 上 on yk in the equation (45).

(45)式におけるαは、自己回帰モデルの係数である。mは、自己回帰モデルにおいて時刻kにおけるデータyの値ykを近似するために用いられるデータyの値の数であって、その時刻kよりも前の連続する時刻k-1~k-mにおけるデータyの値yk-1~yk-mの数である。mは、M未満の整数である。mとして、例えば、1500を用いることができる。
Α in equation (45) is a coefficient of the autoregressive model. m is a number of values of the data y to be used to approximate the value y k of the data y at time k in the autoregressive model, the time k-1 ~ k-m of consecutive before that time k The values of the data y in y are the numbers y k-1 to y k-m . m is an integer less than M. For example, 1500 can be used as m.
続いて、最小二乗法を用いて、自己回帰モデルによる時刻kにおける物理量の予測値y^kが、値ykに近似するための条件式を求める。自己回帰モデルによる時刻kにおける物理量の予測値y^kが値ykに近似するための条件として、例えば、自己回帰モデルによる時刻kにおける物理量の予測値y^kと値ykとの二乗誤差を最小化するとする条件を採用することができる。即ち、自己回帰モデルによる時刻kにおける物理量の予測値y^kを値ykに近似するために最小二乗法を用いる。以下の(46)式は、自己回帰モデルによる時刻kにおける物理量の予測値y^kを値ykとの二乗誤差を最小にするための条件式である。
Then, using the least squares method, prediction value y ^ k of the physical quantity at the time k by autoregressive model to determine the condition for approximating the value y k. As a condition for the predicted value y ^ k of the physical quantity at the time k by autoregressive model approximates a value y k, for example, square errors between the predicted value y ^ k value y k of the physical quantity at the time k by autoregressive model It is possible to employ conditions that minimize the That is, using the least squares method to approximate the predicted value y ^ k of the physical quantity at the time k by autoregressive model to a value y k. The following expression (46) is a conditional expression for minimizing square error of the prediction value y ^ k of the physical quantity and the value y k at time k by autoregressive model.
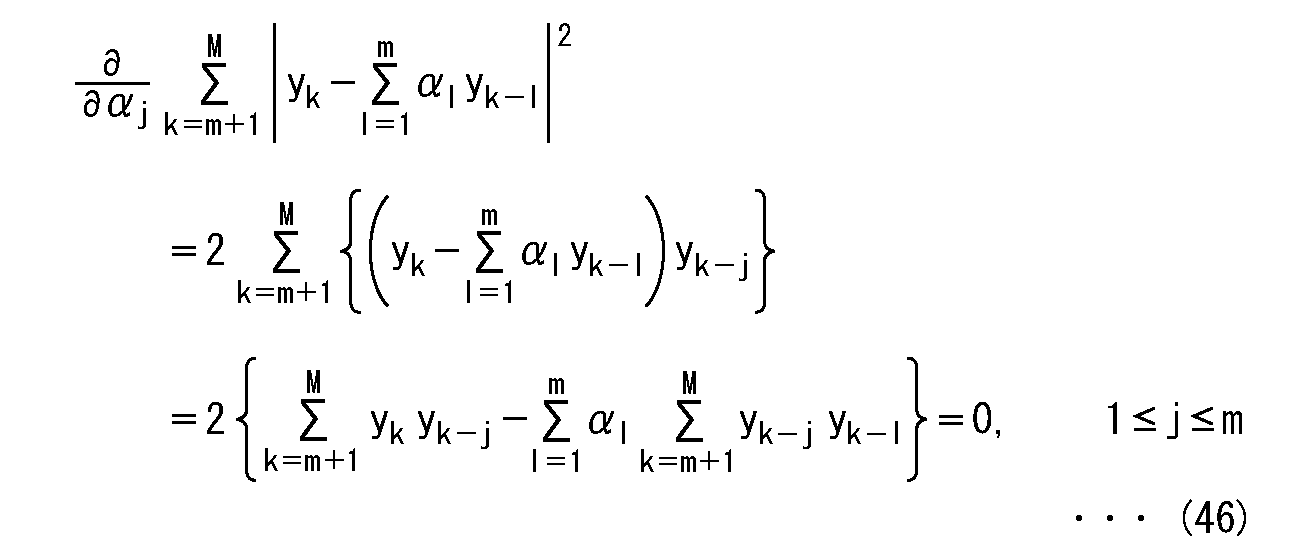
(46)式より、以下の(47)式の関係が成り立つ。
From the equation (46), the following equation (47) holds.
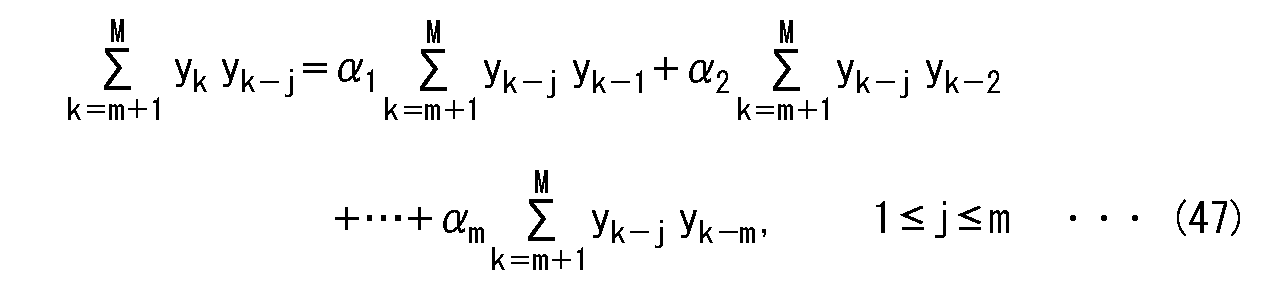
また、(47)式を変形(行列表記)することで、以下の(48)式が得られる。
Further, the following equation (48) can be obtained by modifying the equation (47) (in matrix notation).
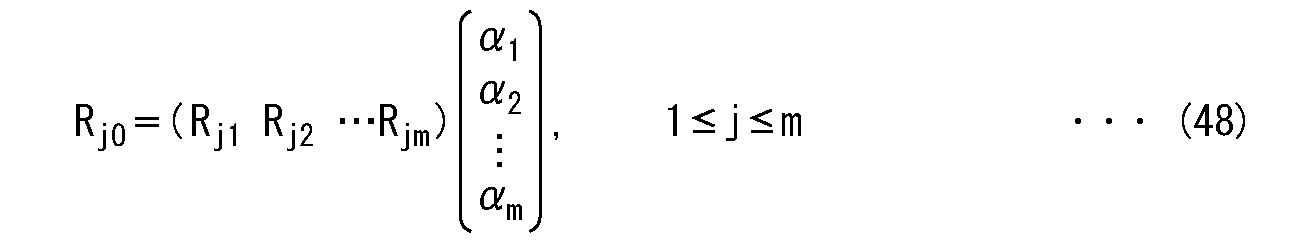
(48)式におけるRjlはデータyの自己相関と呼ばれるもので、以下の(49)式で定義される値である。このときの|j-l|を時差という。
R jl in equation (48) is called autocorrelation of data y, and is a value defined by the following equation (49). This time | j−l | is called time difference.

(48)式を基に、以下の(50)式を考える。(50)式は、自己回帰モデルによる時刻kにおける物理量の予測値y^kと、その予測値y^kに対応する時刻kにおける物理量の値ykと、の誤差を最小化する条件から導出される方程式である。(50)式は、ユール・ウォーカー(Yule-Walker)方程式と呼ばれる。また、(50)式は、自己回帰モデルの係数から成るベクトルを変数ベクトルとする線形方程式である。(50)式における左辺の定数ベクトルは、時差が1からmまでのデータyの自己相関を成分とするベクトルである。以下の説明では、(50)式における左辺の定数ベクトルを必要に応じて自己相関ベクトルと称する。また、(50)式における右辺の係数行列は、時差が0からm-1までのデータyの自己相関を成分とする行列である。以下の説明では、(50)式における右辺の係数行列を必要に応じて自己相関行列と称する。
Based on equation (48), consider the following equation (50). (50) equation, derived from the condition that minimizes the prediction value y ^ k of the physical quantity at the time k by autoregressive model, the value y k of the physical quantity at the time k corresponding to the predicted value y ^ k, the error The equation is The equation (50) is called the Yule-Walker equation. Further, equation (50) is a linear equation in which a vector composed of the coefficients of the autoregressive model is a variable vector. The constant vector on the left side in equation (50) is a vector whose component is the autocorrelation of data y with a time difference of 1 to m. In the following description, the constant vector on the left side in equation (50) will be referred to as an autocorrelation vector as necessary. Further, the coefficient matrix on the right side in the equation (50) is a matrix having autocorrelation of data y with a time difference of 0 to m−1 as a component. In the following description, the coefficient matrix on the right side in the equation (50) is referred to as an autocorrelation matrix as necessary.
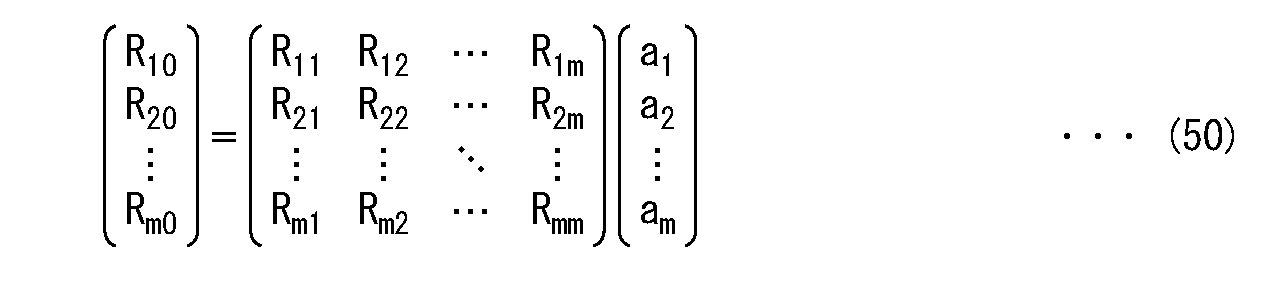
また、(50)式における右辺の自己相関行列(Rjlで構成されるm×mの行列)を、以下の(51)式のように、自己相関行列Rと表記する。
Further, the autocorrelation matrix on the right side of the equation (50) (m × m matrix composed of R jl ) is expressed as an autocorrelation matrix R as in the following equation (51).
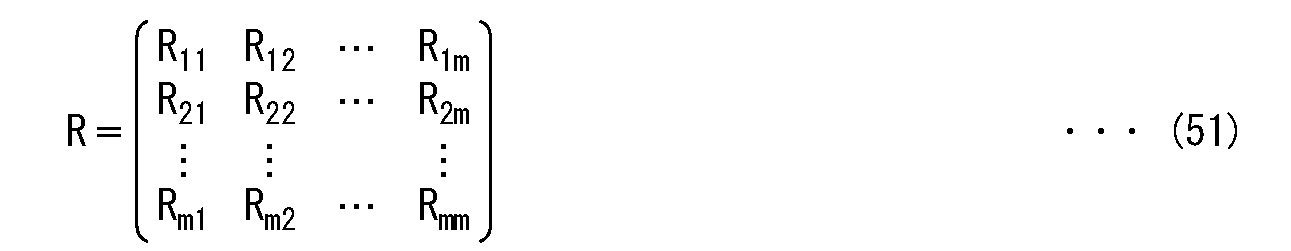
一般に、自己回帰モデルの係数を求める際には、(50)式を係数αについて解くという方法が用いられる。(50)式では、自己回帰モデルで導出される時刻kにおける物理量の予測値y^kが、その時刻kにおける物理量の値ykにできるだけ近づくように係数αを導出する。よって、自己回帰モデルの周波数特性には、各時刻におけるデータyの値ykに含まれる多数の周波数成分が含まれる。
In general, when finding the coefficients of the autoregressive model, a method of solving equation (50) for the coefficient α is used. (50) In the formula, the predicted value y ^ k of the physical quantity at the time k derived by autoregressive model to derive the coefficients α as close as possible to the value y k of the physical quantity at the time k. Therefore, the frequency characteristics of the autoregressive model include many frequency components included in the value y k of the data y at each time.
そこで、本発明者らは、自己回帰モデルの係数αに乗算される自己相関行列Rに着目し、鋭意検討した。その結果、本発明者らは、自己相関行列Rの固有値の一部を用いて、データyに含まれる高周波成分の影響を低減することができることを見出した。即ち、本発明者らは、低周波成分が強調されるように自己相関行列Rを書き換えることができることを見出した。
Therefore, the present inventors have intensively studied the autocorrelation matrix R to be multiplied by the coefficient α of the autoregressive model. As a result, the present inventors have found that a part of the eigenvalues of the autocorrelation matrix R can be used to reduce the influence of high frequency components included in the data y. That is, the present inventors have found that the autocorrelation matrix R can be rewritten so that low frequency components are emphasized.
以下に、このことの具体例を説明する。
自己相関行列Rを特異値分解する。自己相関行列Rの要素は、対称である。従って、自己相関行列Rを特異値分解すると以下の(52)式のように、直交行列Uと、対角行列Σと、直交行列Uの転置行列との積となる。 Below, the specific example of this is demonstrated.
Singular value decomposition of the autocorrelation matrix R. The elements of the autocorrelation matrix R are symmetrical. Therefore, singular value decomposition of the autocorrelation matrix R results in the product of the orthogonal matrix U, the diagonal matrix Σ, and the transposed matrix of the orthogonal matrix U as expressed by the following equation (52).

(52)式の対角行列Σは、以下の(53)式に示すように、対角成分が自己相関行列Rの固有値となる行列である。対角行列Σの対角成分を、σ11、σ22、・・・、σmmとする。また、直交行列Uは、各列成分ベクトルが自己相関行列Rの固有ベクトルとなる行列である。直交行列Uの列成分ベクトルを、u1、u2、・・・、umとする。自己相関行列Rの固有ベクトルujに対する固有値がσjjという対応関係がある。自己相関行列Rの固有値は、自己回帰モデルによる時刻kにおける物理量の予測値y^kの時間波形に含まれる各周波数の成分の強度を反映する変数である。
The diagonal matrix Σ in the equation (52) is a matrix whose diagonal components are eigenvalues of the autocorrelation matrix R, as shown in the following equation (53). The diagonal elements of the diagonal matrix Σ, σ 11, σ 22, ···, and sigma mm. The orthogonal matrix U is a matrix in which each column component vector is an eigenvector of the autocorrelation matrix R. Let u 1 , u 2 ,..., U m be column component vectors of the orthogonal matrix U. There is a correspondence relation that the eigenvalues for the eigenvector u j of the autocorrelation matrix R are σ jj . The eigenvalues of the autocorrelation matrix R are variables that reflect the strength of the component of each frequency included in the time waveform of the predicted value ^ k of the physical quantity at time k by the autoregression model.

自己相関行列Rの特異値分解の結果から得られる対角行列Σの対角成分であるσ11、σ22、・・・、σmmの値は、数式の表記を簡略にするために降順とする。(53)式に示す自己相関行列Rの固有値のうち、最大のものからs個の固有値を用いて、以下の(54)式のように、行列R’を定義する。sは、1以上且つm未満の数である。本実施形態では、sは、予め定められる。行列R’は、自己相関行列Rの固有値のうちs個の固有値を用いて自己相関行列Rを近似した行列である。
The values of σ 11 , σ 22 ,..., Σ mm , which are diagonal components of the diagonal matrix ら れ る obtained from the result of singular value decomposition of the autocorrelation matrix R, are in descending order and in order to simplify the expression of equations. Do. Among the eigenvalues of the autocorrelation matrix R shown in the equation (53), a matrix R ′ is defined as in the following equation (54) using s eigenvalues from the largest one. s is a number greater than or equal to 1 and less than m. In the present embodiment, s is predetermined. The matrix R ′ is a matrix obtained by approximating the autocorrelation matrix R using s eigenvalues of the eigenvalues of the autocorrelation matrix R.
(54)式における行列Usは、(52)式の直交行列Uの左からs個の列成分ベクトル(使用される固有値に対応する固有ベクトル)により構成されるm×s行列である。つまり、行列Usは、直交行列Uから左のm×sの要素を切り出して構成される部分行列である。また、(54)式におけるUs
Tは、Usの転置行列である。Us
Tは、(52)式の行列UTの上からs個の行成分ベクトルにより構成されるs×m行列である。(54)式における行列Σsは、(52)式の対角行列Σの左からs個の列と、上からs個の行により構成されるs×s行列である。つまり、行列Σsは、対角行列Σから左上のs×sの要素を切り出して構成される部分行列である。
行列Σsおよび行列Usを行列要素で表現すれば、以下の(55)式のようになる。 The matrix U s in the equation (54) is an m × s matrix composed of s column component vectors (eigenvectors corresponding to the used eigenvalues) from the left of the orthogonal matrix U in the equation (52). That is, the matrix U s is a submatrix configured by extracting the left m × s elements from the orthogonal matrix U. Also, U s T in equation (54) is the transpose matrix of U s . U s T is an s × m matrix composed of s row component vectors from the top of the matrix U T in equation (52). The matrix s s in the equation (54) is an s × s matrix composed of s columns from the left of the diagonal matrix Σ in the equation (52) and s rows from the top. That is, the matrix s s is a submatrix configured by extracting the upper left s × s elements from the diagonal matrix Σ.
If the matrix s s and the matrix U s are represented by matrix elements, the following equation (55) is obtained.
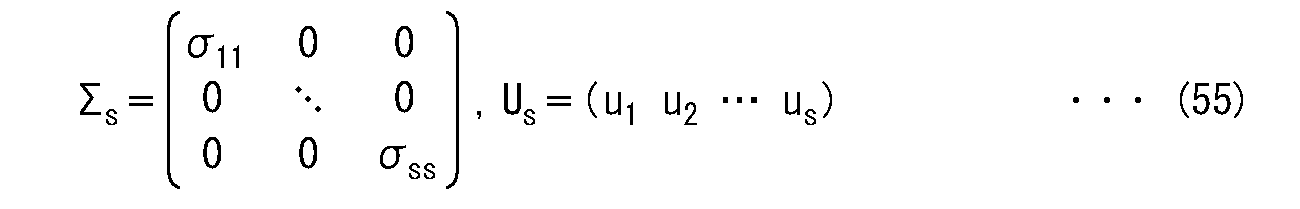
自己相関行列Rの代わりに行列R’を用いることで、(50)式の関係式を、以下の(56)式のように書き換える。
By using the matrix R 'instead of the autocorrelation matrix R, the relational expression of the equation (50) is rewritten as the following equation (56).
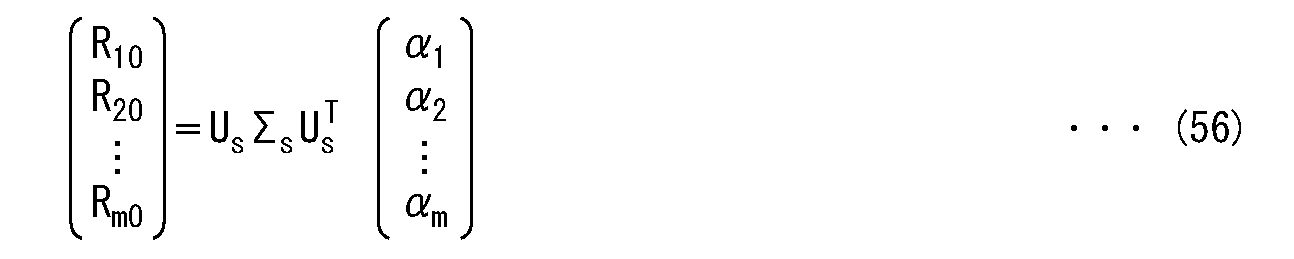
(56)式を変形することで、係数αを求める式として、以下の(57)式が得られる。(57)式によって求められる係数αを用いて、(45)式により、時刻kにおける物理量の予測値y^kを算出するモデルが「修正自己回帰モデル」である。
By modifying the equation (56), the following equation (57) can be obtained as an equation for obtaining the coefficient α. The model which calculates the predicted value ^ k of the physical quantity at time k by the equation (45) using the coefficient α determined by the equation (57) is a “corrected autoregressive model”.
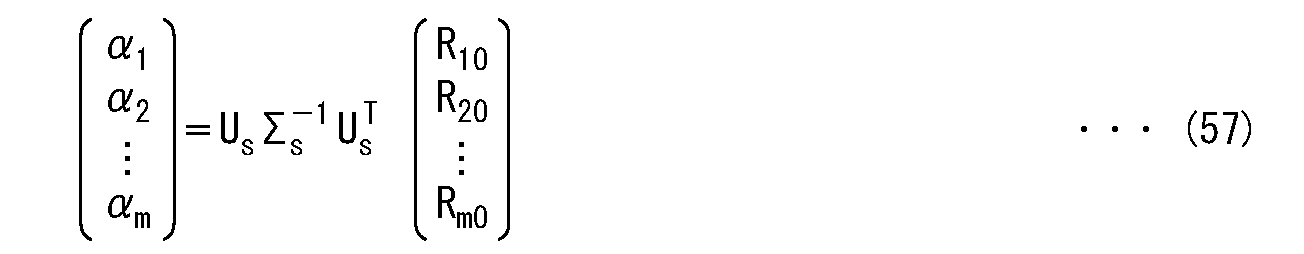
ここでは、対角行列Σの対角成分であるσ11、σ22、・・・、σmmの値を降順とする場合を例に挙げて説明した。しかしながら、係数αの算出過程において対角行列Σの対角成分は降順である必要はない。その場合には、行列Usは、直交行列Uから左のm×sの要素を切り出して構成される部分行列ではなく、使用される固有値に対応する列成分ベクトル(固有ベクトル)を切り出して構成される部分行列になる。また、行列Σsは、対角行列Σから左上のs×sの要素を切り出して構成される部分行列ではなく、修正自己回帰モデルの係数の決定に利用される固有値を対角成分とするように切り出される部分行列になる。
Here is the diagonal elements of the diagonal matrix Σ σ 11, σ 22, ··· , has been described as an example the case where the descending values of sigma mm. However, the diagonal components of the diagonal matrix Σ need not be in descending order in the process of calculating the coefficient α. In that case, the matrix U s is constructed by extracting column component vectors (eigenvectors) corresponding to the used eigenvalues, not the submatrix constructed by extracting the left m × s elements from the orthogonal matrix U. Submatrix. Also, the matrix Σ s is not a submatrix constructed by cutting out the upper left s × s element from the diagonal matrix 、, but the eigenvalues used for determining the coefficients of the modified autoregressive model are made to be diagonal elements It becomes a submatrix to be cut out.
(57)式は、修正自己回帰モデルの係数の決定に利用される方程式である。(57)式の行列Usは、自己相関行列Rの特異値分解により得られる直交行列Uの部分行列であって、修正自己回帰モデルの係数の決定に利用される固有値に対応する固有ベクトルを列成分ベクトルとする行列(第3の行列)である。また、(57)式の行列Σsは、自己相関行列Rの特異値分解により得られる対角行列の部分行列であって、修正自己回帰モデルの係数の決定に利用される固有値を対角成分とする行列(第2の行列)である。(57)式の行列UsΣsUs
Tは、行列Σsと行列Usとから導出される行列(第1の行列)である。
Equation (57) is an equation used to determine the coefficients of the modified autoregressive model. The matrix U s in Eq. (57) is a submatrix of the orthogonal matrix U obtained by singular value decomposition of the autocorrelation matrix R, and is a column of eigenvectors corresponding to the eigenvalues used for determining the coefficients of the modified autoregressive model It is a matrix (third matrix) to be a component vector. Further, the matrix Σ s of the equation (57) is a submatrix of a diagonal matrix obtained by singular value decomposition of the autocorrelation matrix R, and the eigenvalues used to determine the coefficients of the modified autoregressive model are diagonal components And the second matrix. The matrix U s s s U s T in equation (57) is a matrix (first matrix) derived from the matrix s s and the matrix U s .
(57)式の右辺を計算することにより、修正自己回帰モデルの係数αが求まる。以上、修正自己回帰モデルの係数αの導出方法の一例について説明した。ここでは、修正自己回帰モデルの基となる自己回帰モデルの係数の導出方法を、直感的に分かり易いように、時刻kにおける物理量の予測値y^kに対して最小二乗法を用いる方法とした。しかしながら、一般的には確率過程という概念を用いて自己回帰モデルを定義し、その係数を導出する方法が知られている。その場合に、自己相関は、確率過程(母集団)の自己相関で表現される。この確率過程の自己相関は、時差の関数として表される。従って、本実施形態におけるデータyの自己相関は、確率過程の自己相関を近似するものであれば他の計算式で算出した値に代えてもよい。例えば、R22~Rmmは、時差が0(ゼロ)の自己相関であるが、これらをR11に置き換えてもよい。
By calculating the right side of equation (57), the coefficient α of the modified autoregressive model can be obtained. Heretofore, an example of the method for deriving the coefficient α of the modified autoregressive model has been described. Here, the method of deriving the coefficients of the autoregressive model on which to base modification autoregressive model intuitively easy understanding, and the method of using the least squares method to the prediction value y ^ k of the physical quantity at the time k . However, in general, there is known a method of defining an autoregressive model using the concept of a stochastic process and deriving its coefficients. In that case, autocorrelation is expressed as autocorrelation of a stochastic process (population). The autocorrelation of this stochastic process is expressed as a function of time difference. Therefore, the autocorrelation of the data y in the present embodiment may be replaced with a value calculated by another formula as long as it approximates the autocorrelation of the stochastic process. For example, R 22 to R mm are autocorrelations with a time difference of 0 (zero), but they may be replaced with R 11 .
(53)式に示す自己相関行列Rから抽出する固有値の数sは、例えば、自己相関行列Rの固有値の分布から決定することができる。
ここでは、前述した修正自己回帰モデルの説明における物理量は、前後方向力になる。前後方向力の値は、鉄道車両の状態に応じて変動する。
そこで、まず、鉄道車両を軌道16上で走行させて、前後方向力の測定値についてのデータyを得る。得られたデータy毎に、(49)式と(51)式とを用いて自己相関行列Rを求める。この自己相関行列Rについて(52)式で表される特異値分解を行うことによって自己相関行列Rの固有値を求める。図12は、自己相関行列Rの固有値の分布の一例を示す図である。図12では、輪軸13aにおける前後方向力T1の測定値のデータyのそれぞれについての自己相関行列Rを特異値分解して得られた固有値σ11~σmmを昇順に並べ替えて、プロットしている。図12の横軸は、固有値のインデックスであり、縦軸は、固有値の値である。 The number s of eigenvalues extracted from the autocorrelation matrix R shown in the equation (53) can be determined, for example, from the distribution of the eigenvalues of the autocorrelation matrix R.
Here, the physical quantities in the description of the above-described modified autoregressive model are forces in the back and forth direction. The value of the longitudinal force fluctuates according to the state of the railway vehicle.
Therefore, first, the railway vehicle is made to travel on thetrack 16 to obtain data y on the measurement value of the longitudinal force. The autocorrelation matrix R is determined for each of the obtained data y using the equations (49) and (51). The eigenvalues of the autocorrelation matrix R are determined by performing singular value decomposition represented by the equation (52) on the autocorrelation matrix R. FIG. 12 is a diagram showing an example of the distribution of eigenvalues of the autocorrelation matrix R. In FIG. 12, the eigenvalues σ 11 to σ mm obtained by singular value decomposition of the autocorrelation matrix R for each of the data y of the measured values of the longitudinal force T 1 in the wheel 13 a are rearranged in ascending order and plotted ing. The horizontal axis of FIG. 12 is the index of the eigenvalue, and the vertical axis is the value of the eigenvalue.
ここでは、前述した修正自己回帰モデルの説明における物理量は、前後方向力になる。前後方向力の値は、鉄道車両の状態に応じて変動する。
そこで、まず、鉄道車両を軌道16上で走行させて、前後方向力の測定値についてのデータyを得る。得られたデータy毎に、(49)式と(51)式とを用いて自己相関行列Rを求める。この自己相関行列Rについて(52)式で表される特異値分解を行うことによって自己相関行列Rの固有値を求める。図12は、自己相関行列Rの固有値の分布の一例を示す図である。図12では、輪軸13aにおける前後方向力T1の測定値のデータyのそれぞれについての自己相関行列Rを特異値分解して得られた固有値σ11~σmmを昇順に並べ替えて、プロットしている。図12の横軸は、固有値のインデックスであり、縦軸は、固有値の値である。 The number s of eigenvalues extracted from the autocorrelation matrix R shown in the equation (53) can be determined, for example, from the distribution of the eigenvalues of the autocorrelation matrix R.
Here, the physical quantities in the description of the above-described modified autoregressive model are forces in the back and forth direction. The value of the longitudinal force fluctuates according to the state of the railway vehicle.
Therefore, first, the railway vehicle is made to travel on the
図12に示す例では、他よりも顕著に高い値をもつ固有値が1つある。また、前記顕著に高い値もつ固有値ほどではないが、他と比べると比較的大きな値を持ち0(ゼロ)とみなせない固有値が2つある。このことから、(53)式に示す自己相関行列Rから抽出する固有値の数sとして、例えば、2または3を採用することができる。どちらを採用しても結果に顕著な差異は生じない。
In the example shown in FIG. 12, there is one eigenvalue having a significantly higher value than the others. Also, although there are two eigenvalues that are not as large as the above-mentioned eigenvalues having a significantly high value, they have relatively large values and can not be regarded as 0 (zero) compared to the other. From this, for example, 2 or 3 can be adopted as the number s of eigenvalues extracted from the autocorrelation matrix R shown in the equation (53). There is no noticeable difference in the results regardless of which one is adopted.
第1の周波数調整部804は、データ取得部803で前後方向力の測定値のデータyの時刻kにおける値ykが所定のサンプリング周期で取得されるたびに以下の処理を行う。
まず、第1の周波数調整部804は、前後方向力の測定値のデータyと、予め設定されている数M、mと、に基づいて、(49)式と(51)式とを用いて自己相関行列Rを生成する。 The firstfrequency adjustment unit 804 performs the following processing each time the data acquisition unit 803 acquires the value y k at time k of the data y of the measurement value of the back and forth direction force at a predetermined sampling cycle.
First, the firstfrequency adjustment unit 804 uses the equations (49) and (51) based on the data y of the measured values of the longitudinal force and the numbers M and m set in advance. Generate an autocorrelation matrix R.
まず、第1の周波数調整部804は、前後方向力の測定値のデータyと、予め設定されている数M、mと、に基づいて、(49)式と(51)式とを用いて自己相関行列Rを生成する。 The first
First, the first
次に、第1の周波数調整部804は、自己相関行列Rを特異値分解することで、(52)式の直交行列Uおよび対角行列Σを導出し、対角行列Σから自己相関行列Rの固有値σ11~σmmを導出する。
次に、第1の周波数調整部804は、自己相関行列Rの複数の固有値σ11~σmmのうち、最大のものからs個の固有値σ11~σssを、修正自己回帰モデルの係数αを求めるのに利用する自己相関行列Rの固有値として選択する。
次に、第1の周波数調整部804は、前後方向力の測定値のデータyと、固有値σ11~σssと、自己相関行列Rの特異値分解により得られた直交行列Uと、に基づいて、(57)式を用いて、修正自己回帰モデルの係数αを決定する。 Next, the firstfrequency adjustment unit 804 derives the orthogonal matrix U and the diagonal matrix Σ of equation (52) by performing singular value decomposition on the autocorrelation matrix R, and the autocorrelation matrix R is derived from the diagonal matrix Σ. Derive the eigenvalues σ 11 to σ mm of
Then, the firstfrequency adjustment unit 804, among the plurality of eigenvalues σ 11 ~ σ mm autocorrelation matrix R, the s eigenvalues σ 11 ~ σ ss from largest, the coefficient correction autoregressive model α It is selected as an eigenvalue of the autocorrelation matrix R used to obtain.
Next, the firstfrequency adjustment unit 804 is based on the data y of measured values of the longitudinal force, the eigenvalues σ 11 to σ ss, and the orthogonal matrix U obtained by singular value decomposition of the autocorrelation matrix R. Equation (57) is used to determine the coefficient α of the corrected autoregressive model.
次に、第1の周波数調整部804は、自己相関行列Rの複数の固有値σ11~σmmのうち、最大のものからs個の固有値σ11~σssを、修正自己回帰モデルの係数αを求めるのに利用する自己相関行列Rの固有値として選択する。
次に、第1の周波数調整部804は、前後方向力の測定値のデータyと、固有値σ11~σssと、自己相関行列Rの特異値分解により得られた直交行列Uと、に基づいて、(57)式を用いて、修正自己回帰モデルの係数αを決定する。 Next, the first
Then, the first
Next, the first
そして、第1の周波数調整部804は、修正自己回帰モデルの係数αと、前後方向力の測定値のデータyと、に基づいて、(45)式により、前後方向力の測定値のデータyの時刻kにおける予測値y^kを導出する。前後方向力の予測値y^kの時系列データは、前後方向力の測定値のデータyに含まれる低周波成分を抽出した時系列データになる。
Then, the first frequency adjustment unit 804 uses the coefficient α of the modified autoregressive model and the data y of the measured value of the longitudinal force according to equation (45) to obtain the data y of the measured value of the longitudinal force Derive a predicted value ^ k at time k of The time series data of the predicted value y ^ k of the longitudinal force is the time series data obtained by extracting the low frequency component contained in the data y of the measured value of the longitudinal force.
図13は、前後方向力の測定値の時系列データ(測定値)と、前後方向力の予測値の時系列データ(計算値)の一例を示す図である。尚、本実施形態では、4つの前後方向力T1~T4の測定値が得られる。即ち、前後方向力について4つのデータyが得られる。図13では、これら4つのデータyのそれぞれにおける測定値および計算値を示す。図13の横軸は、基準の時刻を0(ゼロ)とした場合の当該基準の時刻からの経過時間(秒)で前後方向力T1~T4の測定時刻・計算時刻を表す。縦軸は、前後方向力T1~T4(Nm)である。
FIG. 13 is a diagram showing an example of time-series data (measurement value) of measured values of longitudinal force and time-series data (calculated value) of predicted values of longitudinal force. In the present embodiment, four measured values of the longitudinal forces T 1 to T 4 are obtained. That is, four data y are obtained for the front-rear direction force. FIG. 13 shows measured values and calculated values in each of the four data y. The horizontal axis in FIG. 13 represents the measurement time / calculation time of the longitudinal forces T 1 to T 4 in an elapsed time (seconds) from the reference time when the reference time is 0 (zero). The vertical axis is the longitudinal force T 1 to T 4 (Nm).
図13において、輪軸13aにおける前後方向力T1の計算値は、概ね15秒~35秒において、バイアスがかかっている(即ち、他の時間よりも大きな値を示す)。この期間は、輪軸13aが曲線軌道を通過する期間に対応する。輪軸13bにおける前後方向力T2の計算値、輪軸13cにおける前後方向力T3の計算値、および輪軸13dにおける前後方向力T4の計算値についても、輪軸13aにおける前後方向力T1の計算値と同様に、輪軸13b、13c、13dが曲線軌道を通過する期間にバイアスがかかっている。
13, the calculated value of the longitudinal force T 1 at wheel shaft 13a, (shown i.e., a value greater than other times) in approximately 15 seconds to 35 seconds, bias is applied. This period corresponds to the period in which the wheel set 13a passes a curved track. Calculated value of the longitudinal direction force T 2 in wheel axle 13b, the calculated value of the longitudinal force T 3 in axle 13c, and the also calculated value of the longitudinal force T 4 in Wajiku 13d, the calculated value of the longitudinal force T 1 at wheel shaft 13a Similarly, the wheel shafts 13b, 13c and 13d are biased during the passage of the curved track.
従って、図13において、輪軸13a~13dにおける前後方向力T1~T4の測定値から計算値を除けば、前後方向力T1~T4の信号のうち、輪軸13a~13dが曲線軌道を通過することに起因する低周波成分を除くことができる。即ち、図13において、輪軸13a~13dにおける前後方向力T1~T4の測定値から計算値を除けば、輪軸13a~13dが曲線軌道を通過した場合の前後方向力T1~T4として、輪軸13a~13dが直線軌道を通過した場合と同等の前後方向力を得ることができる。
Thus, in FIG. 13, except for the calculated values from the measured values of the longitudinal force T 1 ~ T 4 in axle 13a ~ 13d, among the signals in the front-rear direction force T 1 ~ T 4, wheel sets 13a ~ 13d is a curved track Low frequency components resulting from passing can be removed. That is, in FIG. 13, except for the calculated values from the measured values of the longitudinal force T 1 ~ T 4 in axle 13a ~ 13d, the longitudinal direction forces T 1 ~ T 4 when the wheel shaft 13a ~ 13d has passed the curved track The same longitudinal force can be obtained as in the case where the wheel sets 13a to 13d pass through the straight track.
そこで、第1の周波数調整部804は、前後方向力の測定値ykの時系列データ(データy)から、前後方向力の予測値y^kの時系列データを減算する。以下の説明では、前後方向力の測定値ykの時系列データ(データy)から、前後方向力の予測値y^kの時系列データを減算した時系列データを、必要に応じて前後方向力の高周波成分の時系列データと称する。また、前後方向力の高周波成分の時系列データの各サンプリング時刻における値を、必要に応じて前後方向力の高周波成分の値と称する。
Therefore, the first frequency adjustment unit 804 subtracts the time-series data of the predicted value y ^ k of the longitudinal force from the time-series data (data y) of the measured value y k of the longitudinal force. In the following description, the time-series data obtained by subtracting the time-series data of the predicted value y ^ k of the longitudinal force from the time-series data (data y) of the measured value y k of the longitudinal force is the longitudinal direction as necessary It is called time series data of high frequency components of force. Moreover, the value in each sampling time of the time series data of the high frequency component of front and back direction force is called the value of the high frequency component of front and back direction force as needed.
図14は、前後方向力の高周波成分の時系列データの一例を示す図である。図14の縦軸は、前後方向力T1、T2、T3、T4の高周波成分の時系列データを示す。即ち、図14の縦軸に示す前後方向力T1、T2、T3、T4の高周波成分は、それぞれ、図13に示した、輪軸13a、13b、13c、13dにおける前後方向力T1、T2、T3、T4の測定値から計算値を減算することにより得られるものである。また、図14の横軸は、図13の横軸と同様に、基準の時刻を0(ゼロ)とした場合の当該基準の時刻からの経過時間(秒)で前後方向力T1~T4の測定時刻・計算時刻を表す。
第1の周波数調整部804は、以上のようにして、前後方向力T1~T4の高周波成分の時系列データを導出する。 FIG. 14 is a diagram showing an example of time series data of high frequency components of front and rear direction force. The vertical axis in FIG. 14 represents time-series data of high-frequency components of longitudinal forces T 1 , T 2 , T 3 , and T 4 . That is, the high frequency component of the longitudinal force T 1, T 2, T 3 ,T 4 indicated on the vertical axis of FIG. 14, respectively, shown in FIG. 13, wheel sets 13a, 13b, 13c, anteroposterior 13d directed force T 1 , T 2 , T 3 and T 4 are obtained by subtracting the calculated values from the measured values. The horizontal axis, horizontal like the shaft, the longitudinal direction forces in the time of the reference 0 (zero) and elapsed time from the time of the standard for the (s) T 1 ~ T 4 in FIG. 13 in FIG. 14 Indicates the measurement time / calculation time of
As described above, the firstfrequency adjustment unit 804 derives time-series data of high-frequency components of the longitudinal forces T 1 to T 4 .
第1の周波数調整部804は、以上のようにして、前後方向力T1~T4の高周波成分の時系列データを導出する。 FIG. 14 is a diagram showing an example of time series data of high frequency components of front and rear direction force. The vertical axis in FIG. 14 represents time-series data of high-frequency components of longitudinal forces T 1 , T 2 , T 3 , and T 4 . That is, the high frequency component of the longitudinal force T 1, T 2, T 3 ,
As described above, the first
[フィルタ演算部805、S1103]
フィルタ演算部805は、観測方程式を観測方程式記憶部802により記憶された観測方程式とし、状態方程式を状態方程式記憶部801により記憶された状態方程式として、カルマンフィルタにより、(44)式に示す状態変数の推定値を決定する。このとき、フィルタ演算部805は、データ取得部803で取得された計測データのうち、前後方向力T1~T4を除く計測データと、第1の周波数調整部804で生成された前後方向力T1~T4の高周波成分の時系列データとを用いる。前述したように本実施形態では、計測データには、車体11の左右方向における加速度の測定値、台車12a、12bの左右方向における加速度の測定値、および輪軸13a~13dの左右方向における加速度の測定値が含まれる。輪軸13a~13dにおける前後方向力T1~T4については、データ取得部803で取得された計測データ(測定値)を用いずに、第1の周波数調整部804で生成された前後方向力T1~T4の高周波成分の時系列データを用いる。 [Filter operation unit 805, S1103]
Thefilter operation unit 805 sets the observation equation as the observation equation stored by the observation equation storage unit 802, and the state equation as the state equation stored by the state equation storage unit 801 by the Kalman filter. Determine the estimated value. At this time, the filter operation unit 805 measures the measurement data excluding the longitudinal forces T 1 to T 4 among the measurement data acquired by the data acquisition unit 803 and the longitudinal force generated by the first frequency adjustment unit 804. The time series data of high frequency components T 1 to T 4 are used. As described above, in the present embodiment, the measurement data includes measured values of acceleration in the left-right direction of the vehicle body 11, measured values of acceleration in the left-right direction of the bogies 12a and 12b, and measurement of acceleration in the left-right direction of the wheel axles 13a to 13d. Contains the value. The longitudinal forces T 1 to T 4 on the wheelset 13 a to 13 d do not use the measurement data (measurement values) acquired by the data acquisition unit 803, but generate the longitudinal force T generated by the first frequency adjustment unit 804. Use time series data of high frequency components 1 to T 4 .
フィルタ演算部805は、観測方程式を観測方程式記憶部802により記憶された観測方程式とし、状態方程式を状態方程式記憶部801により記憶された状態方程式として、カルマンフィルタにより、(44)式に示す状態変数の推定値を決定する。このとき、フィルタ演算部805は、データ取得部803で取得された計測データのうち、前後方向力T1~T4を除く計測データと、第1の周波数調整部804で生成された前後方向力T1~T4の高周波成分の時系列データとを用いる。前述したように本実施形態では、計測データには、車体11の左右方向における加速度の測定値、台車12a、12bの左右方向における加速度の測定値、および輪軸13a~13dの左右方向における加速度の測定値が含まれる。輪軸13a~13dにおける前後方向力T1~T4については、データ取得部803で取得された計測データ(測定値)を用いずに、第1の周波数調整部804で生成された前後方向力T1~T4の高周波成分の時系列データを用いる。 [
The
カルマンフィルタは、データ同化を行う手法の一つである。即ち、カルマンフィルタは、観測できる変数(観測変数)の測定値と推定値との差異が小さく(最小に)なるように、未観測の変数(状態変数)の推定値を決定する手法の一例である。フィルタ演算部805は、観測変数の測定値と推定値との差異が小さく(最小に)なるカルマンゲインを求め、そのときの未観測の変数(状態変数)の推定値を求める。カルマンフィルタにおいては、以下の(58)式の観測方程式と、以下の(59)式の状態方程式を用いる。
Y=HX+V ・・・(58)
X・=ΦX+W ・・・(59) The Kalman filter is one of the methods of data assimilation. That is, the Kalman filter is an example of a method of determining an estimated value of an unobserved variable (state variable) such that the difference between the measured value of the observable variable (observed variable) and the estimated value is small (minimum). . Thefilter operation unit 805 obtains a Kalman gain with which the difference between the measured value of the observed variable and the estimated value is small (minimum), and obtains an estimated value of the unobserved variable (state variable) at that time. In the Kalman filter, the following observation equation (58) and state equation (59) are used.
Y = HX + V (58)
X · = ΦX + W (59)
Y=HX+V ・・・(58)
X・=ΦX+W ・・・(59) The Kalman filter is one of the methods of data assimilation. That is, the Kalman filter is an example of a method of determining an estimated value of an unobserved variable (state variable) such that the difference between the measured value of the observable variable (observed variable) and the estimated value is small (minimum). . The
Y = HX + V (58)
X · = ΦX + W (59)
(58)式において、Yは、観測変数の測定値を格納するベクトルである。Hは、観測モデルである。Xは、状態変数を格納するベクトルである。Vは、観測ノイズである。(59)式において、X・は、Xの時間微分を示す。Φは、線形モデルである。Wは、システムノイズである。尚、カルマンフィルタ自体は、公知の技術で実現できるので、その詳細な説明を省略する。
フィルタ演算部805は、(44)式に示す状態変数の推定値を所定のサンプリング周期で決定することにより、(44)式に示す状態変数の推定値の時系列データを生成する。 In equation (58), Y is a vector storing the measured value of the observation variable. H is an observation model. X is a vector that stores state variables. V is observation noise. In equation (59), X · represents a time derivative of X. Φ is a linear model. W is system noise. The Kalman filter itself can be realized by a known technique, and thus the detailed description thereof is omitted.
Thefilter operation unit 805 generates time series data of estimated values of the state variable shown in equation (44) by determining the estimated value of the state variable shown in equation (44) with a predetermined sampling cycle.
フィルタ演算部805は、(44)式に示す状態変数の推定値を所定のサンプリング周期で決定することにより、(44)式に示す状態変数の推定値の時系列データを生成する。 In equation (58), Y is a vector storing the measured value of the observation variable. H is an observation model. X is a vector that stores state variables. V is observation noise. In equation (59), X · represents a time derivative of X. Φ is a linear model. W is system noise. The Kalman filter itself can be realized by a known technique, and thus the detailed description thereof is omitted.
The
[第2の周波数調整部806]
第1の周波数調整部804により、前後方向力の測定値の時系列データに含まれる低周波成分の信号強度が十分に除去されていないと、フィルタ演算部805により生成される状態変数の推定値の時系列データに、鉄道車両が曲線軌道を走行することに起因する低周波成分の信号が残る虞がある。そこで、第2の周波数調整部806は、フィルタ演算部805により生成された状態変数の推定値の時系列データに含まれる低周波成分の信号強度を低減(好ましくは除去)する。尚、第1の周波数調整部804により、前後方向力の測定値の時系列データに含まれる低周波成分の信号強度が十分に除去されるように、(53)式に示す自己相関行列Rから抽出する固有値の数sを定めることができる場合には、第2の周波数調整部806の処理は不要になる。 [Second frequency adjustment unit 806]
If the signal strength of the low frequency component included in the time series data of the measured value of the longitudinal force is not sufficiently removed by the firstfrequency adjustment unit 804, the estimated value of the state variable generated by the filter operation unit 805 There is a possibility that the signal of the low frequency component resulting from the railway vehicle traveling on the curved track may remain in the time-series data of. Therefore, the second frequency adjustment unit 806 reduces (preferably eliminates) the signal strength of the low frequency component included in the time series data of the estimated value of the state variable generated by the filter operation unit 805. Incidentally, from the autocorrelation matrix R shown in the equation (53), the first frequency adjustment unit 804 can sufficiently remove the signal strength of the low frequency component included in the time series data of the measured values of the longitudinal force. If the number s of unique values to be extracted can be determined, the processing of the second frequency adjustment unit 806 is unnecessary.
第1の周波数調整部804により、前後方向力の測定値の時系列データに含まれる低周波成分の信号強度が十分に除去されていないと、フィルタ演算部805により生成される状態変数の推定値の時系列データに、鉄道車両が曲線軌道を走行することに起因する低周波成分の信号が残る虞がある。そこで、第2の周波数調整部806は、フィルタ演算部805により生成された状態変数の推定値の時系列データに含まれる低周波成分の信号強度を低減(好ましくは除去)する。尚、第1の周波数調整部804により、前後方向力の測定値の時系列データに含まれる低周波成分の信号強度が十分に除去されるように、(53)式に示す自己相関行列Rから抽出する固有値の数sを定めることができる場合には、第2の周波数調整部806の処理は不要になる。 [Second frequency adjustment unit 806]
If the signal strength of the low frequency component included in the time series data of the measured value of the longitudinal force is not sufficiently removed by the first
本実施形態では、第2の周波数調整部806は、第1の周波数調整部804と同様に、修正自己回帰モデルを用いて、状態変数の推定値の時系列データに含まれる低周波成分の信号強度を低減する。
In the present embodiment, like the first frequency adjustment unit 804, the second frequency adjustment unit 806 uses a modified autoregressive model to generate a low frequency component signal included in time series data of estimated values of state variables. Reduce the strength.
第2の周波数調整部806は、所定のサンプリング周期で状態変数毎に以下の処理を行う。
ここでは、前述した修正自己回帰モデルの説明における物理量は、状態変数になる。即ち、状態変数のデータyは、フィルタ演算部805により生成された状態変数の推定値の時系列データになる。状態変数の推定値は、何れも鉄道車両の状態に応じて変動する。
まず、第2の周波数調整部806は、状態変数の推定値のデータyと、予め設定されている数M、mと、に基づいて、(49)式と(51)式とを用いて自己相関行列Rを生成する。 The secondfrequency adjustment unit 806 performs the following processing for each state variable at a predetermined sampling cycle.
Here, the physical quantities in the description of the above-described modified autoregressive model are state variables. That is, data y of the state variable is time-series data of estimated values of the state variable generated by thefilter operation unit 805. The estimated values of the state variables all change according to the state of the railway vehicle.
First, the secondfrequency adjustment unit 806 uses the equations (49) and (51) based on the data y of the estimated value of the state variable and the numbers M and m set in advance. Generate a correlation matrix R.
ここでは、前述した修正自己回帰モデルの説明における物理量は、状態変数になる。即ち、状態変数のデータyは、フィルタ演算部805により生成された状態変数の推定値の時系列データになる。状態変数の推定値は、何れも鉄道車両の状態に応じて変動する。
まず、第2の周波数調整部806は、状態変数の推定値のデータyと、予め設定されている数M、mと、に基づいて、(49)式と(51)式とを用いて自己相関行列Rを生成する。 The second
Here, the physical quantities in the description of the above-described modified autoregressive model are state variables. That is, data y of the state variable is time-series data of estimated values of the state variable generated by the
First, the second
次に、第2の周波数調整部806は、自己相関行列Rを特異値分解することで、(52)式の直交行列Uおよび対角行列Σを導出し、対角行列Σから自己相関行列Rの固有値σ11~σmmを導出する。
次に、第2の周波数調整部806は、自己相関行列Rの複数の固有値σ11~σmmのうち、最大のものからs個の固有値σ11~σssを、修正自己回帰モデルの係数αを求めるのに利用する自己相関行列Rの固有値として選択する。sは、状態変数毎に予め定められる。例えば、鉄道車両を軌道16上で走行させて、これまで説明してきたようにして各状態変数の推定値のデータyを得る。そして、自己相関行列Rの固有値の分布を状態変数毎に個別に作成する。この自己相関行列Rの固有値の分布から、(53)式に示す自己相関行列Rから抽出する固有値の数sを状態変数のそれぞれについて決定する。 Next, the secondfrequency adjustment unit 806 derives the orthogonal matrix U and the diagonal matrix Σ of equation (52) by performing singular value decomposition on the autocorrelation matrix R, and the autocorrelation matrix R is derived from the diagonal matrix を. Derive the eigenvalues σ 11 to σ mm of
Then, secondfrequency adjusting unit 806, among the plurality of eigenvalues σ 11 ~ σ mm autocorrelation matrix R, the s eigenvalues σ 11 ~ σ ss from largest, the coefficient correction autoregressive model α It is selected as an eigenvalue of the autocorrelation matrix R used to obtain. s is predetermined for each state variable. For example, a rail car is run on the track 16 to obtain data y of estimated values of each state variable as described above. Then, distributions of eigenvalues of the autocorrelation matrix R are individually created for each state variable. From the distribution of the eigenvalues of the autocorrelation matrix R, the number s of the eigenvalues extracted from the autocorrelation matrix R shown in the equation (53) is determined for each of the state variables.
次に、第2の周波数調整部806は、自己相関行列Rの複数の固有値σ11~σmmのうち、最大のものからs個の固有値σ11~σssを、修正自己回帰モデルの係数αを求めるのに利用する自己相関行列Rの固有値として選択する。sは、状態変数毎に予め定められる。例えば、鉄道車両を軌道16上で走行させて、これまで説明してきたようにして各状態変数の推定値のデータyを得る。そして、自己相関行列Rの固有値の分布を状態変数毎に個別に作成する。この自己相関行列Rの固有値の分布から、(53)式に示す自己相関行列Rから抽出する固有値の数sを状態変数のそれぞれについて決定する。 Next, the second
Then, second
次に、第2の周波数調整部806は、状態変数の推定値のデータyと、固有値σ11~σssと、自己相関行列Rの特異値分解により得られた直交行列Uと、に基づいて、(57)式を用いて、修正自己回帰モデルの係数αを決定する。
Next, the second frequency adjustment unit 806 is based on data y of estimated values of state variables, eigenvalues σ 11 to σ ss, and orthogonal matrix U obtained by singular value decomposition of autocorrelation matrix R. The equation (57) is used to determine the coefficient α of the modified autoregressive model.
そして、第2の周波数調整部806は、修正自己回帰モデルの係数αと、状態変数の推定値のデータyと、に基づいて、(45)式により、状態変数の推定値のデータyの時刻kにおける予測値y^kを導出する。状態変数の予測値y^kの時系列データは、状態変数の推定値のデータyに含まれる低周波成分を抽出した時系列データになる。
Then, the second frequency adjustment unit 806 determines the time of the data y of the estimated value of the state variable according to the equation (45) based on the coefficient α of the modified autoregressive model and the data y of the estimated value of the state variable We derive the prediction value ^ k at k . The time series data of the predicted value ^ k of the state variable is time series data obtained by extracting the low frequency component contained in the data y of the estimated value of the state variable.
そして、第2の周波数調整部806は、状態変数の推定値のデータyから、状態変数の予測値y^kの時系列データを減算する。以下の説明では、状態変数の推定値のデータyから、状態変数の予測値y^kの時系列データを減算した時系列データの各サンプリング時刻における値を、必要に応じて状態変数の高周波成分の値と称する。
Then, the second frequency adjustment unit 806 subtracts the time-series data of the predicted value k k of the state variable from the data y of the estimated value of the state variable. In the following description, the value at each sampling time of the time series data obtained by subtracting the time series data of the predicted value 状態k of the state variable from the data y of the estimated value of the state variable is the high frequency component of the state variable as necessary. It is called the value of.
[軌道状態算出部807、S1105]
(5)式~(8)式の輪軸13a~13dのヨーイングを記述する運動方程式に、(22)式~(25)式を代入すると、以下の(60)式~(63)式が得られる。 [Orbitstate calculation unit 807, S1105]
If equations (22) to (25) are substituted into equations of motion describing the yawing ofwheel sets 13a to 13d of equations (5) to (8), the following equations (60) to (63) can be obtained .
(5)式~(8)式の輪軸13a~13dのヨーイングを記述する運動方程式に、(22)式~(25)式を代入すると、以下の(60)式~(63)式が得られる。 [Orbit
If equations (22) to (25) are substituted into equations of motion describing the yawing of

本実施形態では、(60)式~(63)式に示すようにして、前後方向力T1~T4と輪軸13a~13dの位置での通り狂い量yR1~yR4との関係を示す関係式が定められる。
軌道状態算出部807は、(30)式~(33)式より、輪軸13a~13dのヨーイング方向における回動量(角変位)ψw1~ψw4の推定値を算出する。そして、軌道状態算出部807は、輪軸13a~13dのヨーイング方向における回動量(角変位)ψw1~ψw4の推定値と、第2の周波数調整部806で生成された状態変数の高周波成分の値と、第1の周波数調整部804により生成された前後方向力T1~T4の高周波成分の値とを、(60)式~(63)式に与えることにより、輪軸13a~13dの位置での通り狂い量yR1~yR4を算出する。ここで使用される状態変数は、台車12a~12bの左右方向の変位yt1~yt2、台車12a~12bの左右方向の速度yt1・~yt2・、輪軸13a~13dの左右方向の変位yw1~yw4、および輪軸13a~13dの左右方向の速度yw1・~yw4・である。軌道状態算出部807は、以上のような通り狂い量yR1~yR4の算出を所定のサンプリング周期で行うことにより、通り狂い量yR1~yR4の時系列データを得る。 In this embodiment, as shown in equations (60) to (63), the relationship between the longitudinal forces T 1 to T 4 and the amounts of deviation y R1 to y R4 at the positions of the wheel sets 13 a to 13 d is shown. A relational expression is defined.
The trackstate calculation unit 807 calculates estimated values of the amount of rotation (angular displacement) ψ w1 to ψ w4 in the yawing direction of the wheel sets 13 a to 13 d from the equations (30) to (33). Then, the track state calculation unit 807 calculates estimated values of rotational amounts (angular displacements) ψ w1 to ψ w4 in the yawing direction of the wheel sets 13a to 13d and the high frequency components of the state variable generated by the second frequency adjustment unit 806. By giving the values and the values of the high frequency components of the longitudinal force T 1 to T 4 generated by the first frequency adjustment unit 804 to the equations (60) to (63), the positions of the wheel sets 13a to 13d are obtained. The amount of deviation y R1 to y R4 is calculated as in the above. Here the state variables used are displaced in the lateral direction of the carriage 12a ~ 12b y t1 ~ y t2 , the left-right direction of the velocity y t1 · ~ y t2 · of the truck 12a ~ 12b, in the lateral direction of the wheel shaft 13a ~ 13d displacement y w1 to y w4 and the speeds y w1 to y w4 in the left-right direction of the wheel sets 13 a to 13 d. The trajectory state calculating unit 807 obtains time series data of the passing amounts y R1 to y R4 by performing the calculation of the off amounts y R1 to y R4 as described above in a predetermined sampling cycle.
軌道状態算出部807は、(30)式~(33)式より、輪軸13a~13dのヨーイング方向における回動量(角変位)ψw1~ψw4の推定値を算出する。そして、軌道状態算出部807は、輪軸13a~13dのヨーイング方向における回動量(角変位)ψw1~ψw4の推定値と、第2の周波数調整部806で生成された状態変数の高周波成分の値と、第1の周波数調整部804により生成された前後方向力T1~T4の高周波成分の値とを、(60)式~(63)式に与えることにより、輪軸13a~13dの位置での通り狂い量yR1~yR4を算出する。ここで使用される状態変数は、台車12a~12bの左右方向の変位yt1~yt2、台車12a~12bの左右方向の速度yt1・~yt2・、輪軸13a~13dの左右方向の変位yw1~yw4、および輪軸13a~13dの左右方向の速度yw1・~yw4・である。軌道状態算出部807は、以上のような通り狂い量yR1~yR4の算出を所定のサンプリング周期で行うことにより、通り狂い量yR1~yR4の時系列データを得る。 In this embodiment, as shown in equations (60) to (63), the relationship between the longitudinal forces T 1 to T 4 and the amounts of deviation y R1 to y R4 at the positions of the wheel sets 13 a to 13 d is shown. A relational expression is defined.
The track
そして、軌道状態算出部807は、通り狂い量yR1~yR4から、最終的な通り狂い量yRを算出する。例えば、軌道状態算出部807は、通り狂い量yR2~yR4の時系列データの位相を、通り狂い量yR1の時系列データの位相に合わせる。即ち、軌道状態算出部807は、輪軸13aと輪軸13b~13dとの前後方向の距離と、鉄道車両の速度とから、或る位置を輪軸13aが通過する時刻に対する、当該位置を輪軸13b~13dが通過する時刻の遅れ時間を算出する。軌道状態算出部807は、通り狂い量yR2~yR4の時系列データに対して、この遅れ時間だけ位相をずらす。
Then, the track state calculation unit 807, from the street deviation amount y R1 ~ y R4, calculates the final streets deviation amount y R. For example, the orbit state calculation unit 807 matches the phase of the time-series data of the amount of deviation y R2 to y R4 with the phase of the time-series data of the amount of deviation y R1 . That is, from the distance between the wheel 13a and the wheels 13b to 13d in the front-rear direction and the speed of the railway vehicle, the track state calculation unit 807 determines the position relative to the time when the wheel 13a passes a certain position. Calculate the delay time of the passing time of The orbit state calculation unit 807 shifts the phase by the delay time with respect to the time-series data of the deviation amounts y R2 to y R4 .
図15は、輪軸13a~13dにおける通り狂い量yR1~yR4の時系列データの一例を示す図である。図15において、輪軸13b~13dにおける通り狂い量yR2~yR4の時系列データの位相は、輪軸13aにおける通り狂い量yR1の時系列データの位相に合わせている。図15の横軸は、基準の時刻を0(ゼロ)とした場合の当該基準の時刻からの経過時間(秒)で通り狂い量yR1の検出時刻を表す。図25の縦軸は、輪軸13a~13dにおける通り狂い量yR1~yR4(m)である。
FIG. 15 is a diagram showing an example of time-series data of the amounts of deviation y R1 to y R4 in the wheelset 13a to 13d. 15, the phase of the time-series data of the wheel as deviations amount of shaft 13b ~ 13d y R2 ~ y R4 are in accordance with the phase of the time-series data of the street deviation amount y R1 in axle 13a. The horizontal axis of FIG. 15 represents the detection time of the street deviation amount y R1 time reference at 0 time elapsed from the time of the reference in the case of a (zero) seconds. The vertical axis in FIG. 25 is the amount of deviation y R1 to y R4 (m) in the wheel sets 13a to 13d.
軌道状態算出部807は、位相を合わせた通り狂い量yR1~yR4の同じサンプリング時刻における値の和の算術平均値を当該サンプリング時刻における最終的な通り狂い量yRとして算出する。軌道状態算出部807は、このような計算を各サンプリング時刻において行うことにより、最終的な通り狂い量yRの時系列データを得る。通り狂い量yR2~yR4の位相を、通り狂い量yR1の位相に合わせるので、通り狂い量yR1~yR4の時系列データに共通して存在する外乱因子を相殺することができる。
Track state calculation unit 807 calculates an arithmetic mean value of the sum of the values at the same sampling time as deviation amount y R1 ~ y R4 the combined phase as the final streets deviation amount y R at the sampling time. Track state calculation unit 807, by performing such calculation at each sampling time to obtain time-series data of the final as deviation amount y R. The phase of the street deviation amount y R2 ~ y R4, so match the phase of the street deviation amount y R1, it is possible to offset the disturbance factors present in common to time-series data of the street deviation amount y R1 ~ y R4.
図16は、最終的な通り狂い量yRの時系列データと、軌道16(レール)の曲率1/Rとの一例を示す図である。図16の横軸は、図15の縦軸と同様に、基準の時刻を0(ゼロ)とした場合の当該基準の時刻からの経過時間(秒)で最終的な通り狂い量yRの検出時刻を表す。図16の上図における縦軸は、各検出時刻における最終的な通り狂い量yR(m)を表す。図16の下図における縦軸は、最終的な通り狂い量yRの各検出時刻に鉄道車両の輪軸13aが位置する地点での軌道16(レール)の曲率1/R(1/m)である。図16の下図において、曲率1/Rが0(ゼロ)であることは直線軌道を示し、曲率1/Rが0(ゼロ)以外の値であることは曲線軌道を示す。
FIG. 16 is a diagram showing an example of time-series data of the final amount of deviation y R and the curvature 1 / R of the track 16 (rail). Similar to the vertical axis in FIG. 15, the horizontal axis in FIG. 16 indicates the final passing error y R in the elapsed time (seconds) from the reference time when the reference time is 0 (zero). Represents the time of day. The vertical axis in the upper part of FIG. 16 represents the final amount of deviation y R (m) at each detection time. The vertical axis in the lower part of FIG. 16 is a curvature 1 / R of the track 16 at the point where wheel shaft 13a of the rail vehicle on the detection time of the last streets deviation amount y R is located (rail) (1 / m) . In the lower part of FIG. 16, a curvature 1 / R of 0 (zero) indicates a linear trajectory, and a curvature 1 / R of values other than 0 (zero) indicates a curved trajectory.
図16の上図において、測定値は、実際に測定した通り狂い量yRである。推定値は、軌道状態算出部807で算出された最終的な通り狂い量yRである。図16の上図に示すように、直線軌道においても曲線軌道においても通り狂い量yRの推定値は測定値に良く一致することが分かる。
In the upper part of FIG. 16, the measured value is the amount of deviation y R as actually measured. The estimated value is the final amount of deviation y R calculated by the orbit state calculation unit 807. As shown in the upper part of FIG. 16, it can be understood that the estimated value of the deviation amount y R well matches the measured value in both the linear orbit and the curved orbit.
尚、軌道状態算出部807は、位相を合わせた通り狂い量yR1~yR4のそれぞれについて移動平均をとり(即ち、ローパスフィルタを通し)、当該移動平均をとった通り狂い量yR1~yR4から、最終的な通り狂い量yRを算出してもよい。
また、軌道状態算出部807は、位相を合わせた通り狂い量yR1~yR4の同じサンプリング時刻における値のうち、最大値と最小値を除く2つの値の算術平均値を最終的な通り狂い量yRとして算出してもよい。 Note that the orbitstate calculation unit 807 takes a moving average (that is, passes a low-pass filter) for each of the phase deviation matched amounts y R1 to y R4 and passes the phase difference calculated as the movement averages y R1 to y From R4 , you may calculate the final amount of deviation y R.
Further, the orbitstate calculation unit 807 is a final deviation of the arithmetic mean value of the two values excluding the maximum value and the minimum value among the values at the same sampling time of the misalignment amounts y R1 to y R4 according to the phase alignment. it may be calculated as the amount y R.
また、軌道状態算出部807は、位相を合わせた通り狂い量yR1~yR4の同じサンプリング時刻における値のうち、最大値と最小値を除く2つの値の算術平均値を最終的な通り狂い量yRとして算出してもよい。 Note that the orbit
Further, the orbit
[出力部808、S1106]
出力部808は、軌道状態算出部807により算出された最終的な通り狂い量yRの情報を出力する。このとき出力部808は、最終的な通り狂い量yRが、予め設定された値よりも大きい場合には、軌道16が異常であることを示す情報を出力してもよい。出力の形態としては、例えば、コンピュータディスプレイへの表示、外部装置への送信、およびの内部または外部の記憶媒体への記憶の少なくとも何れか1つを採用することができる。 [Output unit 808, S1106]
Theoutput unit 808 outputs information on the final amount of deviation y R calculated by the trajectory state calculation unit 807. At this time, the output unit 808 may output information indicating that the trajectory 16 is abnormal if the final amount of deviation y R is larger than a preset value. As the form of the output, for example, at least one of display on a computer display, transmission to an external device, and storage on an internal or external storage medium can be adopted.
出力部808は、軌道状態算出部807により算出された最終的な通り狂い量yRの情報を出力する。このとき出力部808は、最終的な通り狂い量yRが、予め設定された値よりも大きい場合には、軌道16が異常であることを示す情報を出力してもよい。出力の形態としては、例えば、コンピュータディスプレイへの表示、外部装置への送信、およびの内部または外部の記憶媒体への記憶の少なくとも何れか1つを採用することができる。 [
The
(まとめ)
以上のように本実施形態では、検査装置800は、前後方向力T1~T4の測定値の時系列データに含まれる低周波成分の信号強度を低減し、前後方向力T1~T4の高周波成分の時系列データを生成する。検査装置800は、前後方向力T1~T4の高周波成分の時系列データを、前後方向力T1~T4と輪軸13a~13dの位置での通り狂い量yR1~yR4との関係式に与えることにより、輪軸13a~13dの位置での通り狂い量yR1~yR4を算出する。この関係式は、鉄道車両の直線軌道の走行時における運動を記述する運動方程式(即ち、軌道16(レール)の曲率半径Rを含まない式)に基づく式である。従って、曲線軌道における不整を特別な測定装置を用いることなく高精度に検出することができる。 (Summary)
In this embodiment as described above, theinspection apparatus 800 reduces the signal strength of the low-frequency component contained in the time-series data of the measured values of the longitudinal force T 1 ~ T 4, the front-rear direction force T 1 ~ T 4 Generate time series data of high frequency components of Inspection apparatus 800, the time-series data of the high-frequency component of the longitudinal force T 1 ~ T 4, the relationship between the street deviation amount y R1 ~ y R4 in position in the longitudinal direction forces T 1 ~ T 4 and Wajiku 13a ~ 13d By giving the equations, the amounts of deviation y R1 to y R4 at the positions of the wheel sets 13a to 13d are calculated. This relational expression is an expression based on an equation of motion (i.e., an equation not including the radius of curvature R of the track 16 (rail)) that describes the movement of the straight track of the railway vehicle when traveling. Therefore, irregularities in the curved trajectory can be detected with high accuracy without using a special measuring device.
以上のように本実施形態では、検査装置800は、前後方向力T1~T4の測定値の時系列データに含まれる低周波成分の信号強度を低減し、前後方向力T1~T4の高周波成分の時系列データを生成する。検査装置800は、前後方向力T1~T4の高周波成分の時系列データを、前後方向力T1~T4と輪軸13a~13dの位置での通り狂い量yR1~yR4との関係式に与えることにより、輪軸13a~13dの位置での通り狂い量yR1~yR4を算出する。この関係式は、鉄道車両の直線軌道の走行時における運動を記述する運動方程式(即ち、軌道16(レール)の曲率半径Rを含まない式)に基づく式である。従って、曲線軌道における不整を特別な測定装置を用いることなく高精度に検出することができる。 (Summary)
In this embodiment as described above, the
また、本実施形態では、検査装置800は、前後方向力の測定値のデータyから、自己相関行列Rを生成し、自己相関行列Rを特異値分解して得られた固有値のうち、最大のものからs個の固有値を用いて、前後方向力の測定値のデータyを近似する修正自己回帰モデルの係数αを決定する。従って、前後方向力の測定値のデータyに含まれる低周波成分の信号が残り、高周波成分が残らないように、係数αを決定することができる。検査装置800は、時刻kにおける前後方向力の予測値y^kを、このようにして係数αが定められた修正自己回帰モデルに、その時刻よりも前の時刻k-l(1≦l≦m)の前後方向力の測定値のデータyを与えることにより算出する。従って、カットオフ周波数を予め想定することなく、前後方向力の測定値のデータyから、鉄道車両の曲線軌道の走行に起因する低周波成分の信号を低減することができる。
Further, in the present embodiment, the inspection apparatus 800 generates the autocorrelation matrix R from the data y of the measurement values of the longitudinal force, and the largest of the eigenvalues obtained by singular value decomposition of the autocorrelation matrix R. Determine the coefficient α of the modified autoregressive model that approximates the data y of the back and forth force measurements using s eigenvalues from the ones. Accordingly, the coefficient α can be determined such that the low frequency component signal contained in the data y of the measured values of the longitudinal force remains and the high frequency component does not remain. The inspection apparatus 800 uses the predicted value y ^ k of the longitudinal force at the time k to the corrected autoregressive model with the coefficient α thus determined, before the time k−1 (1 ≦ l ≦ m) Calculated by giving data y of the measured value of the longitudinal force. Therefore, the signal of the low frequency component resulting from the traveling of the curved track of the railway vehicle can be reduced from the data y of the measurement values of the longitudinal force without assuming the cutoff frequency in advance.
また、本実施形態では、検査装置800は、データ取得部803で取得された計測データのうち、前後方向力T1~T4を除く計測データと、第1の周波数調整部804で生成された前後方向力T1~T4の高周波成分の時系列データと、をカルマンフィルタに与えて、状態変数(yw1・~yw4・、yw1~yw4、yt1・~yt2・、yt1~yt2、ψt1・~ψt2・、ψt1~ψt2、φt1・~φt2・、φt1~φt2、yb・、yb、ψb・、ψb、φb・、φb、ψy1、ψy2、φa1、φa2)を導出する。次に、検査装置800は、状態変数の推定値の時系列データに含まれる低周波成分の信号強度を低減(好ましくは除去)することにより、状態変数の高周波成分の値を算出する。次に、検査装置800は、台車12a、12bのヨーイング方向における回動量(角変位)ψt1~ψt2の高周波成分の値と、変換変数e1~e4の実績値と、を用いて、輪軸13a~13dのヨーイング方向における回動量(角変位)ψw1~ψw4を導出する。次に、検査装置800は、輪軸13a~13dのヨーイングを記述する運動方程式に、輪軸13a~13dのヨーイング方向における回動量(角変位)ψw1~ψw4と、状態変数の高周波成分の値と、前後方向力T1~T4の高周波成分の値と、を代入して、輪軸13a~13dの位置での通り狂い量yR1~yR4を算出する。そして、検査装置800は、輪軸13a~13dの位置での通り狂い量yR1~yR4から、最終的な通り狂い量yRを算出する。従って、輪軸13a~13dのヨーイングを記述する運動方程式として、輪軸13a~13dの位置での通り狂い量yR1~yR4を変数として含む運動方程式を用いて状態方程式を構成する必要がなくなる。これにより、軌道16のモデルを作成する必要がなくなると共に状態変数の数を減らすことができる。本実施形態では、モデルの自由度を21自由度から17自由度に減らすことができると共に、状態変数の数を38から30に減らすことができる。また、前後方向力T1~T4の分だけ、カルマンフィルタで用いる測定値が増える。
Further, in the present embodiment, the inspection apparatus 800 generates measurement data excluding the longitudinal forces T 1 to T 4 among the measurement data acquired by the data acquisition unit 803 and the measurement data generated by the first frequency adjustment unit 804. and time-series data of the high-frequency component of the longitudinal force T 1 ~ T 4, the giving the Kalman filter, state variables (y w1 · ~ y w4 · , y w1 ~ y w4, y t1 · ~ y t2 ·, y t1 ~ y t2, ψ t1 · ~ ψ t2 ·, ψ t1 ~ ψ t2, φ t1 · ~ φ t2 ·, φ t1 ~ φ t2, y b ·, y b, ψ b ·, ψ b, φ b ·, Derive φ b , y y 1 , y y 2 , φ a1 , φ a2 ). Next, the inspection apparatus 800 calculates the value of the high frequency component of the state variable by reducing (preferably removing) the signal strength of the low frequency component included in the time series data of the estimated value of the state variable. Next, the inspection apparatus 800 uses the values of the high-frequency components of the rotational amounts (angular displacements) ψ t1 to ψ t2 of the carriages 12a and 12b in the yawing direction and the actual values of the conversion variables e 1 to e 4 The rotational amounts (angular displacements) ψ w1 to ψ w4 in the yawing direction of the wheel sets 13a to 13d are derived. Next, the inspection apparatus 800 uses the equation of motion describing the yawing of the wheel sets 13a to 13d, the amount of rotation (angular displacement) ψ w1 to ψ w4 in the yawing direction of the wheel sets 13a to 13 d By substituting the values of the high frequency components of the longitudinal forces T 1 to T 4 , the amounts of deviation y R 1 to y R 4 at the positions of the wheel sets 13 a to 13 d are calculated. Then, the inspection apparatus 800, from the street deviation amount y R1 ~ y R4 in position of the wheel shaft 13a ~ 13d, and calculates the final streets deviation amount y R. Therefore, it is not necessary to construct a state equation using an equation of motion including the amounts of deviation y R1 to y R4 as variables at the positions of the wheel sets 13 a to 13 d as the equation of motion describing the yawing of the wheel sets 13 a to 13 d. This makes it possible to reduce the number of state variables as well as eliminating the need to create a model of the trajectory 16. In this embodiment, the degree of freedom of the model can be reduced from 21 degrees of freedom to 17 degrees of freedom, and the number of state variables can be reduced from 38 to 30. In addition, the measurement value used in the Kalman filter increases by the amount of the longitudinal forces T 1 to T 4 .
一方、前後方向力T1~T4を使用しないで、(5)式~(8)式の輪軸13a~13dのヨーイングを記述する運動方程式を状態方程式に含めると、計算が不安定となり、推定結果が得られない場合がある。即ち、状態変数を選定しないと、計算が不安定となり、推定結果が得られない場合がある。また、仮に推定結果が得られたとしても、本実施形態の方法の方が、状態変数を選定しない方法に比べ、軌道16の不整の検知精度が高くなる。本実施形態では、輪軸13a~13dのヨーイングを記述する運動方程式を状態方程式に含めないことと、前後方向力の測定値を用いることとを実現しているからである。
On the other hand, if equations of motion describing the yawing of the wheel sets 13a to 13d in the equations (5) to (8) are included in the equation of state without using the longitudinal forces T 1 to T 4 , the calculation becomes unstable. Results may not be obtained. That is, if the state variable is not selected, the calculation may become unstable and the estimation result may not be obtained. In addition, even if the estimation result is obtained, the method according to the present embodiment has higher detection accuracy of irregularities of the trajectory 16 than the method in which no state variable is selected. This is because, in the present embodiment, it is realized that the equation of motion that describes the yawing of the wheel sets 13a to 13d is not included in the equation of state, and that the measurement value of the longitudinal force is used.
また、本実施形態では、センサとして歪ゲージを用いることができるので、特別なセンサを必要としない。従って、軌道16の異常(軌道不整)を大きなコストをかけることなく精度よく検知することができる。また、特別なセンサを用いる必要がないので、営業車両に歪ゲージを取り付け、営業車に検査装置800を搭載することにより、営業車両の走行中に、軌道16の不整をリアルタイムで検知することができる。従って、検測車を走行させなくても、軌道16の不整を検知することができる。ただし、検測車に歪ゲージを取り付け、検測車に検査装置800を搭載してもよい。
Further, in the present embodiment, since a strain gauge can be used as a sensor, no special sensor is required. Therefore, it is possible to detect an abnormality (trajectory irregularity) of the track 16 with high accuracy without increasing the cost. In addition, since it is not necessary to use a special sensor, a strain gauge may be attached to the sales vehicle and the inspection device 800 may be mounted on the sales vehicle to detect irregularities in the track 16 in real time while the sales vehicle is traveling. it can. Therefore, even if the inspection vehicle does not travel, irregularities in the track 16 can be detected. However, a strain gauge may be attached to the inspection vehicle, and the inspection device 800 may be mounted on the inspection vehicle.
<変形例>
本実施形態では、修正自己回帰モデルを用いる場合を例に挙げて説明した。しかしながら、必ずしも、修正自己回帰モデルを用いて、前後方向力測定値のデータyから、鉄道車両の曲線軌道の走行に起因する低周波成分の信号を低減する必要はない。例えば、鉄道車両の曲線軌道の走行に起因する周波数帯を特定することができる場合には、ハイパスフィルタを用いて、前後方向力の測定値のデータyから、鉄道車両の曲線軌道の走行に起因する低周波成分の信号を低減してもよい。 <Modification>
In the present embodiment, the case of using the modified autoregressive model has been described as an example. However, it is not always necessary to reduce the low frequency component signal caused by the traveling of the curved track of the railway vehicle from the data y of the longitudinal force measurement value using the modified autoregressive model. For example, when it is possible to specify a frequency band resulting from the traveling of the curved track of the rail vehicle, it is derived from the traveling of the curved track of the railway vehicle from data y of measured values of longitudinal force using a high pass filter. Low frequency components may be reduced.
また、本実施形態では、位相を合わせる際の基準となる輪軸が輪軸13aである場合を例に挙げて説明した。しかしながら、基準となる輪軸は、輪軸13a以外の輪軸13b、13c、または13dでもよい。
Further, in the present embodiment, the case where the wheelset serving as a reference at the time of phase alignment is the wheelset 13a has been described as an example. However, the wheelset serving as a reference may be a wheelset 13b, 13c or 13d other than the wheelset 13a.
本実施形態では、カルマンフィルタを用いる場合を例に挙げて説明した。しかしながら、観測変数の測定値と推定値との誤差が最小または当該誤差の期待値が最小になるように状態変数の推定値を導出するフィルタ(即ち、データ同化を行うフィルタ)を用いていれば、必ずしもカルマンフィルタを用いる必要はない。例えば、粒子フィルタを用いてもよい。尚、観測変数の測定値と推定値との誤差としては、例えば、観測変数の測定値と推定値との二乗誤差が挙げられる。
In the present embodiment, the case of using a Kalman filter has been described as an example. However, if a filter (that is, a filter that performs data assimilation) is used that derives the estimated value of the state variable so that the error between the measured value and the estimated value of the observed variable is minimized or the expected value of the error is minimized. It is not necessary to use a Kalman filter. For example, a particle filter may be used. The error between the measured value of the observed variable and the estimated value may be, for example, the squared error between the measured value of the observed variable and the estimated value.
また、本実施形態では、通り狂い量を導出する場合を例に挙げて説明した。しかしながら、軌道16の状態を反映する情報として、軌道不整(軌道16の外観上の不良)を反映する情報を導出していれば、必ずしも通り狂い量を導出する必要はない。例えば、通り狂い量に加えてまたは代えて以下の(64)式~(67)式の計算を行うことにより、鉄道車両が直線軌道を走行しているときに生じる横圧(車輪とレールとの間における左右方向の応力)を導出してもよい。ただし、Q1、Q2、Q3、Q4はそれぞれ、車輪14a、14b、14c、14dにおける横圧である。f3はスピンクリープ係数を表す。
Further, in the present embodiment, the case where the amount of deviation is derived is described as an example. However, if the information reflecting the track irregularity (defect on the appearance of the track 16) is derived as the information reflecting the state of the track 16, it is not necessary to derive the deviation amount as it is. For example, by performing calculations of the following equations (64) to (67) in addition to or instead of the amount of deviation, the lateral pressure (wheel and rail The stress in the left-right direction in between may be derived. However, Q 1 , Q 2 , Q 3 and Q 4 are lateral pressures at the wheels 14 a, 14 b, 14 c and 14 d respectively. f 3 represents a spin creep coefficient.
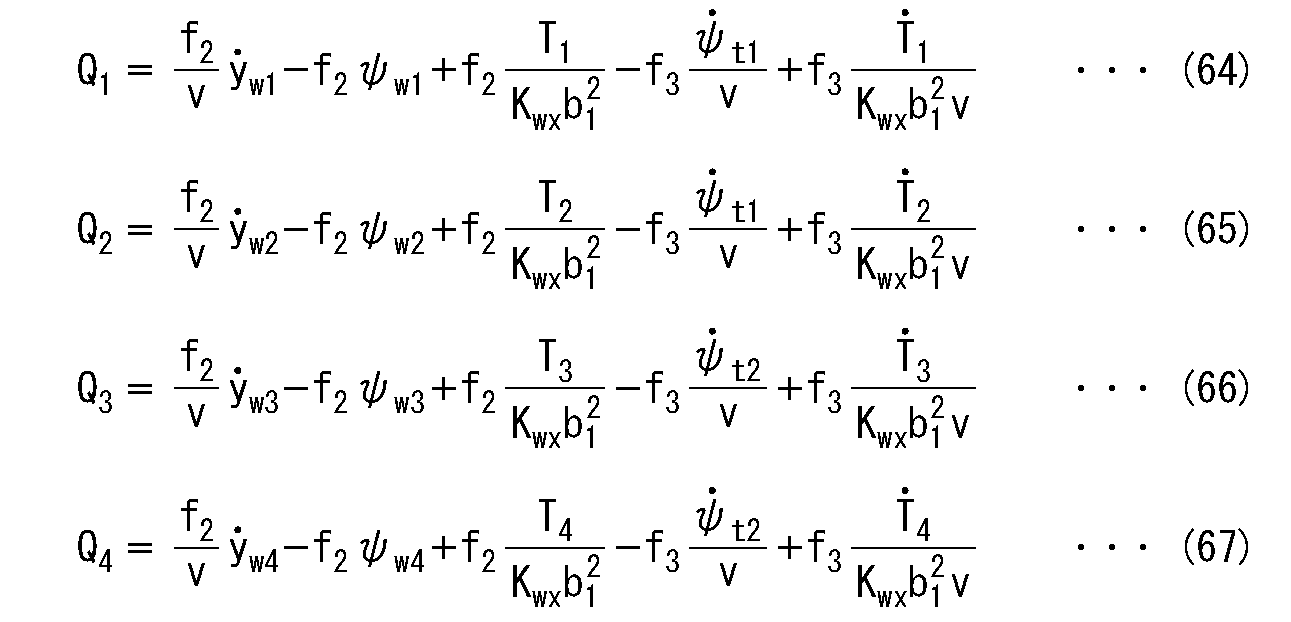
また、本実施形態では、車体11の状態を表す状態変数を含める場合を例に挙げて説明した。しかしながら、車体11は、車輪14a~14dと軌道16との間の作用力(クリープ力)による振動の伝搬が最後に伝わる部分である。従って、例えば、車体11においてその伝搬による影響が小さいと判断される場合には、車体11の状態を表す状態変数を含めなくてもよい。このようにする場合、(1)式~(21)式の運動方程式のうち、(15)式~(17)式の車体11の横振動、ヨーイング、ローリングを記述する運動方程式と、(18)式、(19)式の台車12aに配置されたヨーダンパ、台車12bに配置されたヨーダンパのヨーイングを記述する運動方程式は不要になる。また、(1)式~(21)式の運動方程式において、車体に関する状態量(添え字bを含む状態量)と、車体に関する状態量(添え字bを含む状態量)を含む{}内の値(例えば(21)式の左辺第3項の{φa2-φb})を0(ゼロ)にする。
Further, in the present embodiment, the case where the state variable indicating the state of the vehicle body 11 is included is described as an example. However, the vehicle body 11 is a portion to which the propagation of the vibration due to the action force (creep force) between the wheels 14a to 14d and the track 16 is finally transmitted. Therefore, for example, when it is determined that the influence of the propagation is small in the vehicle body 11, it is not necessary to include the state variable indicating the state of the vehicle body 11. In this case, among the equations of motion of the equations (1) to (21), equations of motion describing the lateral vibration, yawing, and rolling of the vehicle body 11 of the equations (15) to (17); Equations (19): The yaw damper disposed on the carriage 12a and the equation of motion describing the yawing of the yaw damper disposed on the carriage 12b become unnecessary. Further, in the equations of motion of the equations (1) to (21), the state quantities related to the vehicle body (state quantities including the subscript b) and the state quantities related to the vehicle body (state quantities including the subscript b) A value (eg, {φ a2 −φ b } of the third term on the left side of the equation (21)) is set to 0 (zero).
また、本実施形態では、台車12a、12bがボルスタレス台車である場合を例に挙げて説明した。しかしながら、台車12a、12bは、ボルスタレス台車に限定されない。この他、鉄道車両の構成要素、鉄道車両が受ける力、および鉄道車両の運動の方向等に応じて、運動方程式は、適宜書き換えられる。即ち、運動方程式は、本実施形態で例示したものに限定されない。
Further, in the present embodiment, the case where the bogies 12a and 12b are bolsterless bogies is described as an example. However, the bogies 12a and 12b are not limited to bolsterless bogies. In addition, the equation of motion can be rewritten as appropriate according to the components of the railway vehicle, the force received by the railway vehicle, the direction of movement of the railway vehicle, and the like. That is, the equation of motion is not limited to that exemplified in the present embodiment.
(第2の実施形態)
次に、第2の実施形態を説明する。以下の説明では、第1の実施形態の手法で算出される最終的な通り狂い量yRを、必要に応じて通り狂い量yRの推定値と称し、実際に測定した通り狂い量yRを、必要に応じて通り狂い量yRの測定値と称する。 Second Embodiment
Next, a second embodiment will be described. In the following description, the final street deviation amount y R which is calculated by the method of the first embodiment, referred to as the estimated value of the street deviation amount y R if necessary, actually measured as deviation amount y R Is referred to as a measurement of the amount of deviation y R as required.
図15に示す通り狂い量yRの推定値の時系列データを算出する際に用いた計測データは、実際に測定したデータではなく、鉄道車両の振動を模擬した模擬データである。そこで、本発明者らは、実際に測定した計測データを用いて、通り狂い量yRの推定値と測定値との乖離がないかどうかを確認した。
As shown in FIG. 15, measurement data used when calculating time-series data of the estimated value of the deviation amount y R is not data actually measured but simulation data that simulates the vibration of a railway vehicle. Therefore, the present inventors confirmed whether there is a difference between the estimated value of the deviation amount y R and the measured value, using the actually measured data.
その結果、本発明者らは、曲線軌道におけるレールの継目の個所において、通り狂い量yRの推定値と測定値とに大きな乖離が生じるという知見を得た。ここで、大きな乖離とは、通り狂い量yRの推定値の時間波形と測定値の時間波形とが反転した形になることを指す。例えば、通り狂い量yRの推定値の時間波形が上に凸となる時間領域で、通り狂い量yRの測定値の時間波形が下に凸となる場合に大きな乖離があることとする。鉄道車両が直線軌道におけるレールの継目を通過する際の前後方向力T1~T4に含まれる左右方向の成分は小さいと考えられる。これに対し、鉄道車両が曲線軌道におけるレールの継目を通過する際には、前後方向力T1~T4に含まれる左右方向の成分が大きくなると考えられる。本発明者らは、このことから、曲線軌道におけるレールの継目の個所において、通り狂い量yRの推定値と測定値とに大きな乖離が生じると考えた。そこで、本実施形態では、曲線軌道におけるレールの継目の個所を含む領域に対応する前後方向力T1~T4の測定値の時系列データを補正することにより、通り狂い量yRの推定値と測定値とに大きな乖離が生じることを抑制する。このように本実施形態は、第1の実施形態に対し、通り狂い量yRの推定値を補正する処理が加わるものである。従って、本実施形態の説明において、第1の実施形態と同一の部分については、図1~図16に付した符号と同一の符号を付す等して詳細な説明を省略する。
As a result, the present inventors have found that a large deviation occurs between the estimated value and the measured value of the deviation amount y R at the seam of the rail in the curved track. Here, the large deviation indicates that the time waveform of the estimated value of the amount of deviation y R and the time waveform of the measurement value are inverted. For example, in the time domain in which the time waveform of the estimated value of the deviation amount y R is upwardly convex, it is assumed that there is a large deviation when the time waveform of the measurement value of the deviation amount y R is downwardly convex. It is considered that the components in the lateral direction included in the longitudinal forces T 1 to T 4 when the railcar passes the joint of the rails in the straight track are small. On the other hand, when the railcar passes the seams of the rails in the curved track, it is considered that the components in the lateral direction included in the longitudinal forces T 1 to T 4 become large. From this, the present inventors considered that a large deviation occurs between the estimated value and the measured value of the deviation amount y R at the seam of the rail in the curved track. Therefore, in the present embodiment, the estimated value of the deviation amount y R is corrected by correcting the time-series data of the measured values of the longitudinal forces T 1 to T 4 corresponding to the area including the seam portion of the rail in the curved track. Control the occurrence of large deviations between As described above, in the present embodiment, processing for correcting the estimated value of the deviation amount y R is added to the first embodiment. Accordingly, in the description of the present embodiment, the same parts as those of the first embodiment are denoted by the same reference numerals as those of FIGS. 1 to 16, and the detailed description will be omitted.
<検査装置1700>
図17は、検査装置1700の機能的な構成の一例を示す図である。図18は、検査装置1700における事前処理の一例を示すフローチャートである。図19は、検査装置1700における本処理の一例を示すフローチャートである。本実施形態でも、第1の実施形態と同様に、検査装置1700が、鉄道車両に搭載される場合を例に挙げて示す。 <Inspection apparatus 1700>
FIG. 17 is a diagram showing an example of a functional configuration of theinspection apparatus 1700. As shown in FIG. FIG. 18 is a flowchart showing an example of pre-processing in the inspection apparatus 1700. FIG. 19 is a flowchart showing an example of this process in the inspection apparatus 1700. Also in the present embodiment, as in the first embodiment, the case where the inspection device 1700 is mounted on a railway vehicle will be described as an example.
図17は、検査装置1700の機能的な構成の一例を示す図である。図18は、検査装置1700における事前処理の一例を示すフローチャートである。図19は、検査装置1700における本処理の一例を示すフローチャートである。本実施形態でも、第1の実施形態と同様に、検査装置1700が、鉄道車両に搭載される場合を例に挙げて示す。 <
FIG. 17 is a diagram showing an example of a functional configuration of the
図17において、検査装置1700は、その機能として、状態方程式記憶部801、観測方程式記憶部802、軌道データ記憶部1701、データ取得部803、第1の周波数調整部804、継目判定部1702、補正部1703、フィルタ演算部805、第2の周波数調整部806、軌道状態算出部807、および出力部808を有する。検査装置1700のハードウェアの構成は、例えば、図9に示すもので実現することができる。
In FIG. 17, the inspection apparatus 1700 has, as its functions, a state equation storage unit 801, an observation equation storage unit 802, a trajectory data storage unit 1701, a data acquisition unit 803, a first frequency adjustment unit 804, a seam determination unit 1702, correction. It has a unit 1703, a filter operation unit 805, a second frequency adjustment unit 806, a trajectory state calculation unit 807, and an output unit 808. The hardware configuration of the inspection apparatus 1700 can be realized, for example, by the one shown in FIG.
[軌道データ記憶部1701、S1801]
軌道データ記憶部1701は、軌道データを記憶する。軌道データは、鉄道車両が走行する軌道の位置と当該位置におけるレールの曲率1/Rとの関係を示すデータを含む。曲率1/Rが0(ゼロ)である位置は直線軌道である。曲率1/Rが0(ゼロ)でない位置は曲線軌道である。このようなデータとして、例えば、鉄道会社が路線ごとに管理しているデータを用いることができる。 [Orbitdata storage unit 1701, S1801]
The trajectorydata storage unit 1701 stores trajectory data. The track data includes data indicating the relationship between the position of the track on which the railcar travels and the curvature 1 / R of the rail at the position. The position where the curvature 1 / R is 0 (zero) is a linear trajectory. The position where the curvature 1 / R is not 0 (zero) is a curved trajectory. As such data, for example, data managed by a railway company for each route can be used.
軌道データ記憶部1701は、軌道データを記憶する。軌道データは、鉄道車両が走行する軌道の位置と当該位置におけるレールの曲率1/Rとの関係を示すデータを含む。曲率1/Rが0(ゼロ)である位置は直線軌道である。曲率1/Rが0(ゼロ)でない位置は曲線軌道である。このようなデータとして、例えば、鉄道会社が路線ごとに管理しているデータを用いることができる。 [Orbit
The trajectory
鉄道車両の位置が、始発駅からの距離で表される場合、鉄道車両の現在の走行位置は、鉄道車両の速度と走行時間とから走行距離を求めることにより得られる。鉄道車両の現在の走行位置を求める方法は、このような方法に限定されない。例えば、データ取得部803が、GPS受信機を有していてもよい。この場合、GPS受信機が、鉄道車両の現在の走行位置を取得する。
When the position of the railcar is represented by the distance from the starting station, the current traveling position of the railcar can be obtained by determining the traveling distance from the speed of the railcar and the traveling time. The method of determining the current travel position of the railway vehicle is not limited to such a method. For example, the data acquisition unit 803 may have a GPS receiver. In this case, the GPS receiver acquires the current travel position of the railway vehicle.
[継目判定部1702、S1901]
継目判定部1702は、鉄道車両が曲線軌道におけるレールの継目を含む区間を通過したか否かを判定する。以下の説明では、この領域を必要に応じて継目区間と称する。本実施形態では、継目判定部1702は、以下のようにして継目区間を算出する。まず、継目判定部1702は、輪軸13b~13dの左右方向における加速度yw2・・~yw4・・の位相を、輪軸13aの左右方向における加速度yw1・・に合わせる。即ち、継目判定部1702は、輪軸13aと輪軸13b~13dとの前後方向の距離と、鉄道車両の速度とから、或る位置を輪軸13aが通過する時刻に対する、当該位置を輪軸13b~13dが通過する時刻の遅れ時間を算出する。継目判定部1702は、輪軸13b~13dの左右方向における加速度yw2・・~yw4・・の時系列データに対して、この遅れ時間だけ位相をずらす。継目判定部1702は、位相を合わせた輪軸13a~13dの左右方向における加速度yw1・・~yw4・・の算出平均値yw・・を算出する。継目判定部1702は、この輪軸13a~13dの左右方向における加速度yw1・・~yw4・・の算術平均値yw・・の絶対値が閾値を上回る時刻を、鉄道車両の輪軸13aが曲線軌道におけるレールの継目を通過した時刻とする。閾値は、予め定められる。鉄道車両が曲線軌道におけるレールの継目を通過するときの、輪軸13a~13dの左右方向における加速度yw1・・~yw4・・を調査し、その調査の結果から、鉄道車両が曲線軌道におけるレールの継目を通過したと判定することができる値を閾値として採用する。例えば、3(m/s2)~6(m/s2)の値が閾値として定められる。継目判定部1702は、鉄道車両の輪軸13aが曲線軌道におけるレールの継目を通過した時刻の前後t(秒)の間に鉄道車両の輪軸13aが通過する区間を継目区間とする。tは、予め定められる時刻であり、例えば0.2(秒)未満の値がtの値として定められる。 [Seam determination unit 1702, S1901]
Theseam determination unit 1702 determines whether the railway vehicle has passed a section including a seam of a rail in a curved track. In the following description, this area is referred to as a seam section as needed. In the present embodiment, the seam determination unit 1702 calculates a seam interval as follows. First, the joint judging unit 1702 aligns the phases of the accelerations y w2 ... Y w4 ... In the left and right direction of the wheel sets 13 b to 13 d with the acceleration y w1 . That is, from the distance between the wheel 13a and the wheels 13b to 13d in the front-rear direction and the speed of the railway vehicle, the joint judging unit 1702 determines the wheel 13b to 13d for the time when the wheel 13a passes a certain position. Calculate the delay time of the passing time. Seam determination unit 1702, to the acceleration y w2 ·· ~ y w4 ·· time series data in the lateral direction of the wheel shaft 13b ~ 13d, shifting the phase by the delay time. Seam determination unit 1702 calculates an acceleration y w1 ·· ~ y w4 ·· calculated average value y w · · of the lateral direction of the combined phase wheelset 13a ~ 13d. The joint judgment unit 1702 sets the wheel axis 13a of the rail car to a time when the absolute value of the arithmetic mean value y w of the accelerations y w1 to y w4 in the left-right direction of the wheel sets 13a to 13 d exceeds the threshold. It is the time when the rail joint in the track is passed. The threshold is predetermined. The acceleration y w1 ... y w4 ... in the lateral direction of the wheel sets 13a to 13 d when the rail vehicle passes the joint of the rail in the curved track is investigated, and the result of the investigation shows that the rail vehicle in the curved track A value that can be determined to have passed the seam of is adopted as the threshold. For example, values of 3 (m / s 2 ) to 6 (m / s 2 ) are set as the threshold. The joint determination unit 1702 sets a section in which the wheel shaft 13a of the rail vehicle passes between t (seconds) before and after the time when the wheel shaft 13a of the rail vehicle passes the seam of the rail in the curved track as a seam section. t is a predetermined time, and for example, a value less than 0.2 (seconds) is determined as the value of t.
継目判定部1702は、鉄道車両が曲線軌道におけるレールの継目を含む区間を通過したか否かを判定する。以下の説明では、この領域を必要に応じて継目区間と称する。本実施形態では、継目判定部1702は、以下のようにして継目区間を算出する。まず、継目判定部1702は、輪軸13b~13dの左右方向における加速度yw2・・~yw4・・の位相を、輪軸13aの左右方向における加速度yw1・・に合わせる。即ち、継目判定部1702は、輪軸13aと輪軸13b~13dとの前後方向の距離と、鉄道車両の速度とから、或る位置を輪軸13aが通過する時刻に対する、当該位置を輪軸13b~13dが通過する時刻の遅れ時間を算出する。継目判定部1702は、輪軸13b~13dの左右方向における加速度yw2・・~yw4・・の時系列データに対して、この遅れ時間だけ位相をずらす。継目判定部1702は、位相を合わせた輪軸13a~13dの左右方向における加速度yw1・・~yw4・・の算出平均値yw・・を算出する。継目判定部1702は、この輪軸13a~13dの左右方向における加速度yw1・・~yw4・・の算術平均値yw・・の絶対値が閾値を上回る時刻を、鉄道車両の輪軸13aが曲線軌道におけるレールの継目を通過した時刻とする。閾値は、予め定められる。鉄道車両が曲線軌道におけるレールの継目を通過するときの、輪軸13a~13dの左右方向における加速度yw1・・~yw4・・を調査し、その調査の結果から、鉄道車両が曲線軌道におけるレールの継目を通過したと判定することができる値を閾値として採用する。例えば、3(m/s2)~6(m/s2)の値が閾値として定められる。継目判定部1702は、鉄道車両の輪軸13aが曲線軌道におけるレールの継目を通過した時刻の前後t(秒)の間に鉄道車両の輪軸13aが通過する区間を継目区間とする。tは、予め定められる時刻であり、例えば0.2(秒)未満の値がtの値として定められる。 [
The
[補正部1703、S1902]
補正部1703は、継目判定部1702により、鉄道車両の輪軸13aが継目区間を通過したと判定されると起動する。本実施形態では、補正部1703は、鉄道車両の輪軸13aが当該継目区間を通過した時間に対応する時刻における前後方向力T1~T4の高周波成分の値を補正する。 [Correction unit 1703, S1902]
Thecorrection unit 1703 is activated when it is determined by the seam determination unit 1702 that the wheelset 13a of the railway vehicle has passed the seam section. In the present embodiment, the correction unit 1703 corrects the values of the high frequency components of the longitudinal forces T 1 to T 4 at the time corresponding to the time when the wheelset 13 a of the railcar passes the joint section.
補正部1703は、継目判定部1702により、鉄道車両の輪軸13aが継目区間を通過したと判定されると起動する。本実施形態では、補正部1703は、鉄道車両の輪軸13aが当該継目区間を通過した時間に対応する時刻における前後方向力T1~T4の高周波成分の値を補正する。 [
The
例えば、補正部1703は、鉄道車両の輪軸13aが継目区間を通過した時間の始期に対応する時刻における前後方向力T1の高周波成分の値と、鉄道車両の輪軸13aが当該継目区間を通過した時間の終期に対応する時刻における前後方向力T1の高周波成分の値とを線形補間する。即ち、補正部1703は、これらの値を直線で結ぶ。
For example, the correction unit 1703, the value of the high-frequency component of the longitudinal force T 1 at time of wheel sets 13a railcar corresponds to the beginning of the time which has passed through the seam section axle 13a of the rail vehicle has passed the seam section linearly interpolating a value of the high-frequency component of the longitudinal force T 1 at time corresponding to the end time. That is, the correction unit 1703 connects these values by a straight line.
補正部1703は、前後方向力T2~T4の高周波成分の時系列データの位相を、前後方向力T1の時系列データの位相に合わせる。即ち、補正部1703は、輪軸13aと輪軸13b~13dとの前後方向の距離と、鉄道車両の速度とから、或る位置を輪軸13aが通過する時刻に対する、当該位置を輪軸13b~13dが通過する時刻の遅れ時間を算出する。補正部1703は、前後方向力T2~T4の高周波成分の時系列データに対して、この遅れ時間だけ位相をずらす。
The correction unit 1703 aligns the phase of the time-series data of the high frequency components of the longitudinal forces T 2 to T 4 with the phase of the time-series data of the longitudinal force T 1 . That is, from the distance between the wheelset 13a and the wheelset 13b to 13d in the front-rear direction and the speed of the railway vehicle, the correction unit 1703 passes the wheelset 13b to 13d for the time when the wheelset 13a passes a certain position. Calculate the delay time of the time to The correction unit 1703 shifts the phase of the time series data of the high frequency components of the longitudinal forces T 2 to T 4 by this delay time.
補正部1703は、このようにして位相をずらした前後方向力T2~T4の高周波成分の時系列データにおいて、鉄道車両の輪軸13aが継目区間を通過した時間に対応する時刻における前後方向力T2~T4の高周波成分の値と、鉄道車両の輪軸13aが当該継目区間を通過した時間の終期に対応する時刻における前後方向力T2~T4の高周波成分の値とをそれぞれ線形補間する。
尚、補正部1703による補正の方法は、線形補間に限定されない。例えば、補正部1703は、スプライン補間を行ってもよい。 In the time-series data of the high-frequency components of the longitudinal force T 2 to T 4 whose phases are shifted in this way, thecorrection unit 1703 performs the longitudinal force at the time corresponding to the time when the wheel shaft 13 a of the railway vehicle passes the seam section. the value of the high-frequency component of T 2 ~ T 4, respectively linear interpolation wheel shaft 13a of the railway vehicle and the value of the high-frequency component of the longitudinal force T 2 ~ T 4 at the time corresponding to the end of the time which has passed through the seam section Do.
Note that the correction method by thecorrection unit 1703 is not limited to linear interpolation. For example, the correction unit 1703 may perform spline interpolation.
尚、補正部1703による補正の方法は、線形補間に限定されない。例えば、補正部1703は、スプライン補間を行ってもよい。 In the time-series data of the high-frequency components of the longitudinal force T 2 to T 4 whose phases are shifted in this way, the
Note that the correction method by the
(まとめ)
以上のように本実施形態では、検出装置1800は、鉄道車両の輪軸13aが継目区間を通過した時間に対応する時刻における前後方向力T1~T4の高周波成分の値を補正する。従って、最終的な通り狂い量yRの推定値の精度を更に向上させることができる。 (Summary)
As described above, in the present embodiment, the detection device 1800 corrects the values of the high frequency components of the longitudinal forces T 1 to T 4 at the time corresponding to the time when thewheelset 13 a of the railcar passes the joint section. Therefore, the accuracy of the final estimated value of the deviation amount y R can be further improved.
以上のように本実施形態では、検出装置1800は、鉄道車両の輪軸13aが継目区間を通過した時間に対応する時刻における前後方向力T1~T4の高周波成分の値を補正する。従って、最終的な通り狂い量yRの推定値の精度を更に向上させることができる。 (Summary)
As described above, in the present embodiment, the detection device 1800 corrects the values of the high frequency components of the longitudinal forces T 1 to T 4 at the time corresponding to the time when the
<変形例>
本実施形態では、継目区間を曲線軌道に対してのみ設定する場合を例に挙げて説明した。しかしながら、曲線軌道に加えて直線軌道に対しても継目区間を設定してもよい。 <Modification>
In the present embodiment, the case where the seam section is set only for the curved track has been described as an example. However, in addition to the curved trajectory, the seam section may be set for the linear trajectory.
また、本実施形態では、前後方向力T1~T4の高周波成分の値を補正する場合を例に挙げて説明した。しかしながら、データ取得部803により取得された前後方向力T1~T4の測定値を、本実施形態で説明したようにして補正してもよい。このようにする場合、第1の周波数調整部804は、補正後の前後方向力T1~T4の測定値の時系列データに含まれる低周波成分の信号強度を低減する。
Further, in the present embodiment, the case of correcting the values of the high frequency components of the longitudinal forces T 1 to T 4 has been described as an example. However, the measurement values of the longitudinal forces T 1 to T 4 acquired by the data acquisition unit 803 may be corrected as described in the present embodiment. In this case, the first frequency adjustment unit 804 reduces the signal strength of the low frequency component included in the time series data of the measured values of the longitudinal forces T 1 to T 4 after the correction.
また、本実施形態では、輪軸13a~13dの左右方向における加速度yw1・・~yw4・・を用いて、鉄道車両の輪軸13aが継目区間を通過したか否かを判定する場合を例に挙げて説明した。しかしながら、鉄道車両の振動を表すデータであれば、必ずしも輪軸13a~13dの左右方向における加速度yw1・・~yw4・・を用いる必要はない。例えば、台車12a、12bの左右方向における加速度yt1・・、yt2・・を用いてもよい。また、輪軸13a~13dまたは台車12a、12bの上下方向における加速度を用いてもよい。このようにする場合、データ取得部803は、輪軸13a~13dまたは台車12a、12bの上下方向における加速度の測定値を計測データとして取得する。
その他、本実施形態においても、第1の実施形態で説明した種々の変形例を採用することができる。 Further, in the present embodiment, by using the acceleration y w1 ·· ~ y w4 ·· in the lateral direction of thewheel shaft 13a ~ 13d, an example in which axle 13a of the rail vehicle to determine whether passing through the seam section I mentioned and explained. However, the acceleration y w1 ... Y w4 ... In the lateral direction of the wheel sets 13a to 13 d does not necessarily have to be used as long as it is data representing the vibration of a railway vehicle. For example, carriage 12a, the acceleration y t1 · · in the lateral direction of 12b, may be used y t2 · ·. Further, the acceleration in the vertical direction of the wheel sets 13a to 13d or the carriages 12a and 12b may be used. In this case, the data acquisition unit 803 acquires measurement values of acceleration in the vertical direction of the wheel sets 13a to 13d or the carriages 12a and 12b as measurement data.
In addition, also in the present embodiment, various modified examples described in the first embodiment can be adopted.
その他、本実施形態においても、第1の実施形態で説明した種々の変形例を採用することができる。 Further, in the present embodiment, by using the acceleration y w1 ·· ~ y w4 ·· in the lateral direction of the
In addition, also in the present embodiment, various modified examples described in the first embodiment can be adopted.
(第3の実施形態)
次に、第3の実施形態を説明する。
第1の実施形態では、鉄道車両に搭載した検査装置800が最終的な通り狂い量yRを算出する場合を例に挙げて説明した。これに対し、本実施形態では、検査装置800の一部の機能が実装されたデータ処理装置が、指令所に配置される。このデータ処理装置は、鉄道車両から送信される計測データを受信し、受信した計測データを用いて最終的な通り狂い量yRを算出する。このように、本実施形態では、第1の実施形態の検査装置800が有する機能を、鉄道車両と指令所とで分担して実行する。本実施形態と第1の実施形態とは、このことによる構成および処理が主として異なる。従って、本実施形態の説明において、第1の実施形態と同一の部分については、図1~図16に付した符号と同一の符号を付す等して詳細な説明を省略する。 Third Embodiment
Next, a third embodiment will be described.
In the first embodiment, the case where theinspection apparatus 800 mounted on a railway vehicle calculates the final amount of deviation y R has been described as an example. On the other hand, in the present embodiment, a data processing device in which a part of the functions of the inspection device 800 is implemented is disposed at the command center. The data processing apparatus receives the measurement data transmitted from the railway vehicle, and calculates the final streets deviation amount y R by using the measurement data received. As described above, in the present embodiment, the functions possessed by the inspection device 800 of the first embodiment are shared and executed between the railway vehicle and the command center. The present embodiment and the first embodiment mainly differ in the configuration and processing based on this. Accordingly, in the description of the present embodiment, the same parts as those of the first embodiment are denoted by the same reference numerals as those of FIGS. 1 to 16, and the detailed description will be omitted.
次に、第3の実施形態を説明する。
第1の実施形態では、鉄道車両に搭載した検査装置800が最終的な通り狂い量yRを算出する場合を例に挙げて説明した。これに対し、本実施形態では、検査装置800の一部の機能が実装されたデータ処理装置が、指令所に配置される。このデータ処理装置は、鉄道車両から送信される計測データを受信し、受信した計測データを用いて最終的な通り狂い量yRを算出する。このように、本実施形態では、第1の実施形態の検査装置800が有する機能を、鉄道車両と指令所とで分担して実行する。本実施形態と第1の実施形態とは、このことによる構成および処理が主として異なる。従って、本実施形態の説明において、第1の実施形態と同一の部分については、図1~図16に付した符号と同一の符号を付す等して詳細な説明を省略する。 Third Embodiment
Next, a third embodiment will be described.
In the first embodiment, the case where the
図20は、検査システムの構成の一例を示す図である。図20において、検査システムは、データ収集装置2010a、2010bと、データ処理装置2020とを有する。図20には、データ収集装置2010a、2010bおよびデータ処理装置2020の機能的な構成の一例も示す。尚、データ収集装置2010a、2010bおよびデータ処理装置2020のハードウェアは、例えば、図9に示すもので実現することができる。従って、データ収集装置2010a、2010bおよびデータ処理装置2020のハードウェアの構成の詳細な説明を省略する。
FIG. 20 is a diagram showing an example of the configuration of the inspection system. In FIG. 20, the inspection system includes data collection devices 2010a and 2010b and a data processing device 2020. FIG. 20 also shows an example of the functional configuration of the data collection devices 2010a and 2010b and the data processing device 2020. The hardware of the data collection devices 2010a and 2010b and the data processing device 2020 can be realized, for example, by the one shown in FIG. Therefore, the detailed description of the hardware configuration of the data collection devices 2010a and 2010b and the data processing device 2020 is omitted.
鉄道車両のそれぞれには、データ収集装置2010a、2010bが1つずつ搭載される。データ処理装置2020は、指令所に配置される。指令所は、例えば、複数の鉄道車両の運行を集中管理する。
One data collection device 2010a, one 2010b is mounted on each of the railway vehicles. The data processing device 2020 is disposed at the command center. The command center centrally manages, for example, the operation of a plurality of rail vehicles.
<データ収集装置2010a、2010b>
データ収集装置2010a、2010bは、同じもので実現することができる。データ収集装置2010a、2010bは、データ取得部2011a、2011bと、データ送信部2012a、2012bとを有する。 < Data acquisition devices 2010a, 2010b>
The data collection devices 2010a, 2010b can be realized with the same. The data collection devices 2010a and 2010b include data acquisition units 2011a and 2011b, and data transmission units 2012a and 2012b.
データ収集装置2010a、2010bは、同じもので実現することができる。データ収集装置2010a、2010bは、データ取得部2011a、2011bと、データ送信部2012a、2012bとを有する。 <
The
[データ取得部2011a、2011b]
データ取得部2011a、2011bは、データ取得部803と同じ機能を有する。即ち、データ取得部2011a、2011bは、データ取得部803で取得する計測データと同じ計測データを取得する。具体的にデータ取得部2011a、2011bは、計測データとして、車体11の左右方向における加速度の測定値、台車12a、12bの左右方向における加速度の測定値、輪軸13a~13dの左右方向における加速度の測定値、および前後方向力の測定値を取得する。これらの測定値を得るための歪ゲージおよび演算装置は、第1の実施形態で説明したものと同じである。 [Data acquisition unit 2011a, 2011b]
Thedata acquisition units 2011 a and 2011 b have the same function as the data acquisition unit 803. That is, the data acquisition units 2011 a and 2011 b acquire the same measurement data as the measurement data acquired by the data acquisition unit 803. Specifically, the data acquisition units 2011a and 2011b measure the measured values of acceleration in the left-right direction of the vehicle body 11, measured values of the acceleration in the left-right direction of the carts 12a and 12b, and measure the acceleration in the left-right direction of the wheel axles 13a to 13d as measurement data. Obtain values and measurements of the fore-aft force. The strain gauges and arithmetic unit for obtaining these measurement values are the same as those described in the first embodiment.
データ取得部2011a、2011bは、データ取得部803と同じ機能を有する。即ち、データ取得部2011a、2011bは、データ取得部803で取得する計測データと同じ計測データを取得する。具体的にデータ取得部2011a、2011bは、計測データとして、車体11の左右方向における加速度の測定値、台車12a、12bの左右方向における加速度の測定値、輪軸13a~13dの左右方向における加速度の測定値、および前後方向力の測定値を取得する。これらの測定値を得るための歪ゲージおよび演算装置は、第1の実施形態で説明したものと同じである。 [
The
[データ送信部2012a、2012b]
データ送信部2012a、2012bは、データ取得部2011a、2011bで取得された計測データを、データ処理装置2020に送信する。本実施形態では、データ送信部2012a、2012bは、データ取得部2011a、2011bで取得された計測データを、無線通信により、データ処理装置2020に送信する。このとき、データ送信部2012a、2012bは、データ収集装置2010a、2010bが搭載されている鉄道車両の識別番号を、データ取得部2011a、2011bで取得された計測データに付加する。このようにデータ送信部2012a、2012bは、鉄道車両の識別番号が付加された計測データを送信する。 [ Data Transmission Unit 2012a, 2012b]
The data transmission units 2012a and 2012b transmit the measurement data acquired by the data acquisition units 2011a and 2011b to the data processing device 2020. In the present embodiment, the data transmission units 2012a and 2012b transmit the measurement data acquired by the data acquisition units 2011a and 2011b to the data processing apparatus 2020 by wireless communication. At this time, the data transmission units 2012a and 2012b add the identification numbers of the railway vehicles on which the data collection devices 2010a and 2010b are mounted to the measurement data acquired by the data acquisition units 2011a and 2011b. As described above, the data transmission units 2012a and 2012b transmit the measurement data to which the identification number of the railway vehicle is added.
データ送信部2012a、2012bは、データ取得部2011a、2011bで取得された計測データを、データ処理装置2020に送信する。本実施形態では、データ送信部2012a、2012bは、データ取得部2011a、2011bで取得された計測データを、無線通信により、データ処理装置2020に送信する。このとき、データ送信部2012a、2012bは、データ収集装置2010a、2010bが搭載されている鉄道車両の識別番号を、データ取得部2011a、2011bで取得された計測データに付加する。このようにデータ送信部2012a、2012bは、鉄道車両の識別番号が付加された計測データを送信する。 [
The
<データ処理装置2020>
[データ受信部2021]
データ受信部2021は、データ送信部2012a、2012bにより送信された計測データを受信する。この計測データには、当該計測データの送信元である鉄道車両の識別番号が付加されている。 <Data processor 2020>
[Data receiving unit 2021]
The data reception unit 2021 receives the measurement data transmitted by the data transmission units 2012 a and 2012 b. The identification number of the railway vehicle that is the transmission source of the measurement data is added to the measurement data.
[データ受信部2021]
データ受信部2021は、データ送信部2012a、2012bにより送信された計測データを受信する。この計測データには、当該計測データの送信元である鉄道車両の識別番号が付加されている。 <
[Data receiving unit 2021]
The data reception unit 2021 receives the measurement data transmitted by the
[データ記憶部2022]
データ記憶部2022は、データ受信部2021で受信された計測データを記憶する。データ記憶部2022は、鉄道車両の識別番号ごとに計測データを記憶する。データ記憶部2022は、鉄道車両の現在の運行状況と、計測データの受信時刻とに基づいて、当該計測データの受信時刻における鉄道車両の位置を特定し、特定した位置の情報と当該計測データとを相互に関連付けて記憶する。尚、データ収集装置2010a、2010bが、鉄道車両の現在の位置の情報を収集し、取集した情報を計測データに含めてもよい。 [Data storage unit 2022]
Thedata storage unit 2022 stores the measurement data received by the data receiving unit 2021. The data storage unit 2022 stores measurement data for each identification number of a railway vehicle. The data storage unit 2022 identifies the position of the railway vehicle at the reception time of the measurement data based on the current operation status of the railway vehicle and the reception time of the measurement data, and the information of the identified position and the measurement data Are associated with each other and stored. The data collection devices 2010a and 2010b may collect information on the current position of the railway vehicle and include the collected information in the measurement data.
データ記憶部2022は、データ受信部2021で受信された計測データを記憶する。データ記憶部2022は、鉄道車両の識別番号ごとに計測データを記憶する。データ記憶部2022は、鉄道車両の現在の運行状況と、計測データの受信時刻とに基づいて、当該計測データの受信時刻における鉄道車両の位置を特定し、特定した位置の情報と当該計測データとを相互に関連付けて記憶する。尚、データ収集装置2010a、2010bが、鉄道車両の現在の位置の情報を収集し、取集した情報を計測データに含めてもよい。 [Data storage unit 2022]
The
[データ読み出し部2023]
データ読み出し部2023は、データ記憶部2022により記憶された計測データを読み出す。データ読み出し部2023は、データ記憶部2022により記憶された計測データのうち、オペレータにより指定された計測データを読み出すことができる。また、データ読み出し部2023は、予め定められたタイミングで、予め定められた条件に合致する計測データを読み出すこともできる。本実施形態では、データ読み出し部2023により読み出される計測データは、例えば、鉄道車両の識別番号および位置の少なくとも何れか1つに基づいて決定される。 [Data reading unit 2023]
Thedata reading unit 2023 reads the measurement data stored by the data storage unit 2022. The data reading unit 2023 can read measurement data designated by the operator among the measurement data stored by the data storage unit 2022. In addition, the data reading unit 2023 can also read measurement data that matches a predetermined condition at a predetermined timing. In the present embodiment, the measurement data read by the data reading unit 2023 is determined based on, for example, at least one of the identification number and the position of the railcar.
データ読み出し部2023は、データ記憶部2022により記憶された計測データを読み出す。データ読み出し部2023は、データ記憶部2022により記憶された計測データのうち、オペレータにより指定された計測データを読み出すことができる。また、データ読み出し部2023は、予め定められたタイミングで、予め定められた条件に合致する計測データを読み出すこともできる。本実施形態では、データ読み出し部2023により読み出される計測データは、例えば、鉄道車両の識別番号および位置の少なくとも何れか1つに基づいて決定される。 [Data reading unit 2023]
The
状態方程式記憶部801、観測方程式記憶部802、第1の周波数調整部804、フィルタ演算部805、第2の周波数調整部806、軌道状態算出部807、および出力部808は、第1の実施形態と説明したものと同じである。従って、ここでは、これらの詳細な説明を省略する。尚、フィルタ演算部805は、データ取得部803で取得された計測データに代えてデータ読み出し部2023で読み出された計測データを用いて、(44)式に示す状態変数の推定値を決定する。
The state equation storage unit 801, the observation equation storage unit 802, the first frequency adjustment unit 804, the filter operation unit 805, the second frequency adjustment unit 806, the trajectory state calculation unit 807, and the output unit 808 are the first embodiment. Is the same as described. Therefore, the detailed description of these is omitted here. The filter operation unit 805 determines the estimated value of the state variable shown in equation (44) by using the measurement data read by the data read unit 2023 instead of the measurement data obtained by the data acquisition unit 803. .
<まとめ>
以上のように本実施形態では、鉄道車両に搭載されたデータ収集装置2010a、2010bは、計測データを収集してデータ処理装置2020に送信する。指令所に配置されたデータ処理装置2020は、データ収集装置2010a、2010bから受信した計測データを記憶し、記憶した計測データを用いて、最終的な通り狂い量yRを算出する。従って、第1の実施形態で説明した効果に加え、例えば、以下の効果を奏する。即ち、データ処理装置2020は、計測データを任意のタイミングで読み出すことにより、任意のタイミングで最終的な通り狂い量yRを算出することができる。また、データ処理装置2020は、同じ位置における最終的な通り狂い量yRの時系列的な変化を出力することができる。また、データ処理装置2020は、複数の路線における最終的な通り狂い量yRを路線ごとに出力することができる。 <Summary>
As described above, in the present embodiment, the data collection devices 2010a and 2010b mounted on the railcar collect measurement data and transmit it to the data processing device 2020. Data processor 2020 disposed control center, the data collection device 2010a, and stores the measurement data received from 2010b, using the stored measurement data to calculate a final streets deviation amount y R. Therefore, in addition to the effects described in the first embodiment, for example, the following effects are achieved. That is, the data processing device 2020 can calculate the final amount of deviation y R at any timing by reading the measurement data at any timing. In addition, the data processing device 2020 can output a time-series change of the final runoff amount y R at the same position. In addition, the data processing device 2020 can output the final amount of deviation y R in the plurality of routes for each route.
以上のように本実施形態では、鉄道車両に搭載されたデータ収集装置2010a、2010bは、計測データを収集してデータ処理装置2020に送信する。指令所に配置されたデータ処理装置2020は、データ収集装置2010a、2010bから受信した計測データを記憶し、記憶した計測データを用いて、最終的な通り狂い量yRを算出する。従って、第1の実施形態で説明した効果に加え、例えば、以下の効果を奏する。即ち、データ処理装置2020は、計測データを任意のタイミングで読み出すことにより、任意のタイミングで最終的な通り狂い量yRを算出することができる。また、データ処理装置2020は、同じ位置における最終的な通り狂い量yRの時系列的な変化を出力することができる。また、データ処理装置2020は、複数の路線における最終的な通り狂い量yRを路線ごとに出力することができる。 <Summary>
As described above, in the present embodiment, the
<変形例>
本実施形態では、データ収集装置2010a、2010bからデータ処理装置2020に計測データを直接送信する場合を例に挙げて説明した。しかしながら、必ずしもこのようにする必要はない。例えば、クラウドコンピューティングを利用して検査システムを構築してもよい。
また、指令所に配置されたデータ処理装置2020は、第2の実施形態で説明したようにして最終的な通り狂い量yRを算出してもよい。このようにする場合、データ処理装置2020は、継目判定部1702および補正部1703を更に有する。
その他、本実施形態においても、第1の実施形態および第2の実施形態で説明した種々の変形例を採用することができる。 <Modification>
In the present embodiment, the case where the measurement data is directly transmitted from the data collection devices 2010a and 2010b to the data processing device 2020 has been described as an example. However, this is not necessary. For example, cloud computing may be used to construct an inspection system.
Further, thedata processor 2020 disposed at the command center may calculate the final deviation amount y R as described in the second embodiment. In this case, the data processing device 2020 further includes a seam determination unit 1702 and a correction unit 1703.
In addition, also in the present embodiment, various modifications described in the first embodiment and the second embodiment can be adopted.
本実施形態では、データ収集装置2010a、2010bからデータ処理装置2020に計測データを直接送信する場合を例に挙げて説明した。しかしながら、必ずしもこのようにする必要はない。例えば、クラウドコンピューティングを利用して検査システムを構築してもよい。
また、指令所に配置されたデータ処理装置2020は、第2の実施形態で説明したようにして最終的な通り狂い量yRを算出してもよい。このようにする場合、データ処理装置2020は、継目判定部1702および補正部1703を更に有する。
その他、本実施形態においても、第1の実施形態および第2の実施形態で説明した種々の変形例を採用することができる。 <Modification>
In the present embodiment, the case where the measurement data is directly transmitted from the
Further, the
In addition, also in the present embodiment, various modifications described in the first embodiment and the second embodiment can be adopted.
また、第1の実施形態では、状態方程式記憶部801、観測方程式記憶部802、データ取得部803、第1の周波数調整部804、フィルタ演算部805、第2の周波数調整部806、軌道状態算出部807、および出力部808が1つの装置に含まれる場合を例に挙げて説明した。しかしながら、必ずしもこのようにする必要はない。状態方程式記憶部801、観測方程式記憶部802、第1の周波数調整部804、フィルタ演算部805、第2の周波数調整部806、軌道状態算出部807、および出力部808の機能を複数の装置で実現してもよい。この場合、これら複数の装置を用いて検査システムが構成される。以上のことは、第2の実施形態で説明した、状態方程式記憶部801、観測方程式記憶部802、データ取得部803、第1の周波数調整部804、フィルタ演算部805、第2の周波数調整部806、軌道状態算出部807、出力部808、継目判定部1702、および補正部1703についても同じである。
In the first embodiment, a state equation storage unit 801, an observation equation storage unit 802, a data acquisition unit 803, a first frequency adjustment unit 804, a filter operation unit 805, a second frequency adjustment unit 806, and a trajectory state calculation. The case where the unit 807 and the output unit 808 are included in one device has been described as an example. However, this is not necessary. The functions of the state equation storage unit 801, the observation equation storage unit 802, the first frequency adjustment unit 804, the filter operation unit 805, the second frequency adjustment unit 806, the orbit state calculation unit 807, and the output unit 808 are implemented by a plurality of devices. It may be realized. In this case, the inspection system is configured by using the plurality of devices. The above description is based on the state equation storage unit 801, the observation equation storage unit 802, the data acquisition unit 803, the first frequency adjustment unit 804, the filter operation unit 805, and the second frequency adjustment unit described in the second embodiment. The same applies to the trajectory state calculation unit 807, the output unit 808, the seam determination unit 1702, and the correction unit 1703.
(その他の実施形態)
以上説明した本発明の実施形態は、コンピュータがプログラムを実行することによって実現することができる。また、前記プログラムを記録したコンピュータ読み取り可能な記録媒体及び前記プログラム等のコンピュータプログラムプロダクトも本発明の実施形態として適用することができる。記録媒体としては、例えば、フレキシブルディスク、ハードディスク、光ディスク、光磁気ディスク、CD-ROM、磁気テープ、不揮発性のメモリカード、ROM等を用いることができる。 (Other embodiments)
The embodiments of the present invention described above can be realized by a computer executing a program. In addition, a computer readable recording medium recording the program and a computer program product such as the program can be applied as an embodiment of the present invention. As the recording medium, for example, a flexible disk, a hard disk, an optical disk, a magneto-optical disk, a CD-ROM, a magnetic tape, a non-volatile memory card, a ROM or the like can be used.
また、以上説明した本発明の実施形態は、何れも本発明を実施するにあたっての具体化の例を示したものに過ぎず、これらによって本発明の技術的範囲が限定的に解釈されてはならないものである。すなわち、本発明はその技術思想、またはその主要な特徴から逸脱することなく、様々な形で実施することができる。
In addition, any of the embodiments of the present invention described above is merely an example of implementation for carrying out the present invention, and the technical scope of the present invention should not be interpreted limitedly by these. It is a thing. That is, the present invention can be implemented in various forms without departing from the technical idea or the main features thereof.
本発明は、例えば、鉄道車両の軌道を検査することに利用することができる。
The present invention can be used, for example, to inspect the track of a railway vehicle.
Claims (20)
- 車体と台車と輪軸とを有する鉄道車両を軌道上で走行させることにより測定される測定値の時系列データである計測データを取得するデータ取得手段と、
前記鉄道車両の状態に応じて値が変動する物理量の時系列データから、前記鉄道車両が前記軌道の曲線部を走行することに起因して生じる低周波成分の信号強度を低減する周波数調整手段と、
前記軌道の状態を反映する情報を導出する軌道状態導出手段と、を有し、
前記計測データは、前後方向力の測定値を含み、
前記前後方向力は、前記輪軸と、当該輪軸が設けられる前記台車との間に配置される部材に生じる前後方向の力であり、
前記部材は、軸箱を支持するための部材であり、
前記前後方向は、前記鉄道車両の走行方向に沿う方向であり、
前記周波数調整手段は、前記物理量である前記前後方向力の測定値の時系列データから、前記鉄道車両が前記軌道の曲線部を走行することに起因して生じる低周波成分の信号強度を低減する第1の周波数調整手段を有し、
前記軌道状態導出手段は、前記輪軸の位置での前記軌道の状態を反映する情報と前記前後方向力との関係を示す関係式と、前記第1の周波数調整手段により低周波成分の信号強度が低減された前記前後方向力の値と、を用いて、前記軌道の状態を反映する情報を導出し、
前記関係式は、レールの曲率半径を含まない式であることを特徴とする検査システム。 Data acquisition means for acquiring measurement data which is time-series data of measurement values measured by causing a railway vehicle having a car body, a bogie and a wheelset to travel on a track;
Frequency adjustment means for reducing the signal strength of low frequency components generated due to the railway vehicle traveling on the curved portion of the track from time-series data of physical quantities whose values change according to the state of the railway vehicle ,
Orbit state deriving means for deriving information reflecting the state of the orbit;
The measurement data includes measured values of longitudinal force,
The longitudinal force is a longitudinal force generated in a member disposed between the wheelset and the carriage on which the wheelset is provided,
The member is a member for supporting the axle box,
The front-rear direction is a direction along the traveling direction of the railcar,
The frequency adjustment means reduces the signal strength of the low frequency component generated due to the railway vehicle traveling along the curved portion of the track from the time series data of the measured value of the longitudinal force which is the physical quantity. Having a first frequency adjustment means,
The track state deriving means is a relational expression showing the relation between the information reflecting the state of the track at the position of the wheelset and the longitudinal force, and the signal strength of the low frequency component is obtained by the first frequency adjusting means. Deriving information reflecting the state of the trajectory using the reduced value of the longitudinal force;
The inspection system characterized in that the relational expression is an expression that does not include the radius of curvature of the rail. - 前記計測データと、状態方程式と、観測方程式と、を用いて、データ同化を行うフィルタを用いた演算を行うことにより、前記状態方程式で推定値を決定すべき変数である状態変数の推定値を決定するフィルタ演算手段を更に有し、
前記計測データは、前記台車および前記輪軸の左右方向の加速度の測定値を更に含み、
前記左右方向は、前記前後方向と、前記軌道に対し垂直な方向である上下方向との双方に垂直な方向であり、
前記前後方向力は、前記輪軸のヨーイング方向の角変位と、当該輪軸が設けられる前記台車のヨーイング方向の角変位との差に応じて定まる力であり、
前記ヨーイング方向は、前記上下方向を回動軸とする回動方向であり、
前記状態方程式は、前記状態変数と、前記前後方向力と、変換変数と、を用いて記述される方程式であり、
前記状態変数は、前記台車の左右方向の変位および速度と、前記台車のヨーイング方向の角変位および角速度と、前記台車のローリング方向の角変位および角速度と、前記輪軸の左右方向の変位および速度と、前記鉄道車両に取り付けられている空気バネのローリング方向の角変位と、を含み、前記輪軸のヨーイング方向の角変位および角速度を含まず、
前記ローリング方向は、前記前後方向を回動軸とする回動方向であり、
前記変換変数は、前記輪軸のヨーイング方向の角変位と前記台車のヨーイング方向の角変位とを相互に変換する変数であり、
前記観測方程式は、観測変数と、前記変換変数と、を用いて記述される方程式であり、
前記観測変数は、前記台車および前記輪軸の左右方向の加速度を含み、
前記フィルタ演算手段は、前記観測変数の測定値と、前記第1の周波数調整手段により低周波成分の信号強度が低減された前記前後方向力の値および前記変換変数の実績値を代入した前記状態方程式と、前記変換変数の実績値を代入した前記観測方程式と、を用いて、前記観測変数の測定値と推定値との誤差または当該誤差の期待値が最小になるときの前記状態変数の推定値を決定し、
前記軌道状態導出手段は、前記フィルタ演算手段により決定された前記状態変数の一つである前記台車のヨーイング方向の角変位の推定値と、前記変換変数の実績値と、を用いて、前記輪軸のヨーイング方向の角変位の推定値を導出し、前記輪軸のヨーイング方向の角変位の推定値と、前記第1の周波数調整手段により低周波成分の信号強度が低減された前記前後方向力の値と、前記関係式と、を用いて前記軌道の状態を反映する情報を導出し、
前記関係式は、前記輪軸のヨーイング方向の運動を記述する運動方程式を、前記前後方向力を用いて表現した式であり、
前記変換変数の実績値は、前記第1の周波数調整手段により低周波成分の信号強度が低減された前記前後方向力の値を用いて導出されることを特徴とする請求項1に記載の検査システム。 By performing an operation using a filter that performs data assimilation using the measurement data, the state equation, and the observation equation, the estimated value of the state variable that is the variable for which the estimated value is to be determined in the state equation It further comprises filter operation means for determining
The measurement data further includes measurement values of accelerations in the left-right direction of the truck and the wheelset,
The left-right direction is a direction perpendicular to both the front-rear direction and the vertical direction which is a direction perpendicular to the track,
The longitudinal force is a force determined according to the difference between the angular displacement of the wheelset in the yawing direction and the angular displacement of the cart on which the wheelset is provided in the yawing direction,
The yawing direction is a pivoting direction whose pivot axis is the vertical direction.
The state equation is an equation described using the state variable, the longitudinal force, and a conversion variable,
The state variables include lateral displacement and velocity of the bogie, angular displacement and angular velocity in the yawing direction of the bogie, angular displacement and angular velocity in the rolling direction of the bogie, lateral displacement and velocity of the wheelset, and An angular displacement of a rolling direction of an air spring attached to the railway vehicle, and an angular displacement and an angular velocity of the wheel axle in a yawing direction,
The rolling direction is a pivoting direction with the longitudinal direction as a pivoting axis,
The conversion variable is a variable that mutually converts the angular displacement of the wheelset in the yawing direction and the angular displacement of the truck in the yawing direction,
The observation equation is an equation described using an observation variable and the conversion variable,
The observation variable includes left and right accelerations of the truck and the wheelset,
The above-mentioned state where the filter operation means has substituted the measured value of the observation variable, the value of the longitudinal force whose signal intensity of low frequency components has been reduced by the first frequency adjustment means, and the actual value of the conversion variable The estimation of the state variable when the error between the measured value and the estimated value of the observed variable or the expected value of the error is minimized using the equation and the observation equation into which the actual value of the conversion variable is substituted Determine the value,
The track state deriving means uses the estimated value of the angular displacement in the yawing direction of the bogie, which is one of the state variables determined by the filter operation means, and the actual value of the conversion variable, and the wheel shaft Of the angular displacement of the wheelset in the yawing direction and the value of the longitudinal force whose signal strength of the low frequency component is reduced by the first frequency adjustment means. Deriving information reflecting the state of the orbit using
The relational expression is an expression expressing an equation of motion describing the motion of the wheelset in the yawing direction using the longitudinal force.
The inspection according to claim 1, wherein the actual value of the conversion variable is derived using the value of the front-rear direction force in which the signal intensity of the low frequency component is reduced by the first frequency adjustment unit. system. - 前記状態方程式は、前記輪軸の左右方向の運動を記述した運動方程式と、前記台車の左右方向の運動を記述した運動方程式と、前記台車のヨーイング方向の運動を記述した運動方程式と、前記台車のローリング方向の運動を記述した運動方程式と、前記空気バネのローリング方向の運動を記述した運動方程式と、を用いて構成され、
前記輪軸の左右方向の運動を記述した運動方程式は、前記輪軸のヨーイング方向の角変位に代えて、前記変換変数を用いて記述された運動方程式であり、
前記台車のヨーイング方向の運動を記述した運動方程式は、前記輪軸のヨーイング方向の角変位および角速度に代えて、前記前後方向力を用いて記述された運動方程式であり、
前記変換変数は、前記台車のヨーイング方向の角変位と前記輪軸のヨーイング方向の角変位との差で表されることを特徴とする請求項2に記載の検査システム。 The equation of state includes an equation of motion describing the lateral motion of the wheelset, an equation of motion describing the lateral motion of the carriage, an equation of motion describing the yawing motion of the carriage, and It is configured using an equation of motion describing the motion in the rolling direction and a equation of motion describing the motion in the rolling direction of the air spring,
The equation of motion describing the lateral movement of the wheelset is an equation of motion described using the conversion variable instead of the angular displacement of the wheelset in the yawing direction,
The equation of motion describing the motion of the carriage in the yawing direction is an equation of motion described using the longitudinal force instead of the angular displacement and angular velocity of the wheelset in the yawing direction,
The inspection system according to claim 2, wherein the conversion variable is represented by a difference between an angular displacement of the carriage in the yawing direction and an angular displacement of the wheelset in the yawing direction. - 前記データ取得手段は、前記車体の左右方向の加速度の測定値を更に取得し、
前記観測変数は、前記車体の左右方向の加速度を更に含み、
前記状態変数は、前記車体の左右方向の変位および速度と、前記車体のヨーイング方向の角変位および角速度と、前記車体のローリング方向の角変位および角速度と、前記鉄道車両に取り付けられるヨーダンパのヨーイング方向の角変位と、を更に有し、
前記フィルタ演算手段は、前記車体、前記台車、および前記輪軸の左右方向の加速度の測定値と推定値との差が最小になるときの前記状態変数の推定値を決定することを特徴とする請求項2または3に記載の検査システム。 The data acquisition means further acquires measured values of acceleration in the left-right direction of the vehicle body,
The observation variable further includes the lateral acceleration of the vehicle body,
The state variables include lateral displacement and speed of the vehicle body, angular displacement and angular velocity of the vehicle in the yawing direction, angular displacement and angular velocity of the vehicle in the rolling direction, and yawing direction of a yaw damper attached to the railway vehicle Further have an angular displacement of
The filter operation means determines the estimated value of the state variable when the difference between the measured value and the estimated value of the acceleration in the lateral direction of the vehicle body, the cart, and the wheelset is minimized. The inspection system according to Item 2 or 3. - 前記状態方程式は、前記車体の左右方向の運動を記述した運動方程式と、前記車体のヨーイング方向の運動を記述した運動方程式と、前記車体のローリング方向の運動を記述した運動方程式と、前記ヨーダンパのヨーイング方向の運動を記述した運動方程式と、を更に用いて構成されることを特徴とする請求項4に記載の検査システム。 The equation of state includes an equation of motion describing the lateral motion of the vehicle body, an equation of motion describing the motion of the vehicle body in the yawing direction, an equation of motion describing the motion of the vehicle body in the rolling direction, and the yaw damper 5. The inspection system according to claim 4, further comprising: an equation of motion describing a motion in the yawing direction.
- 前記観測方程式は、前記輪軸の左右方向の運動を記述した運動方程式と、前記台車の左右方向の運動を記述した運動方程式と、を更に用いて構成され、
前記輪軸の左右方向の運動を記述した運動方程式は、前記輪軸のヨーイング方向の角変位に代えて、前記変換変数を用いて記述された運動方程式であることを特徴とする請求項2~5の何れか1項に記載の検査システム。 The observation equation is configured by further using an equation of motion describing the lateral motion of the wheelset and an equation of motion describing the lateral motion of the truck.
The motion equation describing the motion of the wheelset in the left-right direction is an equation of motion described using the conversion variable instead of the angular displacement in the yawing direction of the wheelset. The inspection system according to any one of the above. - 前記観測方程式は、前記車体の左右方向の運動を記述した運動方程式を更に用いて構成されることを特徴とする請求項6に記載の検査システム。 The inspection system according to claim 6, wherein the observation equation is configured by further using an equation of motion describing motion of the vehicle body in the left and right direction.
- 前記周波数調整手段は、前記物理量である前記状態変数の推定値の時系列データから、前記鉄道車両が前記軌道の曲線部を走行することに起因して生じる低周波成分の信号強度を低減する第2の周波数調整手段を更に有することを特徴とする請求項2~7の何れか1項に記載の検査システム。 The frequency adjustment means reduces signal strength of low frequency components generated due to the railway vehicle traveling along a curved portion of the track from time series data of estimated values of the state variable which is the physical quantity. The inspection system according to any one of claims 2 to 7, further comprising two frequency adjustment means.
- 前記フィルタは、カルマンフィルタであることを特徴とする請求項2~8の何れか1項に記載の検査システム。 The inspection system according to any one of claims 2 to 8, wherein the filter is a Kalman filter.
- 前記周波数調整手段は、前記物理量の時系列データを用いて、修正自己回帰モデルにおける係数を決定し、当該係数を決定した修正自己回帰モデルと、前記物理量の時系列データとを用いて、前記物理量の時系列データから、前記鉄道車両が前記軌道の曲線部を走行することに起因して生じる低周波成分の信号強度を低減し、
前記修正自己回帰モデルは、前記物理量の値と、前記値に対する前記係数と、を用いて、前記物理量の予測値を表す式であり、
前記周波数調整手段は、第1の行列を係数行列とし、自己相関ベクトルを定数ベクトルとする方程式を用いて、前記係数を決定し、
前記自己相関ベクトルは、時差が1から前記修正自己回帰モデルで用いられる前記測定値の数であるmまでの前記物理量の時系列データの自己相関を成分とするベクトルであり、
前記第1の行列は、1以上且つm未満の設定された数であるsに対して、自己相関行列のs個の固有値と対角行列Σとから導出される第2の行列Σsと、前記s個の固有値と直交行列Uとから導出される第3の行列Usと、から導出される行列UsΣsUs Tであり、
前記自己相関行列は、時差が0からm-1までの前記物理量の時系列データの自己相関を成分とする行列であり、
前記対角行列は、前記自己相関行列を特異値分解することで導出される前記自己相関行列の固有値を対角成分とする行列であり、
前記直交行列は、前記自己相関行列の固有ベクトルを列成分ベクトルとする行列であり、
前記第2の行列は、前記対角行列の部分行列であって、前記s個の固有値を対角成分とする行列であり、
前記第3の行列は、前記直交行列の部分行列であって、前記s個の固有値に対応する固有ベクトルを列成分ベクトルとする行列であることを特徴とする請求項1~9の何れか1項に記載の検査システム。 The frequency adjustment means uses the time series data of the physical quantity to determine the coefficient in the corrected autoregressive model, and uses the corrected autoregressive model in which the coefficient is determined and the time series data of the physical quantity to determine the physical quantity And reducing the signal strength of the low frequency component generated due to the railway vehicle traveling on the curved portion of the track from the time series data of
The modified autoregressive model is an expression representing a predicted value of the physical quantity using the value of the physical quantity and the coefficient with respect to the value;
The frequency adjustment means determines the coefficients using an equation in which the first matrix is a coefficient matrix and the autocorrelation vector is a constant vector,
The autocorrelation vector is a vector having autocorrelation of time series data of the physical quantities from time difference 1 to m, which is the number of the measurement values used in the modified autoregression model, as components.
The first matrix is a set number of 1 or more and less than m, and a second matrix s s derived from s eigenvalues of an autocorrelation matrix and a diagonal matrix 、, A matrix U s s s U s T derived from the third matrix U s derived from the s eigenvalues and the orthogonal matrix U,
The autocorrelation matrix is a matrix having autocorrelation of time series data of the physical quantity with a time difference of 0 to m-1 as a component,
The diagonal matrix is a matrix having, as diagonal components, eigenvalues of the autocorrelation matrix derived by singular value decomposition of the autocorrelation matrix.
The orthogonal matrix is a matrix having eigenvectors of the autocorrelation matrix as column component vectors,
The second matrix is a submatrix of the diagonal matrix, and is a matrix in which the s eigenvalues are diagonal components.
The third matrix is a submatrix of the orthogonal matrix, and is a matrix having an eigenvector corresponding to the s eigenvalues as a column component vector. Inspection system described in. - 前記s個の固有値は、前記自己相関行列の固有値のうち、値が最大の固有値を含むことを特徴とする請求項10に記載の検査システム。 The inspection system according to claim 10, wherein the s eigenvalues include the largest eigenvalue among the eigenvalues of the autocorrelation matrix.
- 前記軌道の曲線部にあるレールの継目を含む区間における前記前後方向力の値を補正する補正手段を更に有し、
前記補正手段により補正される前記前後方向力の値は、前記計測データに含まれる前記前後方向力の測定値、または、前記第1の周波数調整手段により低周波成分の信号強度が低減された前記前後方向力の値であることを特徴とする請求項1~11の何れか1項に記載の検査システム。 It further comprises correction means for correcting the value of the longitudinal force in the section including the seam of the rail in the curved portion of the track,
The value of the longitudinal force corrected by the correction means is the measured value of the longitudinal force contained in the measurement data, or the signal strength of the low frequency component is reduced by the first frequency adjustment means An inspection system according to any one of the preceding claims, characterized in that it is the value of the longitudinal force. - 前記軌道の状態を反映する情報は、前記軌道の通り狂い量、または、前記輪軸に設けられた車輪と前記軌道との間における左右方向の応力である横圧であり、
前記左右方向は、前記前後方向と、前記軌道に対し垂直な方向である上下方向との双方に垂直な方向であることを特徴とする請求項1~12の何れか1項に記載の検査システム。 The information reflecting the state of the track is a lateral deviation which is a lateral deviation amount between the track passing amount or a wheel provided on the wheelset and the track.
The inspection system according to any one of claims 1 to 12, wherein the left-right direction is a direction perpendicular to both the front-rear direction and an up-down direction which is a direction perpendicular to the track. . - 前記前後方向力は、1つの前記輪軸の左右方向の両側に取り付けられた2つの前記部材のそれぞれに生じる力の前記前後方向の成分のうち、相互に逆位相となる成分であり、
前記左右方向は、前記前後方向と、前記軌道に対し垂直な方向である上下方向との双方に垂直な方向であることを特徴とする請求項1~13の何れか1項に記載の検査システム。 The front-rear direction force is a component which is in opposite phase to each other among the front-rear direction components of the force generated in each of the two members attached to both sides in the left-right direction of one wheelset,
The inspection system according to any one of claims 1 to 13, wherein the left-right direction is a direction perpendicular to both the front-rear direction and an up-down direction which is a direction perpendicular to the track. . - 前記部材は、前記軸箱を支持するリンク、または、前記軸箱を支持するリンクに取り付けられたゴムブッシュであることを特徴とする請求項14に記載の検査システム。 The inspection system according to claim 14, wherein the member is a link supporting the axle box or a rubber bush attached to the link supporting the axle box.
- 前記部材は、前記軸箱を支持する軸はり、または、前記軸箱を支持する軸はりに取り付けられたゴムブッシュであることを特徴とする請求項14に記載の検査システム。 The inspection system according to claim 14, wherein the member is a shaft beam supporting the axle box or a rubber bush attached to the shaft beam supporting the axle box.
- 前記部材は、前記軸箱を支持する板バネ、または、前記軸箱を支持する板バネに取り付けられたゴムブッシュであることを特徴とする請求項14に記載の検査システム。 The inspection system according to claim 14, wherein the member is a leaf spring supporting the axle box or a rubber bush attached to the leaf spring supporting the axle box.
- 前記データ取得手段により取得された前記計測データを送信する送信手段と、
前記送信手段により送信された前記計測データを受信する受信手段と、を更に有することを特徴とする請求項1~17の何れか1項に記載の検査システム。 Transmission means for transmitting the measurement data acquired by the data acquisition means;
The inspection system according to any one of claims 1 to 17, further comprising: receiving means for receiving the measurement data transmitted by the transmitting means. - 車体と台車と輪軸とを有する鉄道車両を軌道上で走行させることにより測定される測定値の時系列データである計測データを取得するデータ取得工程と、
前記鉄道車両の状態に応じて値が変動する物理量の時系列データから、前記鉄道車両が前記軌道の曲線部を走行することに起因して生じる低周波成分の信号強度を低減する周波数調整工程と、
前記軌道の状態を反映する情報を導出する軌道状態導出工程と、を有し、
前記計測データは、前後方向力の測定値を含み、
前記前後方向力は、前記輪軸と、当該輪軸が設けられる前記台車との間に配置される部材に生じる前後方向の力であり、
前記部材は、軸箱を支持するための部材であり、
前記前後方向は、前記鉄道車両の走行方向に沿う方向であり、
前記周波数調整工程は、前記物理量である前記前後方向力の測定値の時系列データから、前記鉄道車両が前記軌道の曲線部を走行することに起因して生じる低周波成分の信号強度を低減する第1の周波数調整工程を有し、
前記軌道状態導出工程は、前記輪軸の位置での前記軌道の状態を反映する情報と前記前後方向力との関係を示す関係式と、前記第1の周波数調整工程により低周波成分の信号強度が低減された前記前後方向力の値と、を用いて、前記軌道の状態を反映する情報を導出し、
前記関係式は、レールの曲率半径を含まない式に基づく式であることを特徴とする検査方法。 A data acquisition step of acquiring measurement data which is time-series data of measured values measured by causing a railway vehicle having a car body, a bogie and a wheelset to travel on a track;
A frequency adjustment step of reducing the signal strength of low frequency components generated due to the railway vehicle traveling on the curved portion of the track from time-series data of physical quantities whose values change according to the state of the railway vehicle; ,
And a trajectory state deriving step of deriving information reflecting the state of the trajectory.
The measurement data includes measured values of longitudinal force,
The longitudinal force is a longitudinal force generated in a member disposed between the wheelset and the carriage on which the wheelset is provided,
The member is a member for supporting the axle box,
The front-rear direction is a direction along the traveling direction of the railcar,
The frequency adjustment step reduces the signal strength of low frequency components generated due to the railway vehicle traveling along the curved portion of the track from time series data of the measured values of the longitudinal force which is the physical quantity. Having a first frequency adjustment step,
In the track state deriving step, the signal strength of the low frequency component is obtained by the relational expression showing the relation between the information reflecting the state of the track at the position of the wheelset and the longitudinal force, and the first frequency adjustment step. Deriving information reflecting the state of the trajectory using the reduced value of the longitudinal force;
The inspection method is characterized in that the relational expression is an expression based on an expression not including the radius of curvature of the rail. - 車体と台車と輪軸とを有する鉄道車両を軌道上で走行させることにより測定される測定値の時系列データである計測データを取得するデータ取得工程と、
前記鉄道車両の状態に応じて値が変動する物理量の時系列データから、前記鉄道車両が前記軌道の曲線部を走行することに起因して生じる低周波成分の信号強度を低減する周波数調整工程と、
前記軌道の状態を反映する情報を導出する軌道状態導出工程と、をコンピュータに実行させ、
前記計測データは、前後方向力の測定値を含み、
前記前後方向力は、前記輪軸と、当該輪軸が設けられる前記台車との間に配置される部材に生じる前後方向の力であり、
前記部材は、軸箱を支持するための部材であり、
前記前後方向は、前記鉄道車両の走行方向に沿う方向であり、
前記周波数調整工程は、前記物理量である前記前後方向力の測定値の時系列データから、前記鉄道車両が前記軌道の曲線部を走行することに起因して生じる低周波成分の信号強度を低減する第1の周波数調整工程を有し、
前記軌道状態導出工程は、前記輪軸の位置での前記軌道の状態を反映する情報と前記前後方向力との関係を示す関係式と、前記第1の周波数調整工程により低周波成分の信号強度が低減された前記前後方向力の値と、を用いて、前記軌道の状態を反映する情報を導出し、
前記関係式は、レールの曲率半径を含まない式に基づく式であることを特徴とするプログラム。
A data acquisition step of acquiring measurement data which is time-series data of measured values measured by causing a railway vehicle having a car body, a bogie and a wheelset to travel on a track;
A frequency adjustment step of reducing the signal strength of low frequency components generated due to the railway vehicle traveling on the curved portion of the track from time-series data of physical quantities whose values change according to the state of the railway vehicle; ,
Causing a computer to execute an orbit state deriving step of deriving information reflecting the state of the orbit;
The measurement data includes measured values of longitudinal force,
The longitudinal force is a longitudinal force generated in a member disposed between the wheelset and the carriage on which the wheelset is provided,
The member is a member for supporting the axle box,
The front-rear direction is a direction along the traveling direction of the railcar,
The frequency adjustment step reduces the signal strength of low frequency components generated due to the railway vehicle traveling along the curved portion of the track from time series data of the measured values of the longitudinal force which is the physical quantity. Having a first frequency adjustment step,
In the track state deriving step, the signal strength of the low frequency component is obtained by the relational expression showing the relation between the information reflecting the state of the track at the position of the wheelset and the longitudinal force, and the first frequency adjustment step. Deriving information reflecting the state of the trajectory using the reduced value of the longitudinal force;
The program is characterized in that the relational expression is an expression based on an expression not including a radius of curvature of a rail.
Priority Applications (4)
| Application Number | Priority Date | Filing Date | Title |
|---|---|---|---|
| PCT/JP2017/031308 WO2019043859A1 (en) | 2017-08-31 | 2017-08-31 | Inspection system, inspection method, and program |
| CN201780093576.9A CN111065567B (en) | 2017-08-31 | 2017-08-31 | Inspection system, inspection method, and computer-readable storage medium |
| JP2019538840A JP6747598B2 (en) | 2017-08-31 | 2017-08-31 | Inspection system, inspection method, and program |
| EP17922960.4A EP3677485A4 (en) | 2017-08-31 | 2017-08-31 | Inspection system, inspection method, and program |
Applications Claiming Priority (1)
| Application Number | Priority Date | Filing Date | Title |
|---|---|---|---|
| PCT/JP2017/031308 WO2019043859A1 (en) | 2017-08-31 | 2017-08-31 | Inspection system, inspection method, and program |
Publications (1)
| Publication Number | Publication Date |
|---|---|
| WO2019043859A1 true WO2019043859A1 (en) | 2019-03-07 |
Family
ID=65525098
Family Applications (1)
| Application Number | Title | Priority Date | Filing Date |
|---|---|---|---|
| PCT/JP2017/031308 WO2019043859A1 (en) | 2017-08-31 | 2017-08-31 | Inspection system, inspection method, and program |
Country Status (4)
| Country | Link |
|---|---|
| EP (1) | EP3677485A4 (en) |
| JP (1) | JP6747598B2 (en) |
| CN (1) | CN111065567B (en) |
| WO (1) | WO2019043859A1 (en) |
Cited By (5)
| Publication number | Priority date | Publication date | Assignee | Title |
|---|---|---|---|---|
| WO2020121943A1 (en) * | 2018-12-10 | 2020-06-18 | 日本製鉄株式会社 | Inspection system, inspecting method, and program |
| WO2020261959A1 (en) * | 2019-06-28 | 2020-12-30 | 日本製鉄株式会社 | Estimation device, estimation method and program |
| JPWO2021014854A1 (en) * | 2019-07-25 | 2021-01-28 | ||
| JPWO2021039056A1 (en) * | 2019-08-30 | 2021-03-04 | ||
| JP2021143499A (en) * | 2020-03-11 | 2021-09-24 | 西日本旅客鉄道株式会社 | Rail condition prediction method, program, computer memory medium and rail condition prediction system |
Citations (7)
| Publication number | Priority date | Publication date | Assignee | Title |
|---|---|---|---|---|
| JP2009300397A (en) * | 2008-06-17 | 2009-12-24 | Central Japan Railway Co | Track deviation inspecting/measuring apparatus and track deviation inspecting/measuring method |
| US20120199700A1 (en) * | 2009-08-13 | 2012-08-09 | Technische Universiteit Delft | Method and Instrumentation for Detection of Rail Defects, in Particular Rail Top Defects |
| JP2014044096A (en) * | 2012-08-24 | 2014-03-13 | Tokyo Keiki Inc | Orbital position data giving system, and orbital position data giving method |
| JP2014126451A (en) * | 2012-12-26 | 2014-07-07 | Railway Technical Research Institute | Method of collectively displaying train vehicle ride comfort analysis and system therefor |
| JP2015227834A (en) * | 2014-06-02 | 2015-12-17 | 日本信号株式会社 | Track inspection device |
| JP2017053773A (en) | 2015-09-10 | 2017-03-16 | 公益財団法人鉄道総合技術研究所 | Track displacement measuring device and track displacement measuring method |
| WO2017164133A1 (en) * | 2016-03-23 | 2017-09-28 | 新日鐵住金株式会社 | Inspection system, inspection method and program |
Family Cites Families (5)
| Publication number | Priority date | Publication date | Assignee | Title |
|---|---|---|---|---|
| JP6512588B2 (en) * | 2013-09-06 | 2019-05-15 | 日本製鉄株式会社 | Track state measurement method and sales vehicle capable of track state measurement |
| KR101870482B1 (en) * | 2014-01-27 | 2018-06-22 | 엘에스산전 주식회사 | Apparatus for estimating lateral forces of railroad vehicles |
| CN105292177B (en) * | 2015-11-26 | 2017-12-29 | 唐智科技湖南发展有限公司 | It is a kind of vibrated with axle box, impact information measure track ripple mill method |
| CN205601866U (en) * | 2015-11-30 | 2016-09-28 | 北京维尔瑞轨道交通科技有限公司 | Lift -launch formula track inspection device |
| CN206202327U (en) * | 2016-10-21 | 2017-05-31 | 四川瑞新轨道交通科技发展有限公司 | Track geometry dynamic detection and alignment system |
-
2017
- 2017-08-31 JP JP2019538840A patent/JP6747598B2/en active Active
- 2017-08-31 EP EP17922960.4A patent/EP3677485A4/en active Pending
- 2017-08-31 WO PCT/JP2017/031308 patent/WO2019043859A1/en unknown
- 2017-08-31 CN CN201780093576.9A patent/CN111065567B/en active Active
Patent Citations (7)
| Publication number | Priority date | Publication date | Assignee | Title |
|---|---|---|---|---|
| JP2009300397A (en) * | 2008-06-17 | 2009-12-24 | Central Japan Railway Co | Track deviation inspecting/measuring apparatus and track deviation inspecting/measuring method |
| US20120199700A1 (en) * | 2009-08-13 | 2012-08-09 | Technische Universiteit Delft | Method and Instrumentation for Detection of Rail Defects, in Particular Rail Top Defects |
| JP2014044096A (en) * | 2012-08-24 | 2014-03-13 | Tokyo Keiki Inc | Orbital position data giving system, and orbital position data giving method |
| JP2014126451A (en) * | 2012-12-26 | 2014-07-07 | Railway Technical Research Institute | Method of collectively displaying train vehicle ride comfort analysis and system therefor |
| JP2015227834A (en) * | 2014-06-02 | 2015-12-17 | 日本信号株式会社 | Track inspection device |
| JP2017053773A (en) | 2015-09-10 | 2017-03-16 | 公益財団法人鉄道総合技術研究所 | Track displacement measuring device and track displacement measuring method |
| WO2017164133A1 (en) * | 2016-03-23 | 2017-09-28 | 新日鐵住金株式会社 | Inspection system, inspection method and program |
Non-Patent Citations (3)
| Title |
|---|
| "Railway vehicle dynamics The latest bogie technology", January 2003, DENKISYA KENKYUKAI CO.,LTD., pages: 15 - 33 |
| PING LI ET AL.: "Estimation of railway vehicle suspension parameters for condition monitoring", CONTROL ENGINEERING PRACTICE, vol. 15, 2007, pages 43 - 55, XP005651546, DOI: 10.1016/j.conengprac.2006.02.021 |
| See also references of EP3677485A4 |
Cited By (13)
| Publication number | Priority date | Publication date | Assignee | Title |
|---|---|---|---|---|
| JPWO2020121943A1 (en) * | 2018-12-10 | 2021-10-28 | 日本製鉄株式会社 | Inspection system, inspection method, and program |
| WO2020121943A1 (en) * | 2018-12-10 | 2020-06-18 | 日本製鉄株式会社 | Inspection system, inspecting method, and program |
| JP7088315B2 (en) | 2018-12-10 | 2022-06-21 | 日本製鉄株式会社 | Inspection system, inspection method, and program |
| WO2020261959A1 (en) * | 2019-06-28 | 2020-12-30 | 日本製鉄株式会社 | Estimation device, estimation method and program |
| JPWO2020261959A1 (en) * | 2019-06-28 | 2020-12-30 | ||
| JP7184191B2 (en) | 2019-06-28 | 2022-12-06 | 日本製鉄株式会社 | Estimation device, estimation method, and program |
| CN114096454A (en) * | 2019-06-28 | 2022-02-25 | 日本制铁株式会社 | Estimation device, estimation method, and program |
| JPWO2021014854A1 (en) * | 2019-07-25 | 2021-01-28 | ||
| JP7099637B2 (en) | 2019-07-25 | 2022-07-12 | 日本製鉄株式会社 | Inspection system, inspection method, and program |
| WO2021039056A1 (en) * | 2019-08-30 | 2021-03-04 | 日本製鉄株式会社 | Processing device, processing method, and program |
| JP7160210B2 (en) | 2019-08-30 | 2022-10-25 | 日本製鉄株式会社 | Processing device, processing method, and program |
| JPWO2021039056A1 (en) * | 2019-08-30 | 2021-03-04 | ||
| JP2021143499A (en) * | 2020-03-11 | 2021-09-24 | 西日本旅客鉄道株式会社 | Rail condition prediction method, program, computer memory medium and rail condition prediction system |
Also Published As
| Publication number | Publication date |
|---|---|
| CN111065567A (en) | 2020-04-24 |
| CN111065567B (en) | 2021-04-13 |
| EP3677485A4 (en) | 2021-04-07 |
| JP6747598B2 (en) | 2020-08-26 |
| JPWO2019043859A1 (en) | 2020-04-23 |
| EP3677485A1 (en) | 2020-07-08 |
Similar Documents
| Publication | Publication Date | Title |
|---|---|---|
| JP6547902B2 (en) | Inspection system, inspection method, and program | |
| JP6747598B2 (en) | Inspection system, inspection method, and program | |
| CN110874450B (en) | Railway bridge track irregularity calculation method based on vehicle-mounted monitoring | |
| JP4557908B2 (en) | Vehicle vibration system | |
| Muñoz et al. | Estimation of lateral track irregularity through Kalman filtering techniques | |
| JP7017179B2 (en) | Inspection system, inspection method, and program | |
| JP7024874B6 (en) | Inspection systems, inspection methods, and programs | |
| JP2012111480A (en) | Abnormality detection method and abnormality detection device of bolster spring system | |
| JP7088315B2 (en) | Inspection system, inspection method, and program | |
| JP6939540B2 (en) | Contact angle estimation system, contact angle estimation method, and program | |
| JP2019211263A (en) | Wheel rotation angle estimation method | |
| JP2019177784A (en) | Vehicle test system | |
| WO2021014854A1 (en) | Inspection system, inspection method, and program | |
| Li | Measuring systems for active steering of railway vehicles | |
| Imine et al. | Triangular observers for road profiles inputs estimation and vehicle dynamics analysis | |
| JP2018086876A (en) | Method and device for measuring ride comfort | |
| WO2023199369A1 (en) | Life evaluation device and method | |
| Muñoz Moreno et al. | Estimation of lateral track irregularity through Kalman filtering techniques | |
| JP2023117806A (en) | Attack angle estimation method and attack angle estimation device | |
| JP2020164021A (en) | Abnormality detection apparatus of axis beam type dolly |
Legal Events
| Date | Code | Title | Description |
|---|---|---|---|
| 121 | Ep: the epo has been informed by wipo that ep was designated in this application |
Ref document number: 17922960 Country of ref document: EP Kind code of ref document: A1 |
|
| ENP | Entry into the national phase |
Ref document number: 2019538840 Country of ref document: JP Kind code of ref document: A |
|
| NENP | Non-entry into the national phase |
Ref country code: DE |
|
| ENP | Entry into the national phase |
Ref document number: 2017922960 Country of ref document: EP Effective date: 20200331 |