WO2018193984A1 - 植林地の生産性の予測方法 - Google Patents
植林地の生産性の予測方法 Download PDFInfo
- Publication number
- WO2018193984A1 WO2018193984A1 PCT/JP2018/015526 JP2018015526W WO2018193984A1 WO 2018193984 A1 WO2018193984 A1 WO 2018193984A1 JP 2018015526 W JP2018015526 W JP 2018015526W WO 2018193984 A1 WO2018193984 A1 WO 2018193984A1
- Authority
- WO
- WIPO (PCT)
- Prior art keywords
- soil
- productivity
- plantation
- value
- soil component
- Prior art date
- Legal status (The legal status is an assumption and is not a legal conclusion. Google has not performed a legal analysis and makes no representation as to the accuracy of the status listed.)
- Ceased
Links
Images



Classifications
-
- A—HUMAN NECESSITIES
- A01—AGRICULTURE; FORESTRY; ANIMAL HUSBANDRY; HUNTING; TRAPPING; FISHING
- A01G—HORTICULTURE; CULTIVATION OF VEGETABLES, FLOWERS, RICE, FRUIT, VINES, HOPS OR SEAWEED; FORESTRY; WATERING
- A01G23/00—Forestry
-
- A—HUMAN NECESSITIES
- A01—AGRICULTURE; FORESTRY; ANIMAL HUSBANDRY; HUNTING; TRAPPING; FISHING
- A01G—HORTICULTURE; CULTIVATION OF VEGETABLES, FLOWERS, RICE, FRUIT, VINES, HOPS OR SEAWEED; FORESTRY; WATERING
- A01G7/00—Botany in general
-
- G—PHYSICS
- G01—MEASURING; TESTING
- G01N—INVESTIGATING OR ANALYSING MATERIALS BY DETERMINING THEIR CHEMICAL OR PHYSICAL PROPERTIES
- G01N21/00—Investigating or analysing materials by the use of optical means, i.e. using sub-millimetre waves, infrared, visible or ultraviolet light
- G01N21/17—Systems in which incident light is modified in accordance with the properties of the material investigated
- G01N21/25—Colour; Spectral properties, i.e. comparison of effect of material on the light at two or more different wavelengths or wavelength bands
- G01N21/27—Colour; Spectral properties, i.e. comparison of effect of material on the light at two or more different wavelengths or wavelength bands using photo-electric detection ; circuits for computing concentration
-
- G—PHYSICS
- G01—MEASURING; TESTING
- G01N—INVESTIGATING OR ANALYSING MATERIALS BY DETERMINING THEIR CHEMICAL OR PHYSICAL PROPERTIES
- G01N33/00—Investigating or analysing materials by specific methods not covered by groups G01N1/00 - G01N31/00
- G01N33/24—Earth materials
-
- Y—GENERAL TAGGING OF NEW TECHNOLOGICAL DEVELOPMENTS; GENERAL TAGGING OF CROSS-SECTIONAL TECHNOLOGIES SPANNING OVER SEVERAL SECTIONS OF THE IPC; TECHNICAL SUBJECTS COVERED BY FORMER USPC CROSS-REFERENCE ART COLLECTIONS [XRACs] AND DIGESTS
- Y02—TECHNOLOGIES OR APPLICATIONS FOR MITIGATION OR ADAPTATION AGAINST CLIMATE CHANGE
- Y02A—TECHNOLOGIES FOR ADAPTATION TO CLIMATE CHANGE
- Y02A40/00—Adaptation technologies in agriculture, forestry, livestock or agroalimentary production
- Y02A40/10—Adaptation technologies in agriculture, forestry, livestock or agroalimentary production in agriculture
- Y02A40/22—Improving land use; Improving water use or availability; Controlling erosion
-
- Y—GENERAL TAGGING OF NEW TECHNOLOGICAL DEVELOPMENTS; GENERAL TAGGING OF CROSS-SECTIONAL TECHNOLOGIES SPANNING OVER SEVERAL SECTIONS OF THE IPC; TECHNICAL SUBJECTS COVERED BY FORMER USPC CROSS-REFERENCE ART COLLECTIONS [XRACs] AND DIGESTS
- Y02—TECHNOLOGIES OR APPLICATIONS FOR MITIGATION OR ADAPTATION AGAINST CLIMATE CHANGE
- Y02P—CLIMATE CHANGE MITIGATION TECHNOLOGIES IN THE PRODUCTION OR PROCESSING OF GOODS
- Y02P60/00—Technologies relating to agriculture, livestock or agroalimentary industries
- Y02P60/40—Afforestation or reforestation
Definitions
- the present invention relates to a method for predicting plantation productivity.
- Patent Document 1 includes ground altitude, soil hardness, moisture content in soil, redox potential, pH, conductivity, C content, N content, ratio of C and N, Ca content, Mg content
- the height of planted trees in the plantation after a predetermined number of years, based on a plurality of parameters related to the growth of mangroves in the plantation environment, such as the amount, K content, Na content, etc. and the height of the mangrove in this plantation environment A method for creating a judgment formula for estimating the tree height and predicting the tree height using the judgment formula from the measured values of the parameters is described.
- Non-Patent Document 1 describes that the soil depth is greatly related to the productivity of planted radiata pine in relation to the balance between soil and water and nutrient accumulation, and that the phosphorus atomic weight of leaves is determined by a specific judgment formula. It is described that tree height can be predicted from soil depth, pH, and soil total nitrogen content.
- Patent Document 2 an explanatory variable is obtained from the analysis value of the color, characteristics, and nutrients of the soil near the target area, and a calibration equation with the growth data of the tree near the target area is obtained from the explanatory variable.
- a method for predicting the growth degree of trees in the target area by applying each analysis result of the target area to the equation is described.
- Patent Document 3 a soil spectrum is obtained from reflected light obtained by irradiating light on an analysis target soil, and is compared with a characteristic spectrum obtained from a waveform of a soil spectrum similarly obtained from a plurality of other soils. Describes that the characteristics of soil can be analyzed.
- Non-Patent Document 2 describes a method of estimating a soil analysis value by measuring a visible light-near infrared light soil diffusion spectrum using a tractor-mounted soil analysis system and performing a PLS regression analysis.
- This invention solves such a subject and aims at providing the method of predicting the productivity of the afforestation candidate site including the productivity of afforestation trees quickly, simply and accurately.
- Method for predicting productivity of candidate plantations including (A) to (D): (A): Obtaining a correlation between the soil component value and the soil spectrum by arranging the soil component value and the soil spectrum in the reference forest by multivariate analysis; (B): Organizing productivity, terrain information, and soil component values of the reference forest by multivariate analysis, and obtaining correlation between productivity, terrain information, and soil component values; (C): Obtaining predicted values of soil component values based on the correlation obtained in (A) from the soil spectrum of the proposed plantation site; and (D): Topographic information of the proposed plantation site and the proposed plantation site From the soil analysis value or the predicted value of the soil component value obtained in (C), a predicted value of the productivity of the proposed plantation site is obtained based on the correlation obtained in (B).
- the soil component value is the water content ratio, organic matter content, pH, phosphorus atom content, potassium atom content, calcium atom content, magnesium atom content, sodium atom content of the soil of the reference forest.
- Aluminum atom content, hydrogen atom content, aluminum saturation, acidity, total exchangeable base, base substitution capacity, base saturation, sulfur atom content, boron atom content, copper atom content, iron atom content, manganese Includes at least one selected from the group consisting of atomic content, zinc atomic content, total nitrogen content, ammonia nitrogen content, chlorine atom content, clay content, silt content, sand content, and total carbon content
- the correlation between the soil component value and the soil spectrum in (A) is an equation for estimating the soil component value from the soil spectrum, with the soil component value as the objective variable and the soil spectrum as the explanatory variable. The prediction method described.
- (D) is to obtain the predicted value of productivity of the candidate plantation site by applying the topographical information and the soil component value of the candidate plantation site to the productivity estimation formula obtained in (B), [6] ] The prediction method according to any one of [8] to [8].
- [11] Obtain a predicted productivity value of at least one afforestation candidate site by the prediction method according to any one of [1] to [10], and select an afforestation candidate site with a high productivity predictive value.
- a method of selecting plantations including selecting as.
- An afforestation method including afforesting in an afforestation area selected by the selection method according to [11].
- a method for producing a tree comprising producing a tree in a plantation selected by the selection method according to [11].
- a candidate plantation site prediction system that can implement the method according to any one of [1] to [10], including a soil spectrum measurement device, a soil component value measurement device, and data processing means.
- the present invention it is possible to quickly and easily evaluate the productivity of candidate plantations from soil component values, soil spectra, topographic information, etc., and select plantations.
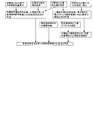
- FIG. 1 is a diagram showing a test procedure of the example.
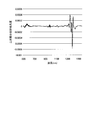
- FIG. 2 is a diagram showing a soil spectrum (before pretreatment) obtained in the examples.
- FIG. 3 is a diagram showing a soil spectrum (after pretreatment) obtained in the examples.
- FIG. 4 is a diagram showing the estimation accuracy of productivity from the actually measured value of the soil component value in the example.
- FIG. 5 is a diagram showing the estimation accuracy of the potassium atom content in the examples.
- FIG. 6 is a diagram showing the estimation accuracy of the sulfur atom content in the examples.
- FIG. 7 is a diagram illustrating the estimation accuracy of the clay content in the example.
- FIG. 8 is a diagram showing the estimation accuracy of productivity from the estimated value of the soil component value in the example.
- the method for predicting productivity of a candidate plantation site of the present invention includes the following steps: Step (A): Obtaining a correlation between soil component values and soil spectra by arranging soil component values and soil spectra in the reference forest by multivariate analysis; Process (B): Organizing productivity, topographic information, and soil component values of the standard forest by multivariate analysis to obtain a correlation between productivity, topographic information, and soil component values; Step (C): Obtaining the predicted value of the soil component value from the soil spectrum of the candidate plantation site based on the correlation obtained in (A); and Step (D): Topographical information of the candidate plantation site, and planting Obtaining the predicted value of productivity of the candidate plantation site from the soil analysis value of the candidate site or the predicted value of the soil component value obtained in (C) based on the correlation obtained in (B).
- the reference forest land may be an area where soil component values, topographic information, and productivity can be obtained, and may be at least a part of the forest land.
- the forest land may be either a natural forest or an artificial forest, but an artificial forest (planting area) is preferred.
- the area of the reference forest is not particularly limited, but is usually 50 m 2 or more.
- the reference forest is preferably a place where position information can be managed by GPS (Global Positioning System) or DGPS (Differential Global Positioning System).
- GPS Global Positioning System
- DGPS Different Global Positioning System
- the tree growing in the reference forest is not particularly limited as long as it is a woody plant.
- Eucalyptus plant For example, Eucalyptus plant, Cryptomeria plant, Pineus plant, and Prunus plant. Plants (such as cherry (Prunus spp.), Ume (Prunus mume), Prunus tomentosa), Mango genus (Mangifera indica), Acacia (Acacia) plant, Yamamo genus, Yamamo genus Plants, Quercus plants (such as Quercus acutissima), grape (Vitis) plants, apple (Malus) plants, rose (Rosa) plants, camellia (C melia plant, Jacaranda plant (Jacaranda mimosifolia etc.), crocodile (Persea) plant (Avocado (Persea americana) etc.), Hinoki genus (Chamaecyparis) plant, L (Abies
- the soil component value may be a numerical value indicating the properties of the soil, for example, water content ratio, organic matter content, pH, phosphorus atom content, potassium atom content, calcium atom content, magnesium atom content, sodium atom content Amount, aluminum atom content, hydrogen atom content, aluminum saturation, acidity, total exchangeable base, base substitution capacity, base saturation, sulfur atom content, boron atom content, copper atom content, iron atom content Manganese atom content, zinc atom content, total nitrogen content, ammonia nitrogen content, chlorine atom content, clay content, silt content, sand content, and total carbon content, potassium atom content, Sulfur atom content and clay content are preferred.
- the soil component value may be at least one of the above, but a combination of 2 or more is preferable, and a combination of 3 or more is more preferable. There is no particular upper limit, and it can be appropriately determined according to the analysis accuracy.
- the soil component value in the reference forest can be obtained by measuring in the reference forest.
- a measuring method is not specifically limited, What is necessary is just to utilize the method used in the case of the measurement of each soil component value.
- the soil component value may be a measurement value obtained at one measurement point selected from the reference forest, but is preferably an average value of measurement values obtained at two or more measurement points.
- the measurement point is preferably 10 or more, more preferably 15 or more, still more preferably 20 or more, and even more preferably 25 or more.
- the soil spectrum is a spectrum obtained when the soil is irradiated with light.
- the soil spectrum is usually obtained by irradiating light and measuring reflected light.
- the wavelength region of the soil spectrum is usually a visible light or near infrared light region, preferably 350 to 2500 nm, more preferably 500 nm to 2500 nm, and still more preferably 500 to 1600 nm.
- any device that can irradiate light such as near-infrared light and analyze the transmitted light or diffuse reflected light spectrum may be used.
- FieldSpec4 ASD
- SAS Shibuya Seiki
- the measurement point in the reference forest of the soil spectrum is preferably 2 or more, more preferably 10 or more, still more preferably 15 or more, still more preferably 20 or more, and particularly preferably 25 or more.
- the soil spectrum is preferably pretreated prior to multivariate analysis. As a result, variations between samples can be corrected and the influence of noise, outliers, and the like can be excluded, so that data quality can be improved.
- preprocessing include smoothing processing, differentiation processing (for example, primary differentiation processing, secondary differentiation processing), correction processing (for example, multiple scattering correction processing (MSC), standard normal variable processing (SNV), extended multiple scattering correction). Processing (EMSC), baseline correction processing), averaging processing, auto scale processing, range scale processing, dispersion scale processing, normalization processing, common logarithm processing (log 10), multiplication processing, and subtraction processing.
- Examples of multivariate analysis used to organize soil component values and soil spectra in the reference forest include, for example, partial least squares (PLS) regression analysis, multiple regression analysis, principal component analysis (PCS), principal component regression analysis (PCR), And Fourier transform analysis.
- PLS partial least squares
- PCS principal component analysis
- PCR principal component regression analysis
- Fourier transform analysis the problem of multicollinearity that can occur in other methods such as multiple regression analysis can be avoided, estimation with a large number of explanatory variables such as spectra, estimation with a small number of samples, prediction PLS regression analysis is preferable because of its high performance.
- step (A) when the multivariate analysis is PLS regression analysis is shown below.
- a soil spectrum is used as an explanatory variable
- a matrix is created using the soil component value as an objective variable
- the explanatory variable is converted based on the PLS algorithm, and is substituted into the formula of the PLS regression model.
- a soil component value estimation formula (calibration curve, calibration formula model) is obtained from the spectrum.
- the PLS algorithm and regression model in PLS regression analysis are, for example, “Model selection in PLS regression” (Yuki Hashimoto, Yutaka Tanaka, Academia. Bulletin of Information Science and Engineering: Bulletin of Nanzan University, 2010, http: //www.seto. nanzan-u.ac.jp/st/nas/academia/vol_010pdf/10-039-049.pdf).
- the reference forest land is as described in the process (A), and the reference forest land in the process (A) is the same as the reference forest land in the process (B).
- the productivity of the standard forest is preferably expressed numerically, more preferably the annual growth of trees growing in the standard forest, the monthly growth, etc., and the productivity generally used in forestry Since it is an index, annual growth is more preferable.
- the annual growth rate can be calculated by measuring the tree height and breast height diameter of the tree, estimating the volume of the desired tree using a growth curve, and the accumulated amount ( There is a method for estimating the volume (volume), and the method shown in the examples is preferable because the felling period and the age of the tree can be omitted.
- the productivity may be a measurement value obtained at one measurement point selected from the reference forest, but is preferably an average value of measurement values obtained at two or more measurement points.
- the measurement point is preferably 10 or more, more preferably 15 or more, still more preferably 20 or more, and even more preferably 25 or more.
- the topographic information of the reference forest is preferably a numerical value representing the topography.
- the terrain information includes, for example, the inclination angle, altitude, direction, soil layer depth, and soil layer hardness. The inclination angle and altitude are preferable, and the altitude is more preferable.
- the topographic information may be obtained as a measured value, or may be obtained using a geographic information analysis system provided by a public institution or the like. The method for measuring the terrain information is not particularly limited, and can be a known method.
- the terrain information may be one terrain information selected from the reference forest, but is preferably an average value of two or more terrain information.
- the terrain information preferably has an average value of 10 or more locations, more preferably an average value of 15 or more locations, more preferably an average value of 20 or more locations, and even more preferably an average value of 25 or more locations.
- step (A) Specific examples and preferred examples similar to the multivariate analysis in the step (A) are given as the multivariate analysis for organizing the productivity of the reference forest, topographic information, and soil component values.
- step (B) when the multivariate analysis is a PLS regression analysis is shown below. Using soil component values and topographic information as explanatory variables, creating a matrix with productivity as the target variable, converting the explanatory variables based on the PLS algorithm, and substituting them into the PLS regression model formula, soil component values and topographic information The productivity estimation formula of the candidate plantation site is obtained.
- step (C) a predicted value of the soil component value is obtained from the soil spectrum of the candidate plantation site based on the correlation obtained in (A).
- the soil spectrum of the proposed plantation site and the measurement method thereof are the same as the definition and specific example described in the step (A).
- the soil spectrum of the afforestation candidate site is preferably an average value of measured values obtained at two or more measurement points of the afforestation candidate site.
- the measurement point is preferably 10 or more, more preferably 15 or more, still more preferably 20 or more, and even more preferably 25 or more.
- the predicted value of the soil component value can be obtained by applying the measured value of the soil spectrum of the candidate plantation site to the formula.
- step (D) from the topographic information of the candidate plantation site and the soil analysis value of the candidate plantation site or the predicted value of the soil component value obtained in (C), based on the correlation obtained in (B), A predicted value of productivity of the candidate plantation site is obtained.
- the topographical information of the proposed plantation site is the same as the definition and specific example described in the process (B).
- the soil analysis value of the candidate plantation site may be a measured value or a predicted value. That is, it may be a measurement value obtained by actually measuring from the soil analysis value of the candidate plantation site, or obtained by applying the topography information of the candidate plantation site to the estimation formula of the soil component value obtained in (C). It may be a predicted value.
- the soil spectrum of the candidate plantation can be measured at the candidate plantation.
- the method for measuring the soil spectrum is the same as that described in the step (A).
- the predicted value of the productivity of the plantation is obtained by applying the soil analysis value of the plantation candidate site and the soil spectrum of the plantation candidate site to the formula. Can do.
- the productivity of various plantation candidate sites can be predicted quickly, simply and accurately, afforestation and tree production can be promoted systematically.
- the productivity of the afforestation candidate site can be predicted based not only on the tree height but also on the amount of planted tree growth including the breast height diameter.
- a predictive value of productivity of at least one afforestation candidate site can be obtained by the above prediction method, and afforestation candidate sites with high productivity predictive values can be selected as afforestation sites.
- the predicted productivity value of each candidate plantation is obtained, and the candidate plantation with the higher predicted value may be selected as the plantation site. Thereby, it is possible to carry out afforestation systematically in the selected plantation, that is, to produce trees.
- a prediction system including a soil spectrum measurement device, a soil component value measurement device, and data processing means for carrying out the above method for predicting a candidate plantation site.
- the soil component value measuring device may be any device that can measure the soil component value obtained by the prediction method.
- the prediction system may further include a data storage device.
- the data storage device may store each measured value (including average value, highest value, lowest value, and deviation), each predicted value, and each correlation (for example, an estimation formula) in steps (A) to (D). it can.
- the prediction stem may further include a computing device.
- the arithmetic device is a device that can calculate each correlation and predicted value in steps (A) to (D).
- Example 1 [Prediction of Eucalyptus Plantation Productivity] A productivity estimation test was conducted in 5.5 years (total 30 points) of Eucalyptus plantation in Amapa State, Brazil. The test was performed according to the flowchart (FIG. 1).
- productivity estimation formula Using productivity as an objective variable, soil component values (K content, S content and clay) and topographic information (tilt angle) as explanatory variables, multivariate analysis (PLS analysis) was performed to create a productivity estimation formula.
- FIG. 4 shows the correlation between the predicted productivity value obtained by the productivity estimation formula using the actual measured soil analysis value and the actual measured productivity value. As is clear from FIG. 4, the actual productivity and the productivity obtained from the estimation formula showed a high correlation.
Landscapes
- Life Sciences & Earth Sciences (AREA)
- Physics & Mathematics (AREA)
- Chemical & Material Sciences (AREA)
- Health & Medical Sciences (AREA)
- Engineering & Computer Science (AREA)
- Analytical Chemistry (AREA)
- Immunology (AREA)
- Pathology (AREA)
- Environmental Sciences (AREA)
- General Physics & Mathematics (AREA)
- Forests & Forestry (AREA)
- Ecology (AREA)
- Biodiversity & Conservation Biology (AREA)
- Biochemistry (AREA)
- General Health & Medical Sciences (AREA)
- Spectroscopy & Molecular Physics (AREA)
- Theoretical Computer Science (AREA)
- Mathematical Physics (AREA)
- Environmental & Geological Engineering (AREA)
- General Life Sciences & Earth Sciences (AREA)
- Geology (AREA)
- Remote Sensing (AREA)
- Food Science & Technology (AREA)
- Medicinal Chemistry (AREA)
- Botany (AREA)
- Investigating Or Analysing Materials By Optical Means (AREA)
Abstract
本発明の目的は植林地における植林木の生産性を含めた植林候補地の生産性を迅速、簡易、かつ正確に予測できる方法を提供することにある。 本発明は(A)~(D)を含む植林候補地の生産性の予測方法を提供する: (A):基準林地における土壌成分値と土壌スペクトルとを多変量解析により整理し、土壌成分値と土壌スペクトルとの相関関係を得ること; (B):基準林地の生産性と地形情報と土壌成分値とを多変量解析により整理し、生産性と地形情報と土壌成分値との相関関係を得ること; (C):植林候補地の土壌スペクトルから、(A)で得られた相関関係に基づき、土壌成分値の予測値を得ること;および (D):植林候補地の地形情報、および植林候補地の土壌分析値または(C)で得られた土壌成分値の予測値から、(B)で得られた相関関係に基づき、前記植林候補地の生産性の予測値を得ること。
Description
本発明は、植林地の生産性の予測方法に関する。
木材生産を目的とした産業植林や、森林保全、環境保全活動などの環境植林において、植林の管理、生産計画を効率的に行うために、植林地の生産性を事前に予測することが重要である。産業植林では、資産である植林木の成長量(蓄積量)の最大化や低コスト化を行うために、環境植林では樹種選定や低コスト化を行うために、植栽に適した土地、施業を選択することが求められる。
特許文献1には、地盤高度、土壌硬度、および土壌中の水分含有量、酸化還元電位、pH、導電率、C含有量、N含有量、CとNとの比率、Ca含有量、Mg含有量、K含有量、Na含有量等の、植林地環境におけるマングローブの生長に関与する複数のパラメータと、この植林地環境におけるマングローブの樹高とに基づいて所定年数後の植林地における植林木の樹高を推定する判定式を作成し、上記パラメータの実測値から判定式により樹高を予測する方法が記載されている。非特許文献1には、土と水のバランスおよび栄養蓄積に関連して、土の深さが植林地のラジアータパインの生産性に大きく関わること、および、特定の判定式により、葉のリン原子量、土の深さ、pH、および土壌全窒素量から樹高を予測できることが記載されている。
特許文献2には、対象地近傍の土壌の色、特性、養分の分析値から説明変数を得て、当該説明変数より、対象地近傍の樹木の成長データとの検量式を得て、当該検量式に対象地の各分析結果を当てはめて、対象地における樹木の成長度合いを予測する方法が記載されている。特許文献3には、分析対象の土壌に光を照射して得られる反射光から土壌スペクトルを得て、他の複数の土壌から同様に得られる土壌スペクトルの波形から求められる特徴スペクトルと対比することにより、土壌の特性を分析できることが記載されている。非特許文献2には、トラクタ搭載型土壌分析システムを用いて可視光-近赤外光土壌拡散スペクトルを測定してPLS回帰分析を行って土壌分析値を推定する方法が記載されている。
Sanchez-Rodriguez,F et al(2002)Forest Ecology and Management 171,181-189
小平正和、澁澤 栄(2016)農業食料工学会誌 78(5),401-415
しかしながら、既存技術はいずれも予測対象として植林木の樹高のみ、または土壌の性質のみに着目しており、植林地や植林木の生産性を一貫して評価する方法ではなかった。このように植林地や植林木の生産性の予測方法の開発が進んでいない理由としては、以下が考えられる:(1)林業では土壌成分や地形が密接且つ複雑に関連していること;(2)所有する土地全てを利用することが一般的であり、使用する土地の選択は想定されていないこと;(3)林業では伐期が長く(国内林業では通常40~50年)、現在伐期を迎えている植林木の植栽以前は土地の生産性を評価する手段がなくそのような手段の必要性も求められていなかったこと;および(4)実生苗は個体ごとに遺伝的にばらつきがあり、植林後に成長性を正確に予測することができなかったこと。
本発明は、斯かる課題を解決し、植林木の生産性を含めた植林候補地の生産性を迅速、簡易、かつ正確に予測できる方法を提供することを目的とする。
本発明は、以下を提供する。
〔1〕(A)~(D)を含む、植林候補地の生産性の予測方法:
(A):基準林地における土壌成分値と土壌スペクトルとを多変量解析により整理し、土壌成分値と土壌スペクトルとの相関関係を得ること;
(B):基準林地の生産性と地形情報と土壌成分値とを多変量解析により整理し、生産性と地形情報と土壌成分値との相関関係を得ること;
(C):植林候補地の土壌スペクトルから、(A)で得られた相関関係に基づき、土壌成分値の予測値を得ること;および
(D):植林候補地の地形情報、および植林候補地の土壌分析値または(C)で得られた土壌成分値の予測値から、(B)で得られた相関関係に基づき、前記植林候補地の生産性の予測値を得ること。
〔2〕前記土壌成分値は、前記基準林地の土壌の、含水比、有機物含有量、pH、リン原子含有量、カリウム原子含有量、カルシウム原子含有量、マグネシウム原子含有量、ナトリウム原子含有量、アルミニウム原子含有量、水素原子含有量、アルミニウム飽和度、酸度、交換性塩基総量、塩基置換容量、塩基飽和度、硫黄原子含有量、ホウ素原子含有量、銅原子含有量、鉄原子含有量、マンガン原子含有量、亜鉛原子含有量、全窒素量、アンモニア態窒素量、塩素原子含有量、粘土含有量、シルト含有量、砂含有量、および全炭素量からなる群より選ばれる少なくとも1つを含む、〔1〕に記載の予測方法。
〔3〕前記生産性は、樹木の年間成長量である、〔1〕または〔2〕に記載の予測方法。
〔4〕前記地形情報は、傾斜角および標高から選ばれる少なくとも1つを含む、〔1〕~〔3〕のいずれか1項に記載の予測方法。
〔5〕多変量解析は、PLS回帰分析である、〔1〕~〔4〕のいずれか1項に記載の予測方法。
〔6〕(A)における土壌成分値と土壌スペクトルとの相関関係は、土壌成分値を目的変数とし土壌スペクトルを説明変数とする、土壌スペクトルからの土壌成分値推定式である、〔5〕に記載の予測方法。
〔7〕(B)における生産性と地形情報と土壌成分値との相関関係は、生産性を目的変数とし土壌成分値と地形情報を説明変数とする、土壌成分値と地形情報からの植林候補地の生産性推定式である、〔5〕または〔6〕に記載の予測方法。
〔8〕(C)は、植林候補地の土壌スペクトルを(A)で得られる土壌成分値推定式に適用して土壌成分値の予測値を得ることである、〔6〕または〔7〕に記載の予測方法。
〔9〕(D)は、植林候補地の地形情報と土壌成分値を(B)で得られる生産性推定式に適用して植林候補地の生産性の予測値を得ることである、〔6〕~〔8〕のいずれか1項に記載の予測方法。
〔10〕植林候補地は、ユーカリ属植物の植林候補地である、〔1〕~〔9〕のいずれか1項に記載の予測方法。
〔11〕〔1〕~〔10〕のいずれか1項に記載の予測方法により少なくとも1つの植林候補地の生産性の予測値を得て、生産性の予測値が高い植林候補地を植林地として選抜することを含む、植林地の選抜方法。
〔12〕〔11〕に記載の選抜方法により選抜された植林地において植林を行うことを含む、植林方法。
〔13〕〔11〕に記載の選抜方法により選抜された植林地において樹木の生産を行うことを含む、樹木の生産方法。
〔14〕土壌スペクトル測定装置、土壌成分値測定装置、およびデータ処理手段を含む〔1〕~〔10〕のいずれか1項に記載の方法を実施できる、植林候補地の予測システム。
〔1〕(A)~(D)を含む、植林候補地の生産性の予測方法:
(A):基準林地における土壌成分値と土壌スペクトルとを多変量解析により整理し、土壌成分値と土壌スペクトルとの相関関係を得ること;
(B):基準林地の生産性と地形情報と土壌成分値とを多変量解析により整理し、生産性と地形情報と土壌成分値との相関関係を得ること;
(C):植林候補地の土壌スペクトルから、(A)で得られた相関関係に基づき、土壌成分値の予測値を得ること;および
(D):植林候補地の地形情報、および植林候補地の土壌分析値または(C)で得られた土壌成分値の予測値から、(B)で得られた相関関係に基づき、前記植林候補地の生産性の予測値を得ること。
〔2〕前記土壌成分値は、前記基準林地の土壌の、含水比、有機物含有量、pH、リン原子含有量、カリウム原子含有量、カルシウム原子含有量、マグネシウム原子含有量、ナトリウム原子含有量、アルミニウム原子含有量、水素原子含有量、アルミニウム飽和度、酸度、交換性塩基総量、塩基置換容量、塩基飽和度、硫黄原子含有量、ホウ素原子含有量、銅原子含有量、鉄原子含有量、マンガン原子含有量、亜鉛原子含有量、全窒素量、アンモニア態窒素量、塩素原子含有量、粘土含有量、シルト含有量、砂含有量、および全炭素量からなる群より選ばれる少なくとも1つを含む、〔1〕に記載の予測方法。
〔3〕前記生産性は、樹木の年間成長量である、〔1〕または〔2〕に記載の予測方法。
〔4〕前記地形情報は、傾斜角および標高から選ばれる少なくとも1つを含む、〔1〕~〔3〕のいずれか1項に記載の予測方法。
〔5〕多変量解析は、PLS回帰分析である、〔1〕~〔4〕のいずれか1項に記載の予測方法。
〔6〕(A)における土壌成分値と土壌スペクトルとの相関関係は、土壌成分値を目的変数とし土壌スペクトルを説明変数とする、土壌スペクトルからの土壌成分値推定式である、〔5〕に記載の予測方法。
〔7〕(B)における生産性と地形情報と土壌成分値との相関関係は、生産性を目的変数とし土壌成分値と地形情報を説明変数とする、土壌成分値と地形情報からの植林候補地の生産性推定式である、〔5〕または〔6〕に記載の予測方法。
〔8〕(C)は、植林候補地の土壌スペクトルを(A)で得られる土壌成分値推定式に適用して土壌成分値の予測値を得ることである、〔6〕または〔7〕に記載の予測方法。
〔9〕(D)は、植林候補地の地形情報と土壌成分値を(B)で得られる生産性推定式に適用して植林候補地の生産性の予測値を得ることである、〔6〕~〔8〕のいずれか1項に記載の予測方法。
〔10〕植林候補地は、ユーカリ属植物の植林候補地である、〔1〕~〔9〕のいずれか1項に記載の予測方法。
〔11〕〔1〕~〔10〕のいずれか1項に記載の予測方法により少なくとも1つの植林候補地の生産性の予測値を得て、生産性の予測値が高い植林候補地を植林地として選抜することを含む、植林地の選抜方法。
〔12〕〔11〕に記載の選抜方法により選抜された植林地において植林を行うことを含む、植林方法。
〔13〕〔11〕に記載の選抜方法により選抜された植林地において樹木の生産を行うことを含む、樹木の生産方法。
〔14〕土壌スペクトル測定装置、土壌成分値測定装置、およびデータ処理手段を含む〔1〕~〔10〕のいずれか1項に記載の方法を実施できる、植林候補地の予測システム。
本発明によれば、植林候補地の生産性を、土壌成分値、土壌スペクトル、地形情報等から迅速かつ簡易に評価し、植林地を選抜することができる。特に、樹木の樹高だけでなく、胸高直径を含めた植林木の成長量を基に植林候補地の生産性を評価することができる。
本発明の植林候補地の生産性の予測方法は、以下の工程を含む:
工程(A):基準林地における土壌成分値と土壌スペクトルとを多変量解析により整理し、土壌成分値と土壌スペクトルとの相関関係を得ること;
工程(B):基準林地の生産性と地形情報と土壌成分値とを多変量解析により整理し、生産性と地形情報と土壌成分値との相関関係を得ること;
工程(C):植林候補地の土壌スペクトルから、(A)で得られた相関関係に基づき、土壌成分値の予測値を得ること;および
工程(D):植林候補地の地形情報、および植林候補地の土壌分析値または(C)で得られた土壌成分値の予測値から、(B)で得られた相関関係に基づき、前記植林候補地の生産性の予測値を得ること。
工程(A):基準林地における土壌成分値と土壌スペクトルとを多変量解析により整理し、土壌成分値と土壌スペクトルとの相関関係を得ること;
工程(B):基準林地の生産性と地形情報と土壌成分値とを多変量解析により整理し、生産性と地形情報と土壌成分値との相関関係を得ること;
工程(C):植林候補地の土壌スペクトルから、(A)で得られた相関関係に基づき、土壌成分値の予測値を得ること;および
工程(D):植林候補地の地形情報、および植林候補地の土壌分析値または(C)で得られた土壌成分値の予測値から、(B)で得られた相関関係に基づき、前記植林候補地の生産性の予測値を得ること。
〔工程(A)〕
工程(A)においては、基準林地における土壌成分値と土壌スペクトルとを多変量解析により整理し、土壌成分値と土壌スペクトルとの相関関係を得る。
工程(A)においては、基準林地における土壌成分値と土壌スペクトルとを多変量解析により整理し、土壌成分値と土壌スペクトルとの相関関係を得る。
基準林地は、土壌成分値、地形情報、および生産性が得られる地域であればよく、林地の少なくとも一部であればよい。林地は、天然林、人工林のいずれでもよいが、人工林(植林地)が好ましい。基準林地の面積は、特に限定されないが、通常は50m2以上である。また、基準林地はGPS(Global Positioning System)もしくはDGPS(Differential Global Positioning System)により位置情報が管理できる場所であることが好ましい。基準林地は、以下のいずれかの要件を満たすことが好ましい:気候が植林候補地と同一または類似であること;地形が植林候補地と同一または類似であること;植林候補地と距離が近いこと;植林候補地で生育予定の樹木種と同一種または近縁種の樹木が生育していること。
基準林地に生育している樹木は、木本植物であればよく特に限定されないが、例えば、ユーカリ属(Eucalyptus)植物、スギ属(Cryptomeria)植物、マツ属(Pinus)植物、サクラ属(Prunus)植物(サクラ(Prunus spp.)、ウメ(Prunus mume)、ユスラウメ(Prunus tomentosa)など)、マンゴー属(Mangifera)植物(マンゴー(Mangifera indica)など)、アカシア属(Acacia)植物、ヤマモモ属(Myrica)植物、クヌギ属(Quercus)植物(クヌギ(Quercus acutissima)など)、ブドウ(Vitis)属植物、リンゴ(Malus)属植物、バラ属(Rosa)植物、ツバキ属(Camellia)植物、ジャカランダ属(Jacaranda)植物(ジャカランダ(Jacaranda mimosifolia)など)、ワニナシ属(Persea)植物(アボカド(Persea americana)など)、ヒノキ属(Chamaecyparis)植物、カラマツ属(Larix)植物、モミ属(Abies)植物、コナラ属(Quercus)植物が挙げられ、これらのうち、ユーカリ属植物、スギ属植物、マツ属植物が好ましい。
土壌成分値は、土壌の性状を示す数値であればよく、例えば、含水比、有機物含有量、pH、リン原子含有量、カリウム原子含有量、カルシウム原子含有量、マグネシウム原子含有量、ナトリウム原子含有量、アルミニウム原子含有量、水素原子含有量、アルミニウム飽和度、酸度、交換性塩基総量、塩基置換容量、塩基飽和度、硫黄原子含有量、ホウ素原子含有量、銅原子含有量、鉄原子含有量、マンガン原子含有量、亜鉛原子含有量、全窒素量、アンモニア態窒素量、塩素原子含有量、粘土含有量、シルト含有量、砂含有量、および全炭素量が挙げられ、カリウム原子含有量、硫黄原子含有量および粘土含有量が好ましい。土壌成分値は、上記の少なくとも1つであればよいが、2以上の組み合わせが好ましく、3以上の組み合わせがより好ましい。上限は特になく、解析精度に応じて適宜決定できる。
基準林地における土壌成分値は、基準林地において測定して得ることができる。測定方法は特に限定されず、それぞれの土壌成分値の測定の際に用いられる方法を利用すればよい。
土壌成分値は、基準林地の中から選ばれる測定地点1か所で得られる測定値でもよいが、2以上の測定地点で得られる測定値の平均値であることが好ましい。測定地点は10以上が好ましく、15以上がより好ましく、20以上がさらに好ましく、25以上がさらにより好ましい。
土壌スペクトルは、土壌に光を照射した際に得られるスペクトルである。土壌スペクトルは、通常、光を照射して反射光を測定することにより得られる。土壌スペクトルの波長領域は、通常は、可視光または近赤外光領域であり、好ましくは350~2500nm、より好ましくは500nm~2500nm、さらに好ましくは500~1600nmである。土壌スペクトルの測定には、近赤外光等の光を照射し、透過光または拡散反射光スペクトルを解析することができる装置であればよく、分光計測に一般的に用いられている分光計測装置(例えば、FieldSpec4(ASD社)、SAS(シブヤ精機)等)を用いることができる。
土壌スペクトルの基準林地における測定地点は、好ましくは2以上、より好ましくは10以上、さらに好ましくは15以上、さらにより好ましくは20以上、とりわけ好ましくは25以上である。
土壌スペクトルは、多変量解析に先立ち前処理されることが好ましい。これにより、サンプル間のばらつきを補正でき、ノイズ、アウトライヤーなどの影響を除外できるため、データの質を高めることができる。前処理としては例えば、平滑化処理、微分処理(例えば、一次微分処理、二次微分処理)、補正処理(例えば、多重散乱補正処理(MSC)、標準正規変数処理(SNV)、拡張多重散乱補正処理(EMSC)、ベースライン補正処理)、平均化処理、オートスケール処理、レンジスケール処理、分散スケール処理、ノーマライズ処理、常用対数処理(log10)、掛け算処理、引き算処理が挙げられる。
基準林地における土壌成分値と土壌スペクトルとの整理に用いる多変量解析としては、例えば、部分最小二乗(PLS)回帰分析、重回帰分析、主成分分析(PCS)、主成分回帰分析(PCR)、およびフーリエ変換解析が挙げられる。これらのうち、重回帰分析等他の方法で生じ得る多重共線性の問題を回避できること、スペクトルなどの多数の説明変数による推定が可能であること、少ないサンプル数による推定が可能であること、予測性能が高いこと等の理由からPLS回帰分析が好ましい。
多変量解析がPLS回帰分析である場合の、工程(A)の一例を以下に示す。PLS回帰分析における回帰モデルに従い、土壌スペクトルを説明変数とし、土壌成分値を目的変数として行列を作成し、当該説明変数をPLSアルゴリズムに基づき変換し、PLS回帰モデルの式に代入することで、土壌スペクトルからの土壌成分値推定式(検量線、検量式モデル)が得られる。PLS回帰分析におけるPLSアルゴリズムおよび回帰モデルは、例えば「PLS回帰におけるモデル選択」(橋本淳樹、田中豊著、アカデミア.情報理工学編:南山大学紀要、2010年、http://www.seto.nanzan-u.ac.jp/st/nas/academia/vol_010pdf/10-039-049.pdf)に記載されている。
〔工程(B)〕
工程(B)においては、基準林地の生産性と地形情報と土壌成分値とを多変量解析により整理し、生産性と地形情報と土壌成分値との相関関係を得る。
工程(B)においては、基準林地の生産性と地形情報と土壌成分値とを多変量解析により整理し、生産性と地形情報と土壌成分値との相関関係を得る。
基準林地は、工程(A)において説明したとおりであり、工程(A)の基準林地と工程(B)の基準林地は同一である。
基準林地の生産性は、数値で表されることが好ましく、基準林地に生育する樹木の年間成長量、月間成長量等の成長量がより好ましく、林業で一般的に用いられている生産性の指標であることから、年間成長量がより好ましい。年間成長量の算出方法としては、例えば、樹木の樹高、胸高直径を実測する方法、成長曲線を用いて希望する樹齢の材積を推定する方法、伐採期間が確定している場合には蓄積量(材積)を推定する方法が挙げられ、伐採期間、樹齢の特定を省略できることから実施例に示す方法が好ましい。
生産性は、基準林地の中から選ばれる測定地点1か所で得られる測定値でもよいが、2以上の測定地点で得られる測定値の平均値であることが好ましい。測定地点は10以上が好ましく、15以上がより好ましく、20以上がさらに好ましく、25以上がさらにより好ましい。
基準林地の地形情報は、地形を表す数値であることが好ましい。地形情報としては例えば、傾斜角、標高、方角、土壌層の深さ、土壌層の硬さが挙げられ、傾斜角、標高が好ましく、標高がより好ましい。地形情報は、測定値として得てもよいし、公的機関等で提供される地理情報分析システムなどを利用して得てもよい。地形情報の測定方法は、特に限定されず、公知の方法によることができる。
地形情報は、基準林地の中から選ばれる1か所の地形情報でもよいが、2か所以上の地形情報の平均値であることが好ましい。地形情報は10か所以上の平均値が好ましく、15か所以上の平均値がより好ましく、20か所以上の平均値がさらに好ましく、25か所以上の平均値がさらにより好ましい。
基準林地の生産性と地形情報と土壌成分値とを整理するための多変量解析としては、工程(A)における多変量解析と同様の具体例、好ましい例が挙げられる。多変量解析がPLS回帰分析である場合の、工程(B)の一例を以下に示す。土壌成分値と地形情報を説明変数とし、生産性を目的変数として行列を作成し、当該説明変数をPLSアルゴリズムに基づき変換し、PLS回帰モデルの式に代入することで、土壌成分値と地形情報からの植林候補地の生産性推定式が得られる。
〔工程(C)〕
工程(C)においては、植林候補地の土壌スペクトルから、(A)で得られた相関関係に基づき、土壌成分値の予測値を得る。
工程(C)においては、植林候補地の土壌スペクトルから、(A)で得られた相関関係に基づき、土壌成分値の予測値を得る。
植林候補地の土壌スペクトルおよびその測定方法は、工程(A)において説明した定義および具体例と同様である。植林候補地の土壌スペクトルは、植林候補地の2以上の測定地点で得られる測定値の平均値であることが好ましい。測定地点は10以上が好ましく、15以上がより好ましく、20以上がさらに好ましく、25以上がさらにより好ましい。(A)において土壌成分値の推定式を得た場合には、植林候補地の土壌スペクトルの測定値を当該式に適用することで、土壌成分値の予測値を得ることができる。
〔工程(D)〕
工程(D)においては、植林候補地の地形情報、および植林候補地の土壌分析値または(C)で得られた土壌成分値の予測値から、(B)で得られた相関関係に基づき、前記植林候補地の生産性の予測値を得る。
工程(D)においては、植林候補地の地形情報、および植林候補地の土壌分析値または(C)で得られた土壌成分値の予測値から、(B)で得られた相関関係に基づき、前記植林候補地の生産性の予測値を得る。
植林候補地の地形情報は、工程(B)において説明した定義および具体例と同様である。植林候補地の土壌分析値は、測定値でもよいし予測値でもよい。すなわち、植林候補地の土壌分析値から実際に測定して得られる測定値でもよいし、(C)において得た土壌成分値の推定式に、植林候補地の地形情報を適用することで得られる予測値でもよい。植林候補地の土壌スペクトルは、植林候補地において測定することができる。土壌スペクトルの測定法は、工程(A)において説明したのと同様である。(B)において生産性の推定式を得た場合には、植林候補地の土壌分析値および植林候補地の土壌スペクトルを当該式に適用することで、植林地の生産性の予測値を得ることができる。
本発明によれば、さまざまな植林候補地の生産性を、迅速、簡易、かつ正確に予測できることから、植林、および樹木の生産を計画的に進めることができる。具体的には、樹木の樹高だけでなく、胸高直径を含めた植林木の成長量を基に植林候補地の生産性を予測することができる。例えば、上記の予測方法により少なくとも1つの植林候補地の生産性の予測値を得て、生産性の予測値が高い植林候補地を植林地として選抜することができる。植林候補地が2以上の場合には、各植林候補地の生産性の予測値を得て、予測値が高いほうの植林候補地を植林地として選抜すればよい。これにより、選抜された植林地において計画的に植林を行うことができ、すなわち樹木の生産を行うことができる。
本発明によれば、上記植林候補地の予測方法を実施するための、土壌スペクトル測定装置、土壌成分値測定装置、およびデータ処理手段を含む予測システムも提供される。土壌成分値測定装置は、上記予測方法で求められる土壌成分値を測定できる装置であればよい。予測システムはさらに、データ記憶装置を含んでもよい。データ記憶装置は、工程(A)から(D)における各測定値(平均値、最高値、最低値、偏差を含む)、各予測値、各相関関係(例えば、推定式)を記憶することができる。予測ステムはさらに、演算装置を含んでもよい。演算装置は、工程(A)から(D)における各相関関係、予測値を算出できる装置である。
実施例1〔ユーカリ植林地の生産性の予測〕
ブラジル連邦共和国アマパ州のユーカリ植林地5.5年生(合計30地点)において、生産性の推定試験を行った。試験はフローチャート(図1)に従って行った。
ブラジル連邦共和国アマパ州のユーカリ植林地5.5年生(合計30地点)において、生産性の推定試験を行った。試験はフローチャート(図1)に従って行った。
〔試験地における樹木の年間成長量の算出〕
植林地の生産性として、年間成長量(m3/ha/年)を用いた。年間成長量の算出は以下の手順で行った。まず、試験地30地点のそれぞれに生息するユーカリの単一樹種、系統(Eucalyptus urograndis)40本の樹高、胸高直径を実測した。年間成長量の算出は以下の手順で行った。下記式に基づき調査時点の単木材積を算出し、各試験地の平均値を求めた。次にhaあたりの植栽本数(土地により1000本~1500本)をかけ、試験地1haあたりのユーカリの材積成長量を算出し、試験期間(年)で割って、成長量(年間材積成長量(m3/ha/年))を算出した。
植林地の生産性として、年間成長量(m3/ha/年)を用いた。年間成長量の算出は以下の手順で行った。まず、試験地30地点のそれぞれに生息するユーカリの単一樹種、系統(Eucalyptus urograndis)40本の樹高、胸高直径を実測した。年間成長量の算出は以下の手順で行った。下記式に基づき調査時点の単木材積を算出し、各試験地の平均値を求めた。次にhaあたりの植栽本数(土地により1000本~1500本)をかけ、試験地1haあたりのユーカリの材積成長量を算出し、試験期間(年)で割って、成長量(年間材積成長量(m3/ha/年))を算出した。
[式]
単木材積=(胸高直径(m))2×樹高(m)×係数
係数:0.3~0.4
単木材積=(胸高直径(m))2×樹高(m)×係数
係数:0.3~0.4
〔試験地の地形情報の収集〕
地形情報として、試験地の30地点において、標高、傾斜角を収集した。標高および傾斜角のいずれも、地理情報解析ソフト(ArcGIS ESRI社)から得た。
地形情報として、試験地の30地点において、標高、傾斜角を収集した。標高および傾斜角のいずれも、地理情報解析ソフト(ArcGIS ESRI社)から得た。
〔試験地の土壌成分値の測定〕
試験地の30地点において、地上から深さ20cmまでの土壌をサンプリングし、土壌サンプルを得た。各土壌サンプルについて、表1に示す28項目の各土壌成分値を常法により得た。
試験地の30地点において、地上から深さ20cmまでの土壌をサンプリングし、土壌サンプルを得た。各土壌サンプルについて、表1に示す28項目の各土壌成分値を常法により得た。
〔基準林地の土壌スペクトル測定〕
各土壌サンプルについて、FieldSpec4(ASD社)によりスペクトル測定を実施した(図2)。実測値について「The Unscrambler X」((株)カモソフトウェアジャパン)を用い前処理(平滑化処理、微分処理等)を施して、得られる補正値を以下の多変量解析の際用いた(図3)。
各土壌サンプルについて、FieldSpec4(ASD社)によりスペクトル測定を実施した(図2)。実測値について「The Unscrambler X」((株)カモソフトウェアジャパン)を用い前処理(平滑化処理、微分処理等)を施して、得られる補正値を以下の多変量解析の際用いた(図3)。
〔土壌成分値推定式〕
土壌成分値(K含有量、S含有量および粘土)を目的変数、補正後の土壌スペクトルを説明変数として、「The Unscrambler X」((株)カモソフトウェアジャパン)を用いて多変量解析(PLS回帰分析)を行い、土壌成分値推定式を作成した。
土壌成分値(K含有量、S含有量および粘土)を目的変数、補正後の土壌スペクトルを説明変数として、「The Unscrambler X」((株)カモソフトウェアジャパン)を用いて多変量解析(PLS回帰分析)を行い、土壌成分値推定式を作成した。
〔生産性推定式〕
生産性を目的変数、土壌成分値(K含有量、S含有量および粘土)と地形情報(傾斜角)を説明変数として、多変量解析(PLS解析)を行い、生産性推定式を作成した。
生産性を目的変数、土壌成分値(K含有量、S含有量および粘土)と地形情報(傾斜角)を説明変数として、多変量解析(PLS解析)を行い、生産性推定式を作成した。
図4に、土壌分析値の実測値を用いて生産性推定式により得た生産性の予測値と生産性の実測値との相関性を示す。図4から明らかなとおり、実際の生産性と推定式から得られる生産性とは、高い相関を示していた。
〔植林候補地の土壌スペクトルの測定、地形情報収集、土壌成分値の推定、および生産性の予測〕
植林候補地として、ユーカリ植林地3.5年生(合計9地点)を選択し、試験地について説明したのと同様の方法で土壌スペクトルの測定を行い、土壌成分値推定式から土壌成分値の推定値を得た。また、地形情報収集を行い、得られる地形情報と土壌成分の推定値とから、生産性推定式に基づき、生産性を推定した。図5~7に、土壌成分値推定式により得たカリウム含有量の推定値、硫黄含有量の推定値、粘土含有量の推定値とそれぞれの実測値との相関性を示す。図8に、地形情報と上記各土壌成分の推定値とから生産性推定式により得た生産性の推定値と、生産性実測値との相関性を示す。図5~7から明らかなとおり、実際の土壌成分値と推定式から得られる土壌成分値とは、高い相関を示していた。図8から明らかなとおり、上記生産性推定式により得た生産性の推定値と生産性の実測値とは、高い相関を示していた。
植林候補地として、ユーカリ植林地3.5年生(合計9地点)を選択し、試験地について説明したのと同様の方法で土壌スペクトルの測定を行い、土壌成分値推定式から土壌成分値の推定値を得た。また、地形情報収集を行い、得られる地形情報と土壌成分の推定値とから、生産性推定式に基づき、生産性を推定した。図5~7に、土壌成分値推定式により得たカリウム含有量の推定値、硫黄含有量の推定値、粘土含有量の推定値とそれぞれの実測値との相関性を示す。図8に、地形情報と上記各土壌成分の推定値とから生産性推定式により得た生産性の推定値と、生産性実測値との相関性を示す。図5~7から明らかなとおり、実際の土壌成分値と推定式から得られる土壌成分値とは、高い相関を示していた。図8から明らかなとおり、上記生産性推定式により得た生産性の推定値と生産性の実測値とは、高い相関を示していた。

Claims (14)
- (A)~(D)を含む、植林候補地の生産性の予測方法:
(A):基準林地における土壌成分値と土壌スペクトルとを多変量解析により整理し、土壌成分値と土壌スペクトルとの相関関係を得ること;
(B):基準林地の生産性と地形情報と土壌成分値とを多変量解析により整理し、生産性と地形情報と土壌成分値との相関関係を得ること;
(C):植林候補地の土壌スペクトルから、(A)で得られた相関関係に基づき、土壌成分値の予測値を得ること;および
(D):植林候補地の地形情報、および植林候補地の土壌分析値または(C)で得られた土壌成分値の予測値から、(B)で得られた相関関係に基づき、前記植林候補地の生産性の予測値を得ること。 - 前記土壌成分値は、前記基準林地の土壌の、含水比、有機物含有量、pH、リン原子含有量、カリウム原子含有量、カルシウム原子含有量、マグネシウム原子含有量、ナトリウム原子含有量、アルミニウム原子含有量、水素原子含有量、アルミニウム飽和度、酸度、交換性塩基総量、塩基置換容量、塩基飽和度、硫黄原子含有量、ホウ素原子含有量、銅原子含有量、鉄原子含有量、マンガン原子含有量、亜鉛原子含有量、全窒素量、アンモニア態窒素量、塩素原子含有量、粘土含有量、シルト含有量、砂含有量、および全炭素量からなる群より選ばれる少なくとも1つを含む、請求項1に記載の予測方法。
- 前記生産性は、樹木の年間成長量である、請求項1または2に記載の予測方法。
- 前記地形情報は、傾斜角および標高から選ばれる少なくとも1つを含む、請求項1~3のいずれか1項に記載の予測方法。
- 多変量解析は、PLS回帰分析である、請求項1~4のいずれか1項に記載の予測方法。
- (A)における土壌成分値と土壌スペクトルとの相関関係は、土壌成分値を目的変数とし土壌スペクトルを説明変数とする、土壌スペクトルからの土壌成分値推定式である、請求項5に記載の予測方法。
- (B)における生産性と地形情報と土壌成分値との相関関係は、生産性を目的変数とし土壌成分値と地形情報を説明変数とする、土壌成分値と地形情報からの植林候補地の生産性推定式である、請求項5または6に記載の予測方法。
- (C)は、植林候補地の土壌スペクトルを(A)で得られる土壌成分値推定式に適用して土壌成分値の予測値を得ることである、請求項6または7に記載の予測方法。
- (D)は、植林候補地の地形情報と土壌成分値を(B)で得られる生産性推定式に適用して植林候補地の生産性の予測値を得ることである、請求項6~8のいずれか1項に記載の予測方法。
- 植林候補地は、ユーカリ属植物の植林候補地である、請求項1~9のいずれか1項に記載の予測方法。
- 請求項1~10のいずれか1項に記載の予測方法により少なくとも1つの植林候補地の生産性の予測値を得て、生産性の予測値が高い植林候補地を植林地として選抜することを含む、植林地の選抜方法。
- 請求項11に記載の選抜方法により選抜された植林地において植林を行うことを含む、植林方法。
- 請求項11に記載の選抜方法により選抜された植林地において樹木の生産を行うことを含む、樹木の生産方法。
- 土壌スペクトル測定装置、土壌成分値測定装置、およびデータ処理手段を含む請求項1~10のいずれか1項に記載の方法を実施できる、植林候補地の予測システム。
Priority Applications (1)
| Application Number | Priority Date | Filing Date | Title |
|---|---|---|---|
| JP2019513605A JP6708789B2 (ja) | 2017-04-17 | 2018-04-13 | 植林地の生産性の予測方法 |
Applications Claiming Priority (2)
| Application Number | Priority Date | Filing Date | Title |
|---|---|---|---|
| JP2017081592 | 2017-04-17 | ||
| JP2017-081592 | 2017-04-17 |
Publications (1)
| Publication Number | Publication Date |
|---|---|
| WO2018193984A1 true WO2018193984A1 (ja) | 2018-10-25 |
Family
ID=63857088
Family Applications (1)
| Application Number | Title | Priority Date | Filing Date |
|---|---|---|---|
| PCT/JP2018/015526 Ceased WO2018193984A1 (ja) | 2017-04-17 | 2018-04-13 | 植林地の生産性の予測方法 |
Country Status (2)
| Country | Link |
|---|---|
| JP (1) | JP6708789B2 (ja) |
| WO (1) | WO2018193984A1 (ja) |
Cited By (2)
| Publication number | Priority date | Publication date | Assignee | Title |
|---|---|---|---|---|
| JP2021197084A (ja) * | 2020-06-18 | 2021-12-27 | 日本森林総研株式会社 | サーバ、森林データ利用システム、森林データ利用方法およびプログラム |
| CN119044447A (zh) * | 2024-08-20 | 2024-11-29 | 山东航空学院 | 基于知识图谱的滨海盐碱地土壤团聚体有机碳含量测定方法 |
Families Citing this family (1)
| Publication number | Priority date | Publication date | Assignee | Title |
|---|---|---|---|---|
| KR102645282B1 (ko) * | 2021-02-17 | 2024-03-08 | (주) 심플그로우 | 딥러닝 기반의 식물 관리를 위한 장치, 서버 및 시스템 |
Citations (6)
| Publication number | Priority date | Publication date | Assignee | Title |
|---|---|---|---|---|
| WO2005063001A1 (es) * | 2003-12-26 | 2005-07-14 | Instituto Madrileño De Investigación Agraría Y Alimentaria (Imia) | Simulador de lluvia para estudios medioambientales |
| JP2006038511A (ja) * | 2004-07-23 | 2006-02-09 | Tokyo Univ Of Agriculture & Technology | 土壌分析方法及び土壌分析装置 |
| JP2006115768A (ja) * | 2004-10-21 | 2006-05-11 | Oji Paper Co Ltd | 植物管理方法 |
| JP2008206421A (ja) * | 2007-02-23 | 2008-09-11 | Kansai Electric Power Co Inc:The | マングローブの生長予測システム、マングローブの植林適地判定システム、マングローブの生長予測方法、及びマングローブの植林適地判定方法 |
| JP2015132863A (ja) * | 2012-04-27 | 2015-07-23 | 住友林業株式会社 | 生産活動と生産地の保全を統合した排出権創出方法 |
| WO2016043007A1 (ja) * | 2014-09-17 | 2016-03-24 | 住友林業株式会社 | 樹木成長の簡易予測法 |
Family Cites Families (1)
| Publication number | Priority date | Publication date | Assignee | Title |
|---|---|---|---|---|
| JP4794390B2 (ja) * | 2006-08-08 | 2011-10-19 | 大成建設株式会社 | 杭基礎補強構造および補強方法 |
-
2018
- 2018-04-13 WO PCT/JP2018/015526 patent/WO2018193984A1/ja not_active Ceased
- 2018-04-13 JP JP2019513605A patent/JP6708789B2/ja active Active
Patent Citations (6)
| Publication number | Priority date | Publication date | Assignee | Title |
|---|---|---|---|---|
| WO2005063001A1 (es) * | 2003-12-26 | 2005-07-14 | Instituto Madrileño De Investigación Agraría Y Alimentaria (Imia) | Simulador de lluvia para estudios medioambientales |
| JP2006038511A (ja) * | 2004-07-23 | 2006-02-09 | Tokyo Univ Of Agriculture & Technology | 土壌分析方法及び土壌分析装置 |
| JP2006115768A (ja) * | 2004-10-21 | 2006-05-11 | Oji Paper Co Ltd | 植物管理方法 |
| JP2008206421A (ja) * | 2007-02-23 | 2008-09-11 | Kansai Electric Power Co Inc:The | マングローブの生長予測システム、マングローブの植林適地判定システム、マングローブの生長予測方法、及びマングローブの植林適地判定方法 |
| JP2015132863A (ja) * | 2012-04-27 | 2015-07-23 | 住友林業株式会社 | 生産活動と生産地の保全を統合した排出権創出方法 |
| WO2016043007A1 (ja) * | 2014-09-17 | 2016-03-24 | 住友林業株式会社 | 樹木成長の簡易予測法 |
Non-Patent Citations (1)
| Title |
|---|
| KELLISON R C: "Increased wood production from matching species to site", TAPPI ANNU MEET, vol. 1979, 1979, pages 195 - 201 * |
Cited By (2)
| Publication number | Priority date | Publication date | Assignee | Title |
|---|---|---|---|---|
| JP2021197084A (ja) * | 2020-06-18 | 2021-12-27 | 日本森林総研株式会社 | サーバ、森林データ利用システム、森林データ利用方法およびプログラム |
| CN119044447A (zh) * | 2024-08-20 | 2024-11-29 | 山东航空学院 | 基于知识图谱的滨海盐碱地土壤团聚体有机碳含量测定方法 |
Also Published As
| Publication number | Publication date |
|---|---|
| JP6708789B2 (ja) | 2020-06-10 |
| JPWO2018193984A1 (ja) | 2019-11-07 |
Similar Documents
| Publication | Publication Date | Title |
|---|---|---|
| Babst et al. | Toward consistent measurements of carbon accumulation: A multi-site assessment of biomass and basal area increment across Europe | |
| Laubhann et al. | The impact of atmospheric deposition and climate on forest growth in European monitoring plots: An individual tree growth model | |
| Nilsen et al. | Thinning intensity effects on carbon and nitrogen stores and fluxes in a Norway spruce (Picea abies (L.) Karst.) stand after 33 years | |
| Mills et al. | New stomatal flux-based critical levels for ozone effects on vegetation | |
| Zanchi et al. | Modelling the effects of management intensification on multiple forest services: a Swedish case study | |
| PALUCH et al. | Effect of local species composition on topsoil properties in mixed stands with silver fir (Abies alba Mill.) | |
| Romanyà et al. | Productivity of Pinus radiata plantations in Spain in response to climate and soil | |
| Nair | Methodological challenges in estimating carbon sequestration potential of agroforestry systems | |
| Shi et al. | Spatial variation of soil respiration is linked to the forest structure and soil parameters in an old-growth mixed broadleaved-Korean pine forest in northeastern China | |
| Chertov et al. | Influence of climate change, fire and harvest on the carbon dynamics of black spruce in Central Canada | |
| Sharma et al. | Characterization of spatial variability of soil parameters in apple orchards of Himalayan region using geostatistical analysis | |
| De Pascale et al. | Water and fertilization management of vegetables: State of art and future challenges | |
| Ewers et al. | Effects of hydraulic architecture and spatial variation in light on mean stomatal conductance of tree branches and crowns | |
| Latterini et al. | Short-term physicochemical and biological impacts on soil after forest logging in Mediterranean broadleaf forests: 15 years of field studies summarized by a data synthesis under the meta-analytic framework | |
| Velázquez-Martí et al. | Calculation of biomass volume of citrus trees from an adapted dendrometry | |
| Shi et al. | Variability of soil respiration at different spatial scales in temperate forests | |
| JP6708789B2 (ja) | 植林地の生産性の予測方法 | |
| Paul et al. | Using measured stocks of biomass and litter carbon to constrain modelled estimates of sequestration of soil organic carbon under contrasting mixed-species environmental plantings | |
| Ozdemir et al. | Biomass estimation of individual trees for coppice-originated oak forests | |
| Moradi et al. | Land-use change in the Zagros forests and its impact on soil carbon sequestration | |
| Zellers et al. | Development of allometric leaf area models for intensively managed black walnut (Juglans nigra L.) | |
| Nikolova et al. | Combining tree-ring analyses on stems and coarse roots to study the growth dynamics of forest trees: a case study on Norway spruce (Picea abies [L.] H. Karst) | |
| Liu et al. | Dynamic simulation of the multilayer crown net photosynthetic rate and determination of the functional crown for larch (Larix olgensis) trees | |
| Ojekanmi et al. | Calibration and application of quality-scoring functions using soil-forest productivity relationships in land reclamation | |
| Turner et al. | Analysing inter-rotational productivity and nutrition in a New South Wales radiata pine plantation |
Legal Events
| Date | Code | Title | Description |
|---|---|---|---|
| 121 | Ep: the epo has been informed by wipo that ep was designated in this application |
Ref document number: 18787658 Country of ref document: EP Kind code of ref document: A1 |
|
| ENP | Entry into the national phase |
Ref document number: 2019513605 Country of ref document: JP Kind code of ref document: A |
|
| NENP | Non-entry into the national phase |
Ref country code: DE |
|
| 122 | Ep: pct application non-entry in european phase |
Ref document number: 18787658 Country of ref document: EP Kind code of ref document: A1 |