WO2018186473A1 - 超音波観測装置の作動方法、超音波観測装置および超音波観測装置の作動プログラム - Google Patents
超音波観測装置の作動方法、超音波観測装置および超音波観測装置の作動プログラム Download PDFInfo
- Publication number
- WO2018186473A1 WO2018186473A1 PCT/JP2018/014621 JP2018014621W WO2018186473A1 WO 2018186473 A1 WO2018186473 A1 WO 2018186473A1 JP 2018014621 W JP2018014621 W JP 2018014621W WO 2018186473 A1 WO2018186473 A1 WO 2018186473A1
- Authority
- WO
- WIPO (PCT)
- Prior art keywords
- ultrasonic
- data
- model
- observation apparatus
- unit
- Prior art date
- Legal status (The legal status is an assumption and is not a legal conclusion. Google has not performed a legal analysis and makes no representation as to the accuracy of the status listed.)
- Ceased
Links
Images


Classifications
-
- A—HUMAN NECESSITIES
- A61—MEDICAL OR VETERINARY SCIENCE; HYGIENE
- A61B—DIAGNOSIS; SURGERY; IDENTIFICATION
- A61B8/00—Diagnosis using ultrasonic, sonic or infrasonic waves
- A61B8/12—Diagnosis using ultrasonic, sonic or infrasonic waves in body cavities or body tracts, e.g. by using catheters
-
- A—HUMAN NECESSITIES
- A61—MEDICAL OR VETERINARY SCIENCE; HYGIENE
- A61B—DIAGNOSIS; SURGERY; IDENTIFICATION
- A61B1/00—Instruments for performing medical examinations of the interior of cavities or tubes of the body by visual or photographical inspection, e.g. endoscopes; Illuminating arrangements therefor
- A61B1/00002—Operational features of endoscopes
- A61B1/00004—Operational features of endoscopes characterised by electronic signal processing
-
- A—HUMAN NECESSITIES
- A61—MEDICAL OR VETERINARY SCIENCE; HYGIENE
- A61B—DIAGNOSIS; SURGERY; IDENTIFICATION
- A61B8/00—Diagnosis using ultrasonic, sonic or infrasonic waves
- A61B8/44—Constructional features of the ultrasonic, sonic or infrasonic diagnostic device
- A61B8/4411—Device being modular
-
- A—HUMAN NECESSITIES
- A61—MEDICAL OR VETERINARY SCIENCE; HYGIENE
- A61B—DIAGNOSIS; SURGERY; IDENTIFICATION
- A61B8/00—Diagnosis using ultrasonic, sonic or infrasonic waves
- A61B8/44—Constructional features of the ultrasonic, sonic or infrasonic diagnostic device
- A61B8/4477—Constructional features of the ultrasonic, sonic or infrasonic diagnostic device using several separate ultrasound transducers or probes
-
- A—HUMAN NECESSITIES
- A61—MEDICAL OR VETERINARY SCIENCE; HYGIENE
- A61B—DIAGNOSIS; SURGERY; IDENTIFICATION
- A61B8/00—Diagnosis using ultrasonic, sonic or infrasonic waves
- A61B8/46—Ultrasonic, sonic or infrasonic diagnostic devices with special arrangements for interfacing with the operator or the patient
- A61B8/461—Displaying means of special interest
- A61B8/463—Displaying means of special interest characterised by displaying multiple images or images and diagnostic data on one display
-
- A—HUMAN NECESSITIES
- A61—MEDICAL OR VETERINARY SCIENCE; HYGIENE
- A61B—DIAGNOSIS; SURGERY; IDENTIFICATION
- A61B8/00—Diagnosis using ultrasonic, sonic or infrasonic waves
- A61B8/52—Devices using data or image processing specially adapted for diagnosis using ultrasonic, sonic or infrasonic waves
- A61B8/5207—Devices using data or image processing specially adapted for diagnosis using ultrasonic, sonic or infrasonic waves involving processing of raw data to produce diagnostic data, e.g. for generating an image
-
- A—HUMAN NECESSITIES
- A61—MEDICAL OR VETERINARY SCIENCE; HYGIENE
- A61B—DIAGNOSIS; SURGERY; IDENTIFICATION
- A61B8/00—Diagnosis using ultrasonic, sonic or infrasonic waves
- A61B8/52—Devices using data or image processing specially adapted for diagnosis using ultrasonic, sonic or infrasonic waves
- A61B8/5215—Devices using data or image processing specially adapted for diagnosis using ultrasonic, sonic or infrasonic waves involving processing of medical diagnostic data
- A61B8/5223—Devices using data or image processing specially adapted for diagnosis using ultrasonic, sonic or infrasonic waves involving processing of medical diagnostic data for extracting a diagnostic or physiological parameter from medical diagnostic data
-
- A—HUMAN NECESSITIES
- A61—MEDICAL OR VETERINARY SCIENCE; HYGIENE
- A61B—DIAGNOSIS; SURGERY; IDENTIFICATION
- A61B8/00—Diagnosis using ultrasonic, sonic or infrasonic waves
- A61B8/52—Devices using data or image processing specially adapted for diagnosis using ultrasonic, sonic or infrasonic waves
- A61B8/5215—Devices using data or image processing specially adapted for diagnosis using ultrasonic, sonic or infrasonic waves involving processing of medical diagnostic data
- A61B8/5238—Devices using data or image processing specially adapted for diagnosis using ultrasonic, sonic or infrasonic waves involving processing of medical diagnostic data for combining image data of patient, e.g. merging several images from different acquisition modes into one image
- A61B8/5246—Devices using data or image processing specially adapted for diagnosis using ultrasonic, sonic or infrasonic waves involving processing of medical diagnostic data for combining image data of patient, e.g. merging several images from different acquisition modes into one image combining images from the same or different imaging techniques, e.g. color Doppler and B-mode
-
- A—HUMAN NECESSITIES
- A61—MEDICAL OR VETERINARY SCIENCE; HYGIENE
- A61B—DIAGNOSIS; SURGERY; IDENTIFICATION
- A61B8/00—Diagnosis using ultrasonic, sonic or infrasonic waves
- A61B8/58—Testing, adjusting or calibrating the diagnostic device
-
- A—HUMAN NECESSITIES
- A61—MEDICAL OR VETERINARY SCIENCE; HYGIENE
- A61B—DIAGNOSIS; SURGERY; IDENTIFICATION
- A61B8/00—Diagnosis using ultrasonic, sonic or infrasonic waves
- A61B8/58—Testing, adjusting or calibrating the diagnostic device
- A61B8/585—Automatic set-up of the device
-
- A—HUMAN NECESSITIES
- A61—MEDICAL OR VETERINARY SCIENCE; HYGIENE
- A61B—DIAGNOSIS; SURGERY; IDENTIFICATION
- A61B8/00—Diagnosis using ultrasonic, sonic or infrasonic waves
- A61B8/58—Testing, adjusting or calibrating the diagnostic device
- A61B8/587—Calibration phantoms
-
- G—PHYSICS
- G01—MEASURING; TESTING
- G01S—RADIO DIRECTION-FINDING; RADIO NAVIGATION; DETERMINING DISTANCE OR VELOCITY BY USE OF RADIO WAVES; LOCATING OR PRESENCE-DETECTING BY USE OF THE REFLECTION OR RERADIATION OF RADIO WAVES; ANALOGOUS ARRANGEMENTS USING OTHER WAVES
- G01S7/00—Details of systems according to groups G01S13/00, G01S15/00, G01S17/00
- G01S7/52—Details of systems according to groups G01S13/00, G01S15/00, G01S17/00 of systems according to group G01S15/00
- G01S7/52017—Details of systems according to groups G01S13/00, G01S15/00, G01S17/00 of systems according to group G01S15/00 particularly adapted to short-range imaging
- G01S7/52023—Details of receivers
- G01S7/52036—Details of receivers using analysis of echo signal for target characterisation
-
- G—PHYSICS
- G01—MEASURING; TESTING
- G01S—RADIO DIRECTION-FINDING; RADIO NAVIGATION; DETERMINING DISTANCE OR VELOCITY BY USE OF RADIO WAVES; LOCATING OR PRESENCE-DETECTING BY USE OF THE REFLECTION OR RERADIATION OF RADIO WAVES; ANALOGOUS ARRANGEMENTS USING OTHER WAVES
- G01S7/00—Details of systems according to groups G01S13/00, G01S15/00, G01S17/00
- G01S7/52—Details of systems according to groups G01S13/00, G01S15/00, G01S17/00 of systems according to group G01S15/00
- G01S7/52017—Details of systems according to groups G01S13/00, G01S15/00, G01S17/00 of systems according to group G01S15/00 particularly adapted to short-range imaging
- G01S7/5205—Means for monitoring or calibrating
-
- G—PHYSICS
- G01—MEASURING; TESTING
- G01S—RADIO DIRECTION-FINDING; RADIO NAVIGATION; DETERMINING DISTANCE OR VELOCITY BY USE OF RADIO WAVES; LOCATING OR PRESENCE-DETECTING BY USE OF THE REFLECTION OR RERADIATION OF RADIO WAVES; ANALOGOUS ARRANGEMENTS USING OTHER WAVES
- G01S7/00—Details of systems according to groups G01S13/00, G01S15/00, G01S17/00
- G01S7/52—Details of systems according to groups G01S13/00, G01S15/00, G01S17/00 of systems according to group G01S15/00
- G01S7/52017—Details of systems according to groups G01S13/00, G01S15/00, G01S17/00 of systems according to group G01S15/00 particularly adapted to short-range imaging
- G01S7/52053—Display arrangements
- G01S7/52057—Cathode ray tube displays
- G01S7/52071—Multicolour displays; using colour coding; Optimising colour or information content in displays, e.g. parametric imaging
-
- G—PHYSICS
- G01—MEASURING; TESTING
- G01S—RADIO DIRECTION-FINDING; RADIO NAVIGATION; DETERMINING DISTANCE OR VELOCITY BY USE OF RADIO WAVES; LOCATING OR PRESENCE-DETECTING BY USE OF THE REFLECTION OR RERADIATION OF RADIO WAVES; ANALOGOUS ARRANGEMENTS USING OTHER WAVES
- G01S7/00—Details of systems according to groups G01S13/00, G01S15/00, G01S17/00
- G01S7/52—Details of systems according to groups G01S13/00, G01S15/00, G01S17/00 of systems according to group G01S15/00
- G01S7/52017—Details of systems according to groups G01S13/00, G01S15/00, G01S17/00 of systems according to group G01S15/00 particularly adapted to short-range imaging
- G01S7/52079—Constructional features
- G01S7/52082—Constructional features involving a modular construction, e.g. a computer with short range imaging equipment
-
- G—PHYSICS
- G16—INFORMATION AND COMMUNICATION TECHNOLOGY [ICT] SPECIALLY ADAPTED FOR SPECIFIC APPLICATION FIELDS
- G16H—HEALTHCARE INFORMATICS, i.e. INFORMATION AND COMMUNICATION TECHNOLOGY [ICT] SPECIALLY ADAPTED FOR THE HANDLING OR PROCESSING OF MEDICAL OR HEALTHCARE DATA
- G16H50/00—ICT specially adapted for medical diagnosis, medical simulation or medical data mining; ICT specially adapted for detecting, monitoring or modelling epidemics or pandemics
- G16H50/20—ICT specially adapted for medical diagnosis, medical simulation or medical data mining; ICT specially adapted for detecting, monitoring or modelling epidemics or pandemics for computer-aided diagnosis, e.g. based on medical expert systems
-
- G—PHYSICS
- G16—INFORMATION AND COMMUNICATION TECHNOLOGY [ICT] SPECIALLY ADAPTED FOR SPECIFIC APPLICATION FIELDS
- G16H—HEALTHCARE INFORMATICS, i.e. INFORMATION AND COMMUNICATION TECHNOLOGY [ICT] SPECIALLY ADAPTED FOR THE HANDLING OR PROCESSING OF MEDICAL OR HEALTHCARE DATA
- G16H50/00—ICT specially adapted for medical diagnosis, medical simulation or medical data mining; ICT specially adapted for detecting, monitoring or modelling epidemics or pandemics
- G16H50/30—ICT specially adapted for medical diagnosis, medical simulation or medical data mining; ICT specially adapted for detecting, monitoring or modelling epidemics or pandemics for calculating health indices; for individual health risk assessment
-
- A—HUMAN NECESSITIES
- A61—MEDICAL OR VETERINARY SCIENCE; HYGIENE
- A61B—DIAGNOSIS; SURGERY; IDENTIFICATION
- A61B1/00—Instruments for performing medical examinations of the interior of cavities or tubes of the body by visual or photographical inspection, e.g. endoscopes; Illuminating arrangements therefor
- A61B1/00002—Operational features of endoscopes
- A61B1/00057—Operational features of endoscopes provided with means for testing or calibration
-
- A—HUMAN NECESSITIES
- A61—MEDICAL OR VETERINARY SCIENCE; HYGIENE
- A61B—DIAGNOSIS; SURGERY; IDENTIFICATION
- A61B1/00—Instruments for performing medical examinations of the interior of cavities or tubes of the body by visual or photographical inspection, e.g. endoscopes; Illuminating arrangements therefor
- A61B1/00112—Connection or coupling means
- A61B1/00114—Electrical cables in or with an endoscope
-
- A—HUMAN NECESSITIES
- A61—MEDICAL OR VETERINARY SCIENCE; HYGIENE
- A61B—DIAGNOSIS; SURGERY; IDENTIFICATION
- A61B8/00—Diagnosis using ultrasonic, sonic or infrasonic waves
- A61B8/13—Tomography
- A61B8/14—Echo-tomography
-
- A—HUMAN NECESSITIES
- A61—MEDICAL OR VETERINARY SCIENCE; HYGIENE
- A61B—DIAGNOSIS; SURGERY; IDENTIFICATION
- A61B8/00—Diagnosis using ultrasonic, sonic or infrasonic waves
- A61B8/44—Constructional features of the ultrasonic, sonic or infrasonic diagnostic device
- A61B8/4444—Constructional features of the ultrasonic, sonic or infrasonic diagnostic device related to the probe
-
- A—HUMAN NECESSITIES
- A61—MEDICAL OR VETERINARY SCIENCE; HYGIENE
- A61B—DIAGNOSIS; SURGERY; IDENTIFICATION
- A61B8/00—Diagnosis using ultrasonic, sonic or infrasonic waves
- A61B8/46—Ultrasonic, sonic or infrasonic diagnostic devices with special arrangements for interfacing with the operator or the patient
- A61B8/461—Displaying means of special interest
-
- A—HUMAN NECESSITIES
- A61—MEDICAL OR VETERINARY SCIENCE; HYGIENE
- A61B—DIAGNOSIS; SURGERY; IDENTIFICATION
- A61B8/00—Diagnosis using ultrasonic, sonic or infrasonic waves
- A61B8/46—Ultrasonic, sonic or infrasonic diagnostic devices with special arrangements for interfacing with the operator or the patient
- A61B8/467—Ultrasonic, sonic or infrasonic diagnostic devices with special arrangements for interfacing with the operator or the patient characterised by special input means
- A61B8/469—Ultrasonic, sonic or infrasonic diagnostic devices with special arrangements for interfacing with the operator or the patient characterised by special input means for selection of a region of interest
-
- A—HUMAN NECESSITIES
- A61—MEDICAL OR VETERINARY SCIENCE; HYGIENE
- A61B—DIAGNOSIS; SURGERY; IDENTIFICATION
- A61B8/00—Diagnosis using ultrasonic, sonic or infrasonic waves
- A61B8/52—Devices using data or image processing specially adapted for diagnosis using ultrasonic, sonic or infrasonic waves
- A61B8/5269—Devices using data or image processing specially adapted for diagnosis using ultrasonic, sonic or infrasonic waves involving detection or reduction of artifacts
-
- A—HUMAN NECESSITIES
- A61—MEDICAL OR VETERINARY SCIENCE; HYGIENE
- A61B—DIAGNOSIS; SURGERY; IDENTIFICATION
- A61B8/00—Diagnosis using ultrasonic, sonic or infrasonic waves
- A61B8/56—Details of data transmission or power supply
-
- A—HUMAN NECESSITIES
- A61—MEDICAL OR VETERINARY SCIENCE; HYGIENE
- A61B—DIAGNOSIS; SURGERY; IDENTIFICATION
- A61B8/00—Diagnosis using ultrasonic, sonic or infrasonic waves
- A61B8/56—Details of data transmission or power supply
- A61B8/565—Details of data transmission or power supply involving data transmission via a network
Definitions
- the present invention relates to an operation method of an ultrasonic observation apparatus that observes an observation target tissue using ultrasonic waves, an ultrasonic observation apparatus, and an operation program of the ultrasonic observation apparatus.
- an ultrasonic echo backscattered by the observation target is received by an ultrasonic transducer and converted into an ultrasonic signal, and the converted ultrasonic signal
- a technique for calculating a feature value from a frequency spectrum and imaging the calculated feature value is known (see, for example, Patent Document 1).
- sound wave scattering is a physical phenomenon in which a sound wave can change its traveling direction when the sound wave collides with particles in a medium and exerts a force (this is called interaction).
- the backscattering is a component that returns to the direction of the sound source in the scattering.
- the sound source at this time is an ultrasonic transducer.
- a feature quantity of a frequency spectrum is extracted as an analysis value representing the tissue characteristics of an observation target.
- a feature amount image to which visual information corresponding to the feature amount, for example, color information is added is generated.
- the feature amount image is superimposed on the ultrasonic image based on the ultrasonic signal, and a superimposed image is generated and displayed.
- An operator such as a doctor can diagnose the tissue property of the observation target by looking at the displayed superimposed image.
- Patent Document 1 discloses a technique for correcting an ultrasonic signal according to the degree of deterioration of an ultrasonic probe.
- Patent Document 1 even when the ultrasonic probe is deteriorated, the deterioration of the ultrasonic image is suppressed by performing correction on the acquired signal so that the signal intensity after deterioration approaches the signal intensity before deterioration. can do.
- Patent Document 1 In addition to deterioration of the ultrasonic probe, it is important to perform processing according to the type and individual of the ultrasonic probe and the type of the ultrasonic observation device connected to the ultrasonic probe in terms of generating a superimposed image with high accuracy. is there.
- the technique disclosed in Patent Document 1 does not take into consideration the above-described model differences and individual differences between ultrasonic probes and model differences between ultrasonic observation apparatuses.
- An object of the present invention is to provide an operating method of an acoustic observation apparatus, an ultrasonic observation apparatus, and an operation program for the ultrasonic observation apparatus.
- an operation method of the ultrasonic observation apparatus is an ultrasonic transmission method that transmits ultrasonic waves to an observation target and receives ultrasonic waves backscattered by the observation target.
- An operation method of an ultrasonic observation apparatus that corrects the ultrasonic signal in an ultrasonic observation apparatus that receives an ultrasonic signal acquired by an ultrasonic probe including an ultrasonic transducer, the ultrasonic observation apparatus of the same model
- the first reference data for model difference correction that reflects the model difference, which is the difference depending on the model of the ultrasonic probe to be connected, and the individual of the ultrasonic probe of the same model connected to the ultrasonic observation apparatus of the same model
- An ultrasonic observation apparatus receives an ultrasonic signal acquired by an ultrasonic probe including an ultrasonic transducer that transmits ultrasonic waves to an observation target and receives ultrasonic waves backscattered by the observation target.
- An ultrasonic observation apparatus that corrects the ultrasonic signal in an ultrasonic observation apparatus that performs a model difference correction that reflects a model difference that is a difference depending on a model of the ultrasonic probe connected to the ultrasonic observation apparatus of the same model 1st reference data for use and second reference data for individual difference correction reflecting individual differences that are differences between individuals of the ultrasonic probe of the same model connected to the ultrasonic observation apparatus of the same model
- a correction unit that corrects ultrasonic data based on the ultrasonic signal.
- the ultrasonic observation apparatus is characterized in that, in the above invention, at least one of the first and second reference data is acquired by an echo signal from a reference piece.
- the ultrasonic observation apparatus is characterized in that, in the above-described invention, an analysis unit that analyzes the ultrasonic signal to calculate spectral data, and calculates a feature amount based on the spectral data calculated by the analysis unit.
- a correction unit that corrects the spectral data using the first reference data and the second reference data.
- the ultrasonic observation apparatus is characterized in that, in the above-described invention, an analysis unit that analyzes the ultrasonic signal to calculate spectral data, and calculates a feature amount based on the spectral data calculated by the analysis unit.
- the ultrasonic observation apparatus is the ultrasonic observation apparatus according to the above invention, wherein the first reference data is a frequency distribution of a drive signal, a function of frequency, or the frequency distribution of the ultrasonic observation apparatus or different individuals of the same model.
- the analysis value is based on the function of the frequency.
- the second reference data is based on a frequency component of the sensitivity of the ultrasonic transducer, a function of the frequency, or the frequency component or the function of the frequency. It is an analysis value.
- the ultrasonic observation apparatus includes, in the above invention, an external terminal connected to an external device, an external communication control unit that performs control for acquiring the first and second reference data via the external terminal, and It is characterized by providing.
- the ultrasonic observation apparatus further includes, in the above invention, an input unit that receives input of information on the type and individual of the ultrasonic probe and information on the type of the ultrasonic observation apparatus, and the external communication control unit Controls the acquisition of the second reference data of the individual specified based on the information received by the input unit.
- the ultrasonic observation apparatus further includes a reading unit that reads information capable of identifying an individual of the ultrasonic probe from the ultrasonic probe connected to the external terminal in the above invention, and the external communication control unit is The acquisition of the second reference data of the individual specified based on the information read by the reading unit is controlled.
- the ultrasonic observation apparatus further includes a control unit that performs control to write the first and second reference data in a storage medium of the ultrasonic probe connected to the external terminal in the above invention. It is characterized by that.
- the ultrasonic observation apparatus is the ultrasonic observation apparatus according to the above invention, wherein the correction unit adds or subtracts the first and second reference data for each frequency with respect to the ultrasonic signal. The signal is corrected.
- the correction unit adds or subtracts the first and second reference data for each distance with respect to the ultrasonic signal. The signal is corrected.
- the operation program of the ultrasonic observation apparatus is an ultrasonic program acquired by an ultrasonic probe including an ultrasonic transducer that transmits ultrasonic waves to an observation target and receives ultrasonic waves back-scattered by the observation target.
- the ultrasonic observation apparatus is caused to execute a correction procedure for correcting ultrasonic data based on the ultrasonic signal using the reference data of No. 2.
- FIG. 1 is a block diagram showing a configuration of an ultrasonic diagnostic system including an ultrasonic observation apparatus according to Embodiment 1 of the present invention.
- FIG. 2 is a diagram illustrating a relationship between the reception depth and the amplification factor in the amplification process performed by the transmission / reception unit.
- FIG. 3 is a diagram schematically showing the scanning area of the ultrasonic transducer and the sound ray data.
- FIG. 4 is a diagram schematically showing a data arrangement in RF data on one sound ray of an ultrasonic signal.
- FIG. 5 is a conceptual diagram for explaining a difference in influence on the subject spectrum data caused by individual differences of ultrasonic endoscopes and differences in types of ultrasonic observation apparatuses.
- FIG. 1 is a block diagram showing a configuration of an ultrasonic diagnostic system including an ultrasonic observation apparatus according to Embodiment 1 of the present invention.
- FIG. 2 is a diagram illustrating a relationship between the reception depth and the amplification factor in the a
- FIG. 6 is a diagram for explaining spectrum data acquired in advance.
- FIG. 7 is a diagram for explaining spectrum data acquired in advance.
- FIG. 8 is a diagram illustrating an example of spectrum data calculated by the spectrum correction unit of the ultrasound observation apparatus according to Embodiment 1 of the present invention.
- FIG. 9 is a diagram showing a straight line having as a parameter the corrected feature quantity calculated by the normal feature quantity calculation unit of the ultrasonic observation apparatus according to Embodiment 1 of the present invention.
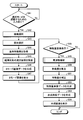
- FIG. 10 is a flowchart showing an outline of processing performed by the ultrasound observation apparatus according to Embodiment 1 of the present invention.
- FIG. 11 is a diagram for explaining a model information selection screen of the ultrasonic endoscope and the ultrasonic observation apparatus.
- FIG. 12 is a diagram for explaining an individual information selection screen of the ultrasonic endoscope.
- FIG. 13 is a flowchart showing an outline of processing executed by the frequency analysis unit of the ultrasonic observation apparatus according to Embodiment 1 of the present invention.
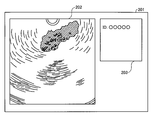
- FIG. 14 is a diagram schematically illustrating a composite image display example in the display device of the ultrasonic observation apparatus according to the first embodiment of the present invention.
- FIG. 15 is a diagram for explaining acquisition of reference spectrum data of the ultrasonic observation apparatus.
- FIG. 16 is a conceptual diagram illustrating a difference in influence on the subject spectrum data caused by individual differences in the ultrasonic endoscope and individual differences in the ultrasonic observation apparatus.
- FIG. 17 is a block diagram showing a configuration of an ultrasonic diagnostic system including the ultrasonic observation apparatus according to Embodiment 2 of the present invention.
- FIG. 18 is a flowchart showing an outline of processing performed by the ultrasound observation apparatus according to Embodiment 2 of the present invention.
- FIG. 19 is a block diagram showing a configuration of an ultrasonic diagnostic system including the ultrasonic observation apparatus according to Embodiment 3 of the present invention.
- FIG. 20 is a block diagram showing a configuration of an ultrasonic diagnostic system provided with an ultrasonic observation apparatus according to Embodiment 4 of the present invention.
- FIG. 21 is a block diagram showing a configuration of an ultrasonic diagnostic system provided with an ultrasonic observation apparatus according to Embodiment 5 of the present invention.
- FIG. 1 is a block diagram showing a configuration of an ultrasound diagnostic system 1 including an ultrasound observation apparatus 3 according to Embodiment 1 of the present invention.
- the ultrasonic diagnostic system 1 shown in the figure includes an ultrasonic endoscope 2 (ultrasonic endoscopes 2A to 2C) that transmits ultrasonic waves to an observation target and receives ultrasonic waves that are backscattered by the observation target.
- An ultrasonic observation device 3 that generates an ultrasonic image based on an ultrasonic signal acquired by the connected ultrasonic endoscope 2, and a display device 4 that displays the ultrasonic image generated by the ultrasonic observation device 3. .
- the ultrasonic observation apparatus 3 can removably connect one of the ultrasonic endoscopes 2A to 2C.
- the ultrasonic endoscope 2 functions as an ultrasonic probe.
- the solid line arrows indicate the transmission of electrical signals, spectral data, and feature quantities related to the image
- the alternate long and short dash line arrows indicate the transmission of the combination model number data
- the broken line arrows indicate the control and others. The transmission of such electrical signals and data is shown.
- the ultrasonic endoscope 2A converts an electrical pulse signal received from the ultrasonic observation device 3 into an ultrasonic pulse (acoustic pulse) and irradiates the observation target at the tip thereof, and backscatters at the observation target.
- an ultrasonic transducer 21A that converts the ultrasonic echo that has been generated into an electrical echo signal that represents a voltage change.
- the ultrasonic endoscopes 2B and 2C have ultrasonic transducers 21B and 21C, respectively.
- the ultrasonic endoscopes 2A to 2C will be described on the assumption that the ultrasonic transducers 21A to 21C included in the endoscopes are different from each other.
- there are other plural ultrasonic endoscopes having different individual numbers For example, when the model of the ultrasonic endoscope 2A is P, for this model P, there are a plurality of ultrasonic endoscopes 2A having different individual numbers.
- the model of the ultrasonic endoscope 2B is Q and the model of the ultrasonic endoscope 2C is R, a plurality of ultrasonic endoscopes 2B having different individual numbers exist for the model Q. For R, there are a plurality of ultrasonic endoscopes 2C having different individual numbers.
- the ultrasonic endoscopes 2A to 2C have a long insertion portion to be observed.
- the insertion part usually has an imaging optical system and an imaging element at its distal end, and when the observation target is a subject inside the human body, its digestive tract (esophagus, stomach, duodenum, large intestine) ), Or inserted into the respiratory tract (trachea, bronchi), and the gastrointestinal tract, respiratory tract, and surrounding organs (pancreas, gallbladder, bile duct, biliary tract, lymph node, mediastinal organ, blood vessel, etc.) can be imaged .
- the insertion unit normally includes a long light guide that guides illumination light to be irradiated onto an observation target during imaging.
- the light guide has a distal end portion reaching the distal end of the insertion portion, and a proximal end portion connected to a light source device that generates illumination light.
- the ultrasonic observation device 3 includes an image generation unit 31 that generates image data based on an echo signal acquired from an ultrasonic endoscope, and writing of reference spectrum data for the image generation unit 31 to generate image data, or A writing / reading unit 32 that performs reading, an external communication control unit 33 that controls communication with the outside when acquiring the reference spectrum data, for example, an existing public line network, a LAN (Local Area Network), a WAN (Wide Area) A network communication unit 34 that acquires reference spectrum data via a communication network realized by a network), a device communication unit 35 that communicates with a device connected to the ultrasound observation apparatus 3, and an input from a keyboard A keyboard input receiving unit 36 to perform, a storage unit 37 for storing various information necessary for the operation of the ultrasound observation apparatus 3, and a super And a control unit 38 that controls the entire ultrasound diagnostic system 1.
- an image generation unit 31 that generates image data based on an echo signal acquired from an ultrasonic endoscope, and writing of reference spectrum data for the image generation unit 31 to generate image data
- the image generation unit 31 is electrically connected to the ultrasonic endoscope 2 and transmits a transmission signal (pulse signal) including a high voltage pulse to the ultrasonic transducer 21 based on a predetermined waveform and transmission timing.
- An echo signal which is an electrical high frequency (RF) signal, is received from the ultrasonic transducer 21, and an A / D conversion process described later is performed on the echo signal to generate digital data (hereinafter referred to as RF data).
- FFT fast Fourier transform
- a frequency analysis unit 313 that calculates subject spectrum data by performing frequency analysis by applying a Fast Fourier Transform
- a frequency analysis unit 313 A spectrum correction unit 314 that generates normal spectrum data by performing correction according to the model and individual of the ultrasound endoscope 2 and the model of the ultrasound observation apparatus 3 on the subject spectrum data calculated by Based on the normal spectrum data generated by the correction unit 314, a normal feature amount calculation unit 315 that calculates a normal feature amount, and color information is given according to the normal feature amount calculated by the normal feature amount calculation unit 315, and the feature amount
- the feature amount image data generated by the feature amount image data generation unit 316 is synthesized on the B mode image data generated by the feature amount image data generation unit 316 that generates image data and the B mode image data generation unit 312.
- a combining unit 317 that generates combined image data.
- the transmission / reception unit 311 amplifies the received echo signal.
- the transmission / reception unit 311 performs processing such as filtering on the amplified echo signal, and then samples and discretizes it at an appropriate sampling frequency (for example, 50 MHz) (so-called A / D conversion processing). Thus, the transmission / reception unit 311 generates discrete RF data from the amplified echo signal, and outputs it to the B-mode image data generation unit 312 and the frequency analysis unit 313.
- the transmission / reception unit 311 includes a multi-beam combining unit corresponding to the plurality of elements. A channel circuit is included.
- the frequency band of the pulse signal transmitted by the transmission / reception unit 311 is a wide band that substantially covers the linear response frequency band of the ultrasonic transducer 21 when the ultrasonic transducer 21 performs electroacoustic conversion of the pulse signal into an ultrasonic pulse.
- various processing frequency bands of the echo signal in the transmission / reception unit 311 are bands that almost cover the linear response frequency band of the ultrasonic transducer 21 when the ultrasonic transducer 21 performs acoustoelectric conversion of the ultrasonic echo into an echo signal. To. Accordingly, it is possible to perform accurate approximation when performing frequency spectrum approximation processing, which will be described later.
- the transmission / reception unit 311 transmits various control signals output from the control unit 38 to the ultrasonic endoscope 2 and various information including an identification ID (for example, model information) from the ultrasonic endoscope 2. May be added to the control unit 38.
- an identification ID for example, model information
- the B-mode image data generation unit 312 performs STC (Sensitivity Time Control) correction in which RF data with a larger reception depth is amplified with a higher amplification factor.
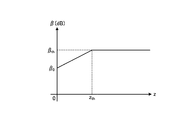
- FIG. 2 is a diagram illustrating the relationship between the reception depth and the amplification factor in the amplification process performed by the transmission / reception unit 311.
- FIG. 2 is a logarithmic graph in which the horizontal axis represents the reception depth and the vertical axis represents the common logarithm of the amplification factor ⁇ .
- the unit of the vertical axis is dB (decibel).
- the reception depth z shown in FIG. 2 is an amount calculated based on the elapsed time from the reception start point of the ultrasonic wave.
- STC Signal Transmission Time Control
- the amplification factor ⁇ increases linearly from ⁇ 0 to ⁇ th (> ⁇ 0 ) as the reception depth z increases. Further, the amplification factor ⁇ takes a constant value ⁇ th when the reception depth z is equal to or greater than the threshold value z th .
- the value of the threshold value z th is such a value that the ultrasonic signal received from the observation target is almost attenuated and the noise becomes dominant.
- the relationship shown in FIG. 2 is stored in the storage unit 37 in advance.
- the B-mode image data generation unit 312 performs bandpass filter and envelope detection on the RF data, and generates data representing the amplitude or intensity of the echo signal.
- the B-mode image data generation unit 312 performs a known process such as logarithmic conversion on the data to generate digital sound ray data.
- data representing the amplitude or intensity of the echo signal is divided by a specific voltage V c (hereinafter referred to as a reference voltage V c ) called a reference voltage, and further converted by taking the common logarithm.
- V c specific voltage
- the converted data is expressed in decibel values.
- a value proportional to a digit representing the amplitude or intensity of an echo signal indicating the intensity of backscattering of an ultrasonic pulse in decimal numbers is along the transmission / reception direction (depth direction) of the ultrasonic pulse. It is a line of data.
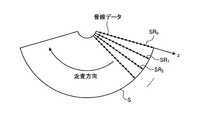
- FIG. 3 is a diagram schematically showing a scanning region (hereinafter, simply referred to as a scanning region) of the ultrasonic transducer 21 and sound ray data.
- the scanning area S shown in FIG. 3 has a sector shape.
- the ultrasonic transducer 21 represents a path (sound ray) along which the ultrasonic wave reciprocates as a straight line, and represents sound ray data as a line on each sound ray.
- numbers are assigned to the sound lines in order from the start of scanning (right side of FIG. 3), and the first sound line is designated SR 1 , 2.
- the second sound line is defined as SR 2
- the third sound line is defined as SR 3
- the kth sound line is defined as SR k .
- FIG. 3 corresponds to the case where the ultrasonic transducer 21 is a convex transducer.
- the reception depth of the sound ray data is described as z.
- the B-mode image data generation unit 312 performs signal processing using known techniques such as gain processing and contrast processing on the sound ray data.
- the B-mode image data generation unit 312 performs coordinate conversion to rearrange the sound ray data so that the generated sound ray data can accurately represent the scanning range, and then performs an interpolation process between the sound ray data. A gap between the sound ray data is filled, and B-mode image data is generated.
- the B-mode image is a grayscale image in which values of R (red), G (green), and B (blue), which are variables when the RGB color system is adopted as a color space, are matched.
- the B-mode image data generation unit 312 outputs the generated B-mode image data to the synthesis unit 317.
- the B-mode image data generation unit 312 includes a general-purpose processor such as a CPU (Central Processing Unit) or a dedicated integrated circuit that performs a specific function such as an ASIC (Application Specific Integrated Circuit) or FPGA (Field Programmable Gate Array). To be realized.
- a general-purpose processor such as a CPU (Central Processing Unit) or a dedicated integrated circuit that performs a specific function such as an ASIC (Application Specific Integrated Circuit) or FPGA (Field Programmable Gate Array).
- the frequency analysis unit 313 divides the RF data (line data) of each sound ray generated by the transmission / reception unit 311 into a plurality of relatively short predetermined time intervals and separates the RF data (hereinafter referred to as “RF data string”).
- the frequency spectrum in each part of the sound ray is calculated.
- “Frequency spectrum” here means “frequency distribution of echo signal intensity and voltage amplitude obtained from a certain reception depth z (that is, a certain round trip distance L) obtained by performing FFT processing on the RF data string.
- the “intensity” here refers to either the voltage amplitude of the echo signal or the power of the echo signal.
- the frequency analysis unit 313 will be described as an example in the case of generating frequency spectrum data (hereinafter also referred to as spectrum data) based on the frequency component V (f, L) of the voltage amplitude. f is the frequency.
- the frequency analysis unit 313 divides the frequency component V (f, L) of the amplitude of the RF data (effectively, the voltage amplitude of the echo signal) by the reference voltage V c and takes the common logarithm (log) and expresses it in decibels.
- observation target spectral data S (f, L) given by the following equation (1) is generated by multiplying by an appropriate positive constant ⁇ .
- S (f, L) ⁇ ⁇ log ⁇ V (f, L) / V c ⁇ (1)
- the frequency spectrum of an echo signal tends to vary depending on the properties of a human tissue scanned with ultrasound when the observation target is a subject such as a human tissue. This is because the frequency spectrum has a correlation with the size, number density, acoustic impedance, and the like of the scatterer that scatters ultrasonic waves.
- characteristics of human tissue refers to the characteristics of tissues such as malignant tumor (cancer), benign tumor, endocrine tumor, mucinous tumor, normal tissue, cyst, and vascular.
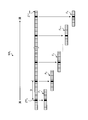
- Figure 4 is a diagram schematically showing a data array in the RF data on one sound ray SR k of the ultrasonic signal.
- a white or black rectangle in the sound ray SR k means data at one sample point.
- the data located on the right side is RF data from a deeper location when measured along the sound ray SR k from the ultrasonic transducer 21 (see the arrow in FIG. 4). reference).
- the RF data on the sound ray SR k is RF data sampled from the echo signal by the A / D conversion process in the transmission / reception unit 311 and discretized.
- the RF data string F K is an abnormal RF data string because the number of data is 12.
- the frequency analysis unit 313 performs the FFT process, calculates the frequency component V (f, L) of the voltage amplitude, and based on the above-described equation (1), the subject spectrum data S (f , L). Further, the frequency analyzing unit 303 repeats this action for all the sound rays shown in FIG. 3 to calculate the spectrum data S (f, L) in all directions and outputs it to the spectrum correcting unit 314.
- azimuth is described as the direction in which each ray data is directed over the entire scanning direction of FIG. 3).
- the spectrum correction unit 314 calculates normal spectrum data S C (f, L) by correcting the subject spectrum data S (f, L) output from the frequency analysis unit 313.
- the parameters are the frequency f and the reception depth z.
- the subject spectrum data is expressed as S (LB; f, z).
- the reference spectrum data obtained when the reference piece is imaged by the combination of the ultrasonic endoscope (P i ) of the model P and the ultrasonic observation apparatus (B m ) of the model B is S (P i B m ; f, z).
- i and m are natural numbers and represent individuals with the same model but different individual numbers. What is indicated by a subscript 0 represents a reference individual of the model.
- the spectrum correction unit 314 obtains reference spectrum data S obtained by imaging a reference piece from subject spectrum data S (LB; f, z) obtained by imaging a living body.
- Normal spectrum data S C (LB; f, z) is calculated by subtracting (P i B m ; f, z).
- S C (LB; f, z) S (LB; f, z) ⁇ S (P i B m ; f, z) ...
- the spectrum correction unit 314 uses the fact that the following formula (3-1) and the following formula (3-2) hold, so that the reference spectrum data S (P i B m ; f, Instead of z), the right side of equation (3-1) or equation (3-2) is used.
- the expressions (3-1) and (3-2) are satisfied will be described later.
- the definitions of the model difference correction term ⁇ S 10 and the individual difference correction term ⁇ S 20 in Expression (3-2) will also be described later.
- the model difference that affects the subject spectrum data is a difference due to a design difference
- the individual difference is a difference due to variation.
- the ultrasonic endoscope 2 as factors affecting the subject spectrum data, the sensitivity difference of the ultrasonic transducer 21 and the frequency characteristic difference thereof, the frequency of wiring such as a cable built in the insertion portion of the ultrasonic endoscope 2 are included. A characteristic difference etc. are mentioned. Among these, the sensitivity difference and the frequency characteristic difference of sensitivity are considered to have a great influence.
- the circuit design in the ultrasonic endoscope 2 that affects these and the physical design such as dimensions / materials do not need to be made equal between the models, so such efforts are not paid and greatly differ between the models. For this reason, it can be considered that the difference in design affects the subject spectrum data.
- variations in sensitivity and frequency characteristics affect even a simple B-mode image that is processed, and it is still a difficult problem in the industry to suppress the influence. Suppressing the influence on the subject spectrum data is also considered a difficult problem. In view of these, the influence on the subject spectrum data due to design differences and variations should not be ignored. Therefore, hereinafter, in the present embodiment, the differences between the types of ultrasound endoscopes and individual differences are handled without ignoring them.
- factors affecting the subject spectrum data include a drive waveform difference (a difference in drive waveform), a frequency characteristic difference in amplification in various receiving circuits in the transmission / reception unit 311, and the like.
- the drive waveform difference is considered to have a great influence.
- the circuit design in the ultrasonic observation apparatus 3 that affects them does not need to be made equal between models, so that no effort is paid, and the circuit design differs greatly between models. For this reason, it can be considered that the difference in design affects the subject spectrum data.
- the variation in the driving waveform and the variation in the frequency characteristic have a considerably smaller influence than the difference in design when shipping inspection is thoroughly conducted.
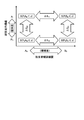
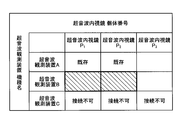
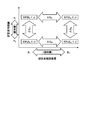
- FIG. 5 is a conceptual diagram for explaining a difference in influence on the subject spectrum data caused by individual differences of ultrasonic endoscopes and differences in types of ultrasonic observation apparatuses.
- Formula (3-1), and Formula (3-2) are established will be described.
- the reference individual P 0 of the model P of the ultrasonic endoscope 2 is connected to the reference individual A 0 of the model A and the reference individual B 0 of the model B, respectively, and the reference spectrum data S (P 0 A 0 ; f , Z) and S (P 0 B 0 ; f, z).
- factors affecting the subject spectrum data include drive waveform differences, frequency characteristic differences of amplification in various receiving circuits in the transmission / reception unit 311, etc., and the ultrasonic observation apparatus 3 has these design differences.
- the frequency spectrum of the drive waveform in model A is V At (f)
- the frequency characteristic of amplification is ⁇ A (f).
- the frequency component V (f, L) of the voltage amplitude that is the basis of the reference spectrum data S (P 0 A 0 ; f, z) includes V At (f) and ⁇ A (f) as multiplication factors.
- the design value that is the basis of the factor affecting the reference spectrum data S (P 0 A 0 ; f, z) is the addition of S (P 0 A 0 ; f, z) itself. It is included as a term.
- the frequency spectrum of the drive waveform in model B is V Bt (f), and the frequency characteristic of amplification is ⁇ B (f).
- the design value that is the basis of the factor affecting the reference spectrum data S (P 0 B 0 ; f, z) is included as an addition term. That is, S (P 0 B 0 ; f, z) includes an addition term of ⁇ ⁇ log V Bt (f) + ⁇ ⁇ log ⁇ B (f) + ⁇ ⁇ log (other factors).
- ⁇ S 10 The difference ⁇ S 10 between the two reference spectrum data is defined by the following equation (5-1).
- ⁇ S 10 S (P 0 B 0 ; f, z) ⁇ S (P 0 A 0 ; f, z) (5-1) Since the reference piece and the ultrasonic endoscope P 0 to be combined are common, common terms are canceled in the subtraction process of Equation (5-1), and the above design difference is obtained. That is, for ⁇ S 10 , the following equation (5-2) is established, and ⁇ S 10 corresponds to a model difference.
- ⁇ S 10 ⁇ ⁇ ⁇ logV Bt (f) ⁇ logV At (f) ⁇ + ⁇ ⁇ ⁇ log ⁇ B (f) ⁇ log ⁇ A (f) ⁇ + ⁇ ⁇ log ⁇ Difference in design values of A and B for other factors ⁇ ... (5-2)
- ⁇ S 10 corresponds to the model difference of the ultrasonic observation apparatus 3. This also place a common ultrasonic endoscope that combines the P 1.
- the difference ⁇ S 11 between the two reference spectrum data is defined by the following equation (6-1).
- ⁇ S 11 S (P i B 0 ; f, z) ⁇ S (P i A 0 ; f, z) (6-1)
- equation (6-2) is established for the same reason as the equation (5-2).
- Equation (3-1) can be derived from the above equation.
- equation (6-4) is obtained by substituting the equations (5-1) and (6-1) into the equation (6-3).
- S (P i B 0 ; f, z) S (P 0 B 0 ; f, z) ⁇ S (P 0 A 0 ; f, z) + S (P i A 0 ; f, z) (6-4)
- Expression (4) since the left side of Expression (6-4) is equal to S (P i B m ; f, z), Expression (3-1) is obtained.
- the reference individual A 0 of the model A of the ultrasonic observation apparatus 3 is connected to the individual P 0 and the individual P i that are the reference individuals of the model P, respectively, and the reference spectrum data S (P 0 A 0 ; f, z) and S (P i A 0 ; f, z) are obtained.
- the factors affecting the subject spectrum data include the sensitivity difference of the ultrasonic transducer 21 and the frequency characteristic difference thereof, the frequency characteristic difference of the wiring such as the cable built in the insertion portion of the ultrasonic endoscope 2, and the like.
- the frequency characteristic of sensitivity in the individual P 0 is ⁇ 0 (f)
- the frequency characteristic of the wiring is ⁇ 0 (f).
- the frequency component V (f, L) of the voltage amplitude that is the basis of the reference spectrum data S (P 0 A 0 ; f, z) includes ⁇ 0 (f) and ⁇ 0 (f) as multiplication factors.
- the design value on which the factor is based is usually V It is included as a multiplication factor of (f, L).
- S (P 0 A 0 ; f, z) is calculated using a common logarithm operation of V (f, L)
- all these factors are S (P 0 A 0 F, z) are included as addition terms. That, S (P 0 A 0; f, z) includes a term of the addition of ⁇ ⁇ log ⁇ 0 (f) + ⁇ ⁇ log ⁇ 0 (f) + ⁇ ⁇ log ( other factors).
- the design value that is the basis of the factor affecting the reference spectrum data S (P 0 A 0 ; f, z) is S (P 0 A 0 ; f, z) itself. Included as addition term.
- the frequency characteristic of sensitivity in the individual P i is ⁇ i (f)
- the frequency characteristic of the wiring is ⁇ i (f).
- S (P i A 0; f, z) includes a term of the addition of ⁇ ⁇ log ⁇ i (f) + ⁇ ⁇ log ⁇ i (f) + ⁇ ⁇ log ( other factors).
- ⁇ S 20 S (P i A 0 ; f, z) ⁇ S (P 0 A 0 ; f, z) (7-1) Since the reference piece and the ultrasonic observation apparatus A 0 to be combined are common, common terms are canceled in the subtraction process of the equation (7-1), and the above-described variation is obtained. That is, for ⁇ S 20 , the following equation (7-2) is established, and ⁇ S 20 corresponds to an individual difference.
- ⁇ S 20 ⁇ ⁇ ⁇ log ⁇ i (f) ⁇ log ⁇ 0 (f) ⁇ + ⁇ ⁇ ⁇ log ⁇ i (f) ⁇ log ⁇ 0 (f) ⁇ + ⁇ ⁇ log ⁇ difference in design values of P i and P 0 for other factors ⁇ ... (7-2)
- ⁇ S 20 corresponds to the individual difference of the ultrasonic endoscope 2. This also place a common ultrasonic observation apparatus combining the B 0.
- the difference ⁇ S 21 between the two reference spectrum data is defined by the following equation (8-1).
- ⁇ S 21 S (P i B 0 ; f, z) ⁇ S (P 0 B 0 ; f, z) (8-1)
- the following equation (8-2) is established for the same reason as the equation (7-2).
- Equation (3-1) can also be derived from the above equation.
- equation (7-1) and equation (8-1) are substituted into equation (8-3) to obtain the following equation (8-4).
- S (P i B 0 ; f, z) S (P 0 B 0 ; f, z) ⁇ S (P 0 A 0 ; f, z) + S (P i A 0 ; f, z) ... (8-4)
- Expression (4) since the left side of Expression (8-4) is equal to S (P i B m ; f, z), Expression (3-1) is also obtained.
- Expression (7-2), Expression (8-2), and Expression (8-3) hold even if the common observation target is changed from the reference piece to the tissue inside the human body. That is, the model difference that affects the reference spectrum data obtained from the above-described reference piece is equal to the model difference that affects the subject spectrum data obtained from a common observation target inside the human body. Therefore, it can be said that it is reasonable to correct the subject spectrum data based on the model difference obtained by the equation (3-1).
- Equation (3-1) the reference spectrum data obtained from the combination of the reference individual and the non-reference individual and the combination of the reference individuals are obtained from Equation (3-1). It can be seen that the model difference can be corrected using the reference spectrum data. Both reference spectrum data can be measured at a factory or the like before shipment to a facility.
- each side length is defined as a difference between reference spectrum data on the plane of FIG.
- the lengths of the four sides are expressed as ⁇ S 10 according to equations (5-1), (6-1), (6-3), (7-1), (8-1), and (8-3).
- ⁇ S 11 , ⁇ S 20 , ⁇ S 21 are equal in length, and are consistent with the definition of a rectangle. That is, assuming that the difference between the reference spectral data is a length, and the arrows representing the differences between the four points depicted in FIG. 5 are ⁇ S 10 , ⁇ S 11 , ⁇ S 20 , ⁇ S 21 , the square of the conceptual diagram is rectangular. It can be considered that the assumption holds without contradiction.
- an individual ultrasonic observation device (here, super Reference spectrum data S (P i B m ; f, z) based on a combination of the sound wave observation apparatus B m ) and an individual ultrasonic endoscope individual P i can be obtained.
- FIG. 6 and 7 are diagrams for explaining spectrum data acquired in advance.
- the type P ultrasonic endoscope P 1 , P 2 ,..., P N
- the model P reference individual at the factory or the like.
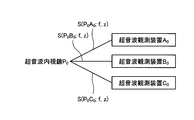
- Spectral data S based on an echo signal from a reference piece, using an ultrasonic endoscope P 0 which is a reference object and ultrasonic observation devices A 0 , B 0 and C 0 which are reference individuals of models A, B and C.
- P 0 A 0 ; f, z S
- S (P 0 B 0 ; f, z) S (P 0 C 0 ; f, z)
- the model difference correction spectrum data for correcting the model difference is acquired.
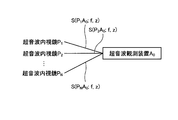
- a reference piece is obtained using each individual of the model P (ultrasound endoscopes P 1 , P 2 ,..., P N ) and the ultrasonic observation apparatus A 0 which is a reference individual of the reference model A.
- Spectral data S (P 1 A 0 ; f, z), S (P 2 A 0 ; f, z),..., S (P N A 0 ; f, z) based on echo signals from (See FIG. 7).
- spectrum data for individual difference correction for correcting individual differences is acquired.
- the reference piece used to acquire the model difference correction spectrum data and the individual difference correction spectrum data is a medium whose material, mass density, sound speed, and acoustic impedance are known, and the material, mass density, sound speed, acoustic impedance, diameter, number.
- a common phantom in which scatterers having a known density are mixed uniformly can be used.
- An acrylic plate may be used as the reference piece. When a phantom is used as the reference piece, spectrum data is generated based on echoes caused by backscattering. When an acrylic plate is used as the reference piece, spectrum data is generated based on echoes caused by total reflection (transmitted wave is 0%, backscattering is 100%).
- the acquired spectrum data for model difference correction and spectrum data for individual difference correction are stored in various storage media (storage unit 37, in-hospital server 101, factory server 102, optical drive 103, USB (Universal Serial Bus) memory 104, etc. ).
- storage media storage unit 37, in-hospital server 101, factory server 102, optical drive 103, USB (Universal Serial Bus) memory 104, etc. ).
- the spectrum correction unit 314 uses the model difference correction spectrum data and the individual difference correction spectrum data that are generated in advance, based on the equation (3-1) or the equation (3-2), and the reference spectrum data S (P i B m ; f, z) is calculated, and the reference spectrum data S (P i B m ; f, z) is subtracted from the subject spectrum data S (LB; f, z). S C (f, L) is calculated.
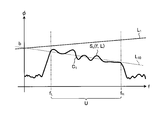
- FIG. 8 is a diagram illustrating an example of normal spectrum data calculated by the spectrum correction unit 314.
- the horizontal axis represents the frequency f.
- the straight line (regression line L 10 ) shown in FIG. 8 will be described later.
- the curve and the straight line are composed of a set of discrete points.
- the lower limit frequency f L and the upper limit frequency f H of the frequency band used for the subsequent calculation are the frequency band of the ultrasonic transducer 21 and the frequency band of the pulse signal transmitted by the transmitting / receiving unit 311. It is a parameter determined based on the above.
- the frequency band determined by the lower limit frequency f L and the upper limit frequency f H is referred to as “frequency band U”.
- the normal feature amount calculation unit 315 calculates a feature amount of normal spectrum data (hereinafter referred to as a pre-correction feature amount) by approximating a plurality of normal spectrum data output from the spectrum correction unit 314 with a straight line, and the pre-correction feature amount.
- the feature quantity is calculated by correcting the frequency-dependent attenuation with respect to the quantity.
- the normal feature quantity calculation unit 315 performs a single regression analysis of spectrum data in a predetermined frequency band and approximates the spectrum data with a linear expression (regression line), thereby calculating a pre-correction feature quantity that characterizes the approximated primary expression.
- a single regression analysis is a regression analysis when there is only one type of independent variable.
- the independent variable of the single regression analysis in this embodiment corresponds to the frequency f.
- the normal feature amount calculation unit 315 performs a single regression analysis in the frequency band U to obtain a regression line L 10 of the spectrum data C 1 .
- a mid-band fit c 0 a 0 f M + b 0 is calculated as a pre-correction feature value.
- the spectral data C 1 is approximated to a linear expression by expressing the spectral data C 1 with the parameters (slope a 0 , intercept b 0 , midband fit c 0 ) of the linear expression characterizing the regression line L 10. become.
- the slope a 0 and the intercept b 0 have a correlation with the size of the scatterer that scatters ultrasonic waves, the scattering intensity of the scatterer, the number density (concentration) of the scatterer, and the like. It is thought that there is.
- the midband fit c 0 gives the intensity of the spectrum at the center within the effective frequency band. Therefore, the midband fit c 0 is considered to have a certain degree of correlation with the brightness of the B-mode image in addition to the size of the scatterer, the scattering intensity of the scatterer, and the number density of the scatterers.
- the normal feature amount calculation unit 315 may approximate the spectrum data with a second-order or higher polynomial by regression analysis.
- the attenuation amount A (f, z) of the amplitude depends on the frequency when the observation target is a living body, and is greatly attenuated at a high frequency and small at a low frequency. In particular, it is empirically known to be proportional to the frequency in a uniform tissue, and is expressed by the following equation (9).
- a (f, z) 2 ⁇ zf (9)
- the proportional constant ⁇ is an amount called an attenuation rate.
- Z is the ultrasonic reception depth
- f is the frequency.
- the value of the attenuation rate ⁇ is stored in advance in the storage unit 37, and the normal feature quantity calculation unit 315 appropriately reads the value of the attenuation rate ⁇ from the storage unit 37 and uses it.
- the ultrasound observation apparatus 3 receives an input of a region name or tissue name to be observed from an operator in advance before transmission of ultrasound by the ultrasound endoscope 2, a normal feature amount calculation unit 315 Reads an appropriate value of the attenuation rate ⁇ corresponding to the part name or tissue name and uses it for the following attenuation correction.
- the normal feature amount calculation unit 315 uses the value for the following attenuation correction.
- the normal feature amount calculation unit 315 uses the above 0.55 dB / cm / MHz for the following attenuation correction.
- the normal feature amount calculation unit 315 performs attenuation correction on the extracted pre-correction feature amount (slope a 0 , intercept b 0 , midband fit c 0 ) according to the following equations (10) to (12). To calculate post-correction feature quantities a, b, and c (hereinafter referred to as normal feature quantities).
- the normal feature amount calculation unit 315 performs correction with a larger normal correction amount as the ultrasonic reception depth z is larger. Further, according to the equation (11), the correction related to the intercept is an identity transformation. This is because the intercept is a frequency component corresponding to a frequency of 0 (Hz) and is not affected by attenuation.
- visual information related to the feature amount for example, variables in a color space constituting a predetermined color system such as hue, saturation, brightness, luminance value, R (red), G (green), and B (blue) are included. Can be mentioned.
- the synthesizing unit 317 synthesizes the B-mode image data generated by the B-mode image data generating unit 312 and the feature amount image data generated by the feature amount image data generating unit 316 to obtain visual information related to the feature amount as B.
- Composite image data superimposed on each pixel of the image in the mode image data is generated.
- the frequency analysis unit 313, the spectrum correction unit 314, the normal feature amount calculation unit 315, the feature amount image data generation unit 316, and the synthesis unit 317 have an analysis range of a specific depth in the scanning region S illustrated in FIG.
- Each of the above-described processes may be performed only in a region of interest (ROI) delimited by a width and an azimuth width (that is, a width in the scanning direction). If the region of interest is limited to a necessary region, the amount of calculation can be reduced and the speed for display can be improved.
- ROI region of interest
- the keyboard 105 is configured by using a plurality of buttons capable of inputting various types of information, and receives input from the operator.
- the keyboard 105 is provided with a touch panel 105a having a display screen.
- the touch panel 105a accepts an input corresponding to the contact position of the operator's finger, for example. Thereafter, the keyboard 105 displays an operation signal including a position (coordinates) touched (touched) by the operator according to an operation icon displayed on the display screen on the touch panel 105a, a button number for identifying the input button, and the like.
- the data is output to the input receiving unit 36.
- the touch panel 105a functions as a graphical user interface (GUI) by displaying ultrasonic images and various types of information. Examples of the touch panel include a resistive film method, a capacitance method, an optical method, and the like, and any type of touch panel is applicable.
- GUI graphical user interface
- the keyboard input reception unit 36 generates a selection signal including information indicating what key and what menu is selected and input in accordance with an operation signal from the keyboard 105, and outputs the selection signal to the external communication control unit 33.
- the external communication control unit 33 if necessary, according to the content of the selection signal from the keyboard input receiving unit 36, a combination model number that associates the types and individuals of the ultrasonic endoscope 2 and the ultrasonic observation apparatus 3. Data is generated and output to the writing / reading unit 32.
- the combination model number data is data in which a model name and an individual number (generally called a serial number) are associated with each other. If necessary, the selection signal itself is output to the writing / reading unit 32. This “when necessary” will be described later.
- the external communication control unit 33 selects a communication unit to be connected when acquiring the reference spectrum data from the network communication unit 34 and the device communication unit 35 based on the read instruction from the writing / reading unit 32, and selects the communication unit.
- the combination model number data and the read instruction are output to the communication unit, and the reference spectrum data is read out.
- the writing / reading unit 32 responds to the content of the selection signal from the external communication control unit 33 and, if necessary, the reference spectrum data suitable for the content of the selection signal from the storage unit 37 (the above-described model difference correction spectrum data). And the individual difference correction spectrum data are read out. At this time, when the corresponding reference spectrum data is not stored in the storage unit 37, the writing / reading unit 32 outputs a read instruction to the external communication control unit 33 so as to read the reference spectrum data.
- the operation of the external communication control unit 33 after outputting the read instruction is as described above.
- the network communication unit 34 transmits the combination model number data to, for example, the in-hospital server 101 in the hospital via the communication network described above, and acquires the reference spectrum data corresponding to the combination model number data.
- the network communication unit 34 may acquire reference spectrum data from the factory server 102 from the hospital server 101 via the Internet.
- the device communication unit 35 acquires reference spectrum data corresponding to the combination model number data by communicating with a device connected to the ultrasonic observation apparatus 3 such as the optical drive 103 or the USB memory 104, for example.
- the optical drive 103 is realized by, for example, a CD drive or a DVD drive.
- the storage unit 37 is generated by the reference spectrum data, a plurality of feature amounts calculated for each frequency spectrum by the normal feature amount calculation unit 315, the B-mode image data generation unit 312, the feature amount image data generation unit 316, and the synthesis unit 317.
- a memory 371a and an HDD (Hard Disk Drive) 371b for storing image data, calculation parameters and data for each process, and the like are provided.
- the HDD 371b has, for example, information necessary for the amplification process (relationship between the amplification factor and the reception depth shown in FIG. 2) and information necessary for the logarithmic conversion process (see Expression (1), for example, ⁇ , V c )), information on window functions (Hamming, Hanning, Blackman, etc.) necessary for frequency analysis processing, and the like are stored.
- the storage unit 37 is provided with a ROM (Read Only Memory) (not shown) in which an operation program for executing the operation method of the ultrasonic observation apparatus 3 is installed in advance as an additional memory.
- the operation program can be recorded on a computer-readable recording medium such as a portable hard disk, a flash memory, a CD-ROM, a DVD-ROM, and a flexible disk, and can be widely distributed.
- the various programs described above can also be obtained by downloading via a communication network.
- the communication network here is realized by, for example, an existing public line network, LAN, WAN, or the like, regardless of whether it is wired or wireless.
- the control unit 38 is realized by using a general-purpose processor such as a CPU having arithmetic and control functions, or a dedicated integrated circuit such as an ASIC or FPGA.
- the control unit 38 reads information such as an operation program stored and stored in the storage unit 37, calculation parameters and data of each process from the storage unit 37 via the writing / reading unit 32, and uses the operation method of the ultrasound observation apparatus 3.
- the ultrasonic observation apparatus 3 is integrated and controlled by executing various related arithmetic processes.
- the control unit 38 may be configured using a general-purpose processor or a dedicated integrated circuit that is common to the image generation unit 31 or the like.
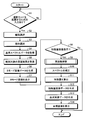
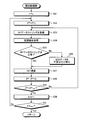
- FIG. 10 is a flowchart showing an outline of processing performed by the ultrasonic observation apparatus 3 having the above configuration.
- a facility such as a hospital to which the operator belongs already has an ultrasound endoscope 2 (individuals P 1 and P 2 ) of model P and an ultrasound observation apparatus 3 of model A, and Description will be made assuming that a new model B observation device 3 is purchased.
- the outline is an action necessary when an operator's operation designates and downloads necessary reference spectrum data, and corrects the subject spectrum data to normal spectrum data using the reference spectrum data.
- step S1 the external communication control unit 33 first determines whether or not there is an input of a selection signal for entering a selection mode for acquiring reference spectrum data from the keyboard input receiving unit 36.
- the selection mode is a user interface mode for designating a model and an individual of an ultrasonic observation apparatus described later. In the selection mode, a model selection screen described in FIG. 11 and an individual selection screen described in FIG. 12 are displayed. . If there is an input of a selection signal for activating the selection mode to the external communication control unit 33 (step S1: Yes), the ultrasound observation apparatus 3 proceeds to step S2. On the other hand, if the selection signal for starting the selection mode is not input to the external communication control unit 33 (step S1: No), the ultrasound observation apparatus 3 repeats the confirmation of the selection signal.
- step S ⁇ b> 2 the external communication control unit 33 outputs an instruction to read out the model list and the connectability information to the writing / reading unit 32.
- the writing / reading unit 32 searches the storage unit 37 to read the model list of the ultrasound observation apparatus 3, the model list of the ultrasound endoscope 2, and the connection availability information between the models stored therein. Output to the external communication control unit 33.
- the external communication control unit 33 generates a model selection screen for the ultrasound endoscope 2 and the ultrasound observation apparatus 3 based on each model list and connection possibility information, and the keyboard 105 receives the keyboard 105 via the keyboard input reception unit 36. It is displayed on the touch panel 105a. Thus, the selection mode is activated.
- This model list can be downloaded from the network communication unit 34, the hospital server 101, and the factory server 102 as necessary, and updated to the latest model list on sale.
- FIG. 11 is a diagram for explaining the model selection screens of the ultrasonic endoscope 2 and the ultrasonic observation apparatus 3.
- the model selection screen displays the model of the ultrasound observation apparatus 3 and the model of the ultrasound endoscope 2.
- the model selection screen displays the models as A, B, C, P, Q, and R, but the model name is actually displayed.
- a combination between models that cannot be connected based on the connection availability information is displayed with the characters “connection is not possible”.
- the surgeon touches the mass corresponding to the combination in accordance with the model installed in the facility and the combination to be used (for example, a portion shown by hatching in FIG. 11).
- the keyboard 105 outputs coordinate information corresponding to the contact position on the touch panel 105a to the keyboard input receiving unit 36 as an operation signal.
- the keyboard input reception unit 36 specifies a combination of the ultrasonic observation apparatus model and the ultrasonic endoscope model corresponding to the selected cell, and outputs the information to the external communication control unit 33 as a selection signal.
- information regarding the model of the ultrasonic endoscope 2 and the model of the ultrasonic observation apparatus 3 is input to the external communication control unit 33.
- the ultrasound observation apparatus 3 proceeds to step S3. For example, when the surgeon touches and finishes one place indicated by hatching in FIG. 11, the model P of the ultrasonic endoscope and the model B of the ultrasonic observation apparatus are selected.
- step S3 the writing / reading unit 32 searches the storage unit 37, generates a list of reference spectrum data stored therein (hereinafter simply referred to as “reference spectrum data list”), and performs external communication. Output to the controller 33.
- reference spectrum data list the file name of each reference spectrum data is associated with the model name and the individual number of the ultrasound endoscope 2 and the ultrasound observation apparatus 3 that are the basis thereof.
- the external communication control unit 33 generates an individual selection screen of the ultrasonic endoscope 2 based on the reference spectrum data list and displays it on the touch panel 105 a of the keyboard 105 via the keyboard input reception unit 36.
- FIG. 12 is a diagram for explaining the individual selection screen of the ultrasonic endoscope 2.
- the model of the ultrasonic observation device 3 and the individual of the ultrasonic endoscope 2 are displayed on the individual selection screen.
- the individual selection screen displays the models A and B and the individuals P 1 , P 2 , and P 3. The individual number is displayed.
- FIG. 12 shows an individual selection screen of an example in which the operator touches one portion indicated by hatching in FIG. 11 to finish the model selection, and the individual P 1 of the model P of the ultrasonic endoscope is shown.
- P 2 and P 3 and model B of the ultrasonic observation apparatus are displayed.
- a combination of reference spectrum data that has already been stored from the reference spectrum data list is displayed as “existing”.
- the surgeon touches the mass corresponding to the combination according to the combination of the individual number of the ultrasonic endoscope provided in the facility and the model of the ultrasonic observation apparatus 3 to be connected (for example, in FIG. 12). (Shown by hatching).
- a plurality of selections can be made by touching a plurality of squares.
- the keyboard 105 outputs coordinate information corresponding to the contact position on the touch panel 105a to the keyboard input receiving unit 36 as an operation signal.
- the keyboard input reception unit 36 specifies the combination of the ultrasonic observation apparatus model, the ultrasonic endoscope model, and the individual corresponding to the selected cell, and outputs the information to the external communication control unit 33 as a selection signal. .
- the external communication control unit 33 is input with information regarding the individual of the same type of the ultrasound endoscope 2 and the model of the ultrasound observation apparatus 3.
- the ultrasonic observation apparatus 3 proceeds to step 4. For example, when the surgeon touches two places indicated by hatching in FIG. 12 and finishes, the individual P 1 and P 2 of the ultrasonic endoscope model P and the model B of the ultrasonic observation apparatus are displayed. It will be selected. The selection mode ends here.
- the external communication control unit 33 receives information about the model of the ultrasonic endoscope 2 and the model of the ultrasonic observation apparatus 3, and the information about the ultrasonic endoscope 2 Combination model number data including information on the individual and the model of the ultrasound observation apparatus 3 is generated and output to the writing / reading unit 32.
- step S4 the writing / reading unit 32 acquires the combination model number data and acquires the reference spectrum data from the storage unit 37, or the network communication unit 34 and / or the device communication unit 35 relates to the selected model and individual.
- the reference spectrum data is read and input to the spectrum correction unit 314.
- the writing / reading unit 32 receives the reference spectrum data from either the network communication unit 34 and / or the device communication unit 35 via the external communication control unit 33. Is read.
- reference spectrum data S (P i B 0 ; f, z) calculated in advance or spectrum data S (P 0 A 0 ; for calculating reference spectrum data, for example) is used.
- spectral data S (P 0 A 0 ; f, z) and S (P 0 B 0 ; f, z) for calculating the reference spectral data, and the reference individual A 0 of the reference model A of the ultrasonic observation apparatus. It is assumed that spectrum data S (P i A 0 ; f, z) using is acquired.
- Steps S1 to S4 are executed when the ultrasound observation apparatus 3 is started up for the first time, or when a selection mode for designating a model and an individual is activated via the keyboard 105 or the like.
- the ultrasonic observation apparatus 3 When the ultrasonic observation apparatus 3 is started up for the second time or later, or when the selection mode is not activated, the ultrasonic observation apparatus 3 performs the processing of the subsequent steps S5 to S14.
- step S5 observation of a subject such as a tissue inside a human body is started in the facility.
- the ultrasonic transducer 21 scans the subject and converts the echo received from the subject into an electrical echo signal.
- the transmission / reception unit 311 receives the echo signal via the ultrasonic endoscope 2.
- the transmission / reception unit 311 amplifies the echo signal.
- the transmission / reception unit 311 samples and discretizes the echo signal amplified at an appropriate sampling frequency (for example, 50 MHz), generates RF data, and outputs the RF data to the B-mode image data generation unit 312 and the frequency analysis unit 313. .
- an appropriate sampling frequency for example, 50 MHz
- step S6 the B-mode image data generation unit 312 performs RF data amplification (STC correction) based on, for example, the relationship between the amplification factor and the reception depth shown in FIG.
- the B mode image data generation unit 312 generates B mode image data using the RF data output from the transmission / reception unit 311, and outputs the B mode image data to the synthesis unit 317.
- step S7 the composition unit 317 outputs the data to the display device 4 as it is without processing the B-mode image data.
- the display device 4 that has received the B-mode image data displays a B-mode image corresponding to the B-mode image data.
- step S8 the control unit 38 confirms whether “display” or “non-display” of the feature amount image is selected in advance through a button or menu (not shown) of the keyboard 105 from the operator.
- the control unit 38 outputs a feature amount image creation start command to each unit constituting the image generation unit 31 (step S8: Yes).
- a feature image creation start command is not issued (step S8: No).
- the image processing unit 31 executes processing after step S9 described later.
- the transmission / reception unit 311 and the B-mode image data generation unit 312 of the ultrasound observation apparatus 3 repeat the processing from step S5 to step S7 regardless of the presence or absence of the feature amount image creation start command. Therefore, while the surgeon instructs “non-display” of the feature amount image via the keyboard 105, the B-mode image is repeatedly displayed on the display device 4 every time the subject is scanned by the ultrasonic transducer 21.
- step S9 when each unit of the image processing unit 31 receives a feature amount image creation start command, first, the frequency analysis unit 313 generates a plurality of RF data (line data) of each sound ray at a relatively short predetermined time interval. The frequency analysis is performed on the RF data of each divided part by FFT calculation. Thus, spectrum data (subject spectrum data) for all RF data strings is calculated (frequency analysis step).
- FIG. 13 is a flowchart showing an outline of processing executed by the frequency analysis unit 313 in step S9.
- the frequency analysis processing will be described in detail with reference to the flowchart shown in FIG.
- step S21 the frequency analysis unit 313 sets the counter k for identifying the sound ray to be analyzed as k 0 .
- This initial value k 0 is the number of the rightmost sound ray in the analysis range in FIG.
- step S22 the frequency analysis unit 313 sets an initial value Z (k) 0 of a data position (corresponding to the reception depth) Z (k) representing a series of RF data strings acquired for the FFT calculation ().
- FIG. 4 shows a case where the eighth data position of the sound ray SR k is set as the initial value Z (k) 0 as described above.
- the initial value Z (k) 0 is a data position representing the shallowest RF data string in the analysis range on the sound ray SR k .
- the frequency analysis unit 313 acquires the RF data string (step S23), and causes the window function stored in the storage unit 37 to act on the acquired RF data string (step S24).
- the window function By applying the window function to the RF data string in this way, it is possible to avoid the RF data string from becoming discontinuous at the boundary and to prevent the occurrence of artifacts.
- the frequency analysis unit 313 determines whether or not the RF data string at the data position Z (k) is a normal RF data string (step S25).
- the RF data string needs to have a data number that is a power of two.
- the number of data of a normal RF data string is 2 n (n is a positive integer).
- the RF data strings F 1 , F 2 , F 3 ,..., F K-1 are all normal.
- step S25 If the result of determination in step S25 is that the RF data string at the data position Z (k) is normal (step S25: Yes), the frequency analysis unit 313 proceeds to step S27 described later.
- step S25 If the result of determination in step S25 is that the RF data string at the data position Z (k) is not normal (step S25: No), the frequency analysis unit 313 inserts zero data for the shortage to obtain a normal RF data string. Generate (step S26). A window function is applied to the RF data string determined to be not normal in step S25 (for example, the RF data string F K in FIG. 5) before adding zero data. For this reason, even if zero data is inserted into the RF data string, data discontinuity does not occur. After step S26, the frequency analysis unit 313 proceeds to step S27 described later.
- step S27 the frequency analysis unit 313 calculates V (f, L) corresponding to the frequency distribution of the voltage amplitude of the echo signal by performing an FFT operation on the RF data string. Thereafter, the frequency analysis unit 313 performs logarithmic conversion processing on V (f, L) to obtain spectrum data S (f, L) (step S27).
- step S28 the frequency analysis unit 313 changes the data position Z (k) by the step width D.
- step width D it is assumed that the storage unit 37 stores in advance the operator's input value via the keyboard 105.
- the frequency analysis unit 313 determines whether or not the data position Z (k) is larger than the maximum value Z (k) max in the sound ray SR k (step S29).
- the maximum value Z (k) max is a data position representing the deepest RF data string in the analysis range on the sound ray SR k .
- the frequency analysis unit 313 increments the counter k by 1 (step S30). This means that the processing is shifted to the next sound ray.
- the frequency analysis unit 313 returns to step S23.
- the frequency analysis unit 313 determines whether or not the counter k is greater than the maximum value k max (step S31). When the counter k is larger than k max (step S31: Yes), the frequency analysis unit 313 ends a series of frequency analysis processing. On the other hand, when the counter k is equal to or less than k max (step S31: No), the frequency analysis unit 313 returns to step S22.
- This maximum value k max is the number of the leftmost sound ray in the analysis range in FIG.
- the frequency analysis unit 313 performs the FFT operation for each depth for each of (k max ⁇ k 0 +1) sound rays in the analysis target region.
- the result of the FFT operation is stored in the storage unit 37 together with the reception depth and the reception direction.
- k 0 , k max , Z (k) 0 , Z (k) max default values that include the entire scanning range of FIG.
- the frequency analysis unit 313 reads these values as appropriate and performs the processing of FIG. When the default value is read, the frequency analysis unit 313 performs frequency analysis processing on the entire scanning range.
- these four values k 0 , k max , Z (k) 0 , and Z (k) max can be changed by inputting an instruction of the region of interest through the keyboard 105 by the operator. When the frequency has been changed, the frequency analysis unit 313 performs the frequency analysis process only in the region of interest for which the instruction is input.
- the spectrum correction unit 314 corrects the plurality of spectrum data calculated by the frequency analysis unit 313.
- the spectrum correction unit 314 uses the reference spectrum data acquired in step S4 and the subject spectrum data calculated in step S9 to obtain a normal value from equations (2), (3-1), and (3-2). Generate spectral data.
- the spectrum correction unit 314 first has the spectrum data S (P 0 A 0 ; f, z) and S (P 0 B 0 ; f, z) and the reference individual A 0 of the reference model A of the ultrasonic observation apparatus.
- the reference spectral data S (P i B 0 ; f, z) is obtained from the spectral data S (P i A 0 ; f, z) using the following equation (3-1) or (3-2). Thereafter, the spectrum correction unit 314 subtracts the reference spectrum data S (P i B m ; f, z) from the subject spectrum data S (LB; f, z) from the equation (2), thereby obtaining the normal spectrum data. S C (LB; f, L) is calculated.
- the reference spectrum data S (P i B 0 ; f, z) may be calculated in advance when the spectrum data is acquired in step S4.
- the normal feature quantity calculation unit 315 calculates a normal feature quantity using the normal spectrum data generated by the spectrum correction unit 314.
- the normal feature amount calculation unit 315 calculates a pre-correction feature amount corresponding to each spectrum data by performing a single regression analysis on each of a plurality of normal spectrum data corresponding to positions within the analysis range generated by the spectrum correction unit 314. .
- the normal feature amount calculation unit 315 approximates each spectrum data with a linear expression by performing a single regression analysis, and calculates a slope a 0 , an intercept b 0 , and a midband fit c 0 as pre-correction feature amounts.
- the regression line L 10 shown in FIG. 8 is a regression line approximated by the normal feature amount calculation unit 315 to the spectrum data C 1 in the frequency band U by single regression analysis.
- the normal feature amount calculation unit 315 calculates the feature amount after attenuation correction by performing attenuation correction using the attenuation rate ⁇ on the feature amount before correction obtained by approximating each spectrum data. And stored in the storage unit 37.
- the feature amount after the attenuation correction is a normal feature amount.
- a straight line L 1 illustrated in FIG. 9 is an example of a straight line obtained by the normal feature amount calculation unit 315 performing attenuation correction processing.
- step S12 the feature amount image data generation unit 316 assigns visual information related to the normal feature amount calculated by the normal feature amount calculation unit 315 in correspondence with each pixel of the image in the B-mode image data. Is generated.
- step S ⁇ b> 13 the synthesis unit 317 combines the B mode image data generated by the B mode image data generation unit 312 and the feature amount image data generated by the feature amount image data generation unit 316, and relates to the feature amount.
- Composite image data in which visual information is superimposed on each pixel of the image in the B-mode image data is generated.
- step S14 the display device 4 displays a composite image corresponding to the composite image data generated by the composite unit 317 under the control of the control unit 38.
- FIG. 14 shows an example of this display.
- a screen 201 shown in the figure includes a composite image display unit 202 that displays a composite image, and an information display unit 203 that displays identification information of an observation target.
- the information display unit 203 may further display feature amount information, approximate expression information, gain and contrast information, and the like.
- a B-mode image corresponding to the composite image may be displayed side by side with the composite image.
- steps S1 to S14 the processes of steps S5 to S7 and the processes of steps S9 to S13 may be performed in parallel.
- the reference spectrum data S (P i ) obtained by imaging the reference piece with respect to the subject spectrum data S (LB; f, z) calculated by the frequency analysis unit 313.
- Embodiment 1 of the present invention highly accurate ultrasonic data can be obtained regardless of the model difference and individual difference between ultrasonic probes and the model difference between ultrasonic observation apparatuses.
- the reference spectrum data is prepared for each model and individual of the ultrasonic endoscope 2 and each model of the ultrasonic endoscope 2 and the ultrasonic observation apparatus 3, it takes time to obtain the reference spectrum data. Therefore, the amount of data to be stored becomes enormous. For example, if there are 1000 individuals for one type of ultrasonic endoscope and each can be connected to one of three types of ultrasonic observation devices, it is necessary to acquire 3000 spectral data in all combinations. is there. Furthermore, spectrum data must be acquired each time a new model or individual is introduced.
- three types of spectrum data for correcting the difference between models acquired from three types of ultrasonic observation devices and a combination of each individual and a predetermined type of ultrasonic observation device It is only necessary to acquire 1003 pieces of spectrum data with 1000 pieces of spectrum data for individual difference correction, and it is not necessary to acquire spectrum data for a new model.
- the individual differences in the sensitivity of the ultrasonic endoscope described above may be corrected when the B-mode image data is generated.
- the B-mode image data generation unit 312 performs correction using ⁇ S 20 described above.
- the analysis band for calculating the feature value is determined by a combination of the model (or individual) of the ultrasonic endoscope and the model of the ultrasonic observation apparatus. Also good.
- analysis band information such as an upper limit frequency and a lower limit frequency of the analysis band, a center frequency, and a bandwidth may be stored in association with the reference spectrum data and used at the time of correction.
- FIG. 15 and 16 are diagrams for explaining the acquisition of the reference spectrum data of the ultrasonic observation apparatus.
- the description has been made on the assumption that there is no individual difference among ultrasonic observation apparatuses. That is, the description has been made on the assumption that the equation (4) is satisfied, but the individual ultrasonic observation apparatus may be further corrected.
- the equations (6-1), (7-1), and (6) -3) From the above-described first embodiment, the following expression (14) is established.
- ⁇ S 31 is an individual difference when the ultrasonic observation apparatus 3 is the individual B 0 of the model B in the ultrasonic endoscope of the individual P 0 of the model P, and ⁇ S 31 is the individual P i of the model P. This is an individual difference in the case of the individual B m of the model B of the ultrasonic observation apparatus 3 in the ultrasonic endoscope.
- ⁇ S 10 represents the model difference of the ultrasonic observation apparatus
- ⁇ S 20 represents the individual difference of the ultrasonic endoscope of the model P
- ⁇ S 30 represents the individual difference of the ultrasonic observation apparatus 3 of the model B. Represents. Further, the following equation (18) is obtained by substituting the equations (5-1), (7-1), and (16) into the equation (17).
- Both reference spectrum data can be measured at a factory or the like before shipment to a facility.
- an individual ultrasonic observation apparatus in this case, the ultrasonic observation apparatus B m
- the reference spectrum data S (P i B m ; f, z) in combination with the mirror individual P i can be obtained even if there are individual differences in the ultrasonic observation apparatus.
- ⁇ S 10 indicating the model difference of the ultrasonic observation apparatus and individual differences of the ultrasonic endoscope
- ⁇ S 30 indicating individual differences of the ultrasonic observation apparatus 3 may be considered. Also in the present modification, as in the first embodiment described above, it is possible to correct the ultrasonic signals in accordance with the model differences and individual differences of the ultrasonic probes and the model differences and individual differences of the ultrasonic observation apparatuses. .
- FIG. 17 is a block diagram showing a configuration of an ultrasonic diagnostic system including the ultrasonic observation apparatus according to Embodiment 2 of the present invention.
- the spectrum correction unit 314 corrects the subject spectrum data to the normal spectrum data and calculates the normal feature amount from the normal spectrum data.
- the subject is corrected.
- An object feature amount is calculated from the spectrum data, and a normal feature amount is calculated by correcting the object feature amount.
- the ultrasonic diagnostic system 1A according to the second embodiment includes an ultrasonic observation device 3A instead of the ultrasonic observation device 3 in contrast to the configuration of the ultrasonic diagnostic system 1 according to the first embodiment described above.
- the ultrasonic observation apparatus 3A includes an image generation unit 31A instead of the image generation unit 31 described above.
- the configuration other than the image generation unit 31A is the same as the configuration of the ultrasonic observation apparatus 3 described above.
- the image generation unit 31A calculates the object feature amount based on the above-described transmission / reception unit 311, the B-mode image data generation unit 312, the frequency analysis unit 313, and the object spectrum data calculated by the frequency analysis unit 313.
- the feature amount calculation unit 318 and the subject feature amount calculated by the subject feature amount calculation unit 318 are corrected according to the model and individual of the ultrasound endoscope 2 and the model of the ultrasound observation apparatus 3A.
- a feature amount correction unit 319 that calculates a normal feature amount
- a feature amount image data generation unit 316 that generates color feature amount image data by adding color information according to the normal feature amount calculated by the feature amount correction unit 319
- B A combining unit that combines the feature amount image generated by the feature amount image data generation unit 316 on the B mode image generated by the mode image data generation unit 312 to generate combined image data.
- the subject feature amount calculation unit 318 calculates the feature amount (pre-correction feature amount) of the subject spectrum data by approximating the plurality of subject spectrum data output from the frequency analysis unit 313 with a straight line, and the pre-correction feature.
- the feature quantity is calculated by correcting the frequency-dependent attenuation with respect to the quantity.
- the feature amount calculation method is the same as that in the first embodiment.
- the feature amount correction unit 319 calculates a normal feature amount by correcting the subject feature amount calculated by the subject feature amount correction unit 318 using the reference feature amount.
- the reference feature quantity at this time is the model feature correction reference feature quantity obtained by regression analysis of the model difference correction spectrum data described above (the first reference for model difference correction according to the second embodiment).
- the feature amount correction unit 319 follows the above-described equation (3-1), and adds or subtracts the reference feature amount for model difference correction and the reference feature amount for individual difference correction from the subject feature amount, thereby adding a normal feature. Calculate the amount.
- the reference feature amount for model difference correction calculated from the spectrum data S (P 0 A 0 ; f, z) and S (P 0 B 0 ; f, z) and the spectrum data S (
- the reference feature quantity for model difference correction and the reference feature quantity for individual difference correction are stored in advance in the storage unit 37 or an external storage medium (such as the hospital server 101 or the optical drive 103 described above).
- FIG. 18 is a flowchart showing an outline of processing performed by the ultrasonic observation apparatus 3A having the above configuration.
- the ultrasound observation apparatus 3A determines whether there is an input of a selection signal for entering a selection mode for acquiring a reference feature value from the keyboard input reception unit 36. Is determined (step S41). If there is an input of a selection signal for activating the selection mode to the external communication control unit 33 (step S41: Yes), the ultrasound observation apparatus 3A proceeds to step S42. On the other hand, if there is no input of a selection signal for starting the selection mode to the external communication control unit 33 (step S41: No), the ultrasound observation apparatus 3A repeats confirmation of the selection information.
- step S42 the external communication control unit 33 outputs an instruction to read out the model list and connection availability information to the writing / reading unit 32.
- the writing / reading unit 32 searches the storage unit 37 to read the model list of the ultrasound observation apparatus 3, the model list of the ultrasound endoscope 2, and the connection availability information between the models stored therein. Output to the external communication control unit 33.
- the external communication control unit 33 generates a model selection screen for the ultrasound endoscope 2 and the ultrasound observation apparatus 3 based on each model list and connection possibility information, and the keyboard 105 receives the keyboard 105 via the keyboard input reception unit 36. It is displayed on the touch panel 105a.
- step S43 the writing / reading unit 32 searches the storage unit 37, generates a list of reference feature values stored in the storage unit 37 (hereinafter simply referred to as “reference feature value list”), and performs external communication. Output to the controller 33.
- reference feature quantity list the model name and the individual number of the ultrasonic endoscope 2 and the ultrasonic observation apparatus 3 that are the basis of the file name of each reference feature quantity are associated with each other.
- the external communication control unit 33 generates an individual selection screen of the ultrasonic endoscope 2 based on the reference feature quantity list, and displays it on the touch panel 105 a of the keyboard 105 via the keyboard input reception unit 36.
- the external communication control unit 33 receives information about the model of the ultrasonic endoscope 2 and the model of the ultrasonic observation apparatus 3, and the information about the ultrasonic endoscope 2 Combination model number data including information on the individual and the model of the ultrasound observation apparatus 3 is generated and output to the writing / reading unit 32.
- step S44 the writing / reading unit 32 acquires the combination model number data and acquires the reference feature amount from the storage unit 37, or the network communication unit 34 and / or the device communication unit 35 relates to the selected model and individual.
- the reference feature value is read and input to the spectrum correction unit 314.
- the writing / reading unit 32 receives the reference feature value from either the network communication unit 34 and / or the device communication unit 35 via the external communication control unit 33. Is read.
- the reference feature amount acquired here is, for example, a feature amount calculated based on the above-described reference spectrum data S (P i B 0 ; f, z).
- Steps S41 to S44 are executed when the ultrasound observation apparatus 3 is started up for the first time, or when a selection mode for designating a model and an individual is activated via the keyboard 105 or the like.
- the ultrasonic observation apparatus 3 executes the processes of subsequent steps S45 to S54.
- step S45 the transmission / reception unit 311 receives via the ultrasonic transducer 21.
- the transmission / reception unit 311 amplifies the echo signal.
- the transmission / reception unit 311 samples and discretizes the echo signal amplified at an appropriate sampling frequency (for example, 50 MHz), generates RF data, and outputs the RF data to the B-mode image data generation unit 312 and the frequency analysis unit 313. .
- step S46 the B-mode image data generation unit 312 performs echo signal amplification (STC correction) based on, for example, the relationship between the amplification factor and the reception depth shown in FIG.
- the B mode image data generation unit 312 generates B mode image data using the RF data after STC correction, and outputs the B mode image data to the synthesis unit 317.
- step S47 the synthesizing unit 317 outputs the data to the display device 4 as it is without processing the B-mode image data.
- the display device 4 that has received the B-mode image data displays a B-mode image corresponding to the B-mode image data.
- step S48 the control unit 38 confirms whether “display” or “non-display” of the feature amount image is selected by the operator via a button or menu (not shown) of the keyboard 105.
- the control unit 38 outputs a feature amount image creation start command to each unit constituting the image generation unit 31A (step S48: Yes).
- the feature image creation start command is not issued (step S48: No).
- the image processing unit 31A executes processing after step S49 described later.
- the transmission / reception unit 311 and the B-mode image data generation unit 312 of the ultrasonic observation apparatus 3A repeat the processing from step S45 to step S47 regardless of the presence or absence of the feature amount image creation start command. Therefore, while the surgeon instructs “non-display” of the feature amount image via the keyboard 105, the B-mode image is repeatedly displayed on the display device 4 every time the ultrasonic transducer 21 scans within the observation target. Is done.
- the frequency analysis unit 313 calculates spectrum data for all the RF data strings by performing frequency analysis on the RF data by FFT calculation (step) S49: Frequency analysis step).
- the frequency analysis process is the same as the process shown in FIG.
- the subject feature amount calculation unit 318 calculates the subject feature amount using the subject spectrum data generated by the frequency analysis unit 313 (step S50).
- the subject feature amount calculation unit 318 performs a single regression analysis on a plurality of subject spectrum data corresponding to positions within the analysis range generated by the frequency analysis unit 313, thereby obtaining a feature amount before correction corresponding to each spectrum data. calculate.
- the subject feature value calculation unit 318 calculates the feature value after attenuation correction by performing attenuation correction using the attenuation rate ⁇ on the feature value before correction obtained by approximating each spectrum data. And stored in the storage unit 37. The feature amount after the attenuation correction becomes the subject feature amount.
- the feature amount correction unit 319 calculates the normal feature amount by correcting the subject feature amount calculated by the subject feature amount calculation unit 318.
- the feature amount correction unit 319 adds or subtracts the reference feature amount for model difference correction and the reference feature amount for individual difference correction acquired in step S44 from the subject feature amount according to the equation (3-1).
- the normal feature amount is calculated by correcting.
- step S52 the feature amount image data generation unit 316 assigns feature amount image data in which visual information related to the normal feature amount calculated by the feature amount correction unit 319 is assigned to each pixel of the image in the B-mode image data. Generate.
- step S53 the synthesis unit 317 synthesizes the B-mode image data generated by the B-mode image data generation unit 312 and the feature amount image data generated by the feature amount image data generation unit 316, and relates to the feature amount.
- Composite image data in which visual information is superimposed on each pixel of the image in the B-mode image data is generated.
- step S54 the display device 4 displays a composite image corresponding to the composite image data generated by the composite unit 317 under the control of the control unit 38.
- steps S41 to S54 the processes of steps S45 to S47 and the processes of steps S49 to S52 may be performed in parallel.
- the normal feature amount is obtained by correcting the subject feature amount using the amount. According to the second embodiment of the present invention, it is possible to correct ultrasonic signals in accordance with the differences in the types and individual differences of the ultrasonic probes and the differences in the types of the ultrasonic observation apparatus 3A.
- FIG. 19 is a block diagram showing a configuration of an ultrasonic diagnostic system including the ultrasonic observation apparatus according to Embodiment 3 of the present invention.
- the ultrasonic endoscope 2 includes a flash memory (FM).
- the ultrasonic endoscope 2 includes flash memories (FM22A, FM22B, FM22C).
- the ultrasonic diagnostic system 1B includes an ultrasonic observation device 3B instead of the ultrasonic observation device 3 in contrast to the configuration of the ultrasonic diagnostic system 1 according to the first embodiment described above.
- the ultrasonic observation apparatus 3B further includes a second writing / reading unit 39 in addition to the configuration of the ultrasonic observation apparatus 3 described above.
- the configuration other than the second writing / reading unit 39 is the same as the configuration of the ultrasonic observation apparatus 3 described above.
- the second writing / reading unit 39 writes / reads the reference spectrum data (including the above-described model difference correction spectrum data and individual difference correction spectrum data) acquired from the network communication unit 34 and / or the device communication unit 35.
- a reading process acquired via the unit 32 and a process of writing the acquired reference spectrum data and the like in the flash memory of the ultrasonic endoscope 2 are performed.
- Embodiment 3 of the present invention since the flash memory (FM22A, FM22B, FM22C) of the ultrasonic endoscope 2 stores the reference spectrum data, this ultrasonic endoscope is stored after storing the reference data.
- the ultrasonic observation device 3 ⁇ / b> B connected to the mirror 2 can acquire the reference spectrum data from the ultrasonic endoscope 2. As a result, it becomes possible to obtain the reference spectrum data by omitting the operator's input operation on the keyboard 105. According to Embodiment 3 of the present invention, the effects of Embodiment 1 described above can be obtained, and the burden on the operator can be reduced.
- FIG. 20 is a block diagram showing a configuration of an ultrasonic diagnostic system provided with an ultrasonic observation apparatus according to Embodiment 4 of the present invention.
- the ultrasonic endoscope 2 includes a ROM.
- the ultrasonic endoscope 2 (ultrasonic endoscopes 2A to 2C) includes ROMs (ROM 23A, ROM 23B, ROM 23C), respectively.
- ROMs ROM 23A, ROM 23B, ROM 23C
- Each ROM stores a model code indicating the model of the ultrasound endoscope 2 and an individual number.
- the ultrasonic diagnostic system 1C includes an ultrasonic observation device 3C instead of the ultrasonic observation device 3 in contrast to the configuration of the ultrasonic diagnostic system 1 according to the first embodiment described above.
- the ultrasonic observation apparatus 3C further includes a second writing / reading unit 39A in addition to the configuration of the ultrasonic observation apparatus 3 described above.
- the configuration other than the second writing / reading unit 39A is the same as the configuration of the ultrasonic observation apparatus 3 described above.
- the second writing / reading unit 39A reads the model code and the individual number from the ROM of the connected ultrasonic endoscope 2.
- the second writing / reading unit 39A outputs the read model code to the external communication control unit 33.
- the external communication control unit 33 uses the ultrasonic endoscope 2 and the ultrasonic wave based on the model code and the individual number input from the second writing / reading unit 39A and the model code of itself (ultrasound observation apparatus 3C). Combination model number data that associates the model and individual with the observation apparatus 3C is generated and output to the writing / reading unit 32.
- the external communication control unit 33 selects a communication unit to be connected when acquiring the reference spectrum data from the network communication unit 34 and the device communication unit 35 based on a read instruction from the communication unit from the writing / reading unit 32. Then, the selected communication unit is controlled to read the reference spectrum data.
- the subsequent processing is the same as steps S5 to S14 in the first embodiment described above.
- the ROM (ROM 23A, ROM 23B, ROM 23C) of the ultrasonic endoscope 2 stores its own model code and individual number.
- 3C acquires the model code and individual number from the ultrasonic endoscope 2, and uses the model code and individual number of the connected ultrasonic endoscope and its own model code. Based on this, it is possible to automatically generate combination model number data and obtain corresponding reference spectrum data. As a result, it is possible to automatically acquire the reference spectrum data by omitting the operator's input operation on the keyboard 105.
- the effects of the first embodiment described above can be obtained, and the burden on the operator can be reduced.
- FIG. 21 is a block diagram showing a configuration of an ultrasonic diagnostic system provided with an ultrasonic observation apparatus according to Embodiment 5 of the present invention.
- the ultrasound endoscope 2 acquires reference spectrum data for individual difference correction using the reference piece 110.
- the reference piece 110 used at this time is, for example, the same phantom or acrylic plate used for reference spectrum data acquired in advance.
- the ultrasonic diagnostic system 1 according to the fifth embodiment has the same configuration as that of the first embodiment described above. Hereinafter, a different part from Embodiment 1 is demonstrated.
- the spectrum correction unit 314 When the ultrasound endoscope 2 acquires an echo signal from the reference piece 110, the spectrum correction unit 314 writes and reads out the subject spectrum data generated by the frequency analysis unit 313 as normal spectrum data without correcting it. 32.
- the writing / reading unit 32 stores the normal spectrum data in the storage unit 37 as spectrum data for individual difference correction.
- the individual difference correcting spectrum data is stored in association with the model of the ultrasonic endoscope 2 and the individual number. In this way, individual difference correction spectrum data can be acquired in a facility such as a hospital.
- the processing in the image generation unit 31 is the same as that in the first embodiment except that the above-described individual difference correction spectrum data is stored in the storage unit 37 in advance.
- spectrum data for individual difference correction is acquired using the ultrasonic endoscope 2 on the market and the reference piece 110. Even if an abnormality in sensitivity occurs, the spectrum data for individual difference correction is acquired using the reference piece 110 at the facility, and the spectrum correction unit 314 includes the reference spectrum data including the spectrum data for individual difference correction. By generating normal spectrum data using, it is possible to perform emergency measures for sensitivity correction.
- an ultrasonic observation apparatus it may be configured by connecting circuits having each function by a bus, or may be configured such that some functions are built in a circuit structure of other functions. .
- the reference piece has a known material, mass density, sound speed, acoustic impedance, diameter, and number density on a medium whose material, mass density, sound speed, and acoustic impedance are known.
- a phantom in which a certain scatterer is uniformly mixed has been described as an example.
- the physical quantity such as the diameter of the scatterer, the scattering intensity of the scatterer, and the number density of the scatterer is known and the distribution is uniform
- the phantom can be replaced with this.
- a specific tissue such as an animal liver may be used as long as the physical quantity is known or accurately measured.
- it is preferable that at least one of the reference data for model difference correction and the reference data for individual difference correction is acquired by an echo signal from the reference piece.
- the ultrasonic endoscope 2 having an optical system such as a light guide has been described as an ultrasonic probe.
- the present invention is not limited to the ultrasonic endoscope 2, and the imaging optical system and An ultrasonic probe that does not have an image sensor may be used.
- a thin ultrasonic miniature probe without an optical system may be applied as the ultrasonic probe.
- Ultrasonic miniature probes are usually inserted into the biliary tract, bile duct, pancreatic duct, trachea, bronchi, urethra, ureter, and used to observe surrounding organs (pancreas, lung, prostate, bladder, lymph nodes, etc.).
- an ultrasonic probe an external ultrasonic probe that irradiates ultrasonic waves from the body surface to be observed may be applied.
- the extracorporeal ultrasonic probe is usually used in direct contact with the body surface when observing an abdominal organ (liver, gallbladder, bladder), breast (particularly mammary gland), and thyroid gland.
- the ultrasonic vibrator 21 may be a linear vibrator, a radial vibrator, or a convex vibrator as long as the models are different from each other.
- the scanning area is rectangular (rectangular, square), and when the ultrasonic transducer is a radial or convex transducer, the scanning area is fan-shaped or annular.
- the ultrasonic endoscope may be one that mechanically scans the ultrasonic transducer, or a plurality of elements are arranged in an array as the ultrasonic transducer, and the elements involved in transmission and reception are switched electronically. Alternatively, electronic scanning may be performed by delaying transmission / reception of each element.
- ultrasonic probe and the ultrasonic observation apparatus are described as being provided separately, the ultrasonic probe and the ultrasonic observation apparatus may be integrated.
- the operation method of the ultrasonic observation apparatus, the ultrasonic observation apparatus, and the operation program of the ultrasonic observation apparatus according to the present invention include the model difference between the ultrasonic probes and the individual difference, and the model between the ultrasonic observation apparatuses. It is useful for obtaining highly accurate ultrasonic data regardless of the difference.
Landscapes
- Health & Medical Sciences (AREA)
- Life Sciences & Earth Sciences (AREA)
- Engineering & Computer Science (AREA)
- Physics & Mathematics (AREA)
- Medical Informatics (AREA)
- Public Health (AREA)
- Biomedical Technology (AREA)
- General Health & Medical Sciences (AREA)
- Pathology (AREA)
- Surgery (AREA)
- Heart & Thoracic Surgery (AREA)
- Animal Behavior & Ethology (AREA)
- Molecular Biology (AREA)
- Veterinary Medicine (AREA)
- Biophysics (AREA)
- Nuclear Medicine, Radiotherapy & Molecular Imaging (AREA)
- Radiology & Medical Imaging (AREA)
- Computer Vision & Pattern Recognition (AREA)
- Computer Networks & Wireless Communication (AREA)
- General Physics & Mathematics (AREA)
- Radar, Positioning & Navigation (AREA)
- Remote Sensing (AREA)
- Epidemiology (AREA)
- Primary Health Care (AREA)
- Databases & Information Systems (AREA)
- Data Mining & Analysis (AREA)
- Physiology (AREA)
- Signal Processing (AREA)
- Optics & Photonics (AREA)
- Computer Hardware Design (AREA)
- General Engineering & Computer Science (AREA)
- Gynecology & Obstetrics (AREA)
- Ultra Sonic Daignosis Equipment (AREA)
Priority Applications (1)
| Application Number | Priority Date | Filing Date | Title |
|---|---|---|---|
| US16/590,927 US20200029939A1 (en) | 2017-04-05 | 2019-10-02 | Operation method of ultrasound observation apparatus, and ultrasound observation apparatus |
Applications Claiming Priority (2)
| Application Number | Priority Date | Filing Date | Title |
|---|---|---|---|
| JP2017-075330 | 2017-04-05 | ||
| JP2017075330A JP6886851B2 (ja) | 2017-04-05 | 2017-04-05 | 超音波観測装置の作動方法、超音波観測装置および超音波観測装置の作動プログラム |
Related Child Applications (1)
| Application Number | Title | Priority Date | Filing Date |
|---|---|---|---|
| US16/590,927 Continuation US20200029939A1 (en) | 2017-04-05 | 2019-10-02 | Operation method of ultrasound observation apparatus, and ultrasound observation apparatus |
Publications (1)
| Publication Number | Publication Date |
|---|---|
| WO2018186473A1 true WO2018186473A1 (ja) | 2018-10-11 |
Family
ID=63712228
Family Applications (1)
| Application Number | Title | Priority Date | Filing Date |
|---|---|---|---|
| PCT/JP2018/014621 Ceased WO2018186473A1 (ja) | 2017-04-05 | 2018-04-05 | 超音波観測装置の作動方法、超音波観測装置および超音波観測装置の作動プログラム |
Country Status (3)
| Country | Link |
|---|---|
| US (1) | US20200029939A1 (https=) |
| JP (1) | JP6886851B2 (https=) |
| WO (1) | WO2018186473A1 (https=) |
Families Citing this family (1)
| Publication number | Priority date | Publication date | Assignee | Title |
|---|---|---|---|---|
| JP6022135B1 (ja) * | 2015-05-13 | 2016-11-09 | オリンパス株式会社 | 超音波診断装置、超音波診断装置の作動方法および超音波診断装置の作動プログラム |
Citations (3)
| Publication number | Priority date | Publication date | Assignee | Title |
|---|---|---|---|---|
| JPH06269452A (ja) * | 1993-03-19 | 1994-09-27 | Olympus Optical Co Ltd | 超音波診断装置 |
| JPH07289553A (ja) * | 1994-04-22 | 1995-11-07 | Hitachi Medical Corp | 超音波断層装置 |
| WO2015008534A1 (ja) * | 2013-07-18 | 2015-01-22 | オリンパスメディカルシステムズ株式会社 | 超音波観測装置、超音波観測装置の作動方法および超音波観測装置の作動プログラム |
-
2017
- 2017-04-05 JP JP2017075330A patent/JP6886851B2/ja active Active
-
2018
- 2018-04-05 WO PCT/JP2018/014621 patent/WO2018186473A1/ja not_active Ceased
-
2019
- 2019-10-02 US US16/590,927 patent/US20200029939A1/en not_active Abandoned
Patent Citations (3)
| Publication number | Priority date | Publication date | Assignee | Title |
|---|---|---|---|---|
| JPH06269452A (ja) * | 1993-03-19 | 1994-09-27 | Olympus Optical Co Ltd | 超音波診断装置 |
| JPH07289553A (ja) * | 1994-04-22 | 1995-11-07 | Hitachi Medical Corp | 超音波断層装置 |
| WO2015008534A1 (ja) * | 2013-07-18 | 2015-01-22 | オリンパスメディカルシステムズ株式会社 | 超音波観測装置、超音波観測装置の作動方法および超音波観測装置の作動プログラム |
Also Published As
| Publication number | Publication date |
|---|---|
| JP6886851B2 (ja) | 2021-06-16 |
| JP2018175059A (ja) | 2018-11-15 |
| US20200029939A1 (en) | 2020-01-30 |
Similar Documents
| Publication | Publication Date | Title |
|---|---|---|
| JP5932183B1 (ja) | 超音波診断装置、超音波診断装置の作動方法および超音波診断装置の作動プログラム | |
| CN106068099B (zh) | 超声波观测装置以及超声波观测装置的工作方法 | |
| JP7162477B2 (ja) | 超音波観測装置、超音波観測装置の作動方法および超音波観測装置の作動プログラム | |
| US11207056B2 (en) | Ultrasound diagnostic apparatus, method for operating ultrasound diagnostic apparatus, and computer-readable recording medium | |
| US11786211B2 (en) | Ultrasound imaging apparatus, method of operating ultrasound imaging apparatus, computer-readable recording medium, and ultrasound imaging system | |
| JP6010274B1 (ja) | 超音波観測装置、超音波観測装置の作動方法および超音波観測装置の作動プログラム | |
| JP7100160B2 (ja) | 超音波観測装置、超音波観測装置の作動方法および超音波観測装置の作動プログラム | |
| JP6886851B2 (ja) | 超音波観測装置の作動方法、超音波観測装置および超音波観測装置の作動プログラム | |
| JP6253869B2 (ja) | 超音波診断装置、超音波診断装置の作動方法および超音波診断装置の作動プログラム | |
| JP2018191779A (ja) | 超音波観測装置 | |
| JP6892320B2 (ja) | 超音波観測装置、超音波観測装置の作動方法および超音波観測装置の作動プログラム | |
| US10219781B2 (en) | Ultrasound observation apparatus, method for operating ultrasound observation apparatus, and computer-readable recording medium | |
| JP6138402B2 (ja) | 超音波観測装置、超音波観測装置の作動方法および超音波観測装置の作動プログラム | |
| JP2017217359A (ja) | 超音波観測装置、超音波観測装置の作動方法、及び超音波観測装置の作動プログラム | |
| WO2021176618A1 (ja) | 超音波画像生成装置、超音波画像生成装置の作動方法、超音波画像生成装置の作動プログラムおよび超音波画像生成回路 | |
| JP2017217313A (ja) | 超音波観測装置、超音波観測装置の作動方法および超音波観測装置の作動プログラム | |
| WO2022054288A1 (ja) | 超音波観測装置、超音波観測装置の作動方法および超音波観測装置の作動プログラム |
Legal Events
| Date | Code | Title | Description |
|---|---|---|---|
| 121 | Ep: the epo has been informed by wipo that ep was designated in this application |
Ref document number: 18781855 Country of ref document: EP Kind code of ref document: A1 |
|
| NENP | Non-entry into the national phase |
Ref country code: DE |
|
| 122 | Ep: pct application non-entry in european phase |
Ref document number: 18781855 Country of ref document: EP Kind code of ref document: A1 |