WO2018173337A1 - 情報提示装置、情報提示方法及びプログラム - Google Patents
情報提示装置、情報提示方法及びプログラム Download PDFInfo
- Publication number
- WO2018173337A1 WO2018173337A1 PCT/JP2017/034697 JP2017034697W WO2018173337A1 WO 2018173337 A1 WO2018173337 A1 WO 2018173337A1 JP 2017034697 W JP2017034697 W JP 2017034697W WO 2018173337 A1 WO2018173337 A1 WO 2018173337A1
- Authority
- WO
- WIPO (PCT)
- Prior art keywords
- histogram
- values
- axes
- selection
- generation unit
- Prior art date
- Legal status (The legal status is an assumption and is not a legal conclusion. Google has not performed a legal analysis and makes no representation as to the accuracy of the status listed.)
- Ceased
Links
Images





Classifications
-
- G—PHYSICS
- G06—COMPUTING OR CALCULATING; COUNTING
- G06F—ELECTRIC DIGITAL DATA PROCESSING
- G06F16/00—Information retrieval; Database structures therefor; File system structures therefor
- G06F16/20—Information retrieval; Database structures therefor; File system structures therefor of structured data, e.g. relational data
- G06F16/26—Visual data mining; Browsing structured data
-
- G—PHYSICS
- G06—COMPUTING OR CALCULATING; COUNTING
- G06T—IMAGE DATA PROCESSING OR GENERATION, IN GENERAL
- G06T11/00—Two-dimensional [2D] image generation
- G06T11/20—Drawing from basic elements
- G06T11/26—Drawing of charts or graphs
-
- G—PHYSICS
- G06—COMPUTING OR CALCULATING; COUNTING
- G06F—ELECTRIC DIGITAL DATA PROCESSING
- G06F16/00—Information retrieval; Database structures therefor; File system structures therefor
- G06F16/20—Information retrieval; Database structures therefor; File system structures therefor of structured data, e.g. relational data
- G06F16/28—Databases characterised by their database models, e.g. relational or object models
- G06F16/283—Multi-dimensional databases or data warehouses, e.g. MOLAP or ROLAP
-
- G—PHYSICS
- G06—COMPUTING OR CALCULATING; COUNTING
- G06F—ELECTRIC DIGITAL DATA PROCESSING
- G06F3/00—Input arrangements for transferring data to be processed into a form capable of being handled by the computer; Output arrangements for transferring data from processing unit to output unit, e.g. interface arrangements
- G06F3/01—Input arrangements or combined input and output arrangements for interaction between user and computer
- G06F3/048—Interaction techniques based on graphical user interfaces [GUI]
- G06F3/0484—Interaction techniques based on graphical user interfaces [GUI] for the control of specific functions or operations, e.g. selecting or manipulating an object, an image or a displayed text element, setting a parameter value or selecting a range
- G06F3/04842—Selection of displayed objects or displayed text elements
-
- G—PHYSICS
- G06—COMPUTING OR CALCULATING; COUNTING
- G06F—ELECTRIC DIGITAL DATA PROCESSING
- G06F3/00—Input arrangements for transferring data to be processed into a form capable of being handled by the computer; Output arrangements for transferring data from processing unit to output unit, e.g. interface arrangements
- G06F3/01—Input arrangements or combined input and output arrangements for interaction between user and computer
- G06F3/048—Interaction techniques based on graphical user interfaces [GUI]
- G06F3/0484—Interaction techniques based on graphical user interfaces [GUI] for the control of specific functions or operations, e.g. selecting or manipulating an object, an image or a displayed text element, setting a parameter value or selecting a range
- G06F3/04847—Interaction techniques to control parameter settings, e.g. interaction with sliders or dials
Definitions
- Embodiments described herein relate generally to an information presentation apparatus, an information presentation method, and a program.
- BI Business Intelligence
- Some BI tools have a function for representing a large number of data accumulated in advance in a PCP (parallel coordinate plot) coordinate system, for example.
- PCP performs processing such that a plurality of values included in one data are plotted (arranged) on a plurality of axes arranged in parallel and each plot point is connected by a line to each of a plurality of data.
- Patent Document 1 US Pat. No. 8,346,682
- Embodiment is intended to provide an information presentation device, an information presentation method, and a program capable of performing visualization suitable for analysis of desired data included in a large number of data.
- the information presentation apparatus includes a plot unit, a histogram generation unit, and a visual information generation unit.
- the plotting unit plots a plurality of values included in each of a plurality of multidimensional data on a plurality of axes in a coordinate system of a parallel coordinate plot.
- the histogram generation unit generates a histogram having a plurality of histogram bars according to the number of values plotted in each of the plurality of sections, while dividing each of the plurality of axes into a plurality of sections.
- the visual information generation unit when one or more values among the values plotted on the plurality of axes are selected as selection values, of the histogram bars generated by the histogram generation unit Visual information that makes it possible to identify the ratio of the number of selected values to the total number of values included in any one histogram bar is generated.
- the information presentation system 1 includes an information presentation device 11 that is a personal computer or the like operated by a user, and a database server 12 connected to the information presentation device 11 via a network NW. Configured.
- FIG. 1 is a diagram illustrating an example of a configuration of an information presentation system according to an embodiment.
- the information presentation apparatus 11 includes a CPU 21, a ROM (Read Only Memory) 22, a RAM (Random Access Memory) 23, an input device 24, an output device 25, and a communication IF (interface). 26).
- the CPU 21 includes an arithmetic unit 21a that performs drawing processing and the like while using the RAM 23 as a working area based on a program stored in the ROM 22. Further, the CPU 21 is configured to include a control unit 21 b that performs control related to the operation of each unit of the information presentation apparatus 11 based on information, instructions, and the like that are input according to the operation of the input device 24.
- the input device 24 is configured to be able to input information, instructions, etc. according to user operations.
- the input device 24 includes, for example, at least one of a keyboard, a mouse, and a touch panel.
- the output device 25 is configured to output information generated according to the processing of the CPU 21 to the outside.
- the output device 25 includes, for example, a display or a printer.
- the communication IF 26 is configured by a device capable of transmitting and receiving data and the like to and from the database server 12 via the network NW.
- the database server 12 stores a plurality of multidimensional data that can be output in a format that can be used in a process related to data visualization (hereinafter abbreviated as “data visualization process”) such as CSV format. ing.
- data visualization process a process related to data visualization
- Each multidimensional data stored in the database server 12 includes a plurality of values that can be plotted (arranged) on a plurality of axes in the PCP coordinate system.
- FIG. 3 is a flowchart illustrating a specific example of processing performed in the information presentation apparatus according to the embodiment.
- the computing unit 21a performs a drawing process for displaying the plurality of multidimensional data in the PCP coordinate system based on the plurality of multidimensional data read from the database server 12 via the network NW (step S1 in FIG. 3). ). That is, the calculation unit 21a having a function as a plotting unit plots (places) a plurality of values included in each of a plurality of multidimensional data read from the database server 12 on the vertical axis in the PCP coordinate system. I do. In the present embodiment, it is assumed that a drawing process corresponding to a predetermined drawing engine such as a Web browser is performed in the calculation unit 21a.
- the calculation unit 21a performs a drawing process for displaying a histogram on the vertical axis of the PCP coordinate system included in the processing result of step S1 of FIG. 3 (step S2 of FIG. 3).
- the histogram is expressed as a bar shape figure originally used for visually recognizing the data distribution state, such as a figure corresponding to the measurement value D in FIG. .
- the bar-shaped graphic is represented by a bar graph that is separated from each other because the measured value is a discrete value such as an attribute. This is also referred to as a histogram for convenience.
- each histogram bar included in the histogram (hereinafter, a bar-shaped figure constituting the histogram is referred to as “histogram bar”) is a horizontally long object starting from the vertical axis of the PCP coordinate system.
- FIG. 4 is a flowchart illustrating a specific example of processing performed in the information presentation apparatus according to the embodiment.
- the calculation unit 21a performs processing for discretizing the vertical axis in the PCP coordinate system for each predetermined value (step S21 in FIG. 4).
- the calculation unit 21a sets a bar width W that is the width of the histogram bar on the vertical axis of the PCP coordinate system based on the processing result of step S21 of FIG. 4 (step S22 of FIG. 4). Note that the bar width W may be changed according to the operation of the input device 24 by the user, for example.
- the calculation unit 21a determines the number NP of values (plot points) plotted within the section of the bar width W set by the process of step S22 in FIG. 4 among the values plotted on the vertical axis of the PCP coordinate system. Is counted (step S23 in FIG. 4). Further, the calculation unit 21a stores the number NP obtained by the process of step S23 of FIG. 4 in the RAM 23 in association with each section of the bar width W.
- the computing unit 21a sets a bar length L that is the length of the histogram bar extending in the horizontal direction of the PCP coordinate system according to the size of the number NP counted in step S23 of FIG. 4 (step S24 of FIG. 4). ).
- the calculation unit 21a determines whether or not the bar length L is set in all the sections in which the bar width W is set on the vertical axis of the PCP coordinate system (step S25 in FIG. 4).
- the calculation unit 21a When there is a section in which the bar length L is not set among all the sections in which the bar width W is set (S25: NO), the calculation unit 21a repeatedly performs the processing from step S23 in FIG. Further, when the bar length L is set in all the sections in which the bar width W is set (S25: YES), the calculation unit 21a displays a histogram including a plurality of histogram bars on the vertical axis in the PCP coordinate system. After performing the drawing process for display (step S26 in FIG. 4), the series of processes in FIG. 4 is terminated.
- the calculation unit 21a having a function as a histogram generation unit divides each vertical axis of the PCP coordinate system into a plurality of sections, and according to the number of values plotted in each of the plurality of sections. A process for generating a histogram having a plurality of histogram bars is performed.
- the control unit 21b performs control for displaying a display image including information as shown in FIG. 5 on the screen of the output device 25 based on the processing result of step S2 in FIG. Specifically, the control unit 21 b is drawn on a plurality of vertical axes 31 constituting the PCP coordinate system, a horizontal line 32 connecting the points plotted on the vertical axis 31, and an upper part of the vertical axis 31. Control for displaying on the screen of the output device 25 a display image including a knob 33a, a knob 33b drawn below the vertical axis 31, and a histogram bar 34 extending horizontally from the vertical axis 31.
- FIG. 5 is a diagram illustrating an example of information displayed in the information presentation apparatus according to the embodiment.
- the knob 33a is drawn as an interface capable of adjusting the upper limit of each value plotted on the vertical axis 31 according to the operation of the input device 24 by the user.
- the knob 33b is drawn as an interface capable of adjusting the lower limit of each value plotted on the vertical axis 31 according to the operation of the input device 24 by the user.
- Data ID in FIG. 5 indicates a unique number assigned in advance to each multidimensional data read from the database server 12. Further, “Measured value A”, “Measured value B”, “Measured value C”, “Measured value D”, “Measured value E”, and “Measured value F” in FIG. Names of attributes or units of a plurality of values included in the dimension data are shown. Specifically, in FIG. 5, for example, “measured value B” represents an attribute such as an individual, and other measured values other than “measured value B” are numerical values measured corresponding to the individual. Represents.
- each of the vertical axes 31 of “measurement value A” to “measurement value F” in FIG. 5 is a drawing target of the histogram, and the vertical axis 31 of “data ID” in FIG.
- An explanation will be given by taking as an example a case where it is excluded from the drawing target of the histogram (because it is the reference axis in the PCP coordinate system).
- the positions of at least some of the plot points plotted on the vertical axis 31 of the PCP coordinate system are set so that the horizontal lines 32 do not overlap as much as possible. It shall be adjusted so that
- the control unit 21b detects whether one of the knobs 33a or 33b included in the display image displayed in accordance with the process in step S2 in FIG. 3 has been operated (step S3 in FIG. 3).
- step S5 When the operation of the knobs 33a and 33b cannot be detected (S3: NO), the control unit 21b continues the process of step S5 in FIG. Further, when the control unit 21b detects that either the knob 33a or 33b is operated (S3: YES), the control unit 21b corresponds to each plot point outside the range sandwiched between the knobs 33a and 33b. Processing for hiding the horizontal line 32 (step S4 in FIG. 3), and processing for updating (setting) the bar length L of each histogram bar 34 in a state where the respective plot points are excluded (FIG. 3). Step S4) is performed by the calculation unit 21a, and then the process of Step S5 in FIG.
- the computing unit 21a identifies the vertical axis 31 in which either the knob 33a or 33b is operated in accordance with the control in step S4 in FIG. 3, and the range sandwiched between the knobs 33a and 33b on the identified vertical axis 31 By detecting each plot point that is out of the range and excluding the horizontal line 32 corresponding to the multidimensional data including the detected plot point from the drawing target, the horizontal line 32 corresponding to each plot point is hidden. To. Further, the calculation unit 21a performs the processing from step S23 to step S25 in FIG. 4 in a state in which each plot point outside the range sandwiched between the knobs 33a and 33b is excluded according to the control in step S4 in FIG.
- each histogram bar 34 is updated by performing the same processing as. For example, when the knob 33 b of the vertical axis 31 corresponding to “measured value C” in FIG. 5 is operated, a display image including information as shown in FIG. 6 is displayed on the screen of the output device 25. .
- FIG. 6 is a diagram for explaining an example when the knob is operated.
- each histogram bar is set according to the number of values included in the range.
- the control unit 21b detects whether or not an operation for selecting one or more values on the vertical axis 31 included in the display image displayed in accordance with the process of step S2 in FIG. 3 step S5). In other words, the control unit 21b selects, in step S5 in FIG. 3, a selection range for selecting one or more values on the vertical axis 31 included in the display image displayed in accordance with the process in step S2 in FIG. It is detected whether or not an operation related to the setting is performed.
- step S6 in FIG. 3 a process for displaying a stack that is a stacked bar-shaped figure (see FIG. 8) and a process for emphasizing the horizontal line 32 corresponding to each selected value ( Step S7) of FIG. 3 is performed by the calculation unit 21a.
- FIG. 7 is a flowchart illustrating a specific example of processing performed in the information presentation apparatus according to the embodiment.
- the calculating unit 21a determines whether or not the bar length L of each histogram bar 34 is aligned to a certain length (step S61 in FIG. 7).
- step S63 the bar length L of each histogram bar 34 is included in each histogram bar.
- step S62 the processing for updating the value (plot point) number NP to a predetermined length LP that is a length of 100% (step S62 in FIG. 7)
- step S63 the processing in step S63 in FIG. To continue.
- step S61 in FIG. 7 is performed based on whether or not the control unit 21b performs control according to an operation for aligning the bar length L of each histogram bar 34 to a certain length. It may be a thing, or it may be performed based on whether or not a predetermined length LP has been set. Further, hereinafter, for convenience of explanation, the case where the process of step S62 in FIG. 7 is not performed will be described as a main example.
- the calculating unit 21a acquires the total number NA of values included in the histogram bar 34 (step S63 in FIG. 7). Specifically, for example, when the knobs 33a and 33b are not operated, the calculation unit 21a acquires the number NP obtained by the process of step S23 of FIG. 4 as the total number NA. Further, for example, when either the knob 33a or 33b is operated, each plot deviated from the range sandwiched between the knobs 33a and 33b from the number NP obtained by the process of step S23 in FIG. The total number NA is obtained by subtracting the number of points.
- the calculation unit 21a counts the number NS of the selection values included in the total number NA obtained by the process of step S63 in FIG. 7 (step S64 in FIG. 7). Further, the computing unit 21a stores the number NS obtained by the process of step S64 of FIG. 7 in the RAM 23 in association with each histogram bar 34.
- the arithmetic unit 21a Based on the bar length L, the total number NA, and the number NS, the arithmetic unit 21a performs processing for setting the ratio of the number NS to the total number NA in the histogram bar 34 as the stack length (FIG. 7). Step S65).
- the calculation unit 21a determines whether or not the stack length is set in each histogram bar 34 (step S66 in FIG. 7).
- the calculation unit 21a When there is a histogram bar 34 for which the stack length is not set (S66: NO), the calculation unit 21a repeatedly performs the processing from step S63 in FIG. In addition, when the stack length is set in each histogram bar 34 (S66: YES), the arithmetic unit 21a performs a drawing process for displaying the stack (step S67 in FIG. 7), 7 is completed.
- the calculation unit 21a having a function as a visual information generation unit is selected when one or more values among the values plotted on the plurality of vertical axes of the PCP coordinate system are selected as selection values.
- visual information for making it possible to identify the ratio of the number of selected values to the total number of values included in any one histogram bar among the histogram bars generated by the process of step S2 of FIG. A process for generating a stack of the ratio in each histogram bar is performed.
- the calculation unit 21a performs a drawing process for highlighting the horizontal lines 32 corresponding to the selected value of the total number NA obtained by the process of step S63 in FIG. 7 (step S7 in FIG. 3), and then in FIG. A series of processing ends.
- step S5 of FIG. 3 for example, when the values included in the three histogram bars 34 adjacent to the lower part of the vertical axis 31 of “measured value F” in FIG. Performs control for displaying a display image including information as shown in FIG. 8 on the screen of the output device 25.
- the control unit 21b includes a plurality of vertical axes 31, horizontal lines 32, knobs 33a and 33b, a histogram bar 34, a stack 35 drawn inside the histogram bar 34, and the steps of FIG. Control for displaying a display image including the selection frame 41 indicating the selection range including the selection value selected in S5 on the screen of the output device 25 is performed.
- FIG. 8 is a diagram illustrating an example of information displayed in the information presentation apparatus according to the embodiment.
- the selection frame 41 is drawn as a rectangular frame according to the operation of the input device 24 by the user.
- the selection frame 41 is drawn as a rectangular frame according to, for example, a mouse drag operation or a touch panel touch operation by the user.
- the stack 35 in FIG. 8 is drawn in a state in which a region having a length corresponding to the ratio of the number NS to the total number NA in the histogram bar 34 is uniformly filled with a predetermined color. In the present embodiment, for example, when the ratio of the number NS to the total number NA is zero, the inside of the histogram bar 34 is not filled.
- the stack 35 included in the display image of FIG. 8 displays each selected value selected so as to satisfy the condition that it is plotted within the selection range of the selection frame 41 on the vertical axis 31 of the “measurement value F”.
- the included multidimensional data is visualized as information that can be analyzed as to what values each vertical axis 31 other than the “measurement value F” has. Further, according to FIG.
- each horizontal line 32 connecting the plurality of histogram bars 34 on which the stack 35 is drawn, that is, each horizontal line 32 corresponding to multidimensional data including a selection value selected by the selection frame 41 is displayed.
- Visualized in an emphasized state Therefore, according to the present embodiment, visualization suitable for analyzing desired data included in a large number of data can be performed.
- step S62 of FIG. 7 that is, the process of aligning the bar length L of each histogram bar 34 to a certain length is performed, as shown in FIG.
- a display image including various information is displayed on the screen of the output device 25.
- the stack 35 in FIG. 9 is drawn in a state in which a region having a length corresponding to the ratio of the number NS of selected values to the total number NA is uniformly filled with a predetermined color inside the histogram bar 34 having a predetermined length LP. ing. Therefore, when the process of step S62 in FIG. 7 is performed, for example, the visibility of the stack 35 drawn inside the histogram bar 34 having a small total number NA can be improved.
- FIG. 9 is a diagram for explaining an example in which the bar lengths of the histogram bars are aligned to a certain length.
- step S5 of FIG. 3 not only one selection range corresponding to the selection frame 41 is set, but a plurality of selection ranges corresponding to a plurality of selection frames are set. You may do it.
- the calculation unit 21a of the present embodiment has a case where a plurality of selection ranges for selecting a selection value are set on two or more vertical axes of a plurality of vertical axes of the PCP coordinate system.
- a stack corresponding to the number of multidimensional data including selection values that satisfy all the conditions corresponding to the plurality of selection ranges may be generated. According to such a configuration, for example, as shown in FIG.
- the selection frame 42 is drawn as a rectangular frame according to the operation of the input device 24 by the user. Specifically, the selection frame 42 is drawn as a rectangular frame according to, for example, a mouse drag operation or a touch panel touch operation by the user.
- FIG. 10 is a diagram illustrating an example of information displayed in the information presentation apparatus according to the embodiment.
- the calculation unit 21a of the present embodiment uses each value included in two or more histogram bars adjacent or discrete on one vertical axis of the plurality of vertical axes of the PCP coordinate system as a selection value. When selected, the ratio of the number of selection values contained in any one of the two or more histogram bars to the total number of selection values contained in the two or more histogram bars can be identified. It is also possible to perform processing for generating a stack for
- FIG. 3 For example, when three histogram bars 34 are included in one selection range set in step S5 of FIG. 3, as shown in FIG. A stack 35a having a pattern corresponding to the first histogram bar, a stack 35b having a pattern corresponding to the second histogram bar of the three histogram bars 34, and the three histogram bars 34 Each of the stacks 35c having a pattern corresponding to the third histogram bar may be drawn.
- the length of the stack 35a depends on the ratio of the number of selection values of the first histogram bar to the total number of selection values included in the first, second, and third histogram bars.
- the length of the stack 35b is set according to the ratio of the number of selection values of the second histogram bar to the total number of the selection values, and the number of selection values of the third histogram bar to the total number of the selection values
- the length of the stack 35c may be set according to the ratio.
- FIG. 11 is a diagram for explaining an example of a stack drawing method.
- each function of the information presentation apparatus 11 of the information presentation system 1 of this embodiment can be comprised as a program.
- the program for each function of the information presentation apparatus 11 stored in the auxiliary storage device (not shown) of the computer and stored in the auxiliary storage device is read into the main storage device, and the program read out to the main storage device Can be executed by the CPU 21 to cause the computer to operate the functions of the respective units of the present invention.
- a computer in which a program for each function of the information presentation apparatus 11 of the information presentation system 1 of the present embodiment is installed is a computer apparatus that performs each function of the information presentation apparatus 11 of the information presentation system 1 of the present embodiment. It is possible to operate.
- the program can be provided to a computer in a state where the program is recorded on a computer-readable recording medium.
- Computer-readable recording media include optical disks such as CD-ROM, phase-change optical disks such as DVD-ROM, magneto-optical disks such as MO (Magnet Optical) and MD (Mini Disk), floppy (registered trademark) disks, Examples include magnetic disks such as removable hard disks, memory cards such as compact flash (registered trademark), smart media, SD memory cards, and memory sticks.
- a hardware device such as an integrated circuit (IC chip or the like) specially designed and configured for the purpose of the present invention is also included as a recording medium.
- the database server 12 may be a file server (including those on the cloud).
Landscapes
- Engineering & Computer Science (AREA)
- Theoretical Computer Science (AREA)
- Databases & Information Systems (AREA)
- Physics & Mathematics (AREA)
- General Physics & Mathematics (AREA)
- Data Mining & Analysis (AREA)
- General Engineering & Computer Science (AREA)
- User Interface Of Digital Computer (AREA)
- Information Retrieval, Db Structures And Fs Structures Therefor (AREA)
- Image Generation (AREA)
Abstract
実施形態の情報提示装置は、プロット部と、ヒストグラム生成部と、視覚情報生成部と、を有する。プロット部は、複数の多次元データ各々に含まれる複数の値を平行座標プロットの座標系における複数の軸上にプロットする。ヒストグラム生成部は、複数の軸各々を複数の区間に区切るとともに、複数の区間における各区間内にプロットされている値の個数に応じた複数のヒストグラム棒を生成する。視覚情報生成部は、複数の軸上にプロットされた各値のうちの1つ以上の値が選択値として選択された際に、ヒストグラム生成部により生成された各ヒストグラム棒のうちの任意の1つのヒストグラム棒に含まれる値の総数に対する選択値の個数の比率を識別可能とする視覚情報を生成する。
Description
本発明の実施形態は、情報提示装置、情報提示方法及びプログラムに関する。
予め蓄積された多数のデータを加工して可視化するためのBI(ビジネスインテリジェンス)ツールが従来用いられている。また、BIツールの中には、例えば、予め蓄積された多数のデータをPCP(平行座標プロット)の座標系で表すための機能を備えたものがある。
PCPは、複数のデータそれぞれに対し、1つのデータに含まれる複数の値を平行に並べられた複数の軸上にプロット(配置)して各プロット点の間を線で結ぶような加工を施す可視化手法として従来知られている。
但し、PCPにおいては、予め蓄積された多数のデータに含まれる所望のデータの分析に適した可視化が行われない場合がある。具体的には、PCPにおいては、例えば、複数の軸上にプロットされた複数の値の中から選択した所望の値を追跡できるような可視化が行われない場合がある。
特許文献1:米国特許第8346682号明細書
実施形態は、多数のデータに含まれる所望のデータの分析に適した可視化を行うことが可能な情報提示装置、情報提示方法及びプログラムを提供することを目的とする。
実施形態の情報提示装置は、プロット部と、ヒストグラム生成部と、視覚情報生成部と、を有する。前記プロット部は、複数の多次元データ各々に含まれる複数の値を平行座標プロットの座標系における複数の軸上にプロットする。前記ヒストグラム生成部は、前記複数の軸各々を複数の区間に区切るとともに、前記複数の区間における各区間内にプロットされている値の個数に応じた複数のヒストグラム棒を具備するヒストグラムを生成する。前記視覚情報生成部は、前記複数の軸上にプロットされた各値のうちの1つ以上の値が選択値として選択された際に、前記ヒストグラム生成部により生成された各ヒストグラム棒のうちの任意の1つのヒストグラム棒に含まれる値の総数に対する前記選択値の個数の比率を識別可能とする視覚情報を生成する。
以下、実施形態について、図面を参照しつつ説明を行う。
情報提示システム1は、図1に示すように、ユーザにより操作されるパーソナルコンピュータ等である情報提示装置11と、ネットワークNWを介して情報提示装置11に接続されるデータベースサーバ12と、を有して構成されている。図1は、実施形態に係る情報提示システムの構成の一例を示す図である。
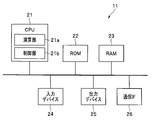
情報提示装置11は、例えば、図2に示すように、CPU21と、ROM(Read Only Memory)22と、RAM(Random Access Memory)23と、入力デバイス24と、出力デバイス25と、通信IF(インターフェース)26と、を有して構成されている。
CPU21は、ROM22に記憶されたプログラム等に基づき、RAM23をワーキングエリアとして利用しつつ描画処理等を行う演算部21aを具備して構成されている。また、CPU21は、入力デバイス24の操作に応じて入力された情報及び指示等に基づき、情報提示装置11の各部の動作に係る制御を行う制御部21bを具備して構成されている。
入力デバイス24は、ユーザの操作に応じた情報及び指示等を入力することができるように構成されている。具体的には、入力デバイス24は、例えば、キーボード、マウス及びタッチパネルのうちの少なくとも1つを具備して構成されている。
出力デバイス25は、CPU21の処理等に応じて生成された情報を外部へ出力することができるように構成されている。具体的には、出力デバイス25は、例えば、ディスプレイまたはプリンタを具備して構成されている。
通信IF26は、ネットワークNWを介してデータベースサーバ12との間でデータ等の送受信を行うことが可能なデバイスにより構成されている。
データベースサーバ12には、例えば、CSV形式等のような、データの可視化に係る処理(以降、「データ可視化処理」と略記する)において利用可能な形式で出力可能な複数の多次元データが格納されている。また、データベースサーバ12に格納されている各多次元データには、PCPの座標系における複数の軸上にプロット(配置)可能な複数の値が含まれている。
続いて、実施形態に係るデータ可視化処理の具体例について、図3等を参照しつつ説明する。なお、以降においては、データ可視化処理における主要な処理がCPU21により行われる場合を例に挙げて説明する。また、以降においては、データ可視化処理により描画された情報を含む表示画像が、ディスプレイである出力デバイス25の画面上に表示される場合を例に挙げて説明する。また、以降においては、PCPの座標系における複数の軸が縦軸として設定され、ユーザが範囲を操作できる手段(以降、「ノブ」と称する)を縦軸の両端に設け(図5参照)、かつ、複数の縦軸上にプロットされた各点の間が横線で結ばれる場合を例に挙げて説明する。図3は、実施形態に係る情報提示装置において行われる処理の具体例を示すフローチャートである。
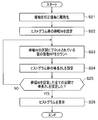
演算部21aは、ネットワークNWを介してデータベースサーバ12から読み込んだ複数の多次元データに基づき、当該複数の多次元データをPCPの座標系で表示させるための描画処理を行う(図3のステップS1)。すなわち、プロット部としての機能を備えた演算部21aは、データベースサーバ12から読み込んだ複数の多次元データ各々に含まれる複数の値をPCP座標系における縦軸上にプロット(配置)するための処理を行う。なお、本実施形態においては、Webブラウザ等のような所定の描画エンジンに対応する描画処理が演算部21aにおいて行われるものとする。
演算部21aは、図3のステップS1の処理結果に含まれるPCPの座標系の縦軸上にヒストグラムを表示させるための描画処理を行う(図3のステップS2)。なお、ヒストグラムは、例えば、図5の測定値Dに対応した図形のように、本来はデータの分布状況を視覚的に認識するために用いられる棒型の図形が互いに接したものとして表現される。但し、本明細書では、例えば、図5の測定値Bに対応した図形のように、測定値が属性などの離散値であること等に起因し、棒状の図形が互いに離れている棒グラフで表現されるものも便宜上ヒストグラムと称する。
ここで、図3のステップS2において行われる処理等の具体例について、図4を参照しつつ説明する。なお、本実施形態においては、ヒストグラムに含まれる各ヒストグラム棒(以降、ヒストグラムを構成する棒型の図形を「ヒストグラム棒」と称する)が、PCPの座標系の縦軸を起点とする横長なオブジェクトとして描画されるものとして説明を行う。図4は、実施形態に係る情報提示装置において行われる処理の具体例を示すフローチャートである。
演算部21aは、PCPの座標系における縦軸を所定値毎に離散化するための処理を行う(図4のステップS21)。
演算部21aは、図4のステップS21の処理結果に基づき、PCPの座標系の縦軸上におけるヒストグラム棒の幅である棒幅Wを設定する(図4のステップS22)。なお、棒幅Wは、例えば、ユーザによる入力デバイス24の操作に応じて変更されるようにしてもよい。
演算部21aは、PCPの座標系の縦軸上にプロットした各値のうち、図4のステップS22の処理により設定した棒幅Wの区間内にプロットされている値(プロット点)の個数NPをカウントする(図4のステップS23)。また、演算部21aは、図4のステップS23の処理により得られた個数NPを棒幅Wの区間毎に対応付けてRAM23に格納させる。
演算部21aは、図4のステップS23においてカウントした個数NPの大きさに応じ、PCPの座標系の横方向に延びるヒストグラム棒の長さである棒長さLを設定する(図4のステップS24)。
演算部21aは、PCPの座標系の縦軸上において棒幅Wを設定した全ての区間で棒長さLを設定したか否かを判定する(図4のステップS25)。
演算部21aは、棒幅Wを設定した全ての区間のうち、棒長さLを設定していない区間がある場合(S25:NO)には、図4のステップS23からの処理を繰り返し行う。また、演算部21aは、棒幅Wを設定した全ての区間で棒長さLを設定した場合(S25:YES)には、複数のヒストグラム棒を含むヒストグラムをPCPの座標系における縦軸上に表示させるための描画処理を行った(図4のステップS26)後、図4の一連の処理を終了する。
すなわち、ヒストグラム生成部としての機能を備えた演算部21aは、PCPの座標系の縦軸各々を複数の区間に区切るとともに、当該複数の区間各々の区間内にプロットされている値の個数に応じた複数のヒストグラム棒を具備するヒストグラムを生成するための処理を行う。
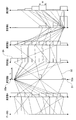
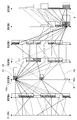
制御部21bは、図3のステップS2の処理結果に基づき、例えば、図5に示すような情報を含む表示画像を出力デバイス25の画面上に表示させるための制御を行う。具体的には、制御部21bは、PCPの座標系を構成する複数の縦軸31と、縦軸31上にプロットされた各点の間を結ぶ横線32と、縦軸31の上部に描画されるノブ33aと、縦軸31の下部に描画されるノブ33bと、縦軸31上から横方向に延びるヒストグラム棒34と、を含む表示画像を出力デバイス25の画面上に表示させるための制御を行う。図5は、実施形態に係る情報提示装置において表示される情報の一例を示す図である。
ノブ33aは、ユーザによる入力デバイス24の操作に応じ、縦軸31上にプロットされた各値の上限を調整することが可能なインターフェースとして描画される。
ノブ33bは、ユーザによる入力デバイス24の操作に応じ、縦軸31上にプロットされた各値の下限を調整することが可能なインターフェースとして描画される。
図5の「データID」は、データベースサーバ12から読み込んだ各多次元データに予め付与されているユニークな番号を示している。また、図5の「測定値A」、「測定値B」、「測定値C」、「測定値D」、「測定値E」及び「測定値F」は、データベースサーバ12から読み込んだ各多次元データに含まれる複数の値の属性または単位等の名称を示している。具体的には、図5においては、例えば、「測定値B」が個体などの属性を表し、「測定値B」以外のその他の各測定値が各々の個体に対応して計測された数値を表している。
なお、本実施形態においては、図5の「測定値A」~「測定値F」の各縦軸31がヒストグラムの描画対象になっているとともに、図5の「データID」の縦軸31が(PCPの座標系における基準軸であるため)ヒストグラムの描画対象から除外されている場合を例に挙げて説明を行う。また、本実施形態においては、図示の便宜上、PCPの座標系の縦軸31上にプロットされた各プロット点のうちの少なくとも一部のプロット点の位置を、各横線32が極力重複しない位置になるように調整しているものとする。
制御部21bは、図3のステップS2の処理に応じて表示される表示画像に含まれるノブ33aまたは33bのいずれかが操作されたか否かを検出する(図3のステップS3)。
制御部21bは、ノブ33a及び33bの操作を検出できなかった場合(S3:NO)には、後述の図3のステップS5の処理を続けて行う。また、制御部21bは、ノブ33aまたは33bのいずれかが操作されたことを検出した場合(S3:YES)には、ノブ33a及び33bの間に挟まれる範囲から外れた各プロット点に対応する横線32を非表示にするための処理(図3のステップS4)、及び、当該各プロット点を除いた状態で各ヒストグラム棒34の棒長さLを更新(設定)するための処理(図3のステップS4)を演算部21aに行わせた後で、後述の図3のステップS5の処理を続けて行う。
演算部21aは、図3のステップS4の制御に応じ、ノブ33aまたは33bのいずれかが操作された縦軸31を特定し、当該特定した縦軸31においてノブ33a及び33bの間に挟まれる範囲から外れた各プロット点を検出し、当該検出した各プロット点を含む多次元データに対応する横線32を描画対象から除外する処理を行うことにより、当該各プロット点に対応する横線32を非表示にする。また、演算部21aは、図3のステップS4の制御に応じ、ノブ33a及び33bの間に挟まれる範囲から外れた各プロット点を除外した状態において、図4のステップS23からステップS25までの処理と同様の処理を行うことにより、各ヒストグラム棒34の棒長さLを更新する。そして、例えば、図5の「測定値C」に対応する縦軸31のノブ33bが操作された場合には、図6のような情報を含む表示画像が出力デバイス25の画面上に表示される。図6は、ノブが操作された場合の例を説明するための図である。
すなわち、演算部21aは、PCPの座標系の複数の縦軸のうちの少なくとも1つの縦軸上において、ヒストグラムの生成に利用可能な値を制限するための範囲が設定されている場合に、当該範囲に含まれる値の個数に応じて各ヒストグラム棒の長さを設定する。
なお、図6においては、棒長さL=0に更新された各ヒストグラム棒34が、横線32と同様に非表示になっているものとする。また、以降においては、説明の便宜上、ノブ33a及び33bが各縦軸31において操作されていない場合を主な例として挙げつつ説明する。
制御部21bは、図3のステップS2の処理に応じて表示される表示画像に含まれる縦軸31上の1つ以上の値を選択するための操作が行われたか否かを検出する(図3のステップS5)。換言すると、制御部21bは、図3のステップS5において、図3のステップS2の処理に応じて表示される表示画像に含まれる縦軸31上の1つ以上の値を選択するための選択範囲の設定に係る操作が行われたか否かを検出する。
制御部21bは、縦軸31上の1つ以上の値を選択するための操作を検出できなかった場合(S5:NO)には、図3の一連の処理を終了する。また、制御部21bは、縦軸31上の1つ以上の値を選択するための操作が行われたことを検出した場合(S5:YES)には、当該操作により選択された各選択値に対応して、積み立てた棒型の図形(図8参照)であるスタックを表示するための処理(図3のステップS6)、及び、当該各選択値に対応する横線32を強調するための処理(図3のステップS7)を演算部21aに行わせる。
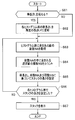
ここで、図3のステップS6において行われる処理等の具体例について、図7を参照しつつ説明する。図7は、実施形態に係る情報提示装置において行われる処理の具体例を示すフローチャートである。
演算部21aは、各ヒストグラム棒34の棒長さLを一定の長さに揃えるか否かを判定する(図7のステップS61)。
演算部21aは、各ヒストグラム棒34の棒長さLを一定の長さに揃えない場合(S61:NO)には、後述の図7のステップS63の処理を続けて行う。また、演算部21aは、各ヒストグラム棒34の棒長さLを一定の長さに揃える場合(S61:YES)には、各ヒストグラム棒34の棒長さLを、当該各ヒストグラム棒に含まれる値(プロット点)の個数NPを100%とする長さである所定の長さLPに更新するための処理を行った(図7のステップS62)後で、後述の図7のステップS63の処理を続けて行う。
なお、図7のステップS61の判定処理は、各ヒストグラム棒34の棒長さLを一定の長さに揃えるための操作に応じた制御が制御部21bにより行われたか否かに基づいて行われるものであってもよく、または、所定の長さLPが設定済であるか否かに基づいて行われるものであってもよい。また、以降においては、説明の便宜上、図7のステップS62の処理が行われていない場合を主な例として挙げつつ説明する。
演算部21aは、ヒストグラム棒34に含まれる値の総数NAを取得する(図7のステップS63)。具体的には、演算部21aは、例えば、ノブ33a及び33bが操作されていない場合には、図4のステップS23の処理により得られた個数NPを総数NAとして取得する。また、例えば、ノブ33aまたは33bのいずれかが操作されている場合には、図4のステップS23の処理により得られた個数NPから、ノブ33a及び33bの間に挟まれる範囲から外れた各プロット点の個数を減ずることにより総数NAを取得する。
演算部21aは、図7のステップS63の処理により得られた総数NAの中に含まれる選択値の個数NSをカウントする(図7のステップS64)。また、演算部21aは、図7のステップS64の処理により得られた個数NSをヒストグラム棒34毎に対応付けてRAM23に格納させる。
演算部21aは、棒長さLと、総数NAと、個数NSと、に基づき、ヒストグラム棒34における総数NAに対する個数NSの比率をスタックの長さとして設定するための処理を行う(図7のステップS65)。
演算部21aは、各ヒストグラム棒34においてスタックの長さを設定したか否かを判定する(図7のステップS66)。
演算部21aは、スタックの長さを設定していないヒストグラム棒34がある場合(S66:NO)には、図7のステップS63からの処理を繰り返し行う。また、演算部21aは、各ヒストグラム棒34においてスタックの長さを設定した場合(S66:YES)には、当該スタックを表示させるための描画処理を行った(図7のステップS67)後、図7の一連の処理を終了する。
すなわち、視覚情報生成部としての機能を備えた演算部21aは、PCPの座標系の複数の縦軸上にプロットされた各値のうちの1つ以上の値が選択値として選択された際に、図3のステップS2の処理により生成された各ヒストグラム棒のうちの任意の1つのヒストグラム棒に含まれる値の総数に対する当該選択値の個数の比率を識別可能とするための視覚情報として、当該各ヒストグラム棒における当該比率のスタックを生成するための処理を行う。
演算部21aは、図7のステップS63の処理により得られた総数NAの選択値に対応する横線32をそれぞれ強調表示させるための描画処理を行った(図3のステップS7)後、図3の一連の処理を終了する。
制御部21bは、図3のステップS5において、例えば、図5の「測定値F」の縦軸31の下部において隣接する3つのヒストグラム棒34に含まれる各値が選択値として選択された場合には、図8に示すような情報を含む表示画像を出力デバイス25の画面上に表示させるための制御を行う。具体的には、制御部21bは、複数の縦軸31と、横線32と、ノブ33a及びノブ33bと、ヒストグラム棒34と、ヒストグラム棒34の内部に描画されるスタック35と、図3のステップS5において選択された選択値を含む選択範囲を示す選択枠41と、を含む表示画像を出力デバイス25の画面上に表示させるための制御を行う。図8は、実施形態に係る情報提示装置において表示される情報の一例を示す図である。なお、選択枠41は、ユーザによる入力デバイス24の操作に応じた矩形の枠として描画される。具体的には、選択枠41は、例えば、ユーザによるマウスのドラッグ操作またはタッチパネルのタッチ操作に応じた矩形の枠として描画される。
図8のスタック35は、ヒストグラム棒34の内部における、総数NAに対する個数NSの比率に応じた長さの領域を所定の色で一律に塗りつぶした状態で描画されている。なお、本実施形態においては、例えば、総数NAに対する個数NSの比率がゼロである場合には、ヒストグラム棒34の内部が塗りつぶされないようにしている。また、図8の表示画像に含まれるスタック35は、「測定値F」の縦軸31上における選択枠41の選択範囲内にプロットされているという条件を満たすように選択された各選択値を含む多次元データが、「測定値F」以外の各縦軸31においてどのような値を有しているか等を分析可能な情報として可視化される。また、図8によれば、スタック35が描画されている複数のヒストグラム棒34間を結ぶ各横線32、すなわち、選択枠41により選択された選択値を含む多次元データに対応する各横線32が強調された状態で可視化される。従って、本実施形態によれば、多数のデータに含まれる所望のデータの分析に適した可視化を行うことができる。
なお、本実施形態によれば、例えば、図7のステップS62の処理、すなわち、各ヒストグラム棒34の棒長さLを一定の長さに揃える処理が行われた場合において、図9に示すような情報を含む表示画像が出力デバイス25の画面上に表示される。
図9のスタック35は、所定の長さLPのヒストグラム棒34の内部における、総数NAに対する選択値の個数NSの比率に応じた長さの領域を所定の色で一律に塗りつぶした状態で描画されている。そのため、図7のステップS62の処理が行われた場合においては、例えば、総数NAが少ないヒストグラム棒34の内部に描画されるスタック35の視認性を向上させることができる。図9は、ヒストグラム棒の棒長さが一定の長さに揃えられた場合の例を説明するための図である。
また、本実施形態によれば、図3のステップS5において、選択枠41に相当する1つの選択範囲が設定されるものに限らず、複数の選択枠に相当する複数の選択範囲が設定されるようにしてもよい。
加えて、2つ以上の縦軸31上において複数の選択範囲が設定された場合に、当該複数の選択範囲に対応する全ての条件を満たす選択値を含む多次元データの個数に応じたスタックが描画されるようにしてもよい。換言すると、本実施形態の演算部21aは、PCPの座標系の複数の縦軸のうちの2つ以上の縦軸上において選択値を選択するための複数の選択範囲が設定されている場合に、当該複数の選択範囲に対応する全ての条件を満たす選択値を含む多次元データの個数に応じたスタックを生成するものであってもよい。そして、このような構成によれば、例えば、図10に示すように、「測定値F」の縦軸31上における選択枠41の選択範囲内にプロットされているという第1の条件と、「測定値D」の縦軸31上における選択枠42の選択範囲内にプロットされているという第2の条件と、を満たす選択値を含む多次元データの個数に応じたスタック35が描画される。また、前述のような構成によれば、例えば、図10に示すように、前述の第1及び第2の条件を満たす選択値を含む多次元データに対応する横線32が強調される。
なお、選択枠42は、ユーザによる入力デバイス24の操作に応じた矩形の枠として描画される。具体的には、選択枠42は、例えば、ユーザによるマウスのドラッグ操作またはタッチパネルのタッチ操作に応じた矩形の枠として描画される。図10は、実施形態に係る情報提示装置において表示される情報の一例を示す図である。
また、本実施形態によれば、図3のステップS5により設定された1つまたは複数の選択範囲内に2つ以上のヒストグラム棒が含まれる場合において、当該2つ以上のヒストグラム棒に応じた異なる色または模様で各スタックが描画されるようにしてもよい。換言すると、本実施形態の演算部21aは、PCPの座標系の複数の縦軸のうちの1つの縦軸上において隣接するまたは離散する2つ以上のヒストグラム棒に含まれる各値が選択値として選択されている場合に、当該2つ以上のヒストグラム棒に含まれる選択値の総数に対する当該2つ以上のヒストグラム棒のうちの任意の1つのヒストグラム棒に含まれる選択値の個数の比率を識別可能とするためのスタックを生成するための処理を行うものであってもよい。
具体的には、例えば、図3のステップS5により設定された1つの選択範囲内に3つのヒストグラム棒34が含まれている場合に、図11に示すように、当該3つのヒストグラム棒34のうちの第1のヒストグラム棒に対応する模様を具備するスタック35aと、当該3つのヒストグラム棒34のうちの第2のヒストグラム棒に対応する模様を具備するスタック35bと、当該3つのヒストグラム棒34のうちの第3のヒストグラム棒に対応する模様を具備するスタック35cと、がそれぞれ描画されるようにしてもよい。
なお、このような場合においては、第1、第2及び第3の3つのヒストグラム棒に含まれる選択値の総数に対する第1のヒストグラム棒の選択値の個数の比率に応じてスタック35aの長さが設定され、当該選択値の総数に対する第2のヒストグラム棒の選択値の個数の比率に応じてスタック35bの長さが設定され、当該選択値の総数に対する第3のヒストグラム棒の選択値の個数の比率に応じてスタック35cの長さが設定されるようにすればよい。図11は、スタックの描画方法の一例を説明するための図である。
以上、本実施形態の情報提示システム1の情報提示装置11の各機能は、プログラムとして構成することができる。例えば、コンピュータの不図示の補助記憶装置に格納され、CPU21が補助記憶装置に格納された情報提示装置11の各機能毎のプログラムを主記憶装置に読み出し、主記憶装置に読み出された該プログラムをCPU21が実行し、コンピュータに本発明の各部の機能を動作させることができる。すなわち、本実施形態の情報提示システム1の情報提示装置11の各機能毎のプログラムがインストールされたコンピュータは、本実施形態の情報提示システム1の情報提示装置11の各機能を遂行するコンピュータ装置として動作することが可能である。
また、上記プログラムは、コンピュータ読取可能な記録媒体に記録された状態で、コンピュータに提供することも可能である。コンピュータ読取可能な記録媒体としては、CD-ROM等の光ディスク、DVD-ROM等の相変化型光ディスク、MO(Magnet Optical)やMD(Mini Disk)などの光磁気ディスク、フロッピー(登録商標)ディスクやリムーバブルハードディスクなどの磁気ディスク、コンパクトフラッシュ(登録商標)、スマートメディア、SDメモリカード、メモリスティック等のメモリカードが挙げられる。また、本発明の目的のために特別に設計されて構成された集積回路(ICチップ等)等のハードウェア装置も記録媒体として含まれる。また、データベースサーバ12は、ファイルサーバ(クラウド上のものも含む)であってもよい。
本発明の実施形態を説明したが、これらの実施形態は、例として示したものであり、本発明の範囲を限定することは意図していない。これら新規の実施形態は、その他の様々な形態で実施されることが可能であり、発明の要旨を逸脱しない範囲で、種々の省略、置き換え、変更を行うことができる。これら実施形態やその変形は、発明の範囲や要旨に含まれるとともに、特許請求の範囲に記載された発明とその均等の範囲に含まれる。
本出願は、2017年3月22日に日本国に出願された特願2017-56150号を優先権主張の基礎として出願するものであり、上記の開示内容は、本願明細書、請求の範囲、図面に引用されたものとする。
Claims (8)
- 複数の多次元データ各々に含まれる複数の値を平行座標プロットの座標系における複数の軸上にプロットするプロット部と、
前記複数の軸各々を複数の区間に区切るとともに、前記複数の区間における各区間内にプロットされている値の個数に応じた複数のヒストグラム棒を具備するヒストグラムを生成するヒストグラム生成部と、
前記複数の軸上にプロットされた各値のうちの1つ以上の値が選択値として選択された際に、前記ヒストグラム生成部により生成された各ヒストグラム棒のうちの任意の1つのヒストグラム棒に含まれる値の総数に対する前記選択値の個数の比率を識別可能とする視覚情報を生成する視覚情報生成部と、
を有することを特徴とする情報提示装置。 - 前記視覚情報生成部は、前記ヒストグラム生成部により生成された各ヒストグラム棒における前記比率のスタックを前記視覚情報として生成する
ことを特徴とする請求項1に記載の情報提示装置。 - 前記ヒストグラム生成部は、前記複数の軸のうちの少なくとも1つの軸上において、前記ヒストグラムの生成に利用可能な値を制限するための範囲が設定されている場合に、前記範囲に含まれる値の個数に応じて各ヒストグラム棒の長さを設定する
ことを特徴とする請求項1に記載の情報提示装置。 - 前記ヒストグラム生成部は、前記ヒストグラムに含まれる各ヒストグラム棒の長さを一定に揃える
ことを特徴とする請求項1に記載の情報提示装置。 - 前記視覚情報生成部は、前記複数の軸のうちの1つの軸上において隣接するまたは離散する2つ以上のヒストグラム棒に含まれる各値が前記選択値として選択されている場合に、前記2つ以上のヒストグラム棒に含まれる前記選択値の総数に対する前記2つ以上のヒストグラム棒のうちの任意の1つのヒストグラム棒に含まれる前記選択値の個数の比率を識別可能とするスタックを生成するための処理を行う
ことを特徴とする請求項2に記載の情報提示装置。 - 前記視覚情報生成部は、前記複数の軸のうちの2つ以上の軸上において前記選択値を選択する複数の選択範囲が設定されている場合に、前記複数の選択範囲に対応する全ての条件を満たす選択値を含む多次元データの個数に応じたスタックを生成する
ことを特徴とする請求項2に記載の情報提示装置。 - プロット部が、複数の多次元データ各々に含まれる複数の値を平行座標プロットの座標系における複数の軸上にプロットするステップと、
ヒストグラム生成部が、前記複数の軸各々を複数の区間に区切るとともに、前記複数の区間における各区間内にプロットされている値の個数に応じた複数のヒストグラム棒を具備するヒストグラムを生成するステップと、
視覚情報生成部が、前記複数の軸上にプロットされた各値のうちの1つ以上の値が選択値として選択された際に、前記ヒストグラムを生成するステップにより生成された各ヒストグラム棒のうちの任意の1つのヒストグラム棒に含まれる値の総数に対する前記選択値の個数の比率を識別可能とする視覚情報を生成するステップと、
を有することを特徴とする情報提示方法。 - コンピュータに、
複数の多次元データ各々に含まれる複数の値を平行座標プロットの座標系における複数の軸上にプロットする工程と、
前記複数の軸各々を複数の区間に区切るとともに、前記複数の区間における各区間内にプロットされている値の個数に応じた複数のヒストグラム棒を具備するヒストグラムを生成する工程と、
前記複数の軸上にプロットされた各値のうちの1つ以上の値が選択値として選択された際に、前記ヒストグラムを生成する工程により生成された各ヒストグラム棒のうちの任意の1つのヒストグラム棒に含まれる値の総数に対する前記選択値の個数の比率を識別可能とする視覚情報を生成する工程と、
を実行させるためのプログラム。
Priority Applications (2)
| Application Number | Priority Date | Filing Date | Title |
|---|---|---|---|
| CN201780082240.2A CN110168484B (zh) | 2017-03-22 | 2017-09-26 | 信息提示装置、信息提示方法及计算机可读取的存储介质 |
| US16/577,434 US11151763B2 (en) | 2017-03-22 | 2019-09-20 | Information presentation device, information presentation method, and storage medium |
Applications Claiming Priority (2)
| Application Number | Priority Date | Filing Date | Title |
|---|---|---|---|
| JP2017-056150 | 2017-03-22 | ||
| JP2017056150A JP6549174B2 (ja) | 2017-03-22 | 2017-03-22 | 情報提示装置、情報提示方法及びプログラム |
Related Child Applications (1)
| Application Number | Title | Priority Date | Filing Date |
|---|---|---|---|
| US16/577,434 Continuation US11151763B2 (en) | 2017-03-22 | 2019-09-20 | Information presentation device, information presentation method, and storage medium |
Publications (1)
| Publication Number | Publication Date |
|---|---|
| WO2018173337A1 true WO2018173337A1 (ja) | 2018-09-27 |
Family
ID=63585454
Family Applications (1)
| Application Number | Title | Priority Date | Filing Date |
|---|---|---|---|
| PCT/JP2017/034697 Ceased WO2018173337A1 (ja) | 2017-03-22 | 2017-09-26 | 情報提示装置、情報提示方法及びプログラム |
Country Status (4)
| Country | Link |
|---|---|
| US (1) | US11151763B2 (ja) |
| JP (1) | JP6549174B2 (ja) |
| CN (1) | CN110168484B (ja) |
| WO (1) | WO2018173337A1 (ja) |
Families Citing this family (1)
| Publication number | Priority date | Publication date | Assignee | Title |
|---|---|---|---|---|
| JP6621124B1 (ja) * | 2019-04-26 | 2019-12-18 | 株式会社アナザーウェア | データ可視化装置及びプログラム |
Citations (5)
| Publication number | Priority date | Publication date | Assignee | Title |
|---|---|---|---|---|
| JPH11272460A (ja) * | 1997-12-17 | 1999-10-08 | Lucent Technol Inc | 特性依存の情報処理システムに関する修正情報を視覚的に表すためのシステム |
| JP2001067486A (ja) * | 1999-07-01 | 2001-03-16 | Lucent Technol Inc | スプレッドシートおよび他のデータ構造内の多次元データを視覚化するシステムとその方法 |
| US20100191678A1 (en) * | 2009-01-23 | 2010-07-29 | The Government Of The United States Of America, As Represented By The Secretary Of The Navy | Information Assisted Visual Interface, System, and Method for Identifying and Quantifying Multivariate Associations |
| WO2015193983A1 (ja) * | 2014-06-18 | 2015-12-23 | 株式会社日立製作所 | 画像表示システム及び画像表示方法 |
| US20160098173A1 (en) * | 2014-10-06 | 2016-04-07 | Palantir Technologies, Inc. | Presentation of multivariate data on a graphical user interface of a computing system |
Family Cites Families (15)
| Publication number | Priority date | Publication date | Assignee | Title |
|---|---|---|---|---|
| US7219034B2 (en) * | 2001-09-13 | 2007-05-15 | Opnet Technologies, Inc. | System and methods for display of time-series data distribution |
| US20040027350A1 (en) * | 2002-08-08 | 2004-02-12 | Robert Kincaid | Methods and system for simultaneous visualization and manipulation of multiple data types |
| US20070005582A1 (en) * | 2005-06-17 | 2007-01-04 | Honeywell International Inc. | Building of database queries from graphical operations |
| US8166157B2 (en) * | 2007-03-23 | 2012-04-24 | Fmr Llc | Enterprise application performance monitors |
| JP5430359B2 (ja) * | 2009-11-05 | 2014-02-26 | 株式会社ディスコ | アライメント方法 |
| US20110175905A1 (en) * | 2010-01-15 | 2011-07-21 | American Propertunity, LLC. | Infoshape: displaying multidimensional information |
| US20120137238A1 (en) * | 2010-11-29 | 2012-05-31 | Microsoft Corporation | Data visualization interface including range control and treemap integration |
| US9070216B2 (en) * | 2011-12-14 | 2015-06-30 | The Board Of Trustees Of The University Of Illinois | Four-dimensional augmented reality models for interactive visualization and automated construction progress monitoring |
| US9760240B2 (en) * | 2014-10-09 | 2017-09-12 | Splunk Inc. | Graphical user interface for static and adaptive thresholds |
| CN104519361A (zh) * | 2014-12-12 | 2015-04-15 | 天津大学 | 一种基于空时域局部二值模式的视频隐写分析方法 |
| US10510117B1 (en) * | 2015-03-23 | 2019-12-17 | Scottrade, Inc. | High performance stock screener visualization technology using parallel coordinates graphs |
| CN105975512B (zh) * | 2016-04-28 | 2017-11-28 | 浙江大学宁波理工学院 | 一种顾及空间位置的多维属性可视化广义模型的构建方法 |
| CN106021529A (zh) * | 2016-05-25 | 2016-10-12 | 浙江工业大学 | 一种基于平行坐标系的海量文件流转可视化方法 |
| CN106354760B (zh) * | 2016-08-18 | 2018-12-11 | 北京工商大学 | 基于变形统计地图的多视图时空数据可视化方法与应用 |
| US10949438B2 (en) * | 2017-03-08 | 2021-03-16 | Microsoft Technology Licensing, Llc | Database query for histograms |
-
2017
- 2017-03-22 JP JP2017056150A patent/JP6549174B2/ja active Active
- 2017-09-26 WO PCT/JP2017/034697 patent/WO2018173337A1/ja not_active Ceased
- 2017-09-26 CN CN201780082240.2A patent/CN110168484B/zh active Active
-
2019
- 2019-09-20 US US16/577,434 patent/US11151763B2/en active Active
Patent Citations (5)
| Publication number | Priority date | Publication date | Assignee | Title |
|---|---|---|---|---|
| JPH11272460A (ja) * | 1997-12-17 | 1999-10-08 | Lucent Technol Inc | 特性依存の情報処理システムに関する修正情報を視覚的に表すためのシステム |
| JP2001067486A (ja) * | 1999-07-01 | 2001-03-16 | Lucent Technol Inc | スプレッドシートおよび他のデータ構造内の多次元データを視覚化するシステムとその方法 |
| US20100191678A1 (en) * | 2009-01-23 | 2010-07-29 | The Government Of The United States Of America, As Represented By The Secretary Of The Navy | Information Assisted Visual Interface, System, and Method for Identifying and Quantifying Multivariate Associations |
| WO2015193983A1 (ja) * | 2014-06-18 | 2015-12-23 | 株式会社日立製作所 | 画像表示システム及び画像表示方法 |
| US20160098173A1 (en) * | 2014-10-06 | 2016-04-07 | Palantir Technologies, Inc. | Presentation of multivariate data on a graphical user interface of a computing system |
Also Published As
| Publication number | Publication date |
|---|---|
| US11151763B2 (en) | 2021-10-19 |
| US20200020142A1 (en) | 2020-01-16 |
| JP2018160034A (ja) | 2018-10-11 |
| CN110168484B (zh) | 2022-08-16 |
| JP6549174B2 (ja) | 2019-07-24 |
| CN110168484A (zh) | 2019-08-23 |
Similar Documents
| Publication | Publication Date | Title |
|---|---|---|
| JP6020161B2 (ja) | グラフ作成プログラム、情報処理装置、およびグラフ作成方法 | |
| CN109643399B (zh) | 多类别分类器的交互式性能可视化 | |
| US9886669B2 (en) | Interactive visualization of machine-learning performance | |
| US20110141118A1 (en) | Data visualization methods | |
| US20150193094A1 (en) | Space Constrained Ordered List Previews | |
| JP6631638B2 (ja) | 表示方法、表示プログラム及び表示制御装置 | |
| CN114116441A (zh) | 一种ui界面测试方法、装置、电子设备及存储介质 | |
| US20190205361A1 (en) | Table-meaning estimating system, method, and program | |
| US11314991B2 (en) | Information display method, information display system, and storage medium | |
| JP2015049669A (ja) | 資料評価プログラムおよび資料評価装置 | |
| US9792706B2 (en) | Graph processing system, graph processing method, and non-transitory computer readable medium | |
| JP6252296B2 (ja) | データ識別方法、データ識別プログラム及びデータ識別装置 | |
| US10055097B2 (en) | Grasping contents of electronic documents | |
| US11151763B2 (en) | Information presentation device, information presentation method, and storage medium | |
| JP2009252185A (ja) | 情報検索装置、情報検索方法、制御プログラム及び記録媒体 | |
| JP2013218607A (ja) | ソフトウェア品質評価装置、ソフトウェア品質評価方法、及び、プログラム | |
| JP7095744B2 (ja) | 予測状況可視化装置、予測状況可視化方法および予測状況可視化プログラム | |
| JP7151146B2 (ja) | コンピュータプログラム、情報処理方法及びコンピュータ | |
| US11886513B2 (en) | Data analysis system, data analysis method, and computer program product | |
| US12249134B2 (en) | Visualization method, program for the same, visualization device, and discrimination device having the same | |
| JP5098632B2 (ja) | 活動管理装置、活動管理システムおよび活動管理プログラム | |
| KR20230085033A (ko) | 데이터 소비 및 활용 위한 데이터 큐레이션 | |
| CN107562826A (zh) | 一种多维度数据的可视化对比展示方法及其系统 | |
| CN119621223B (zh) | 一种基于产品的图像分析方法和图像分析装置 | |
| CN107015733A (zh) | 选项信息呈现系统及方法 |
Legal Events
| Date | Code | Title | Description |
|---|---|---|---|
| 121 | Ep: the epo has been informed by wipo that ep was designated in this application |
Ref document number: 17901746 Country of ref document: EP Kind code of ref document: A1 |
|
| NENP | Non-entry into the national phase |
Ref country code: DE |
|
| 122 | Ep: pct application non-entry in european phase |
Ref document number: 17901746 Country of ref document: EP Kind code of ref document: A1 |