WO2018168805A1 - Blood pressure measurement device, method, and program - Google Patents
Blood pressure measurement device, method, and program Download PDFInfo
- Publication number
- WO2018168805A1 WO2018168805A1 PCT/JP2018/009577 JP2018009577W WO2018168805A1 WO 2018168805 A1 WO2018168805 A1 WO 2018168805A1 JP 2018009577 W JP2018009577 W JP 2018009577W WO 2018168805 A1 WO2018168805 A1 WO 2018168805A1
- Authority
- WO
- WIPO (PCT)
- Prior art keywords
- blood pressure
- reliability
- tonogram
- measurement
- pulse wave
- Prior art date
Links
Images


Classifications
-
- A—HUMAN NECESSITIES
- A61—MEDICAL OR VETERINARY SCIENCE; HYGIENE
- A61B—DIAGNOSIS; SURGERY; IDENTIFICATION
- A61B5/00—Measuring for diagnostic purposes; Identification of persons
- A61B5/02—Detecting, measuring or recording pulse, heart rate, blood pressure or blood flow; Combined pulse/heart-rate/blood pressure determination; Evaluating a cardiovascular condition not otherwise provided for, e.g. using combinations of techniques provided for in this group with electrocardiography or electroauscultation; Heart catheters for measuring blood pressure
- A61B5/021—Measuring pressure in heart or blood vessels
- A61B5/02108—Measuring pressure in heart or blood vessels from analysis of pulse wave characteristics
- A61B5/02116—Measuring pressure in heart or blood vessels from analysis of pulse wave characteristics of pulse wave amplitude
-
- A—HUMAN NECESSITIES
- A61—MEDICAL OR VETERINARY SCIENCE; HYGIENE
- A61B—DIAGNOSIS; SURGERY; IDENTIFICATION
- A61B5/00—Measuring for diagnostic purposes; Identification of persons
- A61B5/02—Detecting, measuring or recording pulse, heart rate, blood pressure or blood flow; Combined pulse/heart-rate/blood pressure determination; Evaluating a cardiovascular condition not otherwise provided for, e.g. using combinations of techniques provided for in this group with electrocardiography or electroauscultation; Heart catheters for measuring blood pressure
- A61B5/021—Measuring pressure in heart or blood vessels
- A61B5/022—Measuring pressure in heart or blood vessels by applying pressure to close blood vessels, e.g. against the skin; Ophthalmodynamometers
- A61B5/0225—Measuring pressure in heart or blood vessels by applying pressure to close blood vessels, e.g. against the skin; Ophthalmodynamometers the pressure being controlled by electric signals, e.g. derived from Korotkoff sounds
-
- A—HUMAN NECESSITIES
- A61—MEDICAL OR VETERINARY SCIENCE; HYGIENE
- A61B—DIAGNOSIS; SURGERY; IDENTIFICATION
- A61B5/00—Measuring for diagnostic purposes; Identification of persons
- A61B5/68—Arrangements of detecting, measuring or recording means, e.g. sensors, in relation to patient
- A61B5/6801—Arrangements of detecting, measuring or recording means, e.g. sensors, in relation to patient specially adapted to be attached to or worn on the body surface
- A61B5/6843—Monitoring or controlling sensor contact pressure
-
- A—HUMAN NECESSITIES
- A61—MEDICAL OR VETERINARY SCIENCE; HYGIENE
- A61B—DIAGNOSIS; SURGERY; IDENTIFICATION
- A61B5/00—Measuring for diagnostic purposes; Identification of persons
- A61B5/72—Signal processing specially adapted for physiological signals or for diagnostic purposes
- A61B5/7221—Determining signal validity, reliability or quality
Definitions
- the present invention relates to a blood pressure measurement device, method, and program for continuously measuring biological information.
- Blood pressure by the tonometry method that can measure biological information such as pulse and blood pressure using information detected by the pressure sensor in a state where the pressure sensor is in direct contact with a living body part through which an artery such as the radial artery of the wrist passes A measuring apparatus is known (see, for example, Japanese Patent Application Laid-Open No. 2004-222847).
- the blood pressure measurement device described in Japanese Patent Application Laid-Open No. 2004-222847 determines whether the sensor is in an inappropriate arrangement state with respect to the artery to be measured, and calculates the reliability of the blood pressure information. .
- the reliability is calculated from the contact state at the determination timing, but the calibration formula is determined based on the arrangement state at the time of calibration. Since the blood pressure value is calculated using the calibration formula, the correct blood pressure value is not calculated if it is different from the contact state at the time of calibration even if it is not in an inappropriate arrangement state.
- the present invention has been made by paying attention to the above circumstances, and its object is to obtain blood pressure data including blood pressure values for each heartbeat obtained by measuring blood pressure using one or more sensors. To provide a blood pressure measurement device, method, and program capable of calculating reliability.
- a first aspect of the present invention is a blood pressure measurement device that obtains blood pressure data including blood pressure values for each heartbeat by detecting a pressure pulse wave with one or more sensors.
- a sphygmomanometer, an extraction unit that extracts one or more feature amounts of the blood pressure data, and a calculation unit that calculates a reliability indicating how accurately the blood pressure data indicates a blood pressure value based on the feature amounts Are provided.
- the extraction unit determines whether the pressure feature is stable, whether the contact state between the one or more sensors and the measurement site is normal. At least one feature amount of the sensor contact state feature amount and the similarity feature amount indicating the similarity of the pressure pulse wave between the measurement start time and a desired measurement time, and the calculation unit The reliability is calculated based on the at least one feature quantity.
- the similarity is further determined to be higher than a threshold value. If it is determined, the calculation unit sets the reliability in this section to be high.
- the blood pressure measurement device obtains blood pressure data including a blood pressure value for each heartbeat by detecting a pressure pulse wave using one or a plurality of sensors, and the blood pressure data
- One or more feature amounts of the blood pressure data are extracted, and a confidence level indicating how accurately the blood pressure data indicates the blood pressure value is calculated based on the feature amount, whereby the confidence in the measured blood pressure value is calculated.
- the degree of measurement can be evaluated for each opportunity to measure the degree, and therefore, the reliability of the measured blood pressure value can be evaluated according to the measurement subject.
- the extraction unit has a stable feature amount indicating whether the pressure pulse wave is stable, and the contact state between one or more sensors included in the sphygmomanometer and the measurement site is normal. At least one feature amount is extracted from the sensor contact state feature amount indicating whether or not and the similarity feature amount indicating the similarity of the pressure pulse wave between the measurement start time and the desired measurement time. The unit calculates the reliability based on the at least one feature amount, thereby determining whether the pressure pulse wave is stable, whether the contact state between the sensor and the measurement site is normal, the measurement start time and the measurement time Since the reliability is calculated based on at least one of whether the pressure pulse waves are similar to each other, the reliability can be calculated from any one of these feature amounts. As a result, it is the reliability to the measured blood pressure value, and can be evaluated for each opportunity to measure the reliability specific to any feature amount.
- the contact state between the sensor and the contact part is normal, and the similarity is determined to be less than or equal to the threshold value, It can be seen that the reliability has dropped.
- the reliability of blood pressure data obtained by measurement can be calculated in detail, and the reliability may change due to different measurement times even in the same living body, so the reliability is faithful to the measurement situation at the measurement opportunity Can be obtained. As a result, it is possible to obtain time series data of blood pressure values with higher accuracy.
- each aspect of the present invention it is possible to provide a blood pressure measurement device, method, and program capable of calculating the reliability of blood pressure data including blood pressure values for each heartbeat obtained by measuring blood pressure. it can.
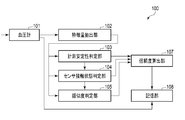
- FIG. 1 is a block diagram illustrating a blood pressure measurement device according to an embodiment.
- FIG. 2 is a block diagram showing a sphygmomanometer included in the blood pressure measurement device of FIG.
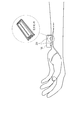
- FIG. 3 is a view showing an example in which the blood pressure measurement device of FIG. 1 is worn on the wrist.
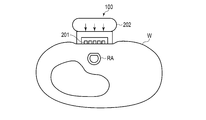
- FIG. 4 is a cross-sectional view of the wrist to which the blood pressure measurement device of FIG. 3 is attached.
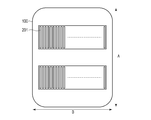
- FIG. 5 is a diagram illustrating an example of the arrangement of the sensors in FIGS. 2 to 4.
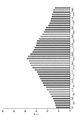
- FIG. 6 is a diagram showing the distribution of AC components of blood pressure values acquired by the sensors of FIGS.
- FIG. 7 is a diagram showing a distribution of DC components of blood pressure values acquired by the sensors of FIGS.
- FIG. 1 is a block diagram illustrating a blood pressure measurement device according to an embodiment.
- FIG. 2 is a block diagram showing a sphygmomanometer included in the blood pressure measurement device of FIG.
- FIG. 3 is a
- FIG. 8 is a diagram showing the temporal change of the pressure pulse wave and the pressure pulse wave for one heartbeat.
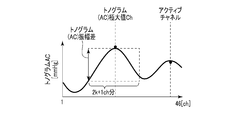
- FIG. 9A is a diagram illustrating an example of the feature amount obtained from the distribution of the AC component of the tonogram.
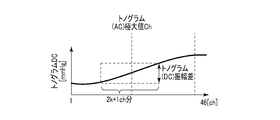
- FIG. 9B is a diagram illustrating an example of the feature amount obtained from the distribution of the DC component of the tonogram.
- FIG. 9C is a diagram illustrating another example of the feature amount obtained from the distribution of the DC component of the tonogram.
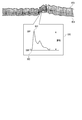
- FIG. 10 is a diagram illustrating an example of a section determined by the measurement stability determination unit of FIG.
- FIG. 11 is a diagram illustrating an example of a tonometry state determined by the sensor contact state determination unit in FIG. 1.
- FIG. 12 is a flowchart showing the operation of the blood pressure measurement device of FIG.
- FIG. 13 is a diagram illustrating an example of the implementation of the blood pressure measurement device in FIG. 1.
- FIG. 1 is a functional block diagram of a blood pressure measurement device 100, which includes a sphygmomanometer 101 that measures blood pressure continuously in time, a measurement stability determination unit 103, a sensor contact state determination unit 104, and a similarity determination unit. 105, a reliability calculation unit 107, and a storage unit 108.
- FIG. 2 is a functional block diagram of the sphygmomanometer 101.
- the blood pressure can be measured for each heartbeat continuously in time based on the pressure pulse wave information.
- the sphygmomanometer 101 employing the tonometry method is mainly used will be described.
- the sphygmomanometer 101 is not limited to a sphygmomanometer that employs the tonometry method, and may be any sphygmomanometer that can measure a pressure pulse wave using one or a plurality of sensors.
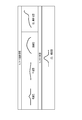
- FIG. 3 is an image diagram in which the tonometric blood pressure measuring device 100 is worn as an example, and is a schematic perspective view of the palm as seen from the side (the direction in which fingers are lined up when the hand is spread).
- FIG. 3 shows an example in which the pressure sensors are arranged in two rows crossing the radial artery.
- FIG. 3 appears that the blood pressure measurement device 100 is only placed on the arm on the palm side of the arm, the blood pressure measurement device 100 is actually wrapped around the arm.
- FIG. 4 is a cross-sectional view of the blood pressure measurement device 100 and the wrist W at the position of the sensor unit 201 in a state where the blood pressure measurement device 100 is attached to the wrist.
- FIG. 4 also shows that the radial artery RA is pressed against the blood pressure measurement device 100 and the upper part thereof is flattened.
- FIG. 5 is a view of the blood pressure measurement device 100 as viewed from the side in contact with the living body, and the sensor units 201 are arranged in parallel in two rows on the contacting surface.
- a plurality of sensors are arranged in a direction B that intersects the direction A in which the radial artery extends in a state where the blood pressure measurement device 100 is attached to the wrist W.
- the blood pressure measurement device 100 includes a sphygmomanometer 101, a feature amount extraction unit 102, a measurement stability determination unit 103, a sensor contact state determination unit 104, a similarity determination unit 105, a reliability calculation unit 107, and A storage unit 108 is included.
- the blood pressure measurement device 100 is, for example, in the form of a ring, wound around a wrist or the like like a bracelet, and measures blood pressure from biological information. As shown in FIGS. 2 and 3, the blood pressure measurement device 100 is arranged such that the sensor unit 201 (specifically, the pressure sensor) is positioned on the radial artery. Moreover, it is preferable to arrange
- the sphygmomanometer 101 measures the pressure pulse wave for each heartbeat that is temporally continuous by the tonometry method.
- the tonometry method is a method for determining a blood pressure by measuring a pressure pulse wave by compressing a blood vessel with a pressure sensor. Considering a circular tube with a uniform blood vessel thickness, the blood pressure in the blood vessel and the external pressure of the blood vessel (blood pressure) The relational expression with the pressure of the pressure pulse wave can be derived. Under the condition that the blood vessel is compressed on the pressing surface in this relational expression, the pressure of the pressure pulse wave can be approximated to be equal to the blood pressure by approximating the radius of the outer wall and the inner wall of the blood vessel. As a result, the sphygmomanometer 101 measures the blood pressure value of the living body to be worn for each heartbeat.
- the feature quantity extraction unit 102 extracts the feature quantity of this distribution from the blood pressure distribution for each heartbeat in time series.
- feature quantities there are two types of feature quantities, one extracted from the AC component of the tonogram and the other extracted from the DC component of the tonogram.
- the tonogram is a distribution shape of a calculated feature amount caused by blood pressure for each pressure sensor with respect to a plurality of pressure sensor numbers (for example, channel numbers).
- a tonogram is obtained for each sensor array included in the sensor unit 201.
- the AC component of the tonogram corresponds to a difference value between the maximum blood pressure value in one heart rate and the minimum blood pressure value
- the DC component in the tonogram corresponds to a minimum blood pressure value in one heart rate unit.
- the maximum blood pressure value corresponds to systolic blood pressure (SBP: systolic blood pressure), and the minimum blood pressure value corresponds to diastolic blood pressure (DBP). Details of the feature amount will be described later with reference to FIGS. 9A, 9B, and 9C.
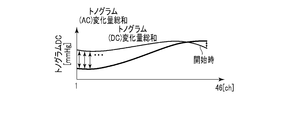
- the measurement stability determination unit 103 determines whether the pressure pulse wave obtained by the measurement is stable. For example, the measurement stability determination unit 103 determines that the pulse wave from the sphygmomanometer 101 is based on the total amount of change in tonogram (DC) before one heartbeat, which is one of the feature amounts extracted by the feature amount extraction unit 102. Determine if it is stable.
- the total tonogram (DC) change amount before one heartbeat is the sum of the change amount of each tonogram (DC) before one heartbeat and the change amount for each channel for all channels. . It can be considered that the section where the total amount of change in tonogram (DC) is smaller is that the sensor unit 201 is more stably attached to the living body and acquires an accurate blood pressure.
- the measurement stability determination unit 103 defines, for example, a stable interval in which a tonogram (DC) change amount sum is equal to or less than a certain threshold as a stable interval in which accurate blood pressure can be acquired, and a tonogram (DC) change.
- a period in which the total amount is larger than the threshold is defined as an unstable period in which stable and accurate blood pressure cannot be acquired. From the measurement stability determination unit 103, for example, it is assumed that the stability interval is high or intermediate, and the unstable interval is low. For example, only the blood pressure value detected in the stable section may be adopted. Specific examples of the stable section and the unstable section will be described later with reference to FIG.
- the sensor contact state determination unit 104 determines whether the contact state between a sensor (for example, a pressure sensor) used for blood pressure measurement and a measurement site is normal (appropriate). For example, the sensor contact state determination unit 104 has three tonogram (AC) maximum values Ch, which are feature amounts extracted by the feature amount extraction unit 102, a tonogram (AC) amplitude difference, and a tonogram (DC) amplitude difference. The contact state is determined based on the feature amount.
- the tonogram (AC) maximum value Ch is a channel in which the output value of the AC component of the tonogram is a maximum.
- the tonogram (AC) amplitude difference is an AC component amplitude difference between several channels before and after the channel where the output value of the AC component of the tonogram becomes maximum.
- the tonogram (DC) amplitude difference is an amplitude difference of the DC component between several channels before and after the channel where the output value of the AC component of the tonogram becomes a maximum.
- Tonogram (AC) maximum value Ch is included in a predetermined range
- Tonogram (AC) amplitude difference is larger than threshold
- Tonogram (DC) amplitude difference is threshold
- the sensor contact state determination unit 104 determines whether the state is a tonometry state or a state that deviates from the tonometry state.
- the tonometry state corresponds to a state in which the pressure sensor is appropriately arranged with respect to the measurement site when using a tonometry type sphygmomanometer.
- the tonogram (AC) maximum Ch is located near the center (23rd channel), and the predetermined range is, for example, a range of 15 to 31 channels.
- the similarity determination unit 105 determines the initial state of the pressure pulse wave and the current pressure pulse based on the tonogram (AC) change amount sum and the tonogram (DC) change amount sum that are the feature amounts extracted by the feature amount extraction unit 102.
- the similarity with the wave state is determined.
- the total tonogram (AC) change amount is the output value of each channel at a certain time of the AC component of the tonogram and the output value of each channel in the initial state (for example, during calibration) of the tonogram AC component (eg, start of measurement)
- the average value of each channel for 1 minute) is summed up for all channels.
- the total amount of change in the tonogram is the sum of the amount of change of the output value of each channel at a certain time of the DC component of the tonogram and the average value of each channel for one minute of measurement for all channels. is there.
- the time of calibration is when the pressure value of the pressure pulse wave is converted into a blood pressure value. The measurement starts normally at the same time as calibration. Since the initial tonogram state is indicated by the average value of each channel for one minute from the start of measurement, the similarity determination unit 105 can determine how similar the tonogram at a certain time is to the initial tonogram.
- the similarity determination unit 105 determines that the similarity is high when, for example, the tonogram (AC) change amount sum and the tonogram (DC) change amount sum are both smaller than the respective threshold values (first threshold values), Otherwise, it is determined that the similarity is low.
- the degree of similarity may be evaluated by, for example, percentage by associating the value of the total amount of change with the score, and the determination result display method has various modifications.
- the similarity determination unit 105 determines that the similarity is low.
- the reference value of blood pressure has shifted. For example, there are posture changes, wrist position changes, wrist orientation changes, and accompanying wear state changes.
- the measurement stability determination unit 103 can determine whether the pressure pulse wave is stable based on the change amount of the AC component, that is, the difference between the current AC component and the AC component before one heartbeat. it can.
- the AC component corresponds to a value obtained by subtracting the minimum value from the maximum value in the pressure pulse waveform for one heartbeat.
- the sensor contact state determination unit 104 can determine whether the contact state between the pressure sensor and the measurement site is normal based on an output signal from some sensor.
- the similarity determination unit 105 can calculate the similarity of the pressure pulse wave between the measurement start time and the target measurement time based on the AC component change amount and the DC component change amount.
- the DC component corresponds to the minimum value in the pressure pulse waveform for one heartbeat.
- the reliability calculation unit 107 calculates the reliability of the blood pressure data from the sphygmomanometer 101 for each measurement section based on the determination results of the measurement stability determination unit 103, the sensor contact state determination unit 104, and the similarity determination unit 105. To do. For example, when the measurement stability determination unit 103 determines that the blood pressure data is a stable interval, the reliability calculation unit 107 determines that the sensor contact state determination unit 104 is in the tonometry state. If it is determined that the reliability is medium or higher and it is determined that the state deviates from the tonometry state, it is determined that the reliability is low. On the other hand, the measurement stability determination unit 103 determines that the reliability is low for the section in which the blood pressure data is determined to be an unstable section.
- the sensor contact state determination unit 104 determines that the reliability is medium or higher, if the similarity determination unit 105 determines that the similarity is high, it determines that the reliability is high and the similarity is low. Is determined, the reliability is determined to be medium. In this way, the reliability calculation unit 107 gives the reliability for each section of the time-series data of blood pressure values, and records it in the storage unit 108.
- the reliability calculation unit 107 calculates that the reliability is low without referring to the results of other determination units.
- the sensor contact state determination unit 104 determines whether the tonometry state is present. It is calculated that the reliability is low without referring to the result.
- the determination result in each determination unit may be expressed by a numerical value, and the reliability may be expressed by a numerical value.
- the determination results calculated by the determination units 103, 104, and 105 may be divided into conditions, and the reliability may be displayed as a numerical value.
- the high reliability is determined by the measurement stability determination unit 103 as a stable section, the sensor contact state determination unit 104 determines the tonometry state, and the similarity determination unit 105 determines that the similarity is high.
- the storage unit 108 stores the blood pressure data from the sphygmomanometer 101 and the reliability thereof in association with each other.
- the storage unit 108 may store blood pressure data and reliability thereof in association with each user.
- the storage unit 108 records the blood pressure data from the sphygmomanometer 101 together with the reliability.
- the sphygmomanometer 101 includes a sensor unit 201, a pressing unit 202, a control unit 203, a storage unit 204, an operation unit 205, and an output unit 206.
- the sensor unit 201 detects the pressure pulse wave continuously in time. For example, the sensor unit 201 detects a pressure pulse wave for each heartbeat.
- the sensor unit 201 includes a sensor for detecting pressure, and is arranged on the palm side as shown in FIG. 3, and is usually arranged in parallel with two rows in the arm extending direction as shown in FIG.
- the pressing unit 202 includes a pump, a valve, a pressure sensor, and an air bag, and the sensor part of the sensor unit 201 can be pressed with an appropriate pressure on the wrist when the air bag swells to increase the sensitivity of the sensor. Air is introduced into the air bag by a pump and a valve, the pressure sensor detects the pressure in the air bag, and the control unit 203 monitors and controls to adjust to an appropriate pressure.
- the control unit 203 performs overall control of the sphygmomanometer 101, receives pulse wave time-series data from the sensor unit 201, converts this data into blood pressure value time-series data, and stores it in the storage unit 204 as blood pressure data. .
- the storage unit 204 stores blood pressure data, and passes desired data in response to a request from the control unit 203.
- the operation unit 205 receives input from a user or the like from a keyboard, a mouse, a microphone, or the like, or receives an instruction from an external server or the like by wire or wireless.
- the output unit 206 receives blood pressure data stored in the storage unit 204 via the control unit 203 and passes it to the outside of the sphygmomanometer 101.
- the blood pressure measurement device 100 is arranged on the palm side of the wrist as shown in FIGS. 3 and 4, and the sensor unit 201 of the sphygmomanometer 101 is arranged on the radial artery RA. As shown by the arrows in FIG. 4, the pressing unit 202 presses the sensor unit 201 against the wrist W, and the radial artery RA is compressed. Although not shown in FIGS. 3 and 4, the blood pressure measurement device 100 has an annular shape and wraps around a wrist or the like like a bracelet and measures blood pressure.
- FIG. 5 shows a surface of the sensor unit 201 on the side in contact with the wrist W.
- the sensor unit 201 includes one or more (two in this example) sensor arrays, and each of the sensor arrays has a plurality of sensors arranged in the direction B.
- the direction B is a direction that intersects the direction A in which the radial artery extends in a state in which the blood pressure measurement device 100 is attached to the measurement subject.
- direction A and direction B may be orthogonal.
- 46 sensors referred to as having 46 channels
- the sensor is given a channel number.
- the arrangement of the sensors is not limited to the example shown in FIG.
- Each sensor measures pressure and generates pressure data.
- a piezoelectric element that converts pressure into an electrical signal can be used as the sensor.
- a pressure waveform as shown in FIG. 8 is obtained as pressure data.
- the measurement result of the pressure pulse wave is generated based on pressure data output from one sensor (active channel) adaptively selected from the sensors.
- the maximum value in the waveform of the pressure pulse wave for one heartbeat corresponds to SBP
- the minimum value in the waveform of the pressure pulse wave for one heartbeat corresponds to DBP.
- the blood pressure data can include pressure data output from each sensor together with the measurement result of the pressure pulse wave. Note that the measurement result of the pulse wave may not be generated in the sphygmomanometer 101 but may be generated based on the pressure data by the control unit 203 including the information processing unit in the blood pressure measurement device 100.
- FIG. 8 shows time-series data of blood pressure calculated from the pressure pulse wave when measuring the pressure pulse wave for each heartbeat.
- FIG. 8 shows a blood pressure waveform based on one of the pressure pulse waves.
- the blood pressure based on the pressure pulse wave is detected for each heartbeat as a waveform as shown in FIG. 8, and the blood pressure based on each pressure pulse wave is continuously detected.
- a waveform 800 in FIG. 8 is a blood pressure waveform based on a pressure pulse wave of one heartbeat, and a pressure value of 801 corresponds to SBP and a pressure value of 802 corresponds to DBP.
- the SBP 803 and DBP 804 of the blood pressure waveform usually vary for each heartbeat.
- FIG. 9A, FIG. 9B, and FIG. 9C show examples of graphs of AC components and DC components of a tonogram taking the feature amount extracted by the feature amount extraction unit 102 as an example.
- the total amount of change in tonogram (DC) between the previous beat and the current beat which is a feature value used by the measurement stability determination unit 103, calculates the amount of change between the previous beat and the current beat of the DC component of the tonogram for each channel. , And the total amount of change for each channel.
- the tonogram (AC) maximum value Ch is a channel in which the output value of the AC component of the tonogram is maximum.
- the tonogram (AC) amplitude difference is an amplitude difference in the AC component of the tonogram for k channels before and after the channel having the maximum AC component of the tonogram.
- a tonogram (AC) change amount sum There are two types of feature quantities used by the similarity determination unit 105: a tonogram (AC) change amount sum and a tonogram (DC) change amount sum.
- AC tonogram
- DC tonogram
- the total amount of change in the tonogram (AC) is calculated by calculating the amount of change between the output value of each channel at a certain time t of the AC component of the tonogram and the output value of each initial channel.
- the total amount of change for each channel is, for example, the average value of the output values of each channel for one minute from the start of measurement.
- the tonogram (DC) change amount sum is obtained by replacing the AC component with the DC component in the tonogram (AC) change amount sum.
- the horizontal axis indicates time
- the vertical axis indicates the channel number of the sensor array
- the output value of the sensor is indicated by shading. From time t 0 to time t 1 and from time t 5 to time t 6 in FIG. 10, the output value is larger for white and the output value is smaller for black. In the time t 1 in FIG. 10 and the time t 3 to t 2 to t 4, it is shown that black as the output value is larger. That is, from time t 5 to t 6, the output value of the sensor than from time t 0 to t 1, it is seen substantially smaller.
- the output values of the channels 1 to 10 are larger than the output values of the channels after 10. Also, from time t 0 to t 1, the output value of channels 1 to about 10 is slightly larger than that of channel 46 thereafter.
- time t 0 to t 1 corresponds to the stable interval
- t 1 to t 2 corresponds to the unstable interval
- t 3 to t 4 corresponds to the unstable interval
- t 5 to t 6 corresponds to the stable interval.
- the horizontal direction indicates the channel number of the sensor
- the vertical direction indicates the output value (for example, blood pressure value) of each sensor.
- the upper four are all out of the tonometry state, and the lower one indicates the tonometry state.
- the top two left are typically when the pulse is weak, and the third from the top left is when the pulse is deep or the sensor is more likely to be placed above the elbow,
- the right-most example is when the effect of tendons is large, for example, the wrist is thin.
- the tonometry state is characterized in that the output value at the center of the channel is large (the maximum value is larger than the value having an amplitude at one location), and the output value gradually becomes symmetrical between the channels at both ends.
- the measurement stability determination unit 103 determines the tonometry state.
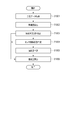
- FIG. 12 is a flowchart showing a typical example of the operation of the blood pressure measurement device 100.
- the sphygmomanometer 101 acquires time-series data of blood pressure values from the living body and passes them to the feature amount extraction unit 102 (step S1201).
- the sphygmomanometer 101 passes the time series data to the storage unit 108, and the storage unit 108 sequentially records the time series data of the blood pressure values.
- step S1202 the feature amount extraction unit 102 extracts the feature amounts required by the measurement stability determination unit 103, the sensor contact state determination unit 104, and the similarity determination unit 105, and sets the feature amounts corresponding to the respective determination units. hand over.
- step S1203 the measurement stability determination unit 103 determines a stable interval if the total tonogram (DC) change amount from the one heartbeat received from the feature amount extraction unit 102 is equal to or less than a threshold value, and other values. If so, it is determined as an unstable section (step S1203). If the measurement stability determination unit 103 determines that it is a stable section, the process proceeds to step S1204. If the measurement stability determination unit 103 determines that it is an unstable section, the process proceeds to step S1206, and the reliability calculation unit 107 indicates that “the reliability is low. Is determined.
- DC total tonogram
- step S1204 the sensor contact state determination unit 104 receives (condition 1) the tonogram (AC) maximum value Ch received from the feature amount extraction unit 102 within a predetermined range, or (condition 2) the tonogram (AC) amplitude difference. Is greater than the threshold and (Condition 3) whether the tonogram (DC) amplitude difference is greater than the threshold is determined to be a tonometric state. For example, when all of (Condition 1), (Condition 2), and (Condition 3) are satisfied, it is determined that the state is a tonometry state, and the process proceeds to Step S1205.
- step S ⁇ b> 1205 the similarity determination unit 105 determines the similarity of the tonogram based on the two feature amounts received from the feature amount extraction unit 102, the tonogram (AC) change amount sum and the tonogram (DC) change amount sum. . For example, when the tonogram (AC) change amount sum and the tonogram (DC) change amount sum are both smaller than the respective threshold values (first threshold values), it is determined that the similarity is high, and the reliability calculation unit 107 determines the reliability. It is determined that the degree is high (step S1206).
- the reliability calculation unit 107 has the medium reliability It is determined that it is a position (step S1206).
- the measurement stability determination unit 103, the sensor contact state determination unit 104, and the similarity determination unit 105 sequentially perform determination processing and pass the determination result to the reliability calculation unit 107.
- the measurement stability determination unit 103, the sensor contact state determination unit 104, and the similarity determination unit 105 perform determination processing in parallel, and the reliability calculation unit 107 appropriately divides these determination results into reliability levels. May be determined.
- the blood pressure measurement device 100 includes a CPU 1301, a ROM 1302, a RAM 1303, an input device 1304, an output device 1305, and a sphygmomanometer 101, which are connected to each other via a bus system 1306.
- the above-described functions of the blood pressure measurement device 100 can be realized by the CPU 1301 reading and executing a program stored in a computer-readable recording medium (ROM 1302).
- the RAM 1303 is used as a work memory by the CPU 1301.
- an auxiliary storage device for example, a hard disk drive (HDD) or a solid state drive (SDD) may be provided, used as the storage unit 108, and may further store a program.
- the input device 1304 includes, for example, a keyboard, a mouse, and a microphone, and accepts an operation from the user.
- the input device 1304 includes an operation button for causing the sphygmomanometer 101 to start measurement, an operation button for performing calibration, and an operation button for starting or stopping communication.
- the output device 1305 includes, for example, a display device such as a liquid crystal display device and a speaker.
- the sphygmomanometer 101 transmits / receives a signal to / from another computer using a communication device, for example, and receives measurement data from the blood pressure measurement device, for example.
- the communication device often uses a communication method capable of exchanging data with each other at a short distance, for example, using a short-range wireless communication method, specifically, Bluetooth (registered trademark), Transform Jet (registered trademark), There are communication systems such as ZigBee (registered trademark) and IRDA (registered trademark).
- a program for executing the operations performed by the feature amount extraction unit 102, the measurement stability determination unit 103, the sensor contact state determination unit 104, the similarity determination unit 105, and the reliability calculation unit 107 described above is the ROM 1302 or the above.
- the program may be stored in the auxiliary storage device and the CPU 1301 may execute the program.
- the program may be stored in a server or the like different from the blood pressure measurement device 100, and a CPU such as the server may execute the program.
- the pressure pulse wave time series data (or blood pressure value time series data) measured by the sphygmomanometer 101 can be transmitted to the server and processed by the server to obtain the reliability. In this case, since processing is performed by the server, the processing speed may increase.
- the device portions of the feature amount extraction unit 102, the measurement stability determination unit 103, the sensor contact state determination unit 104, the similarity determination unit 105, and the reliability calculation unit 107 are removed from the blood pressure measurement device 100, blood pressure measurement is performed.
- the size of the apparatus 100 is reduced, and the sensor can be easily placed at a position where the sensor can be measured accurately. As a result, the burden on the user is reduced, and accurate blood pressure measurement can be performed easily.
- the reliability to the measured blood pressure value can be evaluated for each opportunity (for example, for each heartbeat), and thus measured according to the measurement subject.
- the reliability of the blood pressure value can be evaluated.
- the similarity is determined to be higher than the first threshold value, the calculation is performed.
- the section calculated that the reliability in this interval was the highest, so that it was determined that the stability of the diastolic blood pressure was high, the tonogram was in a tonometric state, and the similarity to the start of tonogram measurement was high
- blood pressure data is obtained under the best conditions.
- the reliability of the blood pressure value cannot be fully evaluated only by the reliability evaluation based on the tonogram information of each beat.
- the reliability of the blood pressure value cannot be fully evaluated only by the reliability evaluation based on the tonogram information of each beat.
- the similarity into the determination condition, it is possible to obtain a reliability of whether the blood pressure value is correct by evaluating the similarity with the tonogram at the time of calibration that is normally performed at the start of measurement. . For example, even if the reliability increases in the determination conditions other than the similarity during the measurement, if the tonogram at the time of calibration is not similar, a correct blood pressure value cannot be calculated, and the calculation can be made to reduce the reliability. It can be seen that the reliability considering the similarity of the blood pressure measurement device of the embodiment is more accurate.
- the apparatus of the present invention can be realized by a computer and a program, and can be recorded on a recording medium or provided through a network.
- Each of the above devices and their device portions can be implemented with either a hardware configuration or a combined configuration of hardware resources and software.
- As the software of the combined configuration a program for causing the computer to realize the functions of each device by being installed in a computer from a network or a computer-readable recording medium in advance and executed by a processor of the computer is used.
- the present invention is not limited to the above-described embodiment as it is, and can be embodied by modifying the constituent elements without departing from the scope of the invention in the implementation stage. Further, various inventions can be formed by appropriately combining a plurality of constituent elements disclosed in the embodiment. For example, some components may be deleted from all the components shown in the embodiment. Furthermore, you may combine suitably the component covering different embodiment.
- a blood pressure measurement device comprising a hardware processor and a memory
- the hardware processor is Obtaining blood pressure data including blood pressure values for each heartbeat by detecting the pressure pulse wave by one or more sensors, Extracting one or more feature quantities of the blood pressure data; Based on the feature amount, the blood pressure data is configured to calculate a reliability indicating how accurately the blood pressure value indicates a blood pressure value
- the memory is A blood pressure measurement apparatus comprising: a storage unit that stores the reliability and the blood pressure data.
- a blood pressure measurement method comprising calculating a reliability indicating how accurately the blood pressure data indicates a blood pressure value based on the feature amount using at least one hardware processor.
Landscapes
- Health & Medical Sciences (AREA)
- Life Sciences & Earth Sciences (AREA)
- Engineering & Computer Science (AREA)
- Molecular Biology (AREA)
- Animal Behavior & Ethology (AREA)
- Veterinary Medicine (AREA)
- Biophysics (AREA)
- Pathology (AREA)
- Public Health (AREA)
- Biomedical Technology (AREA)
- Heart & Thoracic Surgery (AREA)
- Medical Informatics (AREA)
- General Health & Medical Sciences (AREA)
- Surgery (AREA)
- Physics & Mathematics (AREA)
- Cardiology (AREA)
- Physiology (AREA)
- Vascular Medicine (AREA)
- Artificial Intelligence (AREA)
- Computer Vision & Pattern Recognition (AREA)
- Psychiatry (AREA)
- Signal Processing (AREA)
- Ophthalmology & Optometry (AREA)
- Measuring Pulse, Heart Rate, Blood Pressure Or Blood Flow (AREA)
Abstract
The present invention calculates a reliability level for blood pressure data that includes heartbeat-by-heartbeat blood pressure values obtained by measuring blood pressure using one or more pressure sensors. The blood pressure measurement device according to one embodiment comprises: a blood pressure meter that uses one or more sensors to detect a pressure pulse wave and thereby obtains blood pressure data that includes heartbeat-by-heartbeat blood pressure values; an extraction unit that that extracts one or more feature values from the blood pressure data; and a calculation unit that, on the basis of the feature value(s), calculates a reliability level that indicates how accurately the blood pressure data presents the blood pressure values.
Description
この発明は、生体情報を連続測定する血圧測定装置、方法及びプログラムに関する。
The present invention relates to a blood pressure measurement device, method, and program for continuously measuring biological information.
生体情報を活用して早期に生体の異変を察知して治療に役立てることは、センサ技術の発展に伴い、高性能なセンサが容易に利用できる環境になり医療における重要性も次第に増してきている。
手首の橈骨動脈等の動脈が通る生体部位に圧力センサを直接接触させた状態で、この圧力センサにより検出される情報を用いて脈拍や血圧等の生体情報を測定することのできるトノメトリ方式による血圧測定装置が知られている(例えば日本国特開2004-222847号公報参照)。 Utilizing biological information to detect biological changes at an early stage and use them for treatment has become an environment where high-performance sensors can be used easily with the development of sensor technology, and the importance in medicine has gradually increased. .
Blood pressure by the tonometry method that can measure biological information such as pulse and blood pressure using information detected by the pressure sensor in a state where the pressure sensor is in direct contact with a living body part through which an artery such as the radial artery of the wrist passes A measuring apparatus is known (see, for example, Japanese Patent Application Laid-Open No. 2004-222847).
日本国特開2004-222847号公報に記載の血圧測定装置は、センサが計測対象の動脈に対して不適切な配置状態にあるかどうかを判定して、血圧情報の信頼度を算出している。
The blood pressure measurement device described in Japanese Patent Application Laid-Open No. 2004-222847 determines whether the sensor is in an inappropriate arrangement state with respect to the artery to be measured, and calculates the reliability of the blood pressure information. .
しかし、日本国特開2004-222847号公報に記載の血圧測定装置では、判定タイミングでの接触状態から信頼度を算出しているが、校正時の配置状態を基に校正式が決定され、この校正式を用いて血圧値が算出されるため、不適切な配置状態でなくとも校正時の接触状態と異なっている場合は、正しい血圧値が算出されない。
この発明は上記事情に着目してなされたもので、その目的とするところは、1つまたは複数のセンサを用いて血圧を測定することで得られた一心拍ごとの血圧値を含む血圧データの信頼度を算出することができる血圧測定装置、方法及びプログラムを提供することである。 However, in the blood pressure measurement device described in Japanese Patent Application Laid-Open No. 2004-222847, the reliability is calculated from the contact state at the determination timing, but the calibration formula is determined based on the arrangement state at the time of calibration. Since the blood pressure value is calculated using the calibration formula, the correct blood pressure value is not calculated if it is different from the contact state at the time of calibration even if it is not in an inappropriate arrangement state.
The present invention has been made by paying attention to the above circumstances, and its object is to obtain blood pressure data including blood pressure values for each heartbeat obtained by measuring blood pressure using one or more sensors. To provide a blood pressure measurement device, method, and program capable of calculating reliability.
上記課題を解決するためにこの発明の第1の態様は、血圧測定装置であって、1つまたは複数のセンサによって圧脈波を検出することで一心拍ごとの血圧値を含む血圧データを得る血圧計と、前記血圧データの1以上の特徴量を抽出する抽出部と、前記特徴量に基づいて、前記血圧データがどの程度正確に血圧値を示しているかを示す信頼度を算出する算出部と、を備えるものである。
In order to solve the above-described problem, a first aspect of the present invention is a blood pressure measurement device that obtains blood pressure data including blood pressure values for each heartbeat by detecting a pressure pulse wave with one or more sensors. A sphygmomanometer, an extraction unit that extracts one or more feature amounts of the blood pressure data, and a calculation unit that calculates a reliability indicating how accurately the blood pressure data indicates a blood pressure value based on the feature amounts Are provided.
この発明の第2の態様は、前記抽出部は、前記圧脈波が安定しているかを示す安定性特徴量、前記1つまたは複数のセンサと測定部位との接触状態が正常であるかを示すセンサ接触状態特徴量、及び計測開始時と所望の計測時刻との間での前記圧脈波の類似度を示す類似度特徴量のうちの少なくとも1つの特徴量を抽出し、前記算出部は、前記少なくとも1つの特徴量に基づいて前記信頼度を算出するものである。
According to a second aspect of the present invention, the extraction unit determines whether the pressure feature is stable, whether the contact state between the one or more sensors and the measurement site is normal. At least one feature amount of the sensor contact state feature amount and the similarity feature amount indicating the similarity of the pressure pulse wave between the measurement start time and a desired measurement time, and the calculation unit The reliability is calculated based on the at least one feature quantity.
この発明の第3の態様は、前記圧脈波が安定していると判定され、かつ前記接触状態が正常であると判定された場合に、さらに前記類似度がしきい値よりも高いと判定された場合には、前記算出部はこの区間での前記信頼度を高いと設定するものである。
According to a third aspect of the present invention, when the pressure pulse wave is determined to be stable and the contact state is determined to be normal, the similarity is further determined to be higher than a threshold value. If it is determined, the calculation unit sets the reliability in this section to be high.
この発明の第1の態様によれば、血圧測定装置は、1つまたは複数のセンサを用いて圧脈波を検出することで一心拍ごとの血圧値を含む血圧データを得て、前記血圧データの1以上の特徴量を抽出して、前記特徴量に基づいて、前記血圧データがどの程度正確に血圧値を示しているかを示す信頼度を算出することにより、測定された血圧値への信頼度を測定する機会ごとに評価することができ、従って測定対象者に合わせて測定された血圧値への信頼度を評価することができる。
According to the first aspect of the present invention, the blood pressure measurement device obtains blood pressure data including a blood pressure value for each heartbeat by detecting a pressure pulse wave using one or a plurality of sensors, and the blood pressure data One or more feature amounts of the blood pressure data are extracted, and a confidence level indicating how accurately the blood pressure data indicates the blood pressure value is calculated based on the feature amount, whereby the confidence in the measured blood pressure value is calculated. The degree of measurement can be evaluated for each opportunity to measure the degree, and therefore, the reliability of the measured blood pressure value can be evaluated according to the measurement subject.
この発明の第2の態様によれば、抽出部は、圧脈波が安定しているかを示す安定性特徴量、血圧計に含まれる1つまたは複数のセンサと測定部位との接触状態が正常であるかを示すセンサ接触状態特徴量、及び計測開始時と所望の計測時刻との間での圧脈波の類似度を示す類似度特徴量のうちの少なくとも1つの特徴量を抽出し、算出部は、前記少なくとも1つの特徴量に基づいて信頼度を算出することにより、圧脈波が安定しているか、センサと測定部位の接触状態が正常であるか、計測開始時と計測時刻との間で圧脈波が類似しているかの少なくともいずれか1つに基づいて信頼度を算出するので、これらのいずれかの特徴量から信頼度を算出することができる。この結果、測定された血圧値への信頼度であり、いずれかの特徴量に特有の信頼度を測定する機会ごとに評価することができる。
According to the second aspect of the present invention, the extraction unit has a stable feature amount indicating whether the pressure pulse wave is stable, and the contact state between one or more sensors included in the sphygmomanometer and the measurement site is normal. At least one feature amount is extracted from the sensor contact state feature amount indicating whether or not and the similarity feature amount indicating the similarity of the pressure pulse wave between the measurement start time and the desired measurement time The unit calculates the reliability based on the at least one feature amount, thereby determining whether the pressure pulse wave is stable, whether the contact state between the sensor and the measurement site is normal, the measurement start time and the measurement time Since the reliability is calculated based on at least one of whether the pressure pulse waves are similar to each other, the reliability can be calculated from any one of these feature amounts. As a result, it is the reliability to the measured blood pressure value, and can be evaluated for each opportunity to measure the reliability specific to any feature amount.
この発明の第3の態様によれば、圧脈波の安定性が高く、センサと接触部位との接触状態が正常であり、かつ類似度がしきい値以下と判定された場合には、少し信頼度が落ちたことが分かる。測定により得られた血圧データの信頼度を細かく算出することが可能になり、同じ生体でも測定時間が異なることで信頼度が変化することもあるので、測定機会での測定状況に忠実な信頼度を得ることができる。この結果、より確実に精度の高い血圧値の時系列データを得ることが可能になる。
According to the third aspect of the present invention, when the stability of the pressure pulse wave is high, the contact state between the sensor and the contact part is normal, and the similarity is determined to be less than or equal to the threshold value, It can be seen that the reliability has dropped. The reliability of blood pressure data obtained by measurement can be calculated in detail, and the reliability may change due to different measurement times even in the same living body, so the reliability is faithful to the measurement situation at the measurement opportunity Can be obtained. As a result, it is possible to obtain time series data of blood pressure values with higher accuracy.
すなわちこの発明の各態様によれば、血圧を測定することで得られた一心拍ごとの血圧値を含む血圧データの信頼度を算出することができる血圧測定装置、方法及びプログラムを提供することができる。
That is, according to each aspect of the present invention, it is possible to provide a blood pressure measurement device, method, and program capable of calculating the reliability of blood pressure data including blood pressure values for each heartbeat obtained by measuring blood pressure. it can.
以下、図面を参照してこの発明に係る実施形態の血圧測定装置、方法及びプログラムを説明する。なお、以下の実施形態では、同一の番号を付した部分については同様の動作を行うものとして、重ねての説明を省略する。
本実施形態に係る血圧測定装置100について図1乃至図5を参照して説明する。図1は、血圧測定装置100の機能ブロック図であり、血圧を時間的に連続して測定する血圧計101と、計測安定性判定部103と、センサ接触状態判定部104と、類似度判定部105と、信頼度算出部107と、記憶部108と、を示している。図2は、血圧計101の機能ブロック図であり、圧脈波情報を基に血圧を時間的に連続して一心拍ごとに測定することができるものである。本実施形態では、主として、トノメトリ法を採用する血圧計101を用いる場合について説明を行う。なお、血圧計101は、トノメトリ法を採用する血圧計に限らず、1つまたは複数のセンサを用いて圧脈波を測定することができる任意の血圧計であってもよい。図3は、一例としてトノメトリ方式の血圧測定装置100が装着されるイメージ図であり、手のひらを横(手を広げた場合の指が並ぶ方向)から見た概略透視図である。図3は、圧力センサが橈骨動脈に交差して二列に配置されている一例を示している。図3は、血圧測定装置100が腕の手のひら側の腕に載せられているだけのように見えるが、実際では血圧測定装置100は腕に巻き付いている。 Hereinafter, a blood pressure measurement device, method, and program according to embodiments of the present invention will be described with reference to the drawings. Note that, in the following embodiments, the same numbered portions are assumed to perform the same operation, and repeated description is omitted.
A bloodpressure measurement apparatus 100 according to the present embodiment will be described with reference to FIGS. 1 to 5. FIG. 1 is a functional block diagram of a blood pressure measurement device 100, which includes a sphygmomanometer 101 that measures blood pressure continuously in time, a measurement stability determination unit 103, a sensor contact state determination unit 104, and a similarity determination unit. 105, a reliability calculation unit 107, and a storage unit 108. FIG. 2 is a functional block diagram of the sphygmomanometer 101. The blood pressure can be measured for each heartbeat continuously in time based on the pressure pulse wave information. In the present embodiment, the case where the sphygmomanometer 101 employing the tonometry method is mainly used will be described. The sphygmomanometer 101 is not limited to a sphygmomanometer that employs the tonometry method, and may be any sphygmomanometer that can measure a pressure pulse wave using one or a plurality of sensors. FIG. 3 is an image diagram in which the tonometric blood pressure measuring device 100 is worn as an example, and is a schematic perspective view of the palm as seen from the side (the direction in which fingers are lined up when the hand is spread). FIG. 3 shows an example in which the pressure sensors are arranged in two rows crossing the radial artery. Although FIG. 3 appears that the blood pressure measurement device 100 is only placed on the arm on the palm side of the arm, the blood pressure measurement device 100 is actually wrapped around the arm.
本実施形態に係る血圧測定装置100について図1乃至図5を参照して説明する。図1は、血圧測定装置100の機能ブロック図であり、血圧を時間的に連続して測定する血圧計101と、計測安定性判定部103と、センサ接触状態判定部104と、類似度判定部105と、信頼度算出部107と、記憶部108と、を示している。図2は、血圧計101の機能ブロック図であり、圧脈波情報を基に血圧を時間的に連続して一心拍ごとに測定することができるものである。本実施形態では、主として、トノメトリ法を採用する血圧計101を用いる場合について説明を行う。なお、血圧計101は、トノメトリ法を採用する血圧計に限らず、1つまたは複数のセンサを用いて圧脈波を測定することができる任意の血圧計であってもよい。図3は、一例としてトノメトリ方式の血圧測定装置100が装着されるイメージ図であり、手のひらを横(手を広げた場合の指が並ぶ方向)から見た概略透視図である。図3は、圧力センサが橈骨動脈に交差して二列に配置されている一例を示している。図3は、血圧測定装置100が腕の手のひら側の腕に載せられているだけのように見えるが、実際では血圧測定装置100は腕に巻き付いている。 Hereinafter, a blood pressure measurement device, method, and program according to embodiments of the present invention will be described with reference to the drawings. Note that, in the following embodiments, the same numbered portions are assumed to perform the same operation, and repeated description is omitted.
A blood
図4は、血圧測定装置100が手首に装着されている状態でセンサ部201の位置での血圧測定装置100と手首Wの断面図である。図4では橈骨動脈RAが血圧測定装置100に押圧されていてその上部が扁平化されていることも示している。図5は、血圧測定装置100の生体に接触する側から見た図であり、この接触する面にセンサ部201が2列に平行に配置されている。センサ部201は、血圧測定装置100が手首Wに装着された状態で橈骨動脈が延伸している方向Aに交差する方向Bにセンサが複数個並んでいる。
FIG. 4 is a cross-sectional view of the blood pressure measurement device 100 and the wrist W at the position of the sensor unit 201 in a state where the blood pressure measurement device 100 is attached to the wrist. FIG. 4 also shows that the radial artery RA is pressed against the blood pressure measurement device 100 and the upper part thereof is flattened. FIG. 5 is a view of the blood pressure measurement device 100 as viewed from the side in contact with the living body, and the sensor units 201 are arranged in parallel in two rows on the contacting surface. In the sensor unit 201, a plurality of sensors are arranged in a direction B that intersects the direction A in which the radial artery extends in a state where the blood pressure measurement device 100 is attached to the wrist W.
血圧測定装置100は、図1に示すように、血圧計101、特徴量抽出部102、計測安定性判定部103、センサ接触状態判定部104、類似度判定部105、信頼度算出部107、及び記憶部108を含む。
As shown in FIG. 1, the blood pressure measurement device 100 includes a sphygmomanometer 101, a feature amount extraction unit 102, a measurement stability determination unit 103, a sensor contact state determination unit 104, a similarity determination unit 105, a reliability calculation unit 107, and A storage unit 108 is included.
血圧測定装置100は例えば、環状になっていて、手首等にブレスレットのように巻き付き、生体情報から血圧を測定する。血圧測定装置100は、図2及び図3に示すように、センサ部201(具体的には、圧力センサ)が橈骨動脈上に位置するように血圧測定装置100が配置される。また、血圧測定装置100は心臓の高さに合わせて配置することが好ましい。
The blood pressure measurement device 100 is, for example, in the form of a ring, wound around a wrist or the like like a bracelet, and measures blood pressure from biological information. As shown in FIGS. 2 and 3, the blood pressure measurement device 100 is arranged such that the sensor unit 201 (specifically, the pressure sensor) is positioned on the radial artery. Moreover, it is preferable to arrange | position the blood pressure measuring apparatus 100 according to the height of the heart.
血圧計101は、トノメトリ法によって時間的に連続した一心拍ごとの圧脈波を測定する。トノメトリ法は血管を圧力センサで圧扁することにより圧脈波を計測し血圧を決定する手法である。血管の厚さが一様な円管と見なすと、血管内の血液の流れ、拍動の有無に関係なく血管壁を考慮してラプラスの法則に従い、血管の内圧(血圧)と血管の外圧(圧脈波の圧力)との関係式を導くことができる。この関係式で押圧面において血管が圧扁されている条件下では、血管の外壁及び内壁の半径を近似することにより、圧脈波の圧力を血圧が等しいと近似できる。この結果、血圧計101は装着される生体の血圧値を一心拍ごとに測定することになる。
The sphygmomanometer 101 measures the pressure pulse wave for each heartbeat that is temporally continuous by the tonometry method. The tonometry method is a method for determining a blood pressure by measuring a pressure pulse wave by compressing a blood vessel with a pressure sensor. Considering a circular tube with a uniform blood vessel thickness, the blood pressure in the blood vessel and the external pressure of the blood vessel (blood pressure) The relational expression with the pressure of the pressure pulse wave can be derived. Under the condition that the blood vessel is compressed on the pressing surface in this relational expression, the pressure of the pressure pulse wave can be approximated to be equal to the blood pressure by approximating the radius of the outer wall and the inner wall of the blood vessel. As a result, the sphygmomanometer 101 measures the blood pressure value of the living body to be worn for each heartbeat.
特徴量抽出部102は、時系列の一心拍ごとの血圧の分布からこの分布の特徴量を抽出する。特徴量は大きく2種類あり、トノグラムのAC成分から抽出されるもの、トノグラムのDC成分から抽出されるものがある。ここでトノグラムとは、複数の圧力センサの番号(例えば、チャンネル番号)に対する、圧力センサごとの血圧に起因する算出された特徴量の分布形状のことである。トノグラムはセンサ部201に含まれるセンサアレイごとに得られる。また、トノグラムのAC成分とは一心拍単位の最高血圧値と最低血圧値との差分値に相当し、トノグラムのDC成分とは一心拍単位の最低血圧値に相当する。トノグラムのAC成分の一例を図6に示し、トノグラムのDC成分の一例を図7に示す。最高血圧値は収縮期血圧(SBP:systolic blood pressure)に対応し、最低血圧値は拡張期血圧(DBP:diastolic blood pressure)に対応する。特徴量の詳細については後に図9A、図9B及び図9Cを参照して説明する。
The feature quantity extraction unit 102 extracts the feature quantity of this distribution from the blood pressure distribution for each heartbeat in time series. There are two types of feature quantities, one extracted from the AC component of the tonogram and the other extracted from the DC component of the tonogram. Here, the tonogram is a distribution shape of a calculated feature amount caused by blood pressure for each pressure sensor with respect to a plurality of pressure sensor numbers (for example, channel numbers). A tonogram is obtained for each sensor array included in the sensor unit 201. The AC component of the tonogram corresponds to a difference value between the maximum blood pressure value in one heart rate and the minimum blood pressure value, and the DC component in the tonogram corresponds to a minimum blood pressure value in one heart rate unit. An example of the AC component of the tonogram is shown in FIG. 6, and an example of the DC component of the tonogram is shown in FIG. The maximum blood pressure value corresponds to systolic blood pressure (SBP: systolic blood pressure), and the minimum blood pressure value corresponds to diastolic blood pressure (DBP). Details of the feature amount will be described later with reference to FIGS. 9A, 9B, and 9C.
計測安定性判定部103は、測定により得られた圧脈波が安定しているかどうかを判定する。例えば、計測安定性判定部103は、特徴量抽出部102で抽出される特徴量の1つである1心拍前とのトノグラム(DC)変化量総和に基づいて、血圧計101からの脈波が安定しているかどうかを判定する。1心拍前とのトノグラム(DC)変化量総和とは、チャンネルごとにトノグラムのDC成分の1心拍前との変化量を算出し、そのチャンネルごとの変化量を全てのチャンネルで総和したものである。このトノグラム(DC)変化量総和が少ない区間ほどセンサ部201が安定して生体に装着されていて正確な血圧を取得していると見なすことができる。本実施形態の計測安定性判定部103は、例えば、トノグラム(DC)変化量総和があるしきい値以下の期間は安定して正確な血圧を取得できる安定区間と定義し、トノグラム(DC)変化量総和がしきい値よりも大きい期間は安定して正確な血圧を取得できない不安定区間と定義する。計測安定性判定部103からは、例えば、安定区間は信頼度が高いまたは中間とし、不安定区間は信頼度が低いとする。また例えば、安定区間で検出した血圧値のみを採用するとしてもよい。安定区間及び不安定区間の具体例については後に図10を参照して説明する。
The measurement stability determination unit 103 determines whether the pressure pulse wave obtained by the measurement is stable. For example, the measurement stability determination unit 103 determines that the pulse wave from the sphygmomanometer 101 is based on the total amount of change in tonogram (DC) before one heartbeat, which is one of the feature amounts extracted by the feature amount extraction unit 102. Determine if it is stable. The total tonogram (DC) change amount before one heartbeat is the sum of the change amount of each tonogram (DC) before one heartbeat and the change amount for each channel for all channels. . It can be considered that the section where the total amount of change in tonogram (DC) is smaller is that the sensor unit 201 is more stably attached to the living body and acquires an accurate blood pressure. The measurement stability determination unit 103 according to the present embodiment defines, for example, a stable interval in which a tonogram (DC) change amount sum is equal to or less than a certain threshold as a stable interval in which accurate blood pressure can be acquired, and a tonogram (DC) change. A period in which the total amount is larger than the threshold is defined as an unstable period in which stable and accurate blood pressure cannot be acquired. From the measurement stability determination unit 103, for example, it is assumed that the stability interval is high or intermediate, and the unstable interval is low. For example, only the blood pressure value detected in the stable section may be adopted. Specific examples of the stable section and the unstable section will be described later with reference to FIG.
センサ接触状態判定部104は、血圧測定に用いるセンサ(例えば圧力センサ)と測定部位との接触状態が正常(適切)であるかどうかを判定する。例えば、センサ接触状態判定部104は、特徴量抽出部102で抽出される特徴量であるトノグラム(AC)極大値Chと、トノグラム(AC)振幅差と、トノグラム(DC)振幅差との3つの特徴量に基づいて、接触状態を判定する。トノグラム(AC)極大値Chとは、トノグラムのAC成分の出力値が極大となるチャンネルである。また、トノグラム(AC)振幅差とは、トノグラムのAC成分の出力値が極大となるチャンネルの前後の数チャンネルの間でのAC成分の振幅差のことである。さらに、トノグラム(DC)振幅差とは、トノグラムのAC成分の出力値が極大となるチャンネルの前後の数チャンネルの間でのDC成分の振幅差のことである。(1)トノグラム(AC)極大値Chが所定の範囲に含まれるか、(2)トノグラム(AC)振幅差がしきい値よりも大きいか、(3)トノグラム(DC)振幅差がしきい値よりも大きいかにより、センサ接触状態判定部104は、トノメトリ状態であるか、トノメトリ状態を逸脱した状態であるかを判定する。トノメトリ状態は、トノメトリ方式の血圧計を用いる場合において圧力センサが測定部位に対して適切に配置されている状態に対応する。上記(1)に関して、トノグラム(AC)極大値Chは中央(第23チャンネル)付近に位置することが望ましく、上記の所定の範囲は、例えば、15~31チャンネルの範囲とされる。
The sensor contact state determination unit 104 determines whether the contact state between a sensor (for example, a pressure sensor) used for blood pressure measurement and a measurement site is normal (appropriate). For example, the sensor contact state determination unit 104 has three tonogram (AC) maximum values Ch, which are feature amounts extracted by the feature amount extraction unit 102, a tonogram (AC) amplitude difference, and a tonogram (DC) amplitude difference. The contact state is determined based on the feature amount. The tonogram (AC) maximum value Ch is a channel in which the output value of the AC component of the tonogram is a maximum. The tonogram (AC) amplitude difference is an AC component amplitude difference between several channels before and after the channel where the output value of the AC component of the tonogram becomes maximum. Furthermore, the tonogram (DC) amplitude difference is an amplitude difference of the DC component between several channels before and after the channel where the output value of the AC component of the tonogram becomes a maximum. (1) Tonogram (AC) maximum value Ch is included in a predetermined range, (2) Tonogram (AC) amplitude difference is larger than threshold, (3) Tonogram (DC) amplitude difference is threshold The sensor contact state determination unit 104 determines whether the state is a tonometry state or a state that deviates from the tonometry state. The tonometry state corresponds to a state in which the pressure sensor is appropriately arranged with respect to the measurement site when using a tonometry type sphygmomanometer. Regarding (1) above, it is desirable that the tonogram (AC) maximum Ch is located near the center (23rd channel), and the predetermined range is, for example, a range of 15 to 31 channels.
類似度判定部105は、特徴量抽出部102で抽出される特徴量であるトノグラム(AC)変化量総和及びトノグラム(DC)変化量総和に基づいて、圧脈波の初期状態と現在の圧脈波の状態との類似度を判定する。トノグラム(AC)変化量総和は、トノグラムのAC成分のある時刻における各チャンネルの出力値と、トノグラムのAC成分の初期状態(例えば、較正のとき)での各チャンネルの出力値(例えば、計測開始1分間の各チャンネルの平均値)と、の変化量を全てのチャンネルについて総和したものである。同様にトノグラム(DC)変化量総和は、トノグラムのDC成分のある時刻における各チャンネルの出力値と、計測開始1分間の各チャンネルの平均値と、の変化量を全てのチャンネルについて総和したものである。較正のときとは、圧脈波の圧力値を血圧値に変換するときである。計測開始時は較正のときと通常は同じ時刻になる。計測開始1分間の各チャンネルの平均値によって、初期のトノグラムの状態を示すので、類似度判定部105はある時刻のトノグラムが初期のトノグラムとどの程度類似しているかを判定することができる。類似度判定部105は、例えばトノグラム(AC)変化量総和及びトノグラム(DC)変化量総和が共にそれぞれのしきい値(第1しきい値)よりも小さい場合に類似度が高いと判定し、そうでない場合には類似度が低いと判定する。この他にも、変化量総和の値を点数に対応付けて類似度を例えば百分率で評価してもよく、判定結果表示手法は、様々な変形例がある。
The similarity determination unit 105 determines the initial state of the pressure pulse wave and the current pressure pulse based on the tonogram (AC) change amount sum and the tonogram (DC) change amount sum that are the feature amounts extracted by the feature amount extraction unit 102. The similarity with the wave state is determined. The total tonogram (AC) change amount is the output value of each channel at a certain time of the AC component of the tonogram and the output value of each channel in the initial state (for example, during calibration) of the tonogram AC component (eg, start of measurement) The average value of each channel for 1 minute) is summed up for all channels. Similarly, the total amount of change in the tonogram (DC) is the sum of the amount of change of the output value of each channel at a certain time of the DC component of the tonogram and the average value of each channel for one minute of measurement for all channels. is there. The time of calibration is when the pressure value of the pressure pulse wave is converted into a blood pressure value. The measurement starts normally at the same time as calibration. Since the initial tonogram state is indicated by the average value of each channel for one minute from the start of measurement, the similarity determination unit 105 can determine how similar the tonogram at a certain time is to the initial tonogram. The similarity determination unit 105 determines that the similarity is high when, for example, the tonogram (AC) change amount sum and the tonogram (DC) change amount sum are both smaller than the respective threshold values (first threshold values), Otherwise, it is determined that the similarity is low. In addition, the degree of similarity may be evaluated by, for example, percentage by associating the value of the total amount of change with the score, and the determination result display method has various modifications.
計測安定性判定部103で安定区間と判定され、センサ接触状態判定部104でトノメトリ状態であると判定されているにも関わらず、類似度判定部105で類似度が低いと判定された場合には、血圧の基準値がシフトしている可能性が高い。例えば、姿勢変化、手首の位置が変化、手首の向きが変化、これらに伴う装着状態変化がある。
When the measurement stability determination unit 103 determines that the interval is stable and the sensor contact state determination unit 104 determines that the tonometry state is present, but the similarity determination unit 105 determines that the similarity is low. There is a high possibility that the reference value of blood pressure has shifted. For example, there are posture changes, wrist position changes, wrist orientation changes, and accompanying wear state changes.
上記では、複数の圧力センサを用いて圧脈波を測定するトノメトリ方式の血圧計を用いる例について説明を行った。1つの圧力センサを用いて圧脈波を測定する血圧計を用いる場合にも、計測安定性判定部103、センサ接触状態判定部104、及び類似度判定部105は、上述したものと同様の方法で判定処理を行うことができる。この場合、トノグラムを作成する処理が不要となる。例えば、計測安定性判定部103は、AC成分の変化量、すなわち、現在のAC成分と一心拍前のAC成分との差に基づいて、圧脈波が安定しているかどうかを判定することができる。AC成分は、一心拍分の圧脈波波形における最大値から最小値を引いた値に相当する。センサ接触状態判定部104は、何らかのセンサの出力信号に基づいて、圧力センサと測定部位との接触状態が正常であるかどうかを判定することができる。類似度判定部105は、AC成分の変化量及びDC成分の変化量に基づいて、計測開始時と対象の計測時刻との間での圧脈波の類似度を算出することができる。DC成分は、一心拍分の圧脈波波形における最小値に相当する。
In the above description, an example using a tonometric sphygmomanometer that measures a pressure pulse wave using a plurality of pressure sensors has been described. Even when a sphygmomanometer that measures a pressure pulse wave using one pressure sensor is used, the measurement stability determination unit 103, the sensor contact state determination unit 104, and the similarity determination unit 105 are the same methods as described above. The determination process can be performed. In this case, a process for creating a tonogram is not necessary. For example, the measurement stability determination unit 103 can determine whether the pressure pulse wave is stable based on the change amount of the AC component, that is, the difference between the current AC component and the AC component before one heartbeat. it can. The AC component corresponds to a value obtained by subtracting the minimum value from the maximum value in the pressure pulse waveform for one heartbeat. The sensor contact state determination unit 104 can determine whether the contact state between the pressure sensor and the measurement site is normal based on an output signal from some sensor. The similarity determination unit 105 can calculate the similarity of the pressure pulse wave between the measurement start time and the target measurement time based on the AC component change amount and the DC component change amount. The DC component corresponds to the minimum value in the pressure pulse waveform for one heartbeat.
信頼度算出部107は、計測安定性判定部103、センサ接触状態判定部104、及び類似度判定部105の判定結果に基づいて、血圧計101からの血圧データの信頼度を測定区間ごとに算出する。信頼度算出部107は、例えば、計測安定性判定部103で血圧データが安定区間であると判定された区間に対して、センサ接触状態判定部104でトノメトリ状態であると判定された場合には信頼度が中以上と判定し、トノメトリ状態を逸脱した状態と判定された場合には信頼度が低いと判定する。一方、計測安定性判定部103で血圧データが不安定区間であると判定された区間に対しては、信頼度が低と判定する。センサ接触状態判定部104で信頼度が中以上と判定された場合には、さらに類似度判定部105で類似度が高いと判定された場合には信頼度が高いと判定し、類似度が低いと判定された場合には信頼度が中位であると判定する。このようにして信頼度算出部107は、血圧値の時系列データについて区間ごとに信頼度を付与し、記憶部108に記録する。
The reliability calculation unit 107 calculates the reliability of the blood pressure data from the sphygmomanometer 101 for each measurement section based on the determination results of the measurement stability determination unit 103, the sensor contact state determination unit 104, and the similarity determination unit 105. To do. For example, when the measurement stability determination unit 103 determines that the blood pressure data is a stable interval, the reliability calculation unit 107 determines that the sensor contact state determination unit 104 is in the tonometry state. If it is determined that the reliability is medium or higher and it is determined that the state deviates from the tonometry state, it is determined that the reliability is low. On the other hand, the measurement stability determination unit 103 determines that the reliability is low for the section in which the blood pressure data is determined to be an unstable section. If the sensor contact state determination unit 104 determines that the reliability is medium or higher, if the similarity determination unit 105 determines that the similarity is high, it determines that the reliability is high and the similarity is low. Is determined, the reliability is determined to be medium. In this way, the reliability calculation unit 107 gives the reliability for each section of the time-series data of blood pressure values, and records it in the storage unit 108.
信頼度算出部107は、例えば、計測安定性判定部103で不安定区間と判定されると、他の判定部の結果を参照することなく、信頼度が低いと算出する。一方、計測安定性判定部103で安定区間と判定されると、センサ接触状態判定部104でトノメトリ状態であるかを判定するが、トノメトリ状態を逸脱している場合には、他の判定部の結果を参照することなく、信頼度が低いと算出する。
For example, when the measurement stability determination unit 103 determines that the measurement period is an unstable section, the reliability calculation unit 107 calculates that the reliability is low without referring to the results of other determination units. On the other hand, when the measurement stability determination unit 103 determines that the current period is a stable section, the sensor contact state determination unit 104 determines whether the tonometry state is present. It is calculated that the reliability is low without referring to the result.
また、以上とは異なり、各判定部での判定結果を数値で表し、信頼度は数値で示してもよい。判定部103、104、105が算出する判定結果をそれぞれ条件分けして、信頼度を数値で表示してもよい。信頼度が高いとなるのは、計測安定性判定部103で安定区間と判定され、センサ接触状態判定部104でトノメトリ状態と判定され、かつ、類似度判定部105で類似度が高いと判定された場合とする。
Further, unlike the above, the determination result in each determination unit may be expressed by a numerical value, and the reliability may be expressed by a numerical value. The determination results calculated by the determination units 103, 104, and 105 may be divided into conditions, and the reliability may be displayed as a numerical value. The high reliability is determined by the measurement stability determination unit 103 as a stable section, the sensor contact state determination unit 104 determines the tonometry state, and the similarity determination unit 105 determines that the similarity is high. Suppose that
記憶部108は、血圧計101からの血圧データと、その信頼度とを対応付けて記憶する。記憶部108は例えば、ユーザごとに血圧データと、その信頼度とを対応付けて記憶してもよい。記憶部108は血圧計101からの血圧データを信頼度と共に記録する。
The storage unit 108 stores the blood pressure data from the sphygmomanometer 101 and the reliability thereof in association with each other. For example, the storage unit 108 may store blood pressure data and reliability thereof in association with each user. The storage unit 108 records the blood pressure data from the sphygmomanometer 101 together with the reliability.
次に血圧計101について図2を参照して説明する。
血圧計101は、センサ部201、押圧部202、制御部203、記憶部204、操作部205、及び出力部206を含む。センサ部201は、圧脈波を時間的に連続して検出する。例えば、センサ部201は一心拍ごとに圧脈波を検出する。センサ部201は圧力を検出するセンサを含み、図3のように手のひら側に配置され、通常は図3のように腕の延伸方向に2列に平行して配置される。複数のセンサを含むセンサアレイのそれぞれの列は、腕の延伸方向に交差(ほぼ直交)して複数(例えば、46個)のセンサが配置されている。押圧部202は、ポンプ及び弁、圧力センサ、空気袋からなりセンサ部201のセンサ部分を空気袋がふくらむことによって手首に適切な圧力で押圧してセンサの感度を上げることができる。ポンプ及び弁によって空気袋に空気を入れ、圧力センサが空気袋内の圧力を検出し、制御部203が監視して制御することによって適切な圧力に調整する。制御部203は血圧計101の全体の制御を行い、センサ部201からは脈波の時系列データを受け取り、このデータを血圧値の時系列データに変換して血圧データとして記憶部204に記憶させる。記憶部204は血圧データを格納し、制御部203からのリクエストに応じて所望のデータを渡す。操作部205はユーザ等からの入力をキーボード、マウス、及びマイク等から受け付けたり、外部のサーバ等からの指示を有線または無線で受け付ける。出力部206は、制御部203を介して記憶部204に格納されている血圧データを受け取り血圧計101の外部へ渡す。 Next, the blood pressure monitor 101 will be described with reference to FIG.
Thesphygmomanometer 101 includes a sensor unit 201, a pressing unit 202, a control unit 203, a storage unit 204, an operation unit 205, and an output unit 206. The sensor unit 201 detects the pressure pulse wave continuously in time. For example, the sensor unit 201 detects a pressure pulse wave for each heartbeat. The sensor unit 201 includes a sensor for detecting pressure, and is arranged on the palm side as shown in FIG. 3, and is usually arranged in parallel with two rows in the arm extending direction as shown in FIG. Each column of the sensor array including a plurality of sensors intersects (substantially orthogonally) the extending direction of the arm, and a plurality of (for example, 46) sensors are arranged. The pressing unit 202 includes a pump, a valve, a pressure sensor, and an air bag, and the sensor part of the sensor unit 201 can be pressed with an appropriate pressure on the wrist when the air bag swells to increase the sensitivity of the sensor. Air is introduced into the air bag by a pump and a valve, the pressure sensor detects the pressure in the air bag, and the control unit 203 monitors and controls to adjust to an appropriate pressure. The control unit 203 performs overall control of the sphygmomanometer 101, receives pulse wave time-series data from the sensor unit 201, converts this data into blood pressure value time-series data, and stores it in the storage unit 204 as blood pressure data. . The storage unit 204 stores blood pressure data, and passes desired data in response to a request from the control unit 203. The operation unit 205 receives input from a user or the like from a keyboard, a mouse, a microphone, or the like, or receives an instruction from an external server or the like by wire or wireless. The output unit 206 receives blood pressure data stored in the storage unit 204 via the control unit 203 and passes it to the outside of the sphygmomanometer 101.
血圧計101は、センサ部201、押圧部202、制御部203、記憶部204、操作部205、及び出力部206を含む。センサ部201は、圧脈波を時間的に連続して検出する。例えば、センサ部201は一心拍ごとに圧脈波を検出する。センサ部201は圧力を検出するセンサを含み、図3のように手のひら側に配置され、通常は図3のように腕の延伸方向に2列に平行して配置される。複数のセンサを含むセンサアレイのそれぞれの列は、腕の延伸方向に交差(ほぼ直交)して複数(例えば、46個)のセンサが配置されている。押圧部202は、ポンプ及び弁、圧力センサ、空気袋からなりセンサ部201のセンサ部分を空気袋がふくらむことによって手首に適切な圧力で押圧してセンサの感度を上げることができる。ポンプ及び弁によって空気袋に空気を入れ、圧力センサが空気袋内の圧力を検出し、制御部203が監視して制御することによって適切な圧力に調整する。制御部203は血圧計101の全体の制御を行い、センサ部201からは脈波の時系列データを受け取り、このデータを血圧値の時系列データに変換して血圧データとして記憶部204に記憶させる。記憶部204は血圧データを格納し、制御部203からのリクエストに応じて所望のデータを渡す。操作部205はユーザ等からの入力をキーボード、マウス、及びマイク等から受け付けたり、外部のサーバ等からの指示を有線または無線で受け付ける。出力部206は、制御部203を介して記憶部204に格納されている血圧データを受け取り血圧計101の外部へ渡す。 Next, the blood pressure monitor 101 will be described with reference to FIG.
The
血圧測定装置100は、図3及び図4に示すように手首の手のひら側に配置され、血圧計101のセンサ部201が橈骨動脈RA上に位置するように配置される。図4の矢印で示すように押圧部202がセンサ部201を手首Wに押圧し橈骨動脈RAが圧扁する。なお、図3及び図4には示していないが、血圧測定装置100は環状になっていて、手首等にブレスレットのように巻き付き血圧を測定する。
The blood pressure measurement device 100 is arranged on the palm side of the wrist as shown in FIGS. 3 and 4, and the sensor unit 201 of the sphygmomanometer 101 is arranged on the radial artery RA. As shown by the arrows in FIG. 4, the pressing unit 202 presses the sensor unit 201 against the wrist W, and the radial artery RA is compressed. Although not shown in FIGS. 3 and 4, the blood pressure measurement device 100 has an annular shape and wraps around a wrist or the like like a bracelet and measures blood pressure.
次に、血圧測定装置100のセンサ部201について図5を参照して説明する。図5は、センサ部201の手首Wと接触する側の面を示している。図5に示すように、センサ部201は、1以上の(この例では2つの)センサアレイを備え、センサアレイの各々は、方向Bに配列された複数のセンサを有する。方向Bは、血圧測定装置100が被測定者に装着された状態において橈骨動脈の伸びる方向Aと交差する方向である。例えば、方向Aと方向Bは直交していてもよい。1つの列にセンサは例えば、46個(46チャンネルあると称す)配置されている。なお、ここではセンサはチャンネル番号が付与されている。また、センサの配置は図5に示す例に限定されない。
Next, the sensor unit 201 of the blood pressure measurement device 100 will be described with reference to FIG. FIG. 5 shows a surface of the sensor unit 201 on the side in contact with the wrist W. As shown in FIG. 5, the sensor unit 201 includes one or more (two in this example) sensor arrays, and each of the sensor arrays has a plurality of sensors arranged in the direction B. The direction B is a direction that intersects the direction A in which the radial artery extends in a state in which the blood pressure measurement device 100 is attached to the measurement subject. For example, direction A and direction B may be orthogonal. For example, 46 sensors (referred to as having 46 channels) are arranged in one row. Here, the sensor is given a channel number. Further, the arrangement of the sensors is not limited to the example shown in FIG.
各センサは、圧力を測定して圧力データを生成する。センサとしては、圧力を電気信号に変換する圧電素子を用いることができる。図8に示すような圧力波形が圧力データとして得られる。圧脈波の測定結果は、センサの中から適応的に選択された1つのセンサ(アクティブチャンネル)から出力された圧力データに基づいて生成される。一心拍分の圧脈波の波形における最大値はSBPに対応し、一心拍分の圧脈波の波形における最小値はDBPに対応する。血圧データは、圧脈波の測定結果と共に、センサそれぞれから出力される圧力データを含むことができる。なお、脈波の測定結果は、血圧計101において生成されずに、血圧測定装置100内の情報処理部を含む制御部203によって圧力データに基づいて生成されてもよい。
Each sensor measures pressure and generates pressure data. As the sensor, a piezoelectric element that converts pressure into an electrical signal can be used. A pressure waveform as shown in FIG. 8 is obtained as pressure data. The measurement result of the pressure pulse wave is generated based on pressure data output from one sensor (active channel) adaptively selected from the sensors. The maximum value in the waveform of the pressure pulse wave for one heartbeat corresponds to SBP, and the minimum value in the waveform of the pressure pulse wave for one heartbeat corresponds to DBP. The blood pressure data can include pressure data output from each sensor together with the measurement result of the pressure pulse wave. Note that the measurement result of the pulse wave may not be generated in the sphygmomanometer 101 but may be generated based on the pressure data by the control unit 203 including the information processing unit in the blood pressure measurement device 100.
次に血圧計101が測定した圧脈波から算出した時系列データについて図8を参照して説明する。図8は、一心拍ごとの圧脈波を測定した際に圧脈波から算出した血圧の時系列データを示している。また、図8にはそのうちの1つの圧脈波に基づく血圧の波形を示している。圧脈波に基づく血圧は、図8に示すような波形として一心拍ごとに検出され、それぞれの圧脈波に基づく血圧が連続して検出される。図8の波形800が一心拍の圧脈波に基づく血圧波形であり、801の圧力値がSBPに対応し802の圧力値がDBPに対応する。図8の圧脈波に対応する血圧の時系列に示されるように通常、一心拍ごとに血圧波形のSBP803及びDBP804は変動している。
Next, time series data calculated from the pressure pulse wave measured by the sphygmomanometer 101 will be described with reference to FIG. FIG. 8 shows time-series data of blood pressure calculated from the pressure pulse wave when measuring the pressure pulse wave for each heartbeat. FIG. 8 shows a blood pressure waveform based on one of the pressure pulse waves. The blood pressure based on the pressure pulse wave is detected for each heartbeat as a waveform as shown in FIG. 8, and the blood pressure based on each pressure pulse wave is continuously detected. A waveform 800 in FIG. 8 is a blood pressure waveform based on a pressure pulse wave of one heartbeat, and a pressure value of 801 corresponds to SBP and a pressure value of 802 corresponds to DBP. As shown in the time series of blood pressure corresponding to the pressure pulse wave of FIG. 8, the SBP 803 and DBP 804 of the blood pressure waveform usually vary for each heartbeat.
特徴量抽出部102が抽出する特徴量について図9A、図9B、及び図9Cを参照して説明する。図9A、図9B、及び図9Cは、特徴量抽出部102が抽出する特徴量を、一例としたトノグラムのAC成分及びDC成分のグラフの一例を挙げて示したものである。
計測安定性判定部103が使用する特徴量である、1拍前と現在とのトノグラム(DC)変化量総和は、チャンネルごとにトノグラムのDC成分の1拍前と現在との変化量を算出し、そのチャンネルごとの変化量を全てのチャンネルで総和したものである。センサ接触状態判定部104が使用する特徴量は3種類あり、トノグラム(AC)極大値Chと、トノグラム(DC)振幅差と、トノグラム(AC)振幅差である。トノグラム(AC)極大値Chは、図9Aに示すように、トノグラムのAC成分の出力値が極大のチャンネルである。トノグラム(DC)振幅差は、図9Bに示すように、トノグラムのAC成分の極大となるチャンネルを中心とした前後k(例えば、k=10)チャンネル分のトノグラム内のDC成分での振幅差である。トノグラム(AC)振幅差は、図9Aで示すように、トノグラムのAC成分の極大となるチャンネルを中心とした前後kチャンネル分のトノグラムのAC成分での振幅差である。 The feature amount extracted by the featureamount extraction unit 102 will be described with reference to FIGS. 9A, 9B, and 9C. FIG. 9A, FIG. 9B, and FIG. 9C show examples of graphs of AC components and DC components of a tonogram taking the feature amount extracted by the feature amount extraction unit 102 as an example.
The total amount of change in tonogram (DC) between the previous beat and the current beat, which is a feature value used by the measurementstability determination unit 103, calculates the amount of change between the previous beat and the current beat of the DC component of the tonogram for each channel. , And the total amount of change for each channel. There are three types of feature quantities used by the sensor contact state determination unit 104: a tonogram (AC) maximum value Ch, a tonogram (DC) amplitude difference, and a tonogram (AC) amplitude difference. As shown in FIG. 9A, the tonogram (AC) maximum value Ch is a channel in which the output value of the AC component of the tonogram is maximum. As shown in FIG. 9B, the tonogram (DC) amplitude difference is an amplitude difference in the DC component in the tonogram for k channels (for example, k = 10) before and after the channel having the maximum AC component of the tonogram. is there. As shown in FIG. 9A, the tonogram (AC) amplitude difference is an amplitude difference in the AC component of the tonogram for k channels before and after the channel having the maximum AC component of the tonogram.
計測安定性判定部103が使用する特徴量である、1拍前と現在とのトノグラム(DC)変化量総和は、チャンネルごとにトノグラムのDC成分の1拍前と現在との変化量を算出し、そのチャンネルごとの変化量を全てのチャンネルで総和したものである。センサ接触状態判定部104が使用する特徴量は3種類あり、トノグラム(AC)極大値Chと、トノグラム(DC)振幅差と、トノグラム(AC)振幅差である。トノグラム(AC)極大値Chは、図9Aに示すように、トノグラムのAC成分の出力値が極大のチャンネルである。トノグラム(DC)振幅差は、図9Bに示すように、トノグラムのAC成分の極大となるチャンネルを中心とした前後k(例えば、k=10)チャンネル分のトノグラム内のDC成分での振幅差である。トノグラム(AC)振幅差は、図9Aで示すように、トノグラムのAC成分の極大となるチャンネルを中心とした前後kチャンネル分のトノグラムのAC成分での振幅差である。 The feature amount extracted by the feature
The total amount of change in tonogram (DC) between the previous beat and the current beat, which is a feature value used by the measurement
類似度判定部105が使用する特徴量は2種類あり、トノグラム(AC)変化量総和と、トノグラム(DC)変化量総和である。トノグラム(AC)変化量総和は、図9Cに示すように、トノグラムのAC成分のある時刻tでの各チャンネルの出力値と、初期の各チャンネルの出力値との変化量を算出し、そのチャンネルごとの変化量を全てのチャンネルで総和したものである。ここで初期の各チャンネルの出力値は、例えば、計測開始から1分間の各チャンネルの出力値の平均値とする。また、トノグラム(DC)変化量総和は、トノグラム(AC)変化量総和においてAC成分をDC成分に置き換えたものである。
There are two types of feature quantities used by the similarity determination unit 105: a tonogram (AC) change amount sum and a tonogram (DC) change amount sum. As shown in FIG. 9C, the total amount of change in the tonogram (AC) is calculated by calculating the amount of change between the output value of each channel at a certain time t of the AC component of the tonogram and the output value of each initial channel. The total amount of change for each channel. Here, the initial output value of each channel is, for example, the average value of the output values of each channel for one minute from the start of measurement. The tonogram (DC) change amount sum is obtained by replacing the AC component with the DC component in the tonogram (AC) change amount sum.
次に、安定区間と不安定区間について図10を参照して説明する。図10は横軸が時間を示し、縦軸がセンサアレイのチャンネル番号を示し、濃淡でセンサの出力値の大きさを示す。図10の時刻t0からt1までと時刻t5からt6まででは、白色ほど出力値が大きく黒いほど出力値が小さい。図10の時刻t1からt2までと時刻t3からt4まででは、黒いほど出力値が大きいことを示している。すなわち、時刻t5からt6までは、時刻t0からt1までよりもセンサの出力値は概ね小さいことが分かる。また、時刻t0からt1までは、チャンネル1から10まで位の出力値が10以降のチャンネルよりも出力値よりも大きい。また、時刻t0からt1までもチャンネル1から10弱位までがそれ以降のチャンネル46までよりも概ね出力値が大きい。図10の場合では、時刻t0からt1までが安定区間、t1からt2までが不安定区間、t3からt4までが不安定区間、t5からt6までが安定区間に対応する。
Next, the stable section and the unstable section will be described with reference to FIG. In FIG. 10, the horizontal axis indicates time, the vertical axis indicates the channel number of the sensor array, and the output value of the sensor is indicated by shading. From time t 0 to time t 1 and from time t 5 to time t 6 in FIG. 10, the output value is larger for white and the output value is smaller for black. In the time t 1 in FIG. 10 and the time t 3 to t 2 to t 4, it is shown that black as the output value is larger. That is, from time t 5 to t 6, the output value of the sensor than from time t 0 to t 1, it is seen substantially smaller. Also, from time t 0 to t 1 , the output values of the channels 1 to 10 are larger than the output values of the channels after 10. Also, from time t 0 to t 1, the output value of channels 1 to about 10 is slightly larger than that of channel 46 thereafter. In the case of FIG. 10, time t 0 to t 1 corresponds to the stable interval, t 1 to t 2 corresponds to the unstable interval, t 3 to t 4 corresponds to the unstable interval, and t 5 to t 6 corresponds to the stable interval. To do.
次にトノメトリ状態、トノメトリ状態を逸脱した状態の典型的なトノグラムの例について図11を参照して説明する。図11の上部に挙げた4つのトノグラムは、水平方向(横軸)がセンサのチャンネル番号を示し、垂直方向(縦軸)が各センサの出力値(例えば、血圧値)を示す。上部の4つはいずれもトノメトリ状態を逸脱した状態であり、下部の1つはトノメトリ状態を示す。上部の左2つは典型的には脈が弱い場合であり、上部の左から3つ目は脈が深部にあるか、センサが肘よりに配置されている可能性が高い場合であり、上部の最も右の例は腱の影響が大きく例えば手首が細い場合である。トノメトリ状態は、チャンネルの中心部の出力値が大きく(極大値が1箇所で振幅がある値より大)、両端のチャンネルにかけて出力値が左右対称になだらかになっていくのが特徴である。計測安定性判定部103では、このトノメトリ状態の判定を行う。
Next, an example of a typical tonogram in which the tonometry state and the state deviating from the tonometry state will be described with reference to FIG. In the four tonograms listed at the top of FIG. 11, the horizontal direction (horizontal axis) indicates the channel number of the sensor, and the vertical direction (vertical axis) indicates the output value (for example, blood pressure value) of each sensor. The upper four are all out of the tonometry state, and the lower one indicates the tonometry state. The top two left are typically when the pulse is weak, and the third from the top left is when the pulse is deep or the sensor is more likely to be placed above the elbow, The right-most example is when the effect of tendons is large, for example, the wrist is thin. The tonometry state is characterized in that the output value at the center of the channel is large (the maximum value is larger than the value having an amplitude at one location), and the output value gradually becomes symmetrical between the channels at both ends. The measurement stability determination unit 103 determines the tonometry state.
次に血圧測定装置100の動作の一例について図12を参照して説明する。図12は血圧測定装置100の動作の典型的な一例を示すフローチャートである。
血圧計101が生体から血圧値の時系列データを取得し、特徴量抽出部102に渡す(ステップS1201)。血圧計101はこの時系列データを記憶部108に渡し、記憶部108はこの血圧値の時系列データを順次記録してゆく。 Next, an example of the operation of the bloodpressure measurement device 100 will be described with reference to FIG. FIG. 12 is a flowchart showing a typical example of the operation of the blood pressure measurement device 100.
Thesphygmomanometer 101 acquires time-series data of blood pressure values from the living body and passes them to the feature amount extraction unit 102 (step S1201). The sphygmomanometer 101 passes the time series data to the storage unit 108, and the storage unit 108 sequentially records the time series data of the blood pressure values.
血圧計101が生体から血圧値の時系列データを取得し、特徴量抽出部102に渡す(ステップS1201)。血圧計101はこの時系列データを記憶部108に渡し、記憶部108はこの血圧値の時系列データを順次記録してゆく。 Next, an example of the operation of the blood
The
ステップS1202では特徴量抽出部102が、計測安定性判定部103、センサ接触状態判定部104、及び類似度判定部105が必要とする特徴量を抽出し、それぞれの判定部に対応する特徴量を渡す。
In step S1202, the feature amount extraction unit 102 extracts the feature amounts required by the measurement stability determination unit 103, the sensor contact state determination unit 104, and the similarity determination unit 105, and sets the feature amounts corresponding to the respective determination units. hand over.
ステップS1203では計測安定性判定部103が、特徴量抽出部102から受け取った、1心拍前とのトノグラム(DC)変化量総和がしきい値以下であれば安定区間と判定し、それ以外の値であれば不安定区間と判定する(ステップS1203)。計測安定性判定部103が、安定区間であると判定した場合にはステップS1204へ進み、不安定区間であると判定した場合にはステップS1206へ進み、信頼度算出部107が「信頼度が低い」と判定する。
In step S1203, the measurement stability determination unit 103 determines a stable interval if the total tonogram (DC) change amount from the one heartbeat received from the feature amount extraction unit 102 is equal to or less than a threshold value, and other values. If so, it is determined as an unstable section (step S1203). If the measurement stability determination unit 103 determines that it is a stable section, the process proceeds to step S1204. If the measurement stability determination unit 103 determines that it is an unstable section, the process proceeds to step S1206, and the reliability calculation unit 107 indicates that “the reliability is low. Is determined.
ステップS1204ではセンサ接触状態判定部104が、特徴量抽出部102から受け取った、(条件1)トノグラム(AC)極大値Chが所定の範囲に含まれるか、(条件2)トノグラム(AC)振幅差がしきい値よりも大きいか、及び(条件3)トノグラム(DC)振幅差がしきい値よりも大きいかに基づいて、トノメトリ状態であるかを判定する。例えば、(条件1)、(条件2)、及び(条件3)がすべて満たされる場合にトノメトリ状態であると判定しステップS1205へ進み、(条件1)、(条件2)、及び(条件3)のいずれか1つでも満たされない場合にはトノメトリ状態を逸脱した状態であると判定してステップS1206へ進み、信頼度算出部107が「信頼度が低い」と判定する。
In step S1204, the sensor contact state determination unit 104 receives (condition 1) the tonogram (AC) maximum value Ch received from the feature amount extraction unit 102 within a predetermined range, or (condition 2) the tonogram (AC) amplitude difference. Is greater than the threshold and (Condition 3) whether the tonogram (DC) amplitude difference is greater than the threshold is determined to be a tonometric state. For example, when all of (Condition 1), (Condition 2), and (Condition 3) are satisfied, it is determined that the state is a tonometry state, and the process proceeds to Step S1205. (Condition 1), (Condition 2), and (Condition 3) If any one of them is not satisfied, it is determined that the state has deviated from the tonometry state, the process proceeds to step S1206, and the reliability calculation unit 107 determines that the reliability is low.
ステップS1205では類似度判定部105が、特徴量抽出部102から受け取った、トノグラム(AC)変化量総和及びトノグラム(DC)変化量総和の2つの特徴量に基づいて、トノグラムの類似度を判定する。例えばトノグラム(AC)変化量総和及びトノグラム(DC)変化量総和が共にそれぞれのしきい値(第1しきい値)よりも小さい場合に類似度が高いと判定し、信頼度算出部107は信頼度が高いと判定する(ステップS1206)。一方、トノグラム(AC)変化量総和及びトノグラム(DC)変化量総和のうちの少なくともどちらかがしきい値以上の場合には類似度が低いと判定し、信頼度算出部107は信頼度が中位と判定する(ステップS1206)。
In step S <b> 1205, the similarity determination unit 105 determines the similarity of the tonogram based on the two feature amounts received from the feature amount extraction unit 102, the tonogram (AC) change amount sum and the tonogram (DC) change amount sum. . For example, when the tonogram (AC) change amount sum and the tonogram (DC) change amount sum are both smaller than the respective threshold values (first threshold values), it is determined that the similarity is high, and the reliability calculation unit 107 determines the reliability. It is determined that the degree is high (step S1206). On the other hand, if at least one of the total tonogram (AC) change amount and the total tonogram (DC) change amount is equal to or greater than the threshold value, it is determined that the similarity is low, and the reliability calculation unit 107 has the medium reliability It is determined that it is a position (step S1206).
なお、この一例では、計測安定性判定部103、センサ接触状態判定部104、及び類似度判定部105が順番に判定処理を行って信頼度算出部107に判定結果を渡しているが、これとは異なり、計測安定性判定部103、センサ接触状態判定部104、及び類似度判定部105が並列に判定処理を行い、これらの判定結果を信頼度算出部107が適切に条件分けして信頼度を判定してもよい。
In this example, the measurement stability determination unit 103, the sensor contact state determination unit 104, and the similarity determination unit 105 sequentially perform determination processing and pass the determination result to the reliability calculation unit 107. In contrast, the measurement stability determination unit 103, the sensor contact state determination unit 104, and the similarity determination unit 105 perform determination processing in parallel, and the reliability calculation unit 107 appropriately divides these determination results into reliability levels. May be determined.
次に、血圧測定装置100のハードウェア構成の一例について図13を参照して説明する。
血圧測定装置100は、CPU1301、ROM1302、RAM1303、入力装置1304、出力装置1305、及び血圧計101を備え、これらがバスシステム1306を介して互いに接続されている。血圧測定装置100の上述した機能は、CPU1301がコンピュータ読み取り可能な記録媒体(ROM1302)に記憶されたプログラムを読み出し実行することにより実現されることができる。RAM1303は、CPU1301によってワークメモリとして使用される。この他に補助記憶装置(図示せず)例えば、ハードディスクドライブ(HDD)またはソリッドステートドライブ(SDD)を備え、記憶部108として使用され、さらにプログラムを記憶してもよい。入力装置1304は、例えば、キーボード、マウス、及びマイクロフォンを含み、ユーザからの操作を受け付ける。入力装置1304には例えば、血圧計101に測定を開始させるための操作ボタン、校正を行うための操作ボタン、通信を開始または停止するための操作ボタンがある。出力装置1305は、例えば、液晶表示装置などの表示装置及びスピーカを含む。血圧計101は、例えば通信装置で他のコンピュータとの間で信号の送受信を行い、例えば血圧測定装置から測定データを受信する。通信装置は、近距離で互いにデータをやり取りできる通信方式を利用することが多く、例えば、近距離無線通信方式を使用し、具体的にはブルートゥース(登録商標)、トランスファイージェット(登録商標)、ジグビー(登録商標)、アイアールディーエイ(登録商標)などの通信方式がある。 Next, an example of a hardware configuration of the bloodpressure measurement device 100 will be described with reference to FIG.
The bloodpressure measurement device 100 includes a CPU 1301, a ROM 1302, a RAM 1303, an input device 1304, an output device 1305, and a sphygmomanometer 101, which are connected to each other via a bus system 1306. The above-described functions of the blood pressure measurement device 100 can be realized by the CPU 1301 reading and executing a program stored in a computer-readable recording medium (ROM 1302). The RAM 1303 is used as a work memory by the CPU 1301. In addition, an auxiliary storage device (not shown), for example, a hard disk drive (HDD) or a solid state drive (SDD) may be provided, used as the storage unit 108, and may further store a program. The input device 1304 includes, for example, a keyboard, a mouse, and a microphone, and accepts an operation from the user. For example, the input device 1304 includes an operation button for causing the sphygmomanometer 101 to start measurement, an operation button for performing calibration, and an operation button for starting or stopping communication. The output device 1305 includes, for example, a display device such as a liquid crystal display device and a speaker. The sphygmomanometer 101 transmits / receives a signal to / from another computer using a communication device, for example, and receives measurement data from the blood pressure measurement device, for example. The communication device often uses a communication method capable of exchanging data with each other at a short distance, for example, using a short-range wireless communication method, specifically, Bluetooth (registered trademark), Transform Jet (registered trademark), There are communication systems such as ZigBee (registered trademark) and IRDA (registered trademark).
血圧測定装置100は、CPU1301、ROM1302、RAM1303、入力装置1304、出力装置1305、及び血圧計101を備え、これらがバスシステム1306を介して互いに接続されている。血圧測定装置100の上述した機能は、CPU1301がコンピュータ読み取り可能な記録媒体(ROM1302)に記憶されたプログラムを読み出し実行することにより実現されることができる。RAM1303は、CPU1301によってワークメモリとして使用される。この他に補助記憶装置(図示せず)例えば、ハードディスクドライブ(HDD)またはソリッドステートドライブ(SDD)を備え、記憶部108として使用され、さらにプログラムを記憶してもよい。入力装置1304は、例えば、キーボード、マウス、及びマイクロフォンを含み、ユーザからの操作を受け付ける。入力装置1304には例えば、血圧計101に測定を開始させるための操作ボタン、校正を行うための操作ボタン、通信を開始または停止するための操作ボタンがある。出力装置1305は、例えば、液晶表示装置などの表示装置及びスピーカを含む。血圧計101は、例えば通信装置で他のコンピュータとの間で信号の送受信を行い、例えば血圧測定装置から測定データを受信する。通信装置は、近距離で互いにデータをやり取りできる通信方式を利用することが多く、例えば、近距離無線通信方式を使用し、具体的にはブルートゥース(登録商標)、トランスファイージェット(登録商標)、ジグビー(登録商標)、アイアールディーエイ(登録商標)などの通信方式がある。 Next, an example of a hardware configuration of the blood
The blood
また、上述した特徴量抽出部102、計測安定性判定部103、センサ接触状態判定部104、類似度判定部105、及び信頼度算出部107が行う動作を実行するためのプログラムが上記のROM1302または補助記憶装置に記憶され、CPU1301がそのプログラムを実行してもよい。これとは異なり血圧測定装置100とは別のサーバ等にプログラムが記憶されて、サーバ等のCPUがプログラムを実行してもよい。この場合は、血圧計101が測定した圧脈波の時系列データ(もしくは血圧値の時系列データ)をサーバに送信してサーバで処理を行い信頼度を求めることができる。この場合にはサーバで処理を行うため、処理速度が上がる可能性がある。さらに、特徴量抽出部102、計測安定性判定部103、センサ接触状態判定部104、類似度判定部105、及び信頼度算出部107の装置部分が血圧測定装置100から除去されるので、血圧測定装置100の大きさが小さくなりセンサを正確に測定できる位置に容易に配置することができる。この結果、ユーザへの負担が下がり、簡易に正確な血圧測定を行うことができるようになる。
Further, a program for executing the operations performed by the feature amount extraction unit 102, the measurement stability determination unit 103, the sensor contact state determination unit 104, the similarity determination unit 105, and the reliability calculation unit 107 described above is the ROM 1302 or the above. The program may be stored in the auxiliary storage device and the CPU 1301 may execute the program. Alternatively, the program may be stored in a server or the like different from the blood pressure measurement device 100, and a CPU such as the server may execute the program. In this case, the pressure pulse wave time series data (or blood pressure value time series data) measured by the sphygmomanometer 101 can be transmitted to the server and processed by the server to obtain the reliability. In this case, since processing is performed by the server, the processing speed may increase. Furthermore, since the device portions of the feature amount extraction unit 102, the measurement stability determination unit 103, the sensor contact state determination unit 104, the similarity determination unit 105, and the reliability calculation unit 107 are removed from the blood pressure measurement device 100, blood pressure measurement is performed. The size of the apparatus 100 is reduced, and the sensor can be easily placed at a position where the sensor can be measured accurately. As a result, the burden on the user is reduced, and accurate blood pressure measurement can be performed easily.
以上の実施形態の血圧測定装置によれば、測定された血圧値への信頼度を測定する機会ごとに(例えば一心拍ごとに)評価することができ、従って測定対象者に合わせて測定された血圧値への信頼度を評価することができる。また、圧脈波が安定していると判定され、かつ前記トノグラムがトノメトリ状態であると判定された場合に、さらに類似度が第1しきい値よりも高いと判定された場合には、算出部はこの区間での信頼度を最も高いと算出することにより、最低血圧値の安定性が高く、トノグラムがトノメトリ状態であり、かつ、トノグラムの計測開始時との類似度が高いと判定された場合には、最も良い条件での血圧データを得ていることが分かる。この結果、センサが橈骨動脈からずれが小さく確実に圧脈波を受け取ることが信頼度に組み込まれ、より理想的な一心拍ごとの連続血圧データを得ることが可能になる。
According to the blood pressure measurement device of the above embodiment, the reliability to the measured blood pressure value can be evaluated for each opportunity (for example, for each heartbeat), and thus measured according to the measurement subject. The reliability of the blood pressure value can be evaluated. Further, when it is determined that the pressure pulse wave is stable and it is determined that the tonogram is in a tonometric state, if the similarity is determined to be higher than the first threshold value, the calculation is performed. The section calculated that the reliability in this interval was the highest, so that it was determined that the stability of the diastolic blood pressure was high, the tonogram was in a tonometric state, and the similarity to the start of tonogram measurement was high In this case, it is understood that blood pressure data is obtained under the best conditions. As a result, it is incorporated with reliability that the sensor receives a pressure pulse wave with a small deviation from the radial artery and it is possible to obtain more ideal continuous blood pressure data for each heartbeat.
橈骨動脈と橈骨・腱の位置関係には個人差があるため、橈骨動脈上の皮下組織が厚い人や橈骨動脈と橈骨・腱が近い人などは、信頼度を低い状態で測定することになるが、この他に圧脈波が安定しているか、計測開始時と所望の計測時刻との間でのトノグラムの類似度も、血圧値の時系列データの信頼度の判定条件に組み込むことで、より実際の測定環境に適した血圧値の信頼度を評価することが可能になる。また、このように圧脈波の安定性、及び類似度を判定条件に組み込むことで、同一の生体でも測定条件によって、信頼度が変化しうる。
Because there are individual differences in the positional relationship between the radial artery and the radius / tendon, people with thick subcutaneous tissue on the radial artery or people with a radial artery close to the radius / tendon will be measured with low reliability. However, whether the pressure pulse wave is stable or the similarity of the tonogram between the measurement start time and the desired measurement time is also incorporated into the determination condition of the reliability of the time series data of the blood pressure value, It becomes possible to evaluate the reliability of the blood pressure value more suitable for the actual measurement environment. Further, by incorporating the stability and similarity of the pressure pulse wave into the determination condition in this way, the reliability can be changed depending on the measurement condition even in the same living body.
さらに、圧力値から血圧値への変換は、較正時のトノグラム情報から算出されるため、各拍のトノグラム情報による信頼度評価だけでは、血圧値の信頼性を評価し切れていないが、上記のように類似度を判定条件に組み込むことで、通常測定開始時事に行う較正時でのトノグラムとの類似度を評価することで、より血圧値が正しいかの信頼度を得ることができるようになる。例えば、測定の途中で類似度以外の判定条件で信頼度が高くなる場合でも、較正時とのトノグラムが類似していないと正しい血圧値が算出されない信頼度を低くする算出が可能になり、本実施形態の血圧測定装置の類似度を考慮した信頼度はより正確であることが分かる。
Furthermore, since the conversion from the pressure value to the blood pressure value is calculated from the tonogram information at the time of calibration, the reliability of the blood pressure value cannot be fully evaluated only by the reliability evaluation based on the tonogram information of each beat. As described above, by incorporating the similarity into the determination condition, it is possible to obtain a reliability of whether the blood pressure value is correct by evaluating the similarity with the tonogram at the time of calibration that is normally performed at the start of measurement. . For example, even if the reliability increases in the determination conditions other than the similarity during the measurement, if the tonogram at the time of calibration is not similar, a correct blood pressure value cannot be calculated, and the calculation can be made to reduce the reliability. It can be seen that the reliability considering the similarity of the blood pressure measurement device of the embodiment is more accurate.
本発明の装置は、コンピュータとプログラムによっても実現でき、プログラムを記録媒体に記録することも、ネットワークを通して提供することも可能である。
また、以上の各装置及びそれらの装置部分は、それぞれハードウェア構成、またはハードウェア資源とソフトウェアとの組み合せ構成のいずれでも実施可能となっている。組み合せ構成のソフトウェアとしては、予めネットワークまたはコンピュータ読み取り可能な記録媒体からコンピュータにインストールされ、当該コンピュータのプロセッサに実行されることにより、各装置の機能を当該コンピュータに実現させるためのプログラムが用いられる。 The apparatus of the present invention can be realized by a computer and a program, and can be recorded on a recording medium or provided through a network.
Each of the above devices and their device portions can be implemented with either a hardware configuration or a combined configuration of hardware resources and software. As the software of the combined configuration, a program for causing the computer to realize the functions of each device by being installed in a computer from a network or a computer-readable recording medium in advance and executed by a processor of the computer is used.
なお、この発明は、上記実施形態そのままに限定されるものではなく、実施段階ではその要旨を逸脱しない範囲で構成要素を変形して具体化できる。また、上記実施形態に開示されている複数の構成要素の適宜な組み合せにより種々の発明を形成できる。例えば、実施形態に示される全構成要素から幾つかの構成要素を削除してもよい。さらに、異なる実施形態に亘る構成要素を適宜組み合せてもよい。
Note that the present invention is not limited to the above-described embodiment as it is, and can be embodied by modifying the constituent elements without departing from the scope of the invention in the implementation stage. Further, various inventions can be formed by appropriately combining a plurality of constituent elements disclosed in the embodiment. For example, some components may be deleted from all the components shown in the embodiment. Furthermore, you may combine suitably the component covering different embodiment.
また、上記の実施形態の一部又は全部は、以下の付記のようにも記載されうるが、以下には限られない。
Further, a part or all of the above embodiment can be described as in the following supplementary notes, but is not limited thereto.
(付記1)
ハードウェアプロセッサとメモリとを備える血圧測定装置であって、
前記ハードウェアプロセッサは、
1つまたは複数のセンサによって圧脈波を検出することで一心拍ごとの血圧値を含む血圧データを得、
前記血圧データの1以上の特徴量を抽出し、
前記特徴量に基づいて、前記血圧データがどの程度正確に血圧値を示しているかを示す信頼度を算出するように構成され、
前記メモリは、
前記信頼度と前記血圧データとを記憶する記憶部と、を備える血圧測定装置。 (Appendix 1)
A blood pressure measurement device comprising a hardware processor and a memory,
The hardware processor is
Obtaining blood pressure data including blood pressure values for each heartbeat by detecting the pressure pulse wave by one or more sensors,
Extracting one or more feature quantities of the blood pressure data;
Based on the feature amount, the blood pressure data is configured to calculate a reliability indicating how accurately the blood pressure value indicates a blood pressure value,
The memory is
A blood pressure measurement apparatus comprising: a storage unit that stores the reliability and the blood pressure data.
(付記2)
少なくとも1つのハードウェアプロセッサを用いて、1つまたは複数のセンサによって圧脈波を検出することで一心拍ごとの血圧値を含む血圧データを得、
少なくとも1つのハードウェアプロセッサを用いて、前記血圧データの1以上の特徴量を抽出し、
少なくとも1つのハードウェアプロセッサを用いて、前記特徴量に基づいて、前記血圧データがどの程度正確に血圧値を示しているかを示す信頼度を算出することを備える血圧測定方法。 (Appendix 2)
Using at least one hardware processor to detect a pressure pulse wave by one or more sensors to obtain blood pressure data including blood pressure values for each heartbeat;
Using at least one hardware processor to extract one or more features of the blood pressure data;
A blood pressure measurement method comprising calculating a reliability indicating how accurately the blood pressure data indicates a blood pressure value based on the feature amount using at least one hardware processor.
Claims (5)
- 1つまたは複数のセンサによって圧脈波を検出することで一心拍ごとの血圧値を含む血圧データを得る血圧計と、
前記血圧データの1以上の特徴量を抽出する抽出部と、
前記特徴量に基づいて、前記血圧データがどの程度正確に血圧値を示しているかを示す信頼度を算出する算出部と、
を備える血圧測定装置。 A sphygmomanometer that obtains blood pressure data including blood pressure values for each heartbeat by detecting a pressure pulse wave by one or more sensors;
An extraction unit for extracting one or more feature amounts of the blood pressure data;
A calculation unit that calculates a degree of reliability indicating how accurately the blood pressure data indicates a blood pressure value based on the feature amount;
A blood pressure measurement device comprising: - 前記抽出部は、前記圧脈波が安定しているかを示す安定性特徴量、前記1つまたは複数のセンサと測定部位との接触状態が正常であるかを示すセンサ接触状態特徴量、及び計測開始時と所望の計測時刻との間での前記圧脈波の類似度を示す類似度特徴量のうちの少なくとも1つの特徴量を抽出し、
前記算出部は、前記少なくとも1つの特徴量に基づいて前記信頼度を算出する請求項1に記載の血圧測定装置。 The extraction unit includes a stability feature amount indicating whether the pressure pulse wave is stable, a sensor contact state feature amount indicating whether a contact state between the one or more sensors and a measurement site is normal, and measurement. Extracting at least one feature amount of similarity feature amounts indicating the similarity of the pressure pulse wave between the start time and a desired measurement time;
The blood pressure measurement device according to claim 1, wherein the calculation unit calculates the reliability based on the at least one feature amount. - 前記圧脈波が安定していると判定され、かつ前記接触状態が正常であると判定された場合に、さらに前記類似度がしきい値よりも高いと判定された場合には、前記算出部はこの区間での前記信頼度を高いと設定する請求項2に記載の血圧測定装置。 When it is determined that the pressure pulse wave is stable and it is determined that the contact state is normal, and further when the similarity is determined to be higher than a threshold value, the calculation unit The blood pressure measurement device according to claim 2, wherein the reliability is set to be high in this section.
- 1つまたは複数のセンサによって圧脈波を検出することで一心拍ごとの血圧値を含む血圧データを得、
前記血圧データの1以上の特徴量を抽出し、
前記特徴量に基づいて、前記血圧データがどの程度正確に血圧値を示しているかを示す信頼度を算出すること、
を備える血圧測定方法。 Obtaining blood pressure data including blood pressure values for each heartbeat by detecting the pressure pulse wave by one or more sensors,
Extracting one or more feature quantities of the blood pressure data;
Calculating a reliability level indicating how accurately the blood pressure data indicates a blood pressure value based on the feature amount;
A blood pressure measurement method comprising: - コンピュータを、請求項1乃至3のいずれか1項に記載の血圧測定装置として機能させるためのプログラム。 A program for causing a computer to function as the blood pressure measurement device according to any one of claims 1 to 3.
Priority Applications (3)
| Application Number | Priority Date | Filing Date | Title |
|---|---|---|---|
| DE112018001324.3T DE112018001324T5 (en) | 2017-03-15 | 2018-03-12 | BLOOD PRESSURE MEASURING DEVICE, METHOD AND PROGRAM |
| CN201880017118.1A CN110418600A (en) | 2017-03-15 | 2018-03-12 | Blood pressure measuring device, method and program |
| US16/561,892 US20190387986A1 (en) | 2017-03-15 | 2019-09-05 | Blood pressure measurement apparatus, method, and program |
Applications Claiming Priority (2)
| Application Number | Priority Date | Filing Date | Title |
|---|---|---|---|
| JP2017050489A JP6766710B2 (en) | 2017-03-15 | 2017-03-15 | Blood pressure measuring device, method and program |
| JP2017-050489 | 2017-03-15 |
Related Child Applications (1)
| Application Number | Title | Priority Date | Filing Date |
|---|---|---|---|
| US16/561,892 Continuation US20190387986A1 (en) | 2017-03-15 | 2019-09-05 | Blood pressure measurement apparatus, method, and program |
Publications (1)
| Publication Number | Publication Date |
|---|---|
| WO2018168805A1 true WO2018168805A1 (en) | 2018-09-20 |
Family
ID=63523082
Family Applications (1)
| Application Number | Title | Priority Date | Filing Date |
|---|---|---|---|
| PCT/JP2018/009577 WO2018168805A1 (en) | 2017-03-15 | 2018-03-12 | Blood pressure measurement device, method, and program |
Country Status (5)
| Country | Link |
|---|---|
| US (1) | US20190387986A1 (en) |
| JP (1) | JP6766710B2 (en) |
| CN (1) | CN110418600A (en) |
| DE (1) | DE112018001324T5 (en) |
| WO (1) | WO2018168805A1 (en) |
Cited By (2)
| Publication number | Priority date | Publication date | Assignee | Title |
|---|---|---|---|---|
| WO2020170857A1 (en) * | 2019-02-18 | 2020-08-27 | オムロンヘルスケア株式会社 | Blood pressure value analysis support apparatus, blood pressure value analysis support system, blood pressure value analysis support method, and program |
| CN113423328A (en) * | 2019-02-22 | 2021-09-21 | 吴宇 | Physical sign parameter detection system and reliability evaluation method of physical sign parameters |
Families Citing this family (3)
| Publication number | Priority date | Publication date | Assignee | Title |
|---|---|---|---|---|
| CN115988986A (en) * | 2020-05-15 | 2023-04-18 | 阿克提雅有限公司 | Method for monitoring blood pressure of a user using a cuff-less monitoring device |
| CN114403826B (en) * | 2020-10-28 | 2024-02-23 | 深圳市科瑞康实业有限公司 | Blood pressure measurement method and device |
| JP2022080166A (en) * | 2020-11-17 | 2022-05-27 | 旭化成メディカル株式会社 | Heart beat information acquisition device and heart beat information acquisition program |
Citations (4)
| Publication number | Priority date | Publication date | Assignee | Title |
|---|---|---|---|---|
| JPH021220A (en) * | 1988-02-25 | 1990-01-05 | Koorin Denshi Kk | Transducer position control device for blood pressure monitor apparatus |
| JPH0690912A (en) * | 1992-09-11 | 1994-04-05 | Nippon Colin Co Ltd | Pulse wave detector |
| JP2004222847A (en) * | 2003-01-21 | 2004-08-12 | Omron Healthcare Co Ltd | Pulse wave detecting apparatus and method |
| JP2014012072A (en) * | 2012-07-04 | 2014-01-23 | Sony Corp | Measurement apparatus, measurement method, program, storage medium, and measurement system |
Family Cites Families (5)
| Publication number | Priority date | Publication date | Assignee | Title |
|---|---|---|---|---|
| JP4487639B2 (en) * | 2004-05-31 | 2010-06-23 | オムロンヘルスケア株式会社 | Pulse wave detection device and pulse wave detection method |
| JP2014230713A (en) * | 2013-05-30 | 2014-12-11 | 株式会社デンソー | Blood pressure manometer |
| JP6032165B2 (en) * | 2013-09-18 | 2016-11-24 | 株式会社デンソー | Sphygmomanometer |
| JP6256058B2 (en) * | 2014-01-31 | 2018-01-10 | オムロンヘルスケア株式会社 | Pulse wave detector |
| US10534900B2 (en) * | 2014-02-21 | 2020-01-14 | Samsung Electronics Co., Ltd. | Electronic device |
-
2017
- 2017-03-15 JP JP2017050489A patent/JP6766710B2/en active Active
-
2018
- 2018-03-12 DE DE112018001324.3T patent/DE112018001324T5/en active Pending
- 2018-03-12 CN CN201880017118.1A patent/CN110418600A/en active Pending
- 2018-03-12 WO PCT/JP2018/009577 patent/WO2018168805A1/en active Application Filing
-
2019
- 2019-09-05 US US16/561,892 patent/US20190387986A1/en not_active Abandoned
Patent Citations (4)
| Publication number | Priority date | Publication date | Assignee | Title |
|---|---|---|---|---|
| JPH021220A (en) * | 1988-02-25 | 1990-01-05 | Koorin Denshi Kk | Transducer position control device for blood pressure monitor apparatus |
| JPH0690912A (en) * | 1992-09-11 | 1994-04-05 | Nippon Colin Co Ltd | Pulse wave detector |
| JP2004222847A (en) * | 2003-01-21 | 2004-08-12 | Omron Healthcare Co Ltd | Pulse wave detecting apparatus and method |
| JP2014012072A (en) * | 2012-07-04 | 2014-01-23 | Sony Corp | Measurement apparatus, measurement method, program, storage medium, and measurement system |
Cited By (5)
| Publication number | Priority date | Publication date | Assignee | Title |
|---|---|---|---|---|
| WO2020170857A1 (en) * | 2019-02-18 | 2020-08-27 | オムロンヘルスケア株式会社 | Blood pressure value analysis support apparatus, blood pressure value analysis support system, blood pressure value analysis support method, and program |
| JP2020130532A (en) * | 2019-02-18 | 2020-08-31 | オムロンヘルスケア株式会社 | Blood pressure value analysis support apparatus, blood pressure value analysis support system, blood pressure value analysis support method, and program |
| CN113453615A (en) * | 2019-02-18 | 2021-09-28 | 欧姆龙健康医疗事业株式会社 | Blood pressure value analysis support device, blood pressure value analysis support system, blood pressure value analysis support method, and program |
| JP7225893B2 (en) | 2019-02-18 | 2023-02-21 | オムロンヘルスケア株式会社 | Blood pressure value analysis support device, blood pressure value analysis support system, blood pressure value analysis support method, and program |
| CN113423328A (en) * | 2019-02-22 | 2021-09-21 | 吴宇 | Physical sign parameter detection system and reliability evaluation method of physical sign parameters |
Also Published As
| Publication number | Publication date |
|---|---|
| DE112018001324T5 (en) | 2019-12-19 |
| JP2018153250A (en) | 2018-10-04 |
| JP6766710B2 (en) | 2020-10-14 |
| CN110418600A (en) | 2019-11-05 |
| US20190387986A1 (en) | 2019-12-26 |
Similar Documents
| Publication | Publication Date | Title |
|---|---|---|
| WO2018168805A1 (en) | Blood pressure measurement device, method, and program | |
| JP5098721B2 (en) | Blood pressure measurement device, blood pressure derivation program, and blood pressure derivation method | |
| EP3427656B1 (en) | Biological information analysis device, system, and program | |
| US9044145B2 (en) | Pulse wave analysis device and recording medium | |
| JP2014171589A (en) | Atrial fibrillation analyzation equipment and program | |
| JP6766708B2 (en) | Information processing equipment, methods and programs | |
| JP2014171660A (en) | Atrial fibrillation analyzation equipment, atrial fibrillation analysis system, atrial fibrillation analysis method and program | |
| CN112426141A (en) | Blood pressure detection method and device and electronic equipment | |
| JP6060563B2 (en) | Atrial fibrillation determination device, atrial fibrillation determination method and program | |
| US20230070912A1 (en) | Method and apparatus for continuous vitals monitoring | |
| US20140316291A1 (en) | Measurement device, evaluating method, and evaluation program | |
| KR20230129505A (en) | Method and system for measuring blood pressure | |
| US20180125377A1 (en) | Blood pressure measurement device, blood pressure measurement method, and recording medium | |
| CN115135236A (en) | Improved personal health data collection | |
| WO2016006250A1 (en) | Biological information measurement device | |
| JP6547838B2 (en) | Diagnosis support apparatus, diagnosis support method, diagnosis support program | |
| JP2017056107A (en) | Blood pressure analyzer, blood pressure measurement device, blood pressure analysis method and blood pressure analysis program | |
| Freithaler et al. | Smartphone-Based Blood Pressure Monitoring via the Oscillometric Finger Pressing Method: Analysis of Oscillation Width Variations Can Improve Diastolic Pressure Computation | |
| US20200359916A1 (en) | Blood pressure meter and method for measuring blood pressure using the same | |
| JP2006340896A (en) | Blood pressure correction method and hemodynamometer | |
| JP6765999B2 (en) | Blood pressure related information display device and method | |
| JP6304651B2 (en) | Cardiovascular function arithmetic unit | |
| JP5006509B2 (en) | Pulse wave velocity measurement method for measuring pulse wave velocity in a pulse wave velocity measuring device | |
| JP7087267B2 (en) | Blood pressure data processor, blood pressure data processing method, and program | |
| WO2024015373A1 (en) | Device, system, and method for blood pressure measurement |
Legal Events
| Date | Code | Title | Description |
|---|---|---|---|
| DPE2 | Request for preliminary examination filed before expiration of 19th month from priority date (pct application filed from 20040101) | ||
| 121 | Ep: the epo has been informed by wipo that ep was designated in this application |
Ref document number: 18767203 Country of ref document: EP Kind code of ref document: A1 |
|
| 122 | Ep: pct application non-entry in european phase |
Ref document number: 18767203 Country of ref document: EP Kind code of ref document: A1 |