WO2018070050A1 - 道路データ分析プログラム、道路データ分析方法及び道路データ分析装置 - Google Patents
道路データ分析プログラム、道路データ分析方法及び道路データ分析装置 Download PDFInfo
- Publication number
- WO2018070050A1 WO2018070050A1 PCT/JP2016/080622 JP2016080622W WO2018070050A1 WO 2018070050 A1 WO2018070050 A1 WO 2018070050A1 JP 2016080622 W JP2016080622 W JP 2016080622W WO 2018070050 A1 WO2018070050 A1 WO 2018070050A1
- Authority
- WO
- WIPO (PCT)
- Prior art keywords
- section
- vehicle
- speed
- data analysis
- road data
- Prior art date
- Legal status (The legal status is an assumption and is not a legal conclusion. Google has not performed a legal analysis and makes no representation as to the accuracy of the status listed.)
- Ceased
Links
Images











Classifications
-
- G—PHYSICS
- G08—SIGNALLING
- G08G—TRAFFIC CONTROL SYSTEMS
- G08G1/00—Traffic control systems for road vehicles
- G08G1/01—Detecting movement of traffic to be counted or controlled
Definitions
- the present invention relates to a road data analysis program, a road data analysis method, and a road data analysis apparatus.
- a technique for identifying a dangerous point such as a sudden braking frequent point based on vehicle driving information and notifying the driver of the dangerous point.
- a technology that identifies a point with a large negative change in traveling speed per unit time of a vehicle as a sudden braking point, and selects a point where the occurrence frequency of sudden braking operation is high when there are multiple sudden braking points in the traveling section It has been known.
- the dangerous point is specified based on the fact that there are many vehicles that perform specific driving operations such as sudden braking, but the dangerous point is not limited to this. For example, some drivers may travel without decelerating at a point where many drivers decelerate. At such points, drivers of many decelerating vehicles rarely brake suddenly, but it is caused by too many speeds by a small number of vehicles that do not decelerate, speed differences between vehicles that decelerate and vehicles that do not decelerate, etc. Accidents are likely to occur. However, in the above technique, it is impossible to specify a point where an accident is likely to occur due to such a difference in driving operation between vehicles.
- An object of the present invention is to provide a road data analysis program, a road data analysis method, and a road data analysis device that can identify a dangerous section.
- the road data analysis program distributes the change in the speed of each vehicle per predetermined unit time from information on the speed per predetermined time acquired from a plurality of vehicles traveling on a specific section of the road. And causing the computer to execute processing for calculating the skewness. Furthermore, the road data analysis program clusters a plurality of vehicles using the obtained variance and skewness, and the specific section is determined based on whether or not the cluster obtained as a result of the clustering satisfies a specific condition. Causes the computer to execute a process for determining whether or not it falls under a critical section.
- FIG. 1 is a diagram illustrating an example of an average speed of a group of vehicles that have traveled along a road that is a target section.
- FIG. 2 is a diagram illustrating an example of a clustering result of a group of vehicles that have traveled in the target section.
- FIG. 3 is an image diagram showing an example of a cluster of vehicles that traveled in the target section.
- FIG. 4 is an image diagram showing an example of a cluster of vehicles traveling on a flat straight road.
- FIG. 5 is a diagram illustrating an example of functional blocks of the road data analysis apparatus according to the first embodiment.
- FIG. 6 is a diagram illustrating an example of the travel information DB.
- FIG. 7 is a diagram illustrating an example of the travel record DB.
- FIG. 8 is a diagram illustrating an example of the cluster DB.
- FIG. 9 is a diagram illustrating an example of the determination result DB.
- FIG. 10 is a diagram illustrating an example of the output result of the section requiring attention.
- FIG. 11 is a flowchart illustrating an example of road data analysis processing.
- FIG. 12 is a diagram illustrating an example of a comparison between the average speed of vehicles belonging to each group and the average speed of all vehicle groups.
- FIG. 13 is a diagram illustrating an example of a comparison between the average speed of vehicles belonging to the group requiring attention and the average speed of all vehicle groups.
- FIG. 14 is a diagram illustrating an example of functional blocks of the road data analysis device according to the second embodiment.
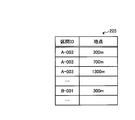
- FIG. 15 is a diagram illustrating an example of the warning point DB.
- FIG. 15 is a diagram illustrating an example of the warning point DB.
- FIG. 16 is a diagram illustrating an example of the output result of the section requiring attention and the warning point.
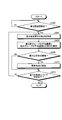
- FIG. 17 is a flowchart illustrating an example of the warning point specifying process.
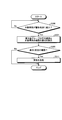
- FIG. 18 is a flowchart illustrating an example of warning processing.
- FIG. 19 is an image diagram showing an example of a cluster of vehicles that traveled for the first time in the target section.
- FIG. 20 is an image diagram illustrating an example of a cluster of vehicle groups traveling in the target section a plurality of times.
- FIG. 21 is a diagram illustrating a hardware configuration example.
- FIG. 1 is a diagram illustrating an example of an average speed of a group of vehicles that have traveled along a road that is a target section.
- a graph 9000 illustrated in FIG. 1 illustrates an example of an average change in speed acquired from a group of vehicles that have traveled in a section from a start point 9100 to an end point 9200.
- the vertical axis indicates the speed
- the horizontal axis indicates the distance from the starting point.
- a section where a change in the speed of the vehicle, in which a change in the speed of the vehicle starts, of a road with a continuous curve or gradient will be described as a target section.
- data relating to travel information acquired from each vehicle may be referred to as a trip.
- one trip corresponds to travel information acquired from one vehicle.
- a point 9002 in the vicinity of 500m to 700m from the starting point 9100 is a straight road with a downward slope. As shown in graph 9000, many vehicles traveling at point 9002 begin to accelerate.
- a point 9003 in the vicinity of 800 m from the starting point 9100 is a point immediately before the downward slope curve. As shown in the graph 9000, many of the vehicles traveling at the point 9003 start to decelerate. Similarly, a point 9004 in the vicinity of 1200 m from the start point 9100 is immediately before the curve, and many vehicles traveling at the point 9004 gradually decelerate.
- FIG. 2 is a diagram illustrating an example of a clustering result of a group of vehicles that have traveled in the target section.
- the vertical axis indicates the magnitude of the variance of the speed change
- the horizontal axis indicates the skewness of the speed change.
- Each marker in FIG. 2 indicates one trip.
- the speed change is calculated, for example, by acquiring the speed per second from each vehicle and comparing the speed one second ago with the current speed.
- the clustering result shown in FIG. 2 is a graph that visually exemplifies the result of an intermediate process in the clustering process, but such a graph may be output together with an output result to be described later.
- the clustering is performed by a method such as a known k-means method.
- the variance of the vehicle speed change indicates the magnitude and frequency of the vehicle speed change.
- the greater the variance of the trip the greater the speed variation of the vehicle and the more frequent the speed change.
- the degree of distortion of the vehicle speed change indicates which of the number of times of acceleration and the number of times of deceleration is greater.
- a trip with a negative skewness indicates a vehicle with a large number of times of acceleration
- a trip with a positive skewness indicates a vehicle with a large number of times of deceleration.
- 667 trips in the target section are classified into five groups shown in the table 9900 as a result of the clustering process.
- a clustered group may be referred to as a “cluster”.
- the first cluster indicated by the marker “ ⁇ ” is composed of trips with relatively small variance and positive skewness. That is, a vehicle with a relatively small change in speed and a large number of times of deceleration belongs to the first cluster.
- the second cluster indicated by the marker “ ⁇ ” is composed of trips having a slightly large variance and a negative skewness. In other words, the second cluster belongs to a vehicle having a slightly large change in speed and a large number of times of acceleration.
- the third cluster indicated by the marker “ ⁇ ” is composed of trips with relatively small variance and a skewness close to zero.
- the third cluster includes a vehicle that travels stably, in which the change in speed is relatively small and the number of times of acceleration and deceleration is balanced.
- the fourth cluster indicated by the marker “x” is composed of trips with relatively small variance and negative skewness. In other words, vehicles with a relatively small change in speed and a large number of times of acceleration belong to the fourth cluster.
- the fifth cluster indicated by the marker “ ⁇ ” is composed of trips with large dispersion. That is, a vehicle having a large speed change belongs to the fifth cluster.
- An image of the above five clusters is shown in FIG.
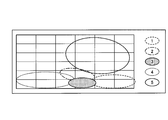
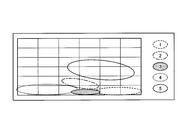
- FIG. 3 is an image diagram showing an example of a cluster of vehicles that traveled in the target section. As shown in FIG. 3, the first cluster to the fourth cluster are biased toward trips having a relatively small variance, whereas the fifth cluster is composed of trips having a large variance. Is different.
- the fifth cluster is an example of a cluster requiring attention, and in the following description, the fifth cluster may be referred to as a “group requiring attention”.
- FIG. 4 is an image diagram showing an example of a cluster of vehicles traveling on a flat straight road. As shown in FIG. 4, on a flat straight road, even in the fifth cluster composed of trips having a large variance, the variance of each trip belonging to the fifth cluster in the target section shown in FIG. 3 is small. Further, as shown in FIG. 4, the skewness of each trip is also concentrated in a range close to 0 as compared with the example shown in FIG.
- the road data analyzing apparatus 100 to be described later determines that the section corresponds to a section requiring attention when the average of variance in a cluster having the largest average of variance is equal to or greater than a predetermined threshold.
- a predetermined threshold is “2.0”
- the average of the variance of the “fifth cluster” having the largest variance in the target section is “2.245” as shown in FIG. And is a predetermined threshold value “2.0” or more.
- the road data analyzing apparatus 100 determines that the target section shown in FIG. 3 corresponds to a caution section, and determines that the flat straight road shown in FIG. 4 does not correspond to a caution section.
- the road data analyzing apparatus 100 clusters the skewness / variance of the second speed difference obtained from a plurality of vehicles that have traveled in a predetermined section, and a group having a large average of the variance appears. In such a case, a dangerous section can be identified.
- FIG. 5 is a diagram illustrating an example of functional blocks of the road data analysis apparatus according to the first embodiment.
- the road data analysis apparatus 100 in this embodiment includes a communication unit 110, a storage unit 120, and a control unit 130.
- the road data analysis apparatus 100 is realized by a device such as a computer, and includes various functional units included in known computers other than the functional units illustrated in FIG. 5, for example, functional units such as various input devices and audio output devices. You may have it.
- the communication unit 110 controls communication with other computers such as a vehicle (not shown) and a terminal of a user of the road data analysis device 100 via a network (not shown) regardless of wired or wireless.
- the storage unit 120 stores, for example, a program executed by the control unit 130, various data, and the like.
- the storage unit 120 includes a travel information DB 121, a travel record DB 122, a cluster DB 123, and a determination result DB 124.
- the storage unit 120 corresponds to a semiconductor memory device such as a RAM (Random Access Memory), a ROM (Read Only Memory), and a flash memory (Flash Memory), and a storage device such as an HDD (Hard Disk Drive).
- the travel information DB 121 stores travel information acquired from the vehicle.
- FIG. 6 is a diagram illustrating an example of the travel information DB. As illustrated in FIG. 6, the travel information DB 121 stores “vehicle ID”, each number starting from “1”, and “the number of travels” in association with each other.
- the travel information DB 121 for example, information acquired from each vehicle by the control unit 130 through the communication unit 110 is input in advance.
- each table of the travel information DB 121 is generated for each target section, for example.
- Vehicle ID indicates an identification number of each vehicle. Each number starting from “1” indicates the speed of the vehicle acquired every predetermined unit time since the vehicle entered the target section. The unit time is 1 second, for example.
- the travel information DB 121 illustrated in FIG. 6 stores that the vehicle with the vehicle ID “0001” first entered the target section at a speed of “49” km and accelerated to “50” km after one second. .
- the “number of times traveled” indicates the number of times the vehicle has traveled in the target section in the past.
- the travel information DB 121 illustrated in FIG. 6 stores that the vehicle with the vehicle ID “0555” travels for the first time in the target section.
- the information stored in the travel information DB 121 is an example, and for example, the travel information DB 121 may store other travel information such as the engine speed and steering tilt per unit time.
- FIG. 7 is a diagram illustrating an example of the travel record DB.
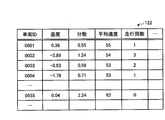
- the travel record DB 122 stores “distortion”, “dispersion”, “average speed”, and “travel count” in association with “vehicle ID”.
- Information stored in the travel record DB 122 is input by, for example, a travel record calculation unit 131 described later.
- each table of the travel record DB 122 is generated for each target section, for example.
- “Vehicle ID” and “Number of travels” indicate the same data as “Vehicle ID” and “Number of travels” in FIG. 6.
- the “distortion”, “dispersion”, and “average speed” indicate the skewness and dispersion of the speed per unit time stored in the travel information DB 121 and the average speed.
- the information stored in the travel record DB 122 is an example, and for example, the travel record DB 122 may store the variance and skewness of changes such as the engine speed.
- FIG. 8 is a diagram illustrating an example of the cluster DB. As illustrated in FIG. 8, the cluster DB 123 stores “vehicle ID” and “group” in association with each other. Information stored in the cluster DB 123 is input by, for example, a clustering processing unit 132 described later. In the present embodiment, each table of the cluster DB 123 is generated for each target section, for example.
- the cluster DB 123 stores that the vehicle with the vehicle ID “0001” is classified into the group “1” and the vehicle with the vehicle ID “0555” is classified into the group “5”.
- the determination result DB 124 stores a result of determining whether each section corresponds to a section requiring attention.
- FIG. 9 is a diagram illustrating an example of the determination result DB. Information stored in the determination result DB 124 is input by, for example, a section determination unit 133 described later.
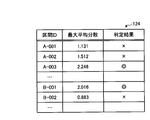
- the determination result DB 124 stores “section ID”, “maximum average variance”, and “determination result” in association with each other.
- “Section ID” indicates identification information of each section to be determined. For example, the section ID “A-003” is assigned to the target section shown in FIG.
- maximum average variance indicates the maximum of the variances of the groups calculated as a result of the clustering process in each section.
- the average of variance is the maximum among the five groups, and the variance of the fifth cluster that is a group requiring attention The average of “2.245” is stored.
- “judgment result” indicates whether the maximum average variance of each section is equal to or greater than a predetermined threshold.
- the determination result DB 124 illustrated in FIG. 9 indicates that the target section “A-003” corresponds to the section requiring attention because the maximum average variance of the target section is equal to or greater than the predetermined threshold “2.0”. Memorize “ ⁇ ”.
- the determination result DB 124 shown in FIG. 9 indicates that the determination result of the target section “A-001” is “x” indicating that the maximum average variance of the target section is less than a predetermined threshold value, so that the target section does not correspond to a critical section.
- control unit 130 is a processing unit that controls the overall processing of the road data analysis apparatus 100, and is, for example, a processor.
- the control unit 130 includes a travel record calculation unit 131, a clustering processing unit 132, a section determination unit 133, and a result output unit 134.
- the travel record calculation unit 131, the clustering processing unit 132, the section determination unit 133, and the result output unit 134 are examples of electronic circuits included in the processor and processes executed by the processor.
- the traveling record calculation unit 131 calculates a traveling record such as the skewness and variance of the speed change of each vehicle in each section. Specifically, the travel record calculation unit 131 reads travel information such as the speed per unit time of each vehicle in the target section stored in the travel information DB 121, and calculates the speed change per unit time of each vehicle in the target section. calculate. Further, the travel record calculation unit 131 calculates the skewness and variance of the speed change in the target section of each vehicle. The travel record calculation unit 131 also calculates an average speed and the like in the target section of each vehicle. Further, the travel record calculation unit 131 stores the travel count stored in the travel information DB 121 in the travel record DB 122.
- the clustering processing unit 132 clusters each trip using the travel record of each vehicle in the target section. Specifically, the clustering processing unit 132 reads the travel record of each trip in the target section from the travel record DB 122, and clusters each trip using a method such as a known k-means method. Further, as shown in the table 9900 of FIG. 2, the clustering processing unit 132 calculates the average skewness and average variance of trips belonging to each clustered group, and the number of trips.
- the clustering processing unit 132 develops each trip recorded in the travel record DB 122 on the coordinates with the variance value as the first axis and the skewness value as the second axis.
- a trip developed on such coordinates is visualized, for example, a graph as shown in FIG. 2 is obtained.
- the clustering processing unit 132 randomly assigns each trip to an arbitrary number of groups.
- the number of groups is described as five, but the number of groups is not limited to this.
- the clustering processing unit 132 specifies the centroid of each group by calculating the average of the variance value and the skewness value of trips belonging to each group.
- the clustering processing unit 132 determines, for each trip, whether there is a centroid point of another group that is closer in distance than the centroid point of the group to which the trip belongs.
- the clustering processing unit 132 changes the group to which the trip belongs to the other group.
- the clustering processing unit 132 After determining whether or not there are centroid points of other groups that are close in distance for all trips, the clustering processing unit 132 identifies the centroid points of the group again. By repeating this process until all trips belong to the group having the closest center of gravity among the center points of each group, the trips are classified into groups. In the following, when all trips are classified into a group having the closest center of gravity, it may be expressed that all groups are optimized. Further, the method used by the clustering processing unit 132 is not limited to this, and a configuration in which each trip is clustered using another method may be used.
- the section determination unit 133 determines whether or not the target section corresponds to a section requiring attention using the result of the clustering process. For example, the section determination unit 133 determines whether or not the maximum average of the variances of the groups in the target section as shown in the table 9900 in FIG. 2 is equal to or greater than a predetermined threshold. For example, as described above, the section determination unit 133 determines that the target section corresponds to the section requiring attention because the average “2.245” of the variance of the group requiring attention is equal to or greater than a predetermined threshold. Then, the section determination unit 133 stores the determination result in the determination result DB 124 as illustrated in FIG.
- the result output unit 134 outputs the determination result. Specifically, the result output unit 134 outputs data for highlighting and displaying the area requiring attention on the map of the road including the area requiring attention.
- FIG. 10 is a diagram illustrating an example of the output result of the section requiring attention.
- a map 3000 illustrated in FIG. 10 is an example of a map display including a section requiring attention from a start point 9100 to an end point 9200.
- the result output unit 134 highlights the area requiring attention and displays it superimposed on the map data.
- the result output unit 134 displays the data to be superimposed on a display device (not shown), for example, or transmits the data to a user terminal (not shown) through the communication unit 110 to pay attention to the user of the road data analysis device 100. Recognize the section.
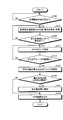
- FIG. 11 is a flowchart illustrating an example of road data analysis processing. As illustrated in FIG. 11, for example, when the travel record calculation unit 131 of the road data analysis device 100 receives an instruction to start processing from a user terminal (not shown) (S100: Yes), the variance of the speed change of each vehicle and The skewness is calculated and stored in the travel record DB 122 (S101).
- the travel record calculation unit 131 determines whether the calculation of the variance and the skewness has been completed for all the vehicles (S105). When it is determined that the calculation of the variance and the skewness has not been completed for all the vehicles (S105: No), the travel record calculation unit 131 returns to S101 and repeats the process.
- the clustering processing unit 132 clusters each vehicle using the calculated variance and the skewness (S111). ).
- the clustering processing unit 132 determines whether all groups have been optimized (S115). If the clustering processing unit 132 determines that all the groups are not optimized (S115: No), the process returns to S111 and repeats the process.
- the section determination unit 133 identifies the group having the maximum variance among the classified groups (S121). Then, the section determining unit 133 determines whether or not the maximum variance average is equal to or greater than a predetermined threshold (S125).
- the section determination unit 133 sets the target section as a section requiring attention (S131) when it is determined that the average of the maximum variance is greater than or equal to a predetermined threshold (S125: Yes). On the other hand, when it determines with the average of the dispersion
- the result output part 134 outputs the analysis result by the section determination part 133 as shown, for example in FIG. 10 (S141), and complete
- the road data analysis device 100 clusters the skewness / variance of the second speed difference acquired from a plurality of vehicles that have traveled in a predetermined section, and whether or not the road data analysis apparatus 100 falls under the section requiring attention based on the clustering result. Therefore, a dangerous section can be specified.
- the road data analysis apparatus 100 extracts a section requiring attention when a group having a large average of variance appears as a result of the clustering process, so that it is not constrained by the driving operation of a large number of vehicles or a few vehicles. Can identify dangerous sections.
- the road data analyzing apparatus 100 displays the cautionary section in a superimposed manner on the map, the user can visually identify the cautionary section.
- the present invention is not limited to this, and is included in the section requiring attention based on the determination result. It is also possible to extract further warning points. In addition, it is possible to acquire travel information from a vehicle traveling in a section requiring attention and compare it with the clustering result to issue a warning when the driving operation is dangerous.
- Example of analysis results For example, in the case where a lot of accidents occur at a point 9005 in the area requiring attention as shown in FIG. 1, if a driving operation characteristic of a group requiring attention can be detected at a point 9004 or the like before that, a road data analysis device Can alert the driver early. Therefore, the difference in driving operation at each point will be described with reference to FIGS. 12 and 13.
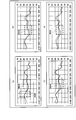
- FIG. 12 is a diagram showing an example of a comparison between the average speed of vehicles belonging to each group and the average speed of all vehicle groups.
- (A) to (d) of FIG. 12 are graphs comparing the transition of the average speed in the target section of vehicles belonging to the first cluster to the fourth cluster, respectively, and the transition of the average speed of all vehicle groups in the section. is there.
- the solid line indicates the average speed of the vehicles belonging to each cluster
- the broken line indicates the average speed of the entire vehicle group.
- FIG. 13 is a diagram illustrating an example of a comparison between the average speed of the vehicles belonging to the group requiring attention and the average speed of all the vehicle groups.
- the vehicle belonging to the first cluster is decelerating in the same manner as the entire vehicle group at the point 9004 in FIG. It is shown that each vehicle belonging to the second to fourth clusters is similarly decelerated at the point 9004. Also at the point 9005 in FIG. 12, the average speed of the vehicles belonging to the first cluster substantially matches the average speed of the entire vehicle group.
- the road data analysis device compares the difference in speed between the group requiring attention and each of the other groups for each finer point in the section requiring attention.
- the difference in speed is equal to or greater than a predetermined threshold.
- the configuration may be such that the point is specified as the warning point.
- the road data analysis device obtains travel information in real time from the traveling vehicle, and issues a warning to the traveling vehicle at a speed close to the average speed of the group requiring attention at the warning point, for example. May be. As a result, it is possible to promptly and efficiently pay attention to a vehicle that is highly likely to cause an accident.
- FIG. 14 is a diagram illustrating an example of functional blocks of the road data analysis device according to the second embodiment.
- the travel information DB 121, the travel record DB 122, the cluster DB 123, the determination result DB 124, the travel record calculation unit 131, the clustering processing unit 132, and the section determination unit 133 are the same as those in the first embodiment, and thus detailed description thereof is omitted.
- the road data analyzing apparatus 200 in the present embodiment includes a communication unit 210, a storage unit 220, and a control unit 230. Since the communication unit 210 is the same as that of the first embodiment except that it receives travel information transmitted in real time from a vehicle (not shown), detailed description thereof is omitted.
- the storage unit 220 stores, for example, programs executed by the control unit 230, various data such as threshold values, and the like.
- the storage unit 220 further includes a warning point DB 225 in addition to each DB included in the storage unit 120. Since the storage unit 220 is the same as that of the first embodiment except for the above, detailed description is omitted.
- the warning point DB 225 stores information on points extracted as warning points among the sections requiring attention.
- FIG. 15 is a diagram illustrating an example of the warning point DB. As illustrated in FIG. 15, the warning point DB 225 stores “section ID” and “point” in association with each other. Information stored in the warning point DB 225 is input by, for example, a warning point specifying unit 235 described later.
- “Section ID” indicates a section ID that identifies a section requiring attention.
- “point” indicates the distance from the start point of the warning point in the area requiring attention.
- the warning point DB 225 illustrated in FIG. 15 stores that the point “300 m” from the start point is the warning point in the section “A-003”.
- control unit 230 includes a result output unit 234 instead of the result output unit 134 included in the control unit 130.
- the control unit 230 further includes a warning point specifying unit 235, a travel information acquisition unit 236, a travel state determination unit 237, and a warning unit 238 in addition to the travel record calculation unit 131, the clustering processing unit 132, and the section determination unit 133. . Since the control unit 230 is the same as that of the first embodiment except for the above, detailed description is omitted.
- the result output unit 234 outputs the determination result. Specifically, the result output unit 234 outputs data that highlights and displays the attention required section and the warning points included in the attention required section on the map of the road including the attention required section.
- FIG. 16 is a diagram illustrating an example of the output result of the section requiring attention and the warning point.
- a map 5000 illustrated in FIG. 16 is an example of a map display including a section requiring attention from a start point 9100 to an end point 9200, as in FIG.
- the result output unit 234 emphasizes and displays the area requiring attention and the warning points 2511, 2512, 9004, and 9005 included in the area requiring attention on the map data.
- the warning point specifying unit 235 determines whether or not the point included in the area requiring attention corresponds to the warning point. Specifically, the warning point specifying unit 235 calculates the difference between the average speed of the vehicles of the group requiring attention at the warning point and the average speed of the other groups. The warning point specifying unit 235 compares the calculated difference with a predetermined threshold, and specifies the point as a warning point when the difference is equal to or greater than the threshold. And the warning point specific
- the warning point specifying unit 235 specifies that the point corresponds to the warning point.
- the travel information acquisition unit 236 acquires travel information from the vehicle. Specifically, the travel information acquisition unit 236 receives travel information such as speed in real time from a vehicle (not shown) through the communication unit 210 and stores the travel information in the travel information DB 121. In addition, the travel information acquisition unit 236 outputs the acquired travel information to the travel state determination unit 237.
- the traveling state determination unit 237 determines whether the traveling information acquired from the vehicle satisfies a predetermined condition. For example, the traveling state determination unit 237 calculates a difference between the speed of the vehicle at the warning point received from the traveling information acquisition unit 236 and the average speed of the group requiring attention at the warning point. When the traveling state determination unit 237 determines that the speed difference is less than the predetermined threshold, the traveling state determination unit 237 specifies the vehicle as a warning target and outputs the specification result to the warning unit 238.
- the traveling state determination unit 237 specifies that the vehicle is a warning target.
- the warning unit 238 transmits a warning to the vehicle. Specifically, when the warning unit 238 receives an input of a specific result from the traveling state determination unit 237, the warning unit 238 transmits warning information to the corresponding vehicle (not shown) through the communication unit 210.
- the road data analysis apparatus 200 executes a warning point specifying process for specifying a warning point based on the clustering result and a warning process for giving a warning to a vehicle traveling at the specified warning point.
- FIG. 17 is a flowchart illustrating an example of the warning point specifying process. As shown in FIG. 17, the warning point specifying unit 235 of the road data analysis device 200 specifies a point included in the attention required section when the attention determination section 133 sets the attention required section (S200: Yes) ( S201).
- the warning point specifying unit 235 calculates the difference between the average speed of vehicles belonging to the group requiring attention at the specified point and the average speed of vehicles belonging to other groups (S203). Then, the warning point specifying unit 235 determines whether or not the calculated difference is greater than or equal to a predetermined threshold (S205). If the warning point specifying unit 235 determines that the difference is less than the threshold (S205: No), the process proceeds to S215.
- the warning point specifying unit 235 sets the point as a warning point and stores it in the warning point DB 225 (S211). Then, the warning point specifying unit 235 determines whether or not the determination has been completed for all points in the area requiring attention (S215). When it is determined that the determination has not been completed for all points (S215: No), the warning point specifying unit 235 returns to S201 and repeats the process. When it is determined that the determination has been completed for all points (S215: Yes), the warning point specifying unit 235 ends the process.
- FIG. 18 is a flowchart illustrating an example of warning processing.
- the travel information acquisition unit 236 acquires the speed of the target vehicle at the warning point.
- the traveling state determination unit 237 calculates a difference between the acquired speed and the average speed at the warning point of the vehicles belonging to the group requiring attention (S301).
- the traveling state determination unit 237 determines whether the calculated difference is less than a predetermined threshold value (S305). When it is determined that the difference is greater than or equal to the threshold (S305: No), the traveling state determination unit 237 ends the process.
- the traveling state determination unit 237 When it is determined that the difference is less than the threshold (S305: Yes), the traveling state determination unit 237 outputs information indicating that the vehicle is a warning target to the warning unit 238. Upon receiving the information input, the warning unit 238 transmits a warning to the vehicle (S311) and ends the process.
- the road data analysis apparatus 200 identifies a point where the difference in average vehicle speed is equal to or greater than a predetermined threshold as a warning point between the group requiring attention and other groups, so that a dangerous point in the section requiring attention. Can be identified.
- the road data analysis apparatus 200 acquires travel information such as speed from a vehicle traveling in a critical section in real time, and calculates the speed of the traveling vehicle at the warning point and the average speed of the vehicles in the critical group. It is determined whether the difference is less than a predetermined threshold. Since the road data analysis device 200 issues a warning to the vehicle when it is determined that the difference in speed is less than the predetermined threshold value, the vehicle driver can be alerted at an appropriate timing.
- the present invention may be implemented in various different forms other than the above-described embodiments.
- the configuration in which the road data analysis apparatus 100 acquires the speed from each vehicle in units of 1 second has been described.
- the present invention is not limited to this, and different intervals such as 0.1 seconds or 5 seconds You may get the speed with.
- the vehicle speed is used as the travel information, but the travel information is not limited to this.
- the vehicle group may be clustered using other information related to the vehicle state, such as the rotational speed of the engine of the vehicle, as travel information.
- the road data analysis apparatus 100 may specify a dangerous section more accurately by determining that a downhill section in which a group including a vehicle having a low engine speed is extracted corresponds to a section requiring attention. it can.
- the road data analysis apparatus 100 may be configured to acquire other travel information and perform clustering processing. For example, the road data analysis apparatus 100 acquires information related to a change in the steering rotation angle, and determines that a section in which a group including a vehicle with a large change in the steering rotation angle is extracted corresponds to a caution section. Also good.
- the configuration in which the road data analysis apparatus 200 extracts the warning point using the speed difference between the group requiring attention and the other groups has been described.
- the present invention is not limited to this, and the magnitude of the speed change is not limited thereto. Or a difference in engine speed may be used.
- the group when there is a group whose average variance is less than a predetermined threshold, the group may be specified as a group requiring attention. For example, on a road where there are continuous small curves and pedestrian crossings and it is desirable to decelerate frequently, a vehicle traveling at a constant speed without decelerating may cause an accident with pedestrians and other decelerating vehicles. Becomes higher. According to such a configuration, since a section in which a predetermined percentage of vehicles that travel without decelerating is specified as a section requiring attention, it is possible to suppress identification of a dangerous section.
- FIG. 19 is an image diagram showing an example of a cluster of vehicles that traveled for the first time in the target section.
- FIG. 20 is an image diagram showing an example of a cluster of vehicle groups traveling in the target section a plurality of times.
- the vehicle that travels for the first time in the target section has a large dispersion of speed changes in general, and is considered to repeat acceleration and deceleration.
- a vehicle traveling a plurality of times in the target section is considered to be traveling stably with a smaller variance in speed change in general than a vehicle traveling in the target section for the first time. .
- the configuration may be such that the clustering process is performed separately for the vehicle group that travels the target section a plurality of times and the vehicle group that travels the target section for the first time. As a result, it is determined whether the average difference in the variance of the speed change between the vehicle that has traveled the target section multiple times and the vehicle that has traveled the target section for the first time is greater than or equal to a predetermined threshold. It can be accurately identified.
- the result output unit 234 issues a warning to the traveling vehicle, it determines whether or not the number of times the vehicle has traveled is less than a predetermined threshold, and warns when it is determined that it is less than the predetermined threshold.
- the structure which emits may be sufficient. As a result, it is possible to determine whether or not to be a warning target according to the presence or absence of driving experience, so that it is possible to issue a warning to the driver more effectively.
- the travel record calculation unit 131 determines whether or not the travel information is acquired at a specific time immediately after the occurrence of an accident or during stormy weather, and travel based on the travel information determined to be acquired at the specific time
- the recording may be excluded from the clustering target. In this way, by excluding the travel record corresponding to the so-called “outlier”, it is possible to specify the section requiring attention more accurately.
- the configuration for obtaining the difference between the speed and the variance may be a configuration for obtaining the ratio and other numerical values instead of the difference.
- the structure which performs the warning spot specific process in Example 2 with respect to the spot contained in areas other than the area requiring attention, for example may be sufficient.
- each component of each illustrated apparatus does not necessarily have to be physically configured as illustrated.
- the specific form of distribution / integration of each device is not limited to that shown in the figure, and all or a part thereof may be functionally or physically distributed or arbitrarily distributed in arbitrary units according to various loads or usage conditions.
- the travel record DB 122 and the cluster DB 123 may be integrated.
- the travel record calculation unit 131, the clustering processing unit 132, the section determination unit 133, and the result output unit 134 may be connected as an external device of the road data analysis device 100 via a network.
- the functions of the road data analysis apparatus 100 described above can be realized by having the travel record calculation unit 131, the clustering processing unit 132, the section determination unit 133, and the result output unit 134 each having a network connection and cooperating. May be realized.
- the road data analysis apparatus 100 can be realized by a computer having the following hardware configuration, for example.
- FIG. 21 is a diagram illustrating a hardware configuration example. As shown in FIG. 21, the road data analysis apparatus 100 includes a communication interface 100a, a display device 100b, an HDD (Hard Disk Drive) 100c, a memory 100d, and a processor 100e.
- the road data analysis apparatus 100 will be described as an example, but the road data analysis apparatus 200 can also be realized by the same hardware configuration.
- An example of the communication interface 100a is a network interface card.
- An example of the display device 100b is a display or a touch panel.
- the HDD 100c is a storage device that stores programs, data, and the like.
- Examples of the memory 100d include RAM (Random Access Memory) such as SDRAM (Synchronous Dynamic Random Access Memory), ROM (Read Only Memory), flash memory, and the like.
- Examples of the processor 100e include a CPU, a DSP (Digital Signal Processor), an FPGA (Field Programmable Gate Array), and a PLD (Programmable Logic Device).
- the road data analysis apparatus 100 operates as an information processing apparatus that executes a road image display method by reading and executing a program. That is, the road data analysis apparatus 100 executes a program that executes the same functions as the travel record calculation unit 131, the clustering processing unit 132, the section determination unit 133, and the result output unit 134. As a result, the road data analysis apparatus 100 can execute a process for executing functions similar to those of the travel record calculation unit 131, the clustering processing unit 132, the section determination unit 133, and the result output unit 134.
- the program referred to in the other embodiments is not limited to being executed by the road data analysis apparatus 100.
- the present invention can be similarly applied to a case where another computer or server executes the program or a case where these programs cooperate to execute the program.
- This program can be distributed via a network such as the Internet.
- This program is recorded on a computer-readable recording medium such as a hard disk, flexible disk (FD), CD-ROM, MO (Magneto-Optical disk), DVD (Digital Versatile Disc), and the like. It can be executed by being read.
- Warning point identification unit 100, 200 Road data analysis device 110, 210 Communication unit 120, 220 Storage unit 121 Travel information DB 122 Travel record DB 123 Cluster DB 124 Judgment result DB 225 Warning point DB 130, 230 Control unit 131 Travel record calculation unit 132 Clustering processing unit 133 Section determination unit 134, 234 Result output unit 235 Warning point identification unit 236 Travel information acquisition unit 237 Travel condition determination unit 238 Warning unit
Landscapes
- Physics & Mathematics (AREA)
- General Physics & Mathematics (AREA)
- Traffic Control Systems (AREA)
Abstract
道路データ分析装置(100)は、道路の特定の区間を走行した複数の車両から取得された所定の時間毎の速度の情報から、所定の単位時間毎の各車両の速度の変化の分散及び歪度を算出する走行記録算出部(131)と、取得された分散及び歪度を用いて複数の車両をクラスタリングするクラスタリング処理部(132)と、クラスタリングの結果として得られるクラスタが特定の条件を満たすか否かに基づいて、特定の区間が要注意区間に該当するか否かを判定する区間判定部(133)とを有する。
Description
本発明は、道路データ分析プログラム、道路データ分析方法及び道路データ分析装置に関する。
従来、車両の走行情報に基づいて急ブレーキ多発地点などの危険地点を特定し、運転者に危険地点を報知する技術が知られている。例えば、車両の単位時間当たりの走行速度のマイナス変化が大きい地点を急ブレーキ地点として特定し、走行区間中に急ブレーキ地点が複数ある場合に、急ブレーキ動作の発生頻度が高い地点を選択する技術が知られている。
上記の技術では、急ブレーキ等の特定の運転動作を行う車両が多いことに基づいて危険地点を特定しているが、危険地点はこれにより特定されるものに限られない。例えば、多数の運転者が減速して走行する地点において、一部の運転者が減速することなく走行する場合がある。このような地点では、多数の減速する車両の運転者が急ブレーキを行うことは少ないが、減速しない少数の車両によるスピードの出し過ぎや、減速する車両と減速しない車両との速度差などを原因として事故が発生する可能性が高い。しかし、上記の技術においては、このような車両間の運転動作の差異により事故が生じる可能性が高い地点を特定することはできない。
一つの側面では、危険区間を特定できる道路データ分析プログラム、道路データ分析方法及び道路データ分析装置を提供することを目的とする。
一つの態様において、道路データ分析プログラムは、道路の特定の区間を走行した複数の車両から取得された所定の時間毎の速度の情報から、所定の単位時間毎の各車両の速度の変化の分散及び歪度を算出する処理をコンピュータに実行させる。さらに、道路データ分析プログラムは、取得された分散及び歪度を用いて複数の車両をクラスタリングし、クラスタリングの結果として得られるクラスタが特定の条件を満たすか否かに基づいて、当該特定の区間が要注意区間に該当するか否かを判定する処理をコンピュータに実行させる。
一つの態様によれば、危険区間を特定できるという効果を奏する。
以下に、本願の開示する道路データ分析プログラム、道路データ分析方法及び道路データ分析装置を図面に基づいて詳細に説明する。なお、この実施例によりこの発明が限定されるものではない。なお、各実施例は、矛盾のない範囲内で適宜組み合わせることができる。
[対象区間の例]
まず、本実施例における道路データ分析プログラムにおける対象区間について、図1を用いて説明する。図1は、対象区間である峠道を走行した車両群の平均速度の一例を示す図である。図1に示すグラフ9000は、始点9100から終点9200までの区間を走行した車両群から取得した速度の平均の変化の一例を示す。図1において、縦軸は速度を示し、横軸は始点からの距離を示す。なお、本実施例においては、カーブや勾配が相次ぐ峠道のうち、車両の速度の変化が大きくなる、下り勾配が始まる区間を対象区間として説明する。また、以下において、各車両から取得された走行情報に関するデータを、トリップと表記する場合がある。以下の説明において、1つのトリップは、1台の車両から取得された走行情報に相当する。
まず、本実施例における道路データ分析プログラムにおける対象区間について、図1を用いて説明する。図1は、対象区間である峠道を走行した車両群の平均速度の一例を示す図である。図1に示すグラフ9000は、始点9100から終点9200までの区間を走行した車両群から取得した速度の平均の変化の一例を示す。図1において、縦軸は速度を示し、横軸は始点からの距離を示す。なお、本実施例においては、カーブや勾配が相次ぐ峠道のうち、車両の速度の変化が大きくなる、下り勾配が始まる区間を対象区間として説明する。また、以下において、各車両から取得された走行情報に関するデータを、トリップと表記する場合がある。以下の説明において、1つのトリップは、1台の車両から取得された走行情報に相当する。
図1において、始点9100から400m付近の地点9001においては、下り勾配の途中にカーブがある。グラフ9000に示すように、地点9001を走行する車両の多くは、加速と減速とを繰り返す。
また、始点9100から500m~700m付近の地点9002は、下り勾配の直線道路である。グラフ9000に示すように、地点9002を走行する車両の多くは、加速を始める。
また、始点9100から800m付近の地点9003は、下り勾配のカーブ直前の地点である。グラフ9000に示すように、地点9003を走行する車両の多くは、減速を始める。始点9100から1200m付近の地点9004も同様にカーブ直前であり、地点9004を走行する車両の多くは、徐々に減速していく。
一方、始点9100から1500m付近の地点9005からは、下り勾配の直線道路となる。グラフ9000に示すように、地点9005を走行する車両の多くは、加速を始める。
[クラスタリング結果の例]
次に、図1に示す区間を走行する車両群の速度の変化の分散及び歪度を算出し、算出された分散及び歪度を用いて車両群をクラスタリングした結果の一例について説明する。図2は、対象区間を走行した車両群のクラスタリング結果の一例を示す図である。図2において、縦軸は速度変化の分散の大きさを示し、横軸は速度変化の歪度を示す。また、図2における各マーカは1つのトリップを示す。なお、速度変化は、例えば各車両から1秒ごとの速度を取得し、1秒前の速度と現時点の速度とを比較することにより算出される。
次に、図1に示す区間を走行する車両群の速度の変化の分散及び歪度を算出し、算出された分散及び歪度を用いて車両群をクラスタリングした結果の一例について説明する。図2は、対象区間を走行した車両群のクラスタリング結果の一例を示す図である。図2において、縦軸は速度変化の分散の大きさを示し、横軸は速度変化の歪度を示す。また、図2における各マーカは1つのトリップを示す。なお、速度変化は、例えば各車両から1秒ごとの速度を取得し、1秒前の速度と現時点の速度とを比較することにより算出される。
なお、図2に示すクラスタリング結果は、クラスタリング処理における中間的な処理の結果を視覚的に例示したグラフであるが、かかるグラフが後述する出力結果とともに出力されるような構成であってもよい。また、クラスタリングは、例えば公知のk-means法などの手法により行う。
図2に示す分析結果において、車両の速度変化の分散は、車両の速度変化の大きさ及び頻度を示す。トリップの分散が大きいほど、車両は速度の変化幅が大きく、また頻繁に速度を変化させることを示す。また、車両の速度変化の歪度は、加速する回数と減速する回数とのどちらが多いかを示す。図2において、歪度が負のトリップは、加速する回数が多い車両を示し、歪度が正のトリップは、減速する回数が多い車両を示す。
図2において、対象区間における667件のトリップは、クラスタリング処理の結果、テーブル9900に示す5つのグループに分類される。なお、以下の説明において、クラスタリングされたグループを「クラスタ」と表記する場合がある。
マーカ「◇」で示される第1クラスタは、分散が比較的小さく、歪度が正のトリップから構成される。すなわち、第1クラスタには、速度の変化が比較的小さく、減速する回数が多い車両が属する。次に、マーカ「□」で示される第2クラスタは、分散がやや大きく、歪度が負のトリップから構成される。すなわち、第2クラスタには、速度の変化がやや大きく、加速する回数が多い車両が属する。
また、マーカ「△」で示される第3クラスタは、分散が比較的小さく、歪度が0に近いトリップから構成される。すなわち、第3クラスタには、速度の変化が比較的小さく、加速する回数と減速する回数のバランスが取れた、安定して走行する車両が属する。マーカ「×」で示される第4クラスタは、分散が比較的小さく、歪度が負のトリップから構成される。すなわち、第4クラスタには、速度の変化が比較的小さく、加速する回数が多い車両が属する。
一方で、マーカ「●」で示される第5クラスタは、分散が大きいトリップにより構成される。すなわち、第5クラスタには、速度の変化が大きい車両が属する。以上の5つのクラスタのイメージを図3に示す。図3は、対象区間を走行した車両群のクラスタの一例を示すイメージ図である。図3に示すように、第1クラスタ乃至第4クラスタが比較的分散が小さいトリップに偏っているのに対し、第5クラスタは分散が大きいトリップから構成される点が第1クラスタ乃至第4クラスタとは異なる。なお、第5クラスタは要注意クラスタの一例であり、以下の説明において、第5クラスタを「要注意グループ」と表記する場合がある。
一方、対象区間のような峠道ではなく、例えば平坦な直線道路であれば、多くの車が安定した速度で走行するので、トリップの分散及び歪度は、より小さな範囲に収束すると考えられる。図4は、平坦な直線道路を走行した車両群のクラスタの一例を示すイメージ図である。図4に示すように、平坦な直線道路においては、分散が大きいトリップから構成される第5クラスタにおいても、図3に示す対象区間の第5クラスタに比べると、属する各トリップの分散が小さい。また、図4に示すように、各トリップの歪度も、図3に示す例と比べて0に近い範囲に集中している。
このような場合において、後述する道路データ分析装置100は、最も分散の平均が大きいクラスタにおける分散の平均が所定の閾値以上である場合に、当該区間が要注意区間に該当すると判定する。上述した例において、例えば所定の閾値を「2.0」とした場合、図2に示すように、対象区間において分散の平均が最も大きい「第5クラスタ」の分散の平均は「2.245」であり、所定の閾値「2.0」以上となる。一方、平坦な直線道路においては、分散の平均が最も大きい「第5クラスタ」でも、分散の平均は所定の閾値「2.0」未満である。この場合、本実施例における道路データ分析装置100は、図3に示す対象区間は要注意区間に該当すると判定し、図4に示す平坦な直線道路は要注意区間には該当しないと判定する。
以上述べたように、本実施例における道路データ分析装置100は、所定の区間を走行した複数の車両から取得された秒間速度差の歪度・分散をクラスタリングし、分散の平均が大きいグループが現れた場合に要注意区間として抽出するので、危険な区間を特定できる。
[機能ブロック]
次に、本実施例における機能構成について説明する。図5は、実施例1における道路データ分析装置の機能ブロックの一例を示す図である。図5に示すように、本実施例における道路データ分析装置100は、通信部110、記憶部120、制御部130を有する。なお、道路データ分析装置100は、コンピュータ等の機器により実現され、図5に示す機能部以外にも既知のコンピュータが有する各種の機能部、例えば各種の入力デバイスや音声出力デバイス等の機能部を有することとしてもかまわない。
次に、本実施例における機能構成について説明する。図5は、実施例1における道路データ分析装置の機能ブロックの一例を示す図である。図5に示すように、本実施例における道路データ分析装置100は、通信部110、記憶部120、制御部130を有する。なお、道路データ分析装置100は、コンピュータ等の機器により実現され、図5に示す機能部以外にも既知のコンピュータが有する各種の機能部、例えば各種の入力デバイスや音声出力デバイス等の機能部を有することとしてもかまわない。
通信部110は、有線や無線を問わず、図示しないネットワークを経由して、図示しない車両や、道路データ分析装置100の利用者の端末など、その他のコンピュータとの通信を制御する。
記憶部120は、例えば制御部130が実行するプログラム、各種データなどを記憶する。また、記憶部120は、走行情報DB121、走行記録DB122、クラスタDB123及び判定結果DB124を有する。記憶部120は、RAM(Random Access Memory)、ROM(Read Only Memory)、フラッシュメモリ(Flash Memory)などの半導体メモリ素子や、HDD(Hard Disk Drive)などの記憶装置に対応する。
走行情報DB121は、車両から取得された走行情報を記憶する。図6は、走行情報DBの一例を示す図である。図6に示すように、走行情報DB121は、「車両ID」と「1」から始まる各番号と「走行回数」とを対応付けて記憶する。走行情報DB121には、例えば制御部130が通信部110を通じて各車両から取得した情報が予め入力される。本実施例において、走行情報DB121の各テーブルは、例えば対象区間ごとに生成される。
図6において、「車両ID」は、各車両の識別番号を示す。また、「1」から始まる各番号は、対象区間に車両が進入してから、所定の単位時間毎に取得された車両の速度を示す。なお、単位時間は、例えば1秒である。
例えば、図6に示す走行情報DB121は、車両ID「0001」の車両が、最初に「49」kmの速度で対象区間に進入し、1秒後には「50」kmに加速したことを記憶する。また、「走行回数」は、当該車両が対象区間を過去に走行した回数を示す。例えば、図6に示す走行情報DB121は、車両ID「0555」の車両は、対象区間を初めて走行することを記憶する。
なお、走行情報DB121が記憶する情報は一例であり、例えば単位時間毎のエンジンの回転数やステアリングの傾きなどのその他の走行情報を走行情報DB121が記憶するような構成であってもよい。
次に、走行記録DB122は、取得された各車両の速度の変化に基づいて算出される情報を記憶する。図7は、走行記録DBの一例を示す図である。図7に示すように、走行記録DB122は、「歪度」と「分散」と「平均速度」と「走行回数」とを「車両ID」に対応付けて記憶する。走行記録DB122に記憶される情報は、例えば後述する走行記録算出部131により入力される。本実施例において、走行記録DB122の各テーブルは、例えば対象区間ごとに生成される。
図7において、「車両ID」及び「走行回数」は、図6の「車両ID」及び「走行回数」と同様のデータを示す。また、「歪度」、「分散」及び「平均速度」は、走行情報DB121に記憶された単位時間毎の速度の歪度及び分散、並びに平均速度を示す。
なお、走行記録DB122が記憶する情報は一例であり、例えばエンジンの回転数などの変化の分散や歪度を走行記録DB122が記憶するような構成であってもよい。
次に、クラスタDB123は、対象区間を走行した車両群をクラスタリングした結果を記憶する。図8は、クラスタDBの一例を示す図である。図8に示すように、クラスタDB123は、「車両ID」と「グループ」とを対応付けて記憶する。クラスタDB123に記憶される情報は、例えば後述するクラスタリング処理部132により入力される。本実施例において、クラスタDB123の各テーブルは、例えば対象区間ごとに生成される。
図8に示すように、クラスタDB123は、例えば、車両ID「0001」の車両がグループ「1」に分類され、車両ID「0555」の車両がグループ「5」に分類されたことを記憶する。
次に、判定結果DB124は、各区間が要注意区間に該当するか否かを判定した結果を記憶する。図9は、判定結果DBの一例を示す図である。判定結果DB124に記憶される情報は、例えば後述する区間判定部133により入力される。
図9に示すように、判定結果DB124は、「区間ID」と「最大平均分散」と「判定結果」とを対応付けて記憶する。「区間ID」は、判定対象とする各区間の識別情報を示す。例えば、図2に示す対象区間には、区間ID「A-003」が付与される。
図9において、「最大平均分散」は、各区間におけるクラスタリング処理の結果算出された、各グループの分散の平均のうち、最大のものを示す。例えば、対象区間「A-003」の最大平均分散には、図2のテーブル9900に示すように、5つのグループのうち分散の平均が最大であり、要注意グループとされる第5クラスタの分散の平均「2.245」が記憶される。
図9において、「判定結果」は、各区間の最大平均分散が、所定の閾値以上であるかを示す。図9に示す判定結果DB124は、対象区間「A-003」の判定結果として、対象区間の最大平均分散が所定の閾値「2.0」以上であるため、要注意区間に該当することを示す「◎」を記憶する。一方、図9に示す判定結果DB124は、対象区間「A-001」の判定結果として、対象区間の最大平均分散が所定の閾値未満であるため、要注意区間に該当しないことを示す「×」を記憶する。
図5に戻って、制御部130は、道路データ分析装置100の全体的な処理を司る処理部であり、例えばプロセッサなどである。この制御部130は、走行記録算出部131、クラスタリング処理部132、区間判定部133及び結果出力部134を有する。なお、走行記録算出部131、クラスタリング処理部132、区間判定部133及び結果出力部134は、プロセッサが有する電子回路の一例やプロセッサが実行するプロセスの一例である。
走行記録算出部131は、各区間における各車両の速度変化の歪度や分散などの走行記録を算出する。具体的には、走行記録算出部131は、走行情報DB121に記憶された対象区間における各車両の単位時間毎の速度などの走行情報を読み出し、対象区間における各車両の単位時間毎の速度変化を算出する。また、走行記録算出部131は、各車両の対象区間における速度変化の歪度及び分散を算出する。また、走行記録算出部131は、各車両の対象区間における平均速度なども算出する。さらに、走行記録算出部131は、走行情報DB121に記憶された走行回数を、走行記録DB122に記憶する。
クラスタリング処理部132は、対象区間における各車両の走行記録を用いて、各トリップをクラスタリングする。具体的には、クラスタリング処理部132は、走行記録DB122から対象区間における各トリップの走行記録を読み出し、例えば公知のk-means法などの手法を用いて各トリップをクラスタリングする。また、クラスタリング処理部132は、図2のテーブル9900に示すように、クラスタリングされた各グループに属するトリップの歪度の平均及び分散の平均、並びにトリップ数を算出する。
例えば、クラスタリング処理部132は、走行記録DB122に記録された各トリップを、分散の値を第1の軸とし、歪度の値を第2の軸として座標上に展開する。かかる座標上に展開されたトリップを視覚化すると、例えば図2に示すようなグラフとなる。
次に、クラスタリング処理部132は、任意の数のグループに、各トリップをランダムに割り当てる。なお、本実施例においては、グループの数は5として説明するが、グループの数はこれに限られない。
次に、クラスタリング処理部132は、各グループに属するトリップの分散の値及び歪度の値の平均を算出することにより、各グループの重心点を特定する。次に、クラスタリング処理部132は、トリップごとに、当該トリップが属するグループの重心点より距離が近い他のグループの重心点が存在するか否かを判定する。クラスタリング処理部132は、距離が近い他のグループの重心点が存在すると判定した場合、当該トリップが所属するグループを、当該他のグループに変更する。
全てのトリップについて、距離が近い他のグループの重心点が存在するか否かを判定した後に、クラスタリング処理部132は、改めてグループの重心点を特定する。かかる処理を、全てのトリップが、各グループの重心点のうち、最も重心点が近いグループに所属するようになるまで繰り返すことにより、トリップが各グループに分類される。なお、以下において、全てのトリップが、最も重心点が近いグループに分類されることを、全てのグループが最適化されたと表記する場合がある。また、クラスタリング処理部132が用いる手法はこれに限られず、その他の手法を用いて各トリップをクラスタリングするような構成であってもよい。
区間判定部133は、クラスタリング処理の結果を用いて、対象区間が要注意区間に該当するか否かを判定する。例えば、区間判定部133は、図2のテーブル9900に示すような対象区間における各グループの分散の平均のうち最大のものが所定の閾値以上であるか否かを判定する。例えば、区間判定部133は、上で述べたように、要注意グループの分散の平均「2.245」が所定の閾値以上であるため、対象区間が要注意区間に該当すると判定する。そして、区間判定部133は、図9に示すように、判定結果を判定結果DB124に記憶する。
結果出力部134は、判定結果を出力する。具体的には、結果出力部134は、要注意区間を含む道路の地図上に、要注意区間を強調して表示させるデータを出力する。
結果出力部134が出力するデータの一例を、図10を用いて説明する。図10は、要注意区間の出力結果の一例を示す図である。図10に示す地図3000は、始点9100から終点9200までの要注意区間を含む地図表示の一例である。結果出力部134は、図10に示すように、要注意区間を強調して地図データ上に重畳表示させる。結果出力部134は、重畳表示させるデータを、例えば図示しない表示装置に表示させ、又は通信部110を通じて図示しない利用者の端末に送信することにより、道路データ分析装置100の利用者に、要注意区間を認識させる。
[処理の流れ]
図11は、道路データ分析処理の一例を示すフローチャートである。図11に示すように、道路データ分析装置100の走行記録算出部131は、例えば、図示しない利用者の端末から処理開始の指示を受け付けると(S100:Yes)、各車両の速度変化の分散及び歪度を算出し、走行記録DB122に記憶する(S101)。
図11は、道路データ分析処理の一例を示すフローチャートである。図11に示すように、道路データ分析装置100の走行記録算出部131は、例えば、図示しない利用者の端末から処理開始の指示を受け付けると(S100:Yes)、各車両の速度変化の分散及び歪度を算出し、走行記録DB122に記憶する(S101)。
次に、走行記録算出部131は、全ての車両について分散及び歪度の算出が完了したか否かを判定する(S105)。走行記録算出部131は、全ての車両について分散及び歪度の算出が完了していないと判定した場合(S105:No)、S101に戻って処理を繰り返す。
一方、クラスタリング処理部132は、全ての車両について分散及び歪度の算出が完了したと判定された場合(S105:Yes)、算出された分散及び歪度を用いて、各車両をクラスタリングする(S111)。
次に、クラスタリング処理部132は、全てのグループが最適化されたか否かを判定する(S115)。クラスタリング処理部132は、全てのグループが最適化されていないと判定した場合(S115:No)、S111に戻って処理を繰り返す。
一方、区間判定部133は、全てのグループが最適化されたと判定された場合(S115:Yes)、分類されたグループのうち、分散の平均が最大となるグループを特定する(S121)。そして、区間判定部133は、最大となる分散の平均が、所定の閾値以上であるか否かを判定する(S125)。
区間判定部133は、最大となる分散の平均が、所定の閾値以上であると判定した場合(S125:Yes)、対象区間を要注意区間に設定する(S131)。一方、区間判定部133は、最大となる分散の平均が、所定の閾値以上ではないと判定した場合(S125:No)、S141に移行する。
そして、結果出力部134は、例えば図10に示すような区間判定部133による分析結果を出力し(S141)、処理を終了する。
[効果]
このように、道路データ分析装置100は、所定の区間を走行した複数の車両から取得された秒間速度差の歪度・分散をクラスタリングし、クラスタリング結果に基づいて要注意区間に該当するか否かを判定するので、危険な区間を特定できる。
このように、道路データ分析装置100は、所定の区間を走行した複数の車両から取得された秒間速度差の歪度・分散をクラスタリングし、クラスタリング結果に基づいて要注意区間に該当するか否かを判定するので、危険な区間を特定できる。
また、道路データ分析装置100は、クラスタリング処理の結果、分散の平均が大きいグループが現れた場合に要注意区間として抽出するので、大多数の車両やごく一部の車両の運転動作にとらわれることなく、危険な区間を特定できる。
さらに、道路データ分析装置100は、要注意区間を地図上に重畳して表示させるので、利用者に対して、要注意区間を視覚的に識別させることができる。
例えば、実施例1では、クラスタリング結果に基づいて要注意区間に該当するか否かを判定する例を説明したが、これに限定されるものではなく、判定結果に基づいて、要注意区間に含まれる警告地点をさらに抽出することもできる。また、要注意区間を走行中の車両から走行情報を取得してクラスタリング結果と比較し、運転動作が危険な場合に警告を発することもできる。
[分析結果の例]
例えば、図1に示すような要注意区間において、地点9005において事故が多発するような場合、それより手前の地点9004等において、要注意グループに特徴的な運転動作が検出できれば、道路データ分析装置は運転者に早期に注意を促すことができる。そこで、各地点における運転動作の違いについて、図12及び図13を用いて説明する。
例えば、図1に示すような要注意区間において、地点9005において事故が多発するような場合、それより手前の地点9004等において、要注意グループに特徴的な運転動作が検出できれば、道路データ分析装置は運転者に早期に注意を促すことができる。そこで、各地点における運転動作の違いについて、図12及び図13を用いて説明する。
図12は、各グループに属する車両の平均速度と、全車両群の平均速度との比較の一例を示す図である。図12の(a)乃至(d)は、それぞれ第1クラスタ乃至第4クラスタに属する車両の対象区間における平均速度の推移と、同区間における全車両群の平均速度の推移とを比較したグラフである。各グラフにおいて、実線は各クラスタに属する車両の平均速度を示し、破線は全車両群の平均速度を示す。また、図13は、要注意グループに属する車両の平均速度と、全車両群の平均速度との比較の一例を示す図である。
図12の地点9004において、第1クラスタに属する車両は、概ね全車両群と同様に減速していることがわかる。第2クラスタ乃至第4クラスタに属する各車両についても、地点9004において、それぞれ同様に減速していることが示されている。また、図12の地点9005においても、第1クラスタに属する車両の平均速度は、概ね全車両群の平均速度と合致する。
一方、図13に示されるように、要注意グループである第5クラスタに属する車両は、地点9004において、ほとんど減速することなく走行していると考えられる。また、第5クラスタに属する車両は、地点9004より後の地点9005においても、全車両の平均と比べて大きく速度が超過していることが示されている。同様に、第5クラスタに属する車両は、地点9004より前の地点2511及び2512においても、急な加速及び減速を繰り返していることが示されている。
このように、道路データ分析装置が、要注意区間において、より細かな地点ごとに、要注意グループとその他の各グループとの速度の差異を比較し、例えば速度の差異が所定の閾値以上である地点を、警告地点として特定するような構成であってもよい。また、道路データ分析装置が、走行中の車両からリアルタイムで走行情報を取得し、例えば警告地点において要注意グループの平均速度と近い速度で走行中の車両に対して警告を発するような構成であってもよい。これにより、事故を起こす可能性の高い車両に対して、早期にかつ効率よく注意を促すことができる。
[機能ブロック]
次に、本実施例における機能ブロックについて説明する。図14は、実施例2における道路データ分析装置の機能ブロックの一例を示す図である。図14において、走行情報DB121、走行記録DB122、クラスタDB123、判定結果DB124、走行記録算出部131、クラスタリング処理部132及び区間判定部133は、実施例1と同様なので、詳細な説明は省略する。
次に、本実施例における機能ブロックについて説明する。図14は、実施例2における道路データ分析装置の機能ブロックの一例を示す図である。図14において、走行情報DB121、走行記録DB122、クラスタDB123、判定結果DB124、走行記録算出部131、クラスタリング処理部132及び区間判定部133は、実施例1と同様なので、詳細な説明は省略する。
図14に示すように、本実施例における道路データ分析装置200は、通信部210、記憶部220及び制御部230を有する。通信部210は、図示しない車両からリアルタイムで送信される走行情報を受信する他は実施例1と同様なので、詳細な説明は省略する。
記憶部220は、例えば制御部230が実行するプログラム、閾値などの各種データなどを記憶する。また、記憶部220は、記憶部120が有する各DBに加えて、さらに警告地点DB225を有する。記憶部220は、上述した以外は実施例1と同様なので、詳細な説明は省略する。
警告地点DB225は、要注意区間のうち、警告地点として抽出された地点の情報を記憶する。図15は、警告地点DBの一例を示す図である。図15に示すように、警告地点DB225は、「区間ID」と「地点」とを対応付けて記憶する。警告地点DB225に記憶される情報は、例えば後述する警告地点特定部235により入力される。
図15において、「区間ID」は、要注意区間を識別する区間IDを示す。図15において、「地点」は、要注意区間内における警告地点の始点からの距離を示す。図15に例示する警告地点DB225は、区間「A-003」において、始点から「300m」の地点が警告地点であることを記憶する。
図14に戻って、制御部230は、制御部130が有する結果出力部134の代わりに結果出力部234を有する。また、制御部230は、走行記録算出部131、クラスタリング処理部132、区間判定部133に加えて、警告地点特定部235、走行情報取得部236、走行状況判定部237、警告部238をさらに有する。制御部230は、上述した以外は実施例1と同様なので、詳細な説明は省略する。
結果出力部234は、判定結果を出力する。具体的には、結果出力部234は、要注意区間を含む道路の地図上に、要注意区間と、要注意区間に含まれる警告地点とを強調して表示させるデータを出力する。
結果出力部234が出力するデータの一例を、図16を用いて説明する。図16は、要注意区間及び警告地点の出力結果の一例を示す図である。図16に示す地図5000は、図10と同様に、始点9100から終点9200までの要注意区間を含む地図表示の一例である。結果出力部234は、図16に示すように、要注意区間と、要注意区間に含まれる警告地点2511、2512、9004、9005とを強調して地図データ上に重畳表示させる。
警告地点特定部235は、要注意区間に含まれる地点が警告地点に該当するか否かを判定する。具体的には、警告地点特定部235は、警告地点における要注意グループの車両の平均速度と、その他のグループの平均速度との差分を算出する。警告地点特定部235は、算出された差分と、所定の閾値とを比較し、差分が閾値以上である場合に、当該地点を警告地点として特定する。そして、警告地点特定部235は、特定された警告地点に関する情報を警告地点DB225に記憶する。
例えば、所定の閾値が「10km」である場合において、要注意グループの車両の平均速度が「62km」であり、その他の4グループの平均速度が「52km」である場合、速度の差分は「10km」となる。かかる差分は閾値以上であるため、警告地点特定部235は、かかる地点が警告地点に該当することを特定する。
走行情報取得部236は、車両から走行情報を取得する。具体的には、走行情報取得部236は、通信部210を通じて、図示しない車両から、リアルタイムで速度等の走行情報を受信し、走行情報DB121に記憶する。また、走行情報取得部236は、取得された走行情報を、走行状況判定部237に出力する。
走行状況判定部237は、車両から取得された走行情報が、所定の条件を満たすか否かを判定する。例えば、走行状況判定部237は、走行情報取得部236から入力を受けた警告地点における車両の速度と、当該警告地点における要注意グループの平均速度との差分を算出する。そして、走行状況判定部237は、当該速度の差分が所定の閾値未満であると判定した場合に、当該車両を警告対象として特定し、特定結果を警告部238に出力する。
例えば、所定の閾値が「5km」である場合において、要注意グループの車両の警告地点における平均速度が「62km」であり、当該車両の警告地点における速度が「58km」である場合、速度の差分は「4km」となる。かかる差分は閾値未満であるため、走行状況判定部237は、当該車両が警告対象に該当することを特定する。
警告部238は、車両に対して警告を送信する。具体的には、警告部238は、走行状況判定部237から特定結果の入力を受けた場合、図示しない該当車両に対して、通信部210を通じて、警告情報を送信する。
[処理の流れ]
本実施例における道路データ分析装置200は、クラスタリング結果に基づいて警告地点を特定する警告地点特定処理と、特定された警告地点を走行中の車両に対する警告を行う警告処理とを実行する。図17は、警告地点特定処理の一例を示すフローチャートである。図17に示すように、道路データ分析装置200の警告地点特定部235は、区間判定部133により要注意区間が設定されると(S200:Yes)、要注意区間に含まれる地点を特定する(S201)。
本実施例における道路データ分析装置200は、クラスタリング結果に基づいて警告地点を特定する警告地点特定処理と、特定された警告地点を走行中の車両に対する警告を行う警告処理とを実行する。図17は、警告地点特定処理の一例を示すフローチャートである。図17に示すように、道路データ分析装置200の警告地点特定部235は、区間判定部133により要注意区間が設定されると(S200:Yes)、要注意区間に含まれる地点を特定する(S201)。
次に、警告地点特定部235は、特定された地点における要注意グループに属する車両の平均速度と、その他のグループに属する車両の平均速度との差分を算出する(S203)。そして、警告地点特定部235は、算出された差分が、所定の閾値以上であるか否かを判定する(S205)。警告地点特定部235は、差分が閾値未満であると判定した場合(S205:No)、S215に移行する。
警告地点特定部235は、差分が閾値以上であると判定した場合(S205:Yes)、当該地点を警告地点に設定し、警告地点DB225に記憶する(S211)。そして、警告地点特定部235は、要注意区間中の全ての地点について判定が完了したか否かを判定する(S215)。警告地点特定部235は、全ての地点について判定が完了していないと判定した場合(S215:No)、S201に戻って処理を繰り返す。警告地点特定部235は、全ての地点について判定が完了したと判定した場合(S215:Yes)、処理を終了する。
次に、警告処理について説明する。図18は、警告処理の一例を示すフローチャートである。まず、走行情報取得部236は、対象車両が警告地点に進入すると(S300:Yes)、対象車両の警告地点における速度を取得する。次に、走行状況判定部237は、取得された速度と、要注意グループに属する車両の当該警告地点における平均速度との差分を算出する(S301)。
そして、走行状況判定部237は、算出された差分が所定の閾値未満であるか否かを判定する(S305)。走行状況判定部237は、差分が閾値以上であると判定した場合(S305:No)、処理を終了する。
走行状況判定部237は、差分が閾値未満であると判定した場合(S305:Yes)、当該車両が警告対象であることを示す情報を警告部238に出力する。情報の入力を受けた警告部238は、当該車両に対して警告を送信し(S311)、処理を終了する。
[効果]
このように、道路データ分析装置200は、要注意グループと他のグループとで、車両の平均速度の差が所定の閾値以上である地点を警告地点として特定するので、要注意区間における危険な地点を特定できる。
このように、道路データ分析装置200は、要注意グループと他のグループとで、車両の平均速度の差が所定の閾値以上である地点を警告地点として特定するので、要注意区間における危険な地点を特定できる。
また、道路データ分析装置200は、要注意区間を走行中の車両から速度等の走行情報をリアルタイムで取得し、警告地点における走行中の車両の速度と、要注意グループの車両の平均速度との差分が所定の閾値未満であるか否かを判定する。道路データ分析装置200は、速度の差分が所定の閾値未満であると判定した場合に当該車両に警告を発するので、的確なタイミングで車両の運転者に注意を促すことができる。
さて、これまで本発明の実施例について説明したが、本発明は上述した実施例以外にも、種々の異なる形態にて実施されてよいものである。例えば、実施例1においては、道路データ分析装置100が、各車両から1秒単位で速度を取得する構成について説明したが、これに限られず、0.1秒単位や5秒単位など、異なる間隔で速度を取得してもよい。
[クラスタリングに用いる走行情報]
なお、上記各実施例では、走行情報として車両の速度を用いているが、走行情報はこれに限られない。例えば、車両のエンジンの回転数など、車両の状態に関するその他の情報を走行情報として、車両群をクラスタリングしてもよい。
なお、上記各実施例では、走行情報として車両の速度を用いているが、走行情報はこれに限られない。例えば、車両のエンジンの回転数など、車両の状態に関するその他の情報を走行情報として、車両群をクラスタリングしてもよい。
例えば、下り坂が続く区間においては、運転に習熟したドライバーはエンジンブレーキを活用するため、車両のエンジンの回転数が上昇する傾向がある。例えば、道路データ分析装置100が、エンジンの回転数が低い車両を含むグループが抽出されるような下り坂区間を要注意区間に該当すると判定することで、より的確に危険区間を特定することができる。
同様に、道路データ分析装置100が、その他の走行情報を取得してクラスタリング処理を行うような構成であってもよい。例えば、道路データ分析装置100が、ステアリングの回転角度の変化に関する情報を取得し、ステアリングの回転角度の変化が大きい車両を含むグループが抽出されるような区間を要注意区間に該当すると判定してもよい。
同様に、実施例2において、道路データ分析装置200が、要注意グループとその他のグループとの速度差を用いて警告地点を抽出する構成について説明したが、これに限られず、速度変化の大きさの差異や、エンジンの回転数の差異などを用いてもよい。
[要注意区間の判定基準]
また、分散の平均が所定の閾値以上となるグループを要注意グループとして特定する例について説明したが、要注意グループを特定する構成はこれに限られない。例えば、特定のグループにおける分散の平均と、その他のグループにおける分散の平均との差分が所定の閾値以上になる場合に、当該特定のグループを要注意グループとして特定するような構成であってもよい。
また、分散の平均が所定の閾値以上となるグループを要注意グループとして特定する例について説明したが、要注意グループを特定する構成はこれに限られない。例えば、特定のグループにおける分散の平均と、その他のグループにおける分散の平均との差分が所定の閾値以上になる場合に、当該特定のグループを要注意グループとして特定するような構成であってもよい。
また、上記の実施例とは逆に、例えば分散の平均が所定の閾値未満となるグループが存在する場合に、当該グループを要注意グループとして特定するような構成としてもよい。例えば、細かなカーブや横断歩道などが連続し、頻繁に減速することが望ましい道路において、減速することなく一定の速度で走行する車両は、歩行者や減速する他の車両と事故を起こす可能性が高くなる。このような構成によれば、減速せずに走行するような車両が所定の割合存在するような区間を要注意区間として特定するので、危険区間の特定漏れを抑制することができる。
[走行回数]
また、要注意区間においては、当該区間を過去に走行している運転者は、危険性を認識して適切に加減速を行う可能性が高いと考えられる。一方、要注意区間を初めて走行する運転者は、事前に危険を認識せずに運転する結果、要注意グループに分類される運転動作に近くなる場合が多いと考えられる。そこで、走行情報として、車両ごとに当該区間の走行回数を記憶し、走行回数に応じて車両群をクラスタリングするような構成であってもよい。
また、要注意区間においては、当該区間を過去に走行している運転者は、危険性を認識して適切に加減速を行う可能性が高いと考えられる。一方、要注意区間を初めて走行する運転者は、事前に危険を認識せずに運転する結果、要注意グループに分類される運転動作に近くなる場合が多いと考えられる。そこで、走行情報として、車両ごとに当該区間の走行回数を記憶し、走行回数に応じて車両群をクラスタリングするような構成であってもよい。
車両ごとの当該区間の走行回数に応じて車両群をクラスタリングした結果について、図19及び図20を用いて説明する。図19は、対象区間を初めて走行した車両群のクラスタの一例を示すイメージ図である。一方、図20は、対象区間を複数回走行している車両群のクラスタの一例を示すイメージ図である。図19に示すように、対象区間を初めて走行する車両は、全般に速度変化の分散が大きく、加速や減速を繰り返していると考えられる。一方、図20に示すように、対象区間を複数回走行している車両は、対象区間を初めて走行する車両と比べて全般に速度変化の分散が小さく、安定して走行していると考えられる。
一方で、例えば図4に示すような平坦な直線道路においては、対象区間を複数回走行している車両も、対象区間を初めて走行する車両も、速度変化の分散には大きな差異がないと考えられる。そこで、対象区間を複数回走行している車両群と、対象区間を初めて走行する車両群とに分けてクラスタリング処理を行うような構成であってもよい。これにより、対象区間を複数回走行している車両と対象区間を初めて走行する車両とで速度変化の分散の平均の差異が所定の閾値以上になるか否かを判定するので、危険区間をより的確に特定することができる。
また、結果出力部234が、走行中の車両に警告を発する場合において、当該車両の走行回数が所定の閾値未満であるか否かを判定し、所定の閾値未満であると判定した場合に警告を発するような構成であってもよい。これにより、運転経験の有無に応じて警告の対象とするか否かを判別することができるので、より効果的に運転者に対する警告を発することができる。
[外れ値となるトリップ]
なお、対象区間において、直前に大規模な事故が発生した場合や、積雪や豪雨などの荒天時においては、走行回数に関わらず、運転者は注意深くなり、急な加速や減速を行うことが少なくなることが予想される。こうした場合において取得された走行情報を用いてクラスタリング処理を行うと、速度変化の分散の平均が所定の閾値以上となるグループが分類されず、要注意区間を適切に特定できなくなるおそれがある。
なお、対象区間において、直前に大規模な事故が発生した場合や、積雪や豪雨などの荒天時においては、走行回数に関わらず、運転者は注意深くなり、急な加速や減速を行うことが少なくなることが予想される。こうした場合において取得された走行情報を用いてクラスタリング処理を行うと、速度変化の分散の平均が所定の閾値以上となるグループが分類されず、要注意区間を適切に特定できなくなるおそれがある。
そこで、走行記録算出部131が、事故発生直後や荒天時などの特定の時点において取得された走行情報であるか否かを判定し、特定の時点において取得されたと判定された走行情報に基づく走行記録を、クラスタリング処理の対象から除外してもよい。このように、いわゆる「外れ値」にあたる走行記録を除外することにより、より的確に要注意区間を特定することができる。
[その他の応用例]
また、上記実施例において、速度や分散の差分を求める構成は、差分ではなく比率その他の数値を求めるような構成であってもよい。なお、実施例2における警告地点特定処理を、例えば要注意区間以外の区間に含まれる地点に対して行うような構成であってもよい。
また、上記実施例において、速度や分散の差分を求める構成は、差分ではなく比率その他の数値を求めるような構成であってもよい。なお、実施例2における警告地点特定処理を、例えば要注意区間以外の区間に含まれる地点に対して行うような構成であってもよい。
[分散および統合]
また、図示した各装置の各構成要素は、必ずしも物理的に図示の如く構成されておらずともよい。すなわち、各装置の分散・統合の具体的形態は図示のものに限られず、その全部または一部を、各種の負荷や使用状況などに応じて、任意の単位で機能的または物理的に分散・統合して構成することができる。例えば、走行記録DB122及びクラスタDB123を統合してもよい。また、走行記録算出部131、クラスタリング処理部132、区間判定部133及び結果出力部134を道路データ分析装置100の外部装置としてネットワーク経由で接続するようにしてもよい。また、走行記録算出部131、クラスタリング処理部132、区間判定部133及び結果出力部134を別の装置がそれぞれ有し、ネットワーク接続されて協働することで、上記の道路データ分析装置100の機能を実現するようにしてもよい。
また、図示した各装置の各構成要素は、必ずしも物理的に図示の如く構成されておらずともよい。すなわち、各装置の分散・統合の具体的形態は図示のものに限られず、その全部または一部を、各種の負荷や使用状況などに応じて、任意の単位で機能的または物理的に分散・統合して構成することができる。例えば、走行記録DB122及びクラスタDB123を統合してもよい。また、走行記録算出部131、クラスタリング処理部132、区間判定部133及び結果出力部134を道路データ分析装置100の外部装置としてネットワーク経由で接続するようにしてもよい。また、走行記録算出部131、クラスタリング処理部132、区間判定部133及び結果出力部134を別の装置がそれぞれ有し、ネットワーク接続されて協働することで、上記の道路データ分析装置100の機能を実現するようにしてもよい。
また、本実施例において説明した各処理のうち、自動的におこなわれるものとして説明した処理の全部または一部を手動的におこなうこともできる。あるいは、手動的におこなわれるものとして説明した処理の全部または一部を公知の方法で自動的におこなうこともできる。この他、上記文書中や図面中で示した処理手順、制御手順、具体的名称、各種のデータやパラメータを含む情報については、特記する場合を除いて任意に変更することができる。
[ハードウェア]
上記道路データ分析装置100は、例えば、次のようなハードウェア構成を有するコンピュータにより実現することができる。図21は、ハードウェア構成例を説明する図である。図21に示すように、道路データ分析装置100は、通信インタフェース100a、表示装置100b、HDD(Hard Disk Drive)100c、メモリ100d、プロセッサ100eを有する。なお、以下においては、道路データ分析装置100を例として説明するが、道路データ分析装置200についても同様のハードウェア構成により実現できる。
上記道路データ分析装置100は、例えば、次のようなハードウェア構成を有するコンピュータにより実現することができる。図21は、ハードウェア構成例を説明する図である。図21に示すように、道路データ分析装置100は、通信インタフェース100a、表示装置100b、HDD(Hard Disk Drive)100c、メモリ100d、プロセッサ100eを有する。なお、以下においては、道路データ分析装置100を例として説明するが、道路データ分析装置200についても同様のハードウェア構成により実現できる。
通信インタフェース100aの一例としては、ネットワークインタフェースカードなどである。表示装置100bの一例としては、ディスプレイやタッチパネルなどである。HDD100cは、プログラムやデータなどを記憶する記憶装置である。
メモリ100dの一例としては、SDRAM(Synchronous Dynamic Random Access Memory)等のRAM(Random Access Memory)、ROM(Read Only Memory)、フラッシュメモリ等が挙げられる。プロセッサ100eの一例としては、CPU、DSP(Digital Signal Processor)、FPGA(Field Programmable Gate Array)、PLD(Programmable Logic Device)等が挙げられる。
また、道路データ分析装置100は、プログラムを読み出して実行することで道路画像表示方法を実行する情報処理装置として動作する。つまり、道路データ分析装置100は、走行記録算出部131、クラスタリング処理部132、区間判定部133及び結果出力部134と同様の機能を実行するプログラムを実行する。この結果、道路データ分析装置100は、走行記録算出部131、クラスタリング処理部132、区間判定部133及び結果出力部134と同様の機能を実行するプロセスを実行することができる。なお、この他の実施例でいうプログラムは、道路データ分析装置100によって実行されることに限定されるものではない。例えば、他のコンピュータまたはサーバがプログラムを実行する場合や、これらが協働してプログラムを実行するような場合にも、本発明を同様に適用することができる。
このプログラムは、インターネットなどのネットワークを介して配布することができる。また、このプログラムは、ハードディスク、フレキシブルディスク(FD)、CD-ROM、MO(Magneto-Optical disk)、DVD(Digital Versatile Disc)などのコンピュータで読み取り可能な記録媒体に記録され、コンピュータによって記録媒体から読み出されることによって実行することができる。
100、200 道路データ分析装置
110、210 通信部
120、220 記憶部
121 走行情報DB
122 走行記録DB
123 クラスタDB
124 判定結果DB
225 警告地点DB
130、230 制御部
131 走行記録算出部
132 クラスタリング処理部
133 区間判定部
134、234 結果出力部
235 警告地点特定部
236 走行情報取得部
237 走行状況判定部
238 警告部
110、210 通信部
120、220 記憶部
121 走行情報DB
122 走行記録DB
123 クラスタDB
124 判定結果DB
225 警告地点DB
130、230 制御部
131 走行記録算出部
132 クラスタリング処理部
133 区間判定部
134、234 結果出力部
235 警告地点特定部
236 走行情報取得部
237 走行状況判定部
238 警告部
Claims (11)
- コンピュータに、
道路の特定の区間を走行した複数の車両から取得された所定の時間毎の速度の情報から、所定の単位時間毎の各車両の速度の変化の分散及び歪度を算出し、
取得された前記分散及び前記歪度を用いて前記複数の車両をクラスタリングし、
前記クラスタリングの結果として得られるクラスタが特定の条件を満たすか否かに基づいて、前記特定の区間が要注意区間に該当するか否かを判定する
処理を実行させることを特徴とする道路データ分析プログラム。 - 前記判定する処理は、クラスタごとに前記分散の平均を算出し、前記分散の平均が所定の閾値以上となるクラスタが存在すると判定した場合に、当該特定の区間が要注意区間に該当すると判定することを特徴とする請求項1に記載の道路データ分析プログラム。
- 前記特定の区間に含まれる地点におけるクラスタごとの車両の平均速度を算出し、
要注意クラスタに属する車両について算出された前記平均速度と、前記要注意クラスタに属さない車両について算出された前記平均速度との差分を算出し、前記差分が所定の閾値以上となる前記地点を警告地点として抽出する
処理をさらにコンピュータに実行させることを特徴とする請求項1又は2に記載の道路データ分析プログラム。 - 前記要注意区間に該当すると判定された区間と、抽出された前記警告地点とを前記道路の地図に重畳して出力する処理をさらにコンピュータに実行させることを特徴とする請求項3に記載の道路データ分析プログラム。
- 前記特定の区間を走行する対象車両の地点ごとの速度を取得し、
前記特定の区間に含まれる地点において、前記対象車両の前記速度と、要注意クラスタに属する車両の平均速度との差分が所定の範囲に含まれるか否かを判定し、
前記差分が前記所定の範囲に含まれると判定した場合に、前記対象車両に警告を発する
処理をさらにコンピュータに実行させることを特徴とする請求項1又は2に記載の道路データ分析プログラム。 - 前記算出する処理は、前記特定の区間において事故が発生した時点から所定の期間内に取得された前記速度の情報、及び前記特定の区間における気象条件が所定の条件に該当する時点において取得された前記速度の情報を除外して、前記各車両の速度の変化の分散及び歪度を算出することを特徴とする請求項1又は2に記載の道路データ分析プログラム。
- 前記クラスタリングする処理は、前記車両が前記特定の区間を過去に走行した回数をさらに用いて、前記複数の車両をクラスタリングすることを特徴とする請求項1又は2に記載の道路データ分析プログラム。
- 前記判定する処理は、前記回数が0である車両から構成されるクラスタに属する車両における前記分散の平均と、前記回数が1以上である前記車両から構成されるクラスタに属する車両における前記分散の平均との差異が所定の閾値以上となる場合に、当該特定の区間が要注意区間に該当すると判定することを特徴とする請求項7に記載の道路データ分析プログラム。
- 前記クラスタリングする処理は、前記車両の速度、速度変化率又はエンジンの回転数をさらに用いて、前記複数の車両をクラスタリングすることを特徴とする請求項1又は2に記載の道路データ分析プログラム。
- コンピュータが、
道路の特定の区間を走行した複数の車両から取得された所定の時間毎の速度の情報から、所定の単位時間毎の各車両の速度の変化の分散及び歪度を算出し、
取得された前記分散及び前記歪度を用いて前記複数の車両をクラスタリングし、
前記クラスタリングの結果として得られるクラスタが特定の条件を満たすか否かに基づいて、前記特定の区間が要注意区間か否かを判定する
処理を実行することを特徴とする道路データ分析方法。 - 道路の特定の区間を走行した複数の車両から取得された所定の時間毎の速度の情報から、所定の単位時間毎の各車両の速度の変化の分散及び歪度を算出する走行記録算出部と、
取得された前記分散及び前記歪度を用いて前記複数の車両をクラスタリングするクラスタリング処理部と、
前記クラスタリングの結果として得られるクラスタが特定の条件を満たすか否かに基づいて、前記特定の区間が要注意区間か否かを判定する区間判定部と
を有することを特徴とする道路データ分析装置。
Priority Applications (2)
| Application Number | Priority Date | Filing Date | Title |
|---|---|---|---|
| JP2018544670A JPWO2018070050A1 (ja) | 2016-10-14 | 2016-10-14 | 道路データ分析プログラム、道路データ分析方法及び道路データ分析装置 |
| PCT/JP2016/080622 WO2018070050A1 (ja) | 2016-10-14 | 2016-10-14 | 道路データ分析プログラム、道路データ分析方法及び道路データ分析装置 |
Applications Claiming Priority (1)
| Application Number | Priority Date | Filing Date | Title |
|---|---|---|---|
| PCT/JP2016/080622 WO2018070050A1 (ja) | 2016-10-14 | 2016-10-14 | 道路データ分析プログラム、道路データ分析方法及び道路データ分析装置 |
Publications (1)
| Publication Number | Publication Date |
|---|---|
| WO2018070050A1 true WO2018070050A1 (ja) | 2018-04-19 |
Family
ID=61905394
Family Applications (1)
| Application Number | Title | Priority Date | Filing Date |
|---|---|---|---|
| PCT/JP2016/080622 Ceased WO2018070050A1 (ja) | 2016-10-14 | 2016-10-14 | 道路データ分析プログラム、道路データ分析方法及び道路データ分析装置 |
Country Status (2)
| Country | Link |
|---|---|
| JP (1) | JPWO2018070050A1 (ja) |
| WO (1) | WO2018070050A1 (ja) |
Cited By (1)
| Publication number | Priority date | Publication date | Assignee | Title |
|---|---|---|---|---|
| CN112652161A (zh) * | 2019-10-12 | 2021-04-13 | 阿里巴巴集团控股有限公司 | 一种车流路径分布信息的处理方法、装置、及电子设备 |
Citations (4)
| Publication number | Priority date | Publication date | Assignee | Title |
|---|---|---|---|---|
| JP2005091112A (ja) * | 2003-09-16 | 2005-04-07 | Equos Research Co Ltd | 走行速度パターン推定装置、及びハイブリッド車両の駆動制御装置 |
| JP2009237963A (ja) * | 2008-03-27 | 2009-10-15 | Aisin Aw Co Ltd | 走行パターン情報取得装置、走行パターン情報取得方法および走行パターン情報取得プログラム |
| JP2011053798A (ja) * | 2009-08-31 | 2011-03-17 | Denso Corp | 運転環境判定装置,運転状況推定装置,運転支援装置 |
| JP2012128739A (ja) * | 2010-12-16 | 2012-07-05 | Toyota Central R&D Labs Inc | 衝突危険判定装置及びプログラム |
-
2016
- 2016-10-14 WO PCT/JP2016/080622 patent/WO2018070050A1/ja not_active Ceased
- 2016-10-14 JP JP2018544670A patent/JPWO2018070050A1/ja active Pending
Patent Citations (4)
| Publication number | Priority date | Publication date | Assignee | Title |
|---|---|---|---|---|
| JP2005091112A (ja) * | 2003-09-16 | 2005-04-07 | Equos Research Co Ltd | 走行速度パターン推定装置、及びハイブリッド車両の駆動制御装置 |
| JP2009237963A (ja) * | 2008-03-27 | 2009-10-15 | Aisin Aw Co Ltd | 走行パターン情報取得装置、走行パターン情報取得方法および走行パターン情報取得プログラム |
| JP2011053798A (ja) * | 2009-08-31 | 2011-03-17 | Denso Corp | 運転環境判定装置,運転状況推定装置,運転支援装置 |
| JP2012128739A (ja) * | 2010-12-16 | 2012-07-05 | Toyota Central R&D Labs Inc | 衝突危険判定装置及びプログラム |
Cited By (2)
| Publication number | Priority date | Publication date | Assignee | Title |
|---|---|---|---|---|
| CN112652161A (zh) * | 2019-10-12 | 2021-04-13 | 阿里巴巴集团控股有限公司 | 一种车流路径分布信息的处理方法、装置、及电子设备 |
| CN112652161B (zh) * | 2019-10-12 | 2023-01-06 | 阿里巴巴集团控股有限公司 | 一种车流路径分布信息的处理方法、装置、及电子设备 |
Also Published As
| Publication number | Publication date |
|---|---|
| JPWO2018070050A1 (ja) | 2019-06-24 |
Similar Documents
| Publication | Publication Date | Title |
|---|---|---|
| JP6412070B2 (ja) | 運転支援装置及び運転支援方法 | |
| EP3166090B1 (en) | Apparatus and method for providing traffic information | |
| US10515546B2 (en) | Driving determination device and detection device | |
| US10347122B2 (en) | Road condition monitoring system | |
| JP6307356B2 (ja) | 運転コンテキスト情報生成装置 | |
| JP6112054B2 (ja) | 電子機器、電子機器の制御方法及び電子機器の制御プログラム | |
| US10776735B2 (en) | Risk information processing method and server device | |
| CN110588647B (zh) | 一种车辆加塞的判断方法、系统及车辆 | |
| CN111369831A (zh) | 一种道路驾驶危险预警方法、装置和设备 | |
| US20220289215A1 (en) | Driving diagnosis device, driving diagnosis system and driving diagnosis method | |
| JP6706826B2 (ja) | 判定プログラム、判定方法および情報処理装置 | |
| US20190300017A1 (en) | Method of controlling a vehicle | |
| CN106062845A (zh) | 驾驶辅助系统、方法以及程序 | |
| CN116168531A (zh) | 基于雷达与视频的隧道安全管理方法、装置、设备及介质 | |
| JP6857211B2 (ja) | 情報処理方法およびサーバ装置 | |
| CN114664085A (zh) | 危险路段的提醒方法、装置、电子设备及介质 | |
| US10269248B2 (en) | Information processing apparatus and non-transitory computer readable recording medium | |
| CN111183463A (zh) | 用于处理机动车中的数据以发送至后端的方法、设备和具有指令的计算机可读的存储介质 | |
| KR20260040391A (ko) | 본선 합류를 위해 우회전하는 것을 계획중인 자율 주행 차량의 행동 결정 방법, 장치 및 컴퓨터-판독가능 기록매체 | |
| CN113246995A (zh) | 系统、信息处理装置、以及信息处理方法 | |
| WO2018070050A1 (ja) | 道路データ分析プログラム、道路データ分析方法及び道路データ分析装置 | |
| JP2024002733A (ja) | 歩行者用報知装置、歩行者用報知システム及び歩行者用報知プログラム | |
| JP6678147B2 (ja) | 危険予兆判定装置、危険予兆判定システム、車両、およびプログラム | |
| JP4789367B2 (ja) | 運転心理判定装置及び運転心理判定方法、並びに運転支援装置及び運転支援方法 | |
| SE1150180A1 (sv) | System och metod för bedömning av kökörning |
Legal Events
| Date | Code | Title | Description |
|---|---|---|---|
| 121 | Ep: the epo has been informed by wipo that ep was designated in this application |
Ref document number: 16918957 Country of ref document: EP Kind code of ref document: A1 |
|
| ENP | Entry into the national phase |
Ref document number: 2018544670 Country of ref document: JP Kind code of ref document: A |
|
| NENP | Non-entry into the national phase |
Ref country code: DE |
|
| 122 | Ep: pct application non-entry in european phase |
Ref document number: 16918957 Country of ref document: EP Kind code of ref document: A1 |