WO2017208304A1 - ピーク検出方法及びデータ処理装置 - Google Patents
ピーク検出方法及びデータ処理装置 Download PDFInfo
- Publication number
- WO2017208304A1 WO2017208304A1 PCT/JP2016/065915 JP2016065915W WO2017208304A1 WO 2017208304 A1 WO2017208304 A1 WO 2017208304A1 JP 2016065915 W JP2016065915 W JP 2016065915W WO 2017208304 A1 WO2017208304 A1 WO 2017208304A1
- Authority
- WO
- WIPO (PCT)
- Prior art keywords
- peak
- data
- peak candidate
- candidate
- scale
- Prior art date
- Legal status (The legal status is an assumption and is not a legal conclusion. Google has not performed a legal analysis and makes no representation as to the accuracy of the status listed.)
- Ceased
Links
Images




Classifications
-
- G—PHYSICS
- G01—MEASURING; TESTING
- G01N—INVESTIGATING OR ANALYSING MATERIALS BY DETERMINING THEIR CHEMICAL OR PHYSICAL PROPERTIES
- G01N30/00—Investigating or analysing materials by separation into components using adsorption, absorption or similar phenomena or using ion-exchange, e.g. chromatography or field flow fractionation
- G01N30/02—Column chromatography
- G01N30/86—Signal analysis
- G01N30/8624—Detection of slopes or peaks; baseline correction
- G01N30/8631—Peaks
- G01N30/8637—Peak shape
-
- G—PHYSICS
- G01—MEASURING; TESTING
- G01N—INVESTIGATING OR ANALYSING MATERIALS BY DETERMINING THEIR CHEMICAL OR PHYSICAL PROPERTIES
- G01N30/00—Investigating or analysing materials by separation into components using adsorption, absorption or similar phenomena or using ion-exchange, e.g. chromatography or field flow fractionation
- G01N30/02—Column chromatography
- G01N30/86—Signal analysis
- G01N30/8624—Detection of slopes or peaks; baseline correction
- G01N30/8631—Peaks
-
- G—PHYSICS
- G01—MEASURING; TESTING
- G01N—INVESTIGATING OR ANALYSING MATERIALS BY DETERMINING THEIR CHEMICAL OR PHYSICAL PROPERTIES
- G01N30/00—Investigating or analysing materials by separation into components using adsorption, absorption or similar phenomena or using ion-exchange, e.g. chromatography or field flow fractionation
- G01N30/02—Column chromatography
- G01N30/86—Signal analysis
- G01N30/8603—Signal analysis with integration or differentiation
- G01N30/8617—Filtering, e.g. Fourier filtering
Definitions
- the present invention relates to a method for detecting a peak from a chromatogram obtained by, for example, a chromatograph, a spectrum obtained by a mass spectrometer, a spectroscopic device, or the like, and a data processing apparatus for executing the method.
- a chromatograph is one of the devices that analyze the components contained in a sample.
- a sample is placed on a mobile phase flow and introduced into a column.
- Each component in the sample is temporally separated in the column and then detected by a detector to create a chromatogram.
- a peak is detected from the chromatogram, each component is identified from the peak position, and the concentration of the component is determined from the peak height and area (for example, Patent Document 1).
- processing for automatically detecting peaks from the chromatogram with software is performed.
- automatic detection of peaks is performed for the spectrum.
- Non-Patent Document 1 describes that a peak of a mass spectrum is detected using wavelet transform. Note that this method is not limited to mass spectra but can be applied to wavelength spectra, chromatograms, and the like.
- the wavelet transform is a function of the variable t that represents an isolated (temporally localized) wave, a constant called scale that represents the horizontal scale, and the horizontal translation.
- the variable t is a measurement variable, which corresponds to a mass-to-charge ratio in the case of a mass spectrum, a wavelength in the case of an optical spectrum, and time in the case of a chromatogram.
- an evaluation function d that is the inner product of the target data x (t) represented by a graph with the variable t as the horizontal axis and the mother wavelet ⁇ (t) (In the above equation, the one with a horizontal line above ⁇ (t) is the complex conjugate of the function ⁇ (t)).
- This evaluation function d is a function having scale and translation as parameters. Then, the value of d is calculated while changing the scale and translation. For the evaluation function d obtained by the wavelet transform in this way, the scale and translation at which the value becomes the maximum value are obtained.
- the mother wavelet ⁇ (t) having the scale and translation as parameters has the highest degree of coincidence with the target data x (t).
- the value of the measurement variable t at which the evaluation function d has a maximum value on the ridge line is determined as the peak position (t value) in the target data (mass spectrum). According to this method, a peak can be detected regardless of the strength of the peak in the target data.
- a narrow peak noise or a peak background with a slowly rising width may be superimposed.
- these peak noise and background are also detected as peaks, and it is possible to determine whether the detected peak is a true peak or noise or background. Can not. The same applies to the spectrum.
- a problem to be solved by the present invention is a peak detection method and data processing capable of detecting a peak regardless of the intensity of the peak and determining whether the detected peak is a true peak. Is to provide a device.
- a data processing method made to solve the above problems is a method of detecting a peak from graph data representing a change in a measured value with respect to a measurement variable, a) a wavelet transform step for obtaining an evaluation function using the scale and translation of the mother wavelet as parameters by performing wavelet transform on the data using a mother wavelet having only one maximum value; b) Obtaining peak candidate information for determining the position of the peak candidate in the data based on the translation where the evaluation function has a maximum value and determining the width of the peak candidate based on the scale corresponding to the peak candidate And a step.
- the measurement variable refers to, for example, the time in the case of a chromatograph, the wavelength in the case of an optical spectrum, and the mass-to-charge ratio in the case of a mass-to-charge ratio spectrum. Expressed as a vertical axis.
- wavelet transformation is performed using a mother wavelet having only one maximum value, and the position of the peak candidate in the data is obtained based on the translation where the evaluation function has the maximum value, and the peak candidate is The width of the peak candidate is determined based on the corresponding scale.
- the width of the peak candidate thus determined is an index for discriminating whether the peak candidate is an original peak derived from a component in the sample or is different from the original peak (noise, background, etc.) Become.
- the scale is not the same value as the width of the peak candidate, when the mother wavelet has only one maximum value, there is a correlation with the width. Note that if the mother wavelet has two or more local maximum values, the mother wavelet may mean that the degree of coincidence with a plurality of peaks in the data is high, so the scale and data peaks Cannot be associated. Therefore, in the present invention, a mother wavelet having only one maximum value is used.
- the mother wavelet typically includes a Mexican hat function.
- a function obtained by taking a difference between two Gaussian functions having different widths called a Gaussian difference
- a method for determining the width of the peak candidate will be described by taking as an example the case where a Mexican hat function is used as the mother wavelet.
- data having only one peak with a Gaussian distribution is assumed as a model, and the peak width of the model is set to an unknown value ⁇ p .
- the inner product d top becomes the scale ⁇ f It is expressed. here, It is.
- the evaluation function S is obtained from the inner product d obtained by wavelet transforming the actual data, a ridge line is created from the obtained evaluation function S, and the scale ⁇ fmax at which the evaluation function S becomes the maximum value in the ridge line ,
- the peak candidate width ⁇ p can be determined.
- variety of a peak candidate can be determined using the method similar to the above.
- the peak detection method includes: By removing one or more peak candidates from the data in order from the one with the smallest value of the scale among the plurality of peak candidates, creating broad peak candidate detection data, The data may be replaced with the wide peak candidate detection data, and the wavelet transform step and the peak candidate information acquisition step may be performed.
- the processing using the wide peak candidate detection data eliminates the influence of the narrower peak candidate, and then the wavelet. Since the conversion step, peak candidate position determination step, and peak candidate width determination step are performed, it is easy to detect a wide peak candidate. Note that removing some of the peak candidates when creating the broad peak candidate detection data does not mean that the peak candidates are determined to be false peaks. For these peak candidates, authenticity may be determined based on the width determined before being removed from the data.
- a data processing apparatus is an apparatus that performs data processing for detecting a peak from data of a graph representing a change in a measured value with respect to a measurement variable, a) a wavelet transform unit that obtains an evaluation function using the scale and translation of the mother wavelet as variables by performing wavelet transform on the data using a mother wavelet having only one maximum value; b) Obtaining peak candidate information for determining the position of the peak candidate in the data based on the translation where the evaluation function has a maximum value and determining the width of the peak candidate based on the scale corresponding to the peak candidate And a section.
- the present invention it is possible to detect a peak candidate regardless of the strength of the peak by performing wavelet transform, and to determine the width of the detected peak candidate. Based on the width of the peak candidate thus determined, it can be determined whether the peak candidate is a true peak.
- FIG. 1 is a schematic configuration diagram showing a first embodiment of a data processing apparatus according to the present invention.
- the flowchart which shows 1st Embodiment of the data processing method which concerns on this invention.
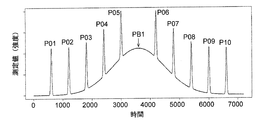
- the graph which shows the data of the process target in Example 1 which performed the process by the data processing method of 1st Embodiment. 6 is a graph showing an example in which the position of the ridge line and the maximum value of the evaluation function on the ridge line is obtained from the evaluation function obtained by wavelet transformation in the first embodiment.
- the schematic block diagram which shows 2nd Embodiment of the data processor which concerns on this invention.
- the flowchart which shows 2nd Embodiment of the data processing method which concerns on this invention.
- the data processing device 10 is used together with the data recording unit 1, the display device 2, and the input device 3.
- the data recording unit 1 is a device that records data obtained at the time of measurement by a detector included in a liquid chromatograph, a gas chromatograph, or the like, and includes a hard disk, a memory, and the like.
- the data recording unit 1 is provided outside the data processing apparatus 10 in the example shown in FIG. 1, but may be provided inside the data processing apparatus 10.
- the display device 2 is a display that displays information during data processing by the data processing device 10 and a result of the data processing.
- the input device 3 is a device for inputting information required by the user to the data processing device 10, and includes a keyboard, a mouse, and the like.
- the data processing apparatus 10 includes a chromatogram creation unit 11, a wavelet conversion unit 12, a peak candidate information acquisition unit 13, and a peak determination unit 14.
- the peak candidate information acquisition unit 13 includes a peak candidate position determination unit 131 and a peak candidate width determination unit 132.
- Each of these units is actually embodied by hardware and software such as a CPU and memory of a computer.
- the first embodiment of the data processing method according to the present invention will be described using the flowchart of FIG. 2, and the functions of the respective units of the data processing apparatus 10 of the first embodiment will be described.
- the chromatogram creation unit 11 acquires data from the data recording unit 1 and creates a chromatogram C (t) by a method similar to the conventional method (step S1).
- the chromatogram C (t) corresponds to the above-described “graph data representing a change in measured value”, and t is time and corresponds to the measurement variable described above.
- an operation for creating a chromatogram is unnecessary, and data may be acquired from the data recording unit 1.
- the wavelet transform unit 12 obtains an evaluation function by performing wavelet transform on the chromatogram C (t) (step S2).
- the target data x (t) in the above equation (1) is a chromatogram C (t)
- the mother wavelet ⁇ (t) is a function having only one maximum value such as a Mexican hat function or a Gaussian difference.
- the inner product itself thus obtained may be used as the evaluation function, or the inner product multiplied by ⁇ f m (where ⁇ f is a scale) as shown in the equation (5) may be used as the evaluation function.
- This evaluation function is a function having scale and translation as parameters.
- the peak candidate information acquisition unit 13 creates a ridge line from the evaluation function obtained in step S2 (step S3), and obtains a point where the value of the evaluation function becomes a maximum value on the obtained ridge line.
- the ridge line is created by performing the operation for obtaining the maximum value when the measurement variable t is changed while the scale ⁇ f is fixed to a certain value for a number of scale ⁇ f values.
- the number of ridge lines obtained here is not limited to one, and in many cases there are a plurality of ridge lines. Therefore, the point at which the value of the evaluation function becomes a maximum value on the ridge line is obtained for each of the maximum values.
- the peak candidate position determining unit 131 obtains the value of the measurement variable at the maximum value thus obtained as the position (time) where the peak candidate exists in the chromatogram C (t) (step S4), and the peak candidate width determining unit 132 For each peak candidate, the width of the peak candidate is determined based on the scale (step S5).
- steps S3 to S5 correspond to the above-described peak candidate information acquisition step. Note that steps S4 and S5 may be performed in parallel, or step S5 may be performed first.
- the peak determination unit 27 determines whether the corresponding peak candidate is a true peak or not a true peak such as noise or background from the obtained width value (step S6). The process is terminated. Whether or not it is a true peak is typically determined by setting an upper limit value and a lower limit value of the width, and if the obtained width is between the upper limit value and the lower limit value, it is a true peak. If not, it is determined that the peak is not a true peak. Alternatively, the position (time) may be divided into a plurality of sections, and an upper limit value and a lower limit value of the width may be determined for each section. In the present embodiment, the peak determination unit 14 automatically performs this determination, but instead, a person may perform the determination after displaying the width value on the display device 2.
- Example 1 an example in which peak detection is performed by the data processing method of the first embodiment will be described.
- Example 1 the data shown in the graph of FIG. In this data, ten peaks (P01 to P10) and one peak profile PB1 wider than these peaks are seen.
- the evaluation function was used.
- the value of the scale where the evaluation function has the maximum value is determined as it is as the width of the peak candidate of the original data.
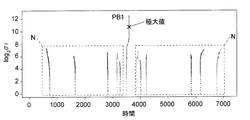
- FIG. 4 shows the result of obtaining the ridge line.
- the horizontal axis of the two-dimensional graph is time (measurement variable, the same as the horizontal axis of the original data), and the vertical axis is scale ⁇ f ( ⁇ f is a logarithm with a base of 2)
- ⁇ f is a logarithm with a base of 2
- the data was expressed as follows. First, by fixing the scale ⁇ f to one value and changing the measurement variable, a point at which the evaluation function at the value of the scale ⁇ f becomes a maximum value is obtained. This operation is repeated while changing the value of the scale ⁇ f little by little. Then, in the graph of FIG. 4, one line of points extending in the vertical axis direction appears for each peak candidate. A row of these points is a ridge line. Then, by obtaining the scale ⁇ f at which the evaluation function has a maximum value for each ridge line, the position at which the maximum value is obtained on the two-dimensional graph in FIG
- FIG. 5 shows a schematic configuration of the data processing device 20 according to the second embodiment.
- the data processing device 20 has a configuration in which a wide peak candidate detection data creation unit 21 is added to the data processing device 10 of the first embodiment.
- a wide peak candidate detection data creation unit 21 is added to the data processing device 10 of the first embodiment.
- steps S11 to S15 the position (time) where the peak candidate exists and the width of the peak candidate are determined by performing the same operations as in steps S1 to S5 of the peak processing method of the first embodiment.
- the broad peak candidate detection data creation unit 21 selects one or a plurality of peak candidates in order from the peak candidate having the smallest value of the determined width (step S16). Subsequently, in step S17, it is determined whether or not a broad peak detection operation is to be executed. As a determination method, for example, as described above, when the maximum value cannot be obtained as in the peak profile PB1, YES is set, or YES is performed until step S17 is executed a predetermined number of times regardless of the data contents. And the like.
- step S17 it is determined whether or not the selected peak candidate is a true peak (step S18). Then, by removing the data in the range corresponding to the position and width of the selected peak candidate from the chromatogram C (t) and interpolating the data in the range with a straight line or a curve, Data is created (step S19). Thereafter, the process returns to step S12, and the operations of steps S12 to S16 are repeated based on the wide peak candidate detection data. At this time, in the wide peak candidate detection data, the number of peaks or peak-like profiles is smaller than that in the original data, so that it is easy to detect wide peaks. These operations in steps S12 to S16 are repeatedly executed until NO is determined in step S17.
- step S17 the peak determination unit determines whether or not all peak candidates remaining at that time are true peaks (step S20), and ends the process.
- Example 2 similarly to the first embodiment, the data shown in the graph of FIG. First, ten peaks P01 to P10 are detected by the same method as in the first embodiment. Then, based on the positions and widths obtained for the detected peaks P01 to P10, wide peak candidate detection is performed by removing the data of the peaks P01 to P10 from the original data of FIG. 3 and interpolating the removed portions. Data was created. A graph of the created broad peak candidate detection data is shown in FIG. A ridge line was created based on the wide peak candidate detection data. The ridge line is shown in FIG.
- One column of points extending in the vertical axis direction corresponding to the peak profile PB1 is formed, and the position where the evaluation function becomes the maximum value is specified. There was no other point sequence in the vicinity of this sequence, and the position and width of the peak profile PB1 could be determined without being affected by other peaks. Note that the point sequence other than that corresponding to the peak profile PB1 is noise due to discontinuity or the like generated during data interpolation.
Landscapes
- Physics & Mathematics (AREA)
- Health & Medical Sciences (AREA)
- Life Sciences & Earth Sciences (AREA)
- Chemical & Material Sciences (AREA)
- Analytical Chemistry (AREA)
- Biochemistry (AREA)
- General Health & Medical Sciences (AREA)
- General Physics & Mathematics (AREA)
- Immunology (AREA)
- Pathology (AREA)
- Other Investigation Or Analysis Of Materials By Electrical Means (AREA)
- Investigating Or Analysing Materials By Optical Means (AREA)
Abstract
本発明に係るピーク検出方法は、測定変数に対する測定値の変化を表すグラフのデータからピークを検出する方法であって、前記データに対して、極大値を1つのみ有するマザーウェーブレットを用いてウェーブレット変換を行うことにより、該マザーウェーブレットのスケール及びトランスレーションをパラメータとする評価関数を求めるウェーブレット変換ステップ(S2)と、前記評価関数が極大値を有するところのトランスレーションに基づいて前記データにおけるピーク候補の位置を求めると共に、該ピーク候補に対応するスケールに基づいて該ピーク候補の幅を決定するピーク候補情報取得ステップ(S3~S5)とを有する。ウェーブレット変換を行うことでピークの強弱等に関わらずピーク候補を検出することができ、且つ、ピーク候補が真のピークであるかを判別する指標となるピーク候補の幅を決定することができる。
Description
本発明は、例えばクロマトグラフで得られるクロマトグラムや、質量分析装置や分光装置等で得られるスペクトルからピークを検出する方法及び該方法を実行するデータ処理装置に関する。
試料に含まれる成分を分析する装置の1つにクロマトグラフがある。クロマトグラフでは試料を移動相の流れに乗せてカラムに導入し、カラム内で試料中の各成分を時間的に分離した後、検出器で検出してクロマトグラムを作成する。そして、クロマトグラムからピークを検出し、ピーク位置から各成分を同定すると共に、ピーク高さや面積から当該成分の濃度を決定する(例えば特許文献1)。これらの操作のために、クロマトグラムからピークをソフトウエアで自動検出する処理が行われている。スペクトルに関しても同様にピークの自動検出が行われている。
非特許文献1には、ウェーブレット変換を用いてマススペクトルのピークを検出することが記載されている。なお、当該方法はマススペクトルに限らず、波長スペクトルやクロマトグラム等にも適用可能である。一般に、ウェーブレット変換では、孤立した(時間的に局在した)波を表す変数tの関数であって、横軸方向の拡大縮小を表すスケール(scale)と呼ばれる定数と、横軸方向の平行移動を表すトランスレーション(translation)と呼ばれる定数を有する、マザーウェーブレットψ(t)と呼ばれる関数を用いる。測定データを変換対象とする場合には、変数tは測定変数であり、マススペクトルの場合には質量電荷比、光スペクトルの場合には波長、クロマトグラムの場合には時間が該当する。ウェーブレット変換では、変数tを横軸とするグラフで表される対象データx(t)とマザーウェーブレットψ(t)の内積である評価関数d

を計算する(上式中、ψ(t)の上に横線を付したものは、関数ψ(t)の複素共役である)。この評価関数dはスケール及びトランスレーションをパラメータとする関数である。そして、スケール及びトランスレーションを変化させつつdの値を計算する。こうしてウェーブレット変換により得られた評価関数dにつき、その値が極大値となるスケール及びトランスレーションを求める。このスケール及びトランスレーションをパラメータとして有するマザーウェーブレットψ(t)が、対象データx(t)との一致度が最も高いことになる。
を計算する(上式中、ψ(t)の上に横線を付したものは、関数ψ(t)の複素共役である)。この評価関数dはスケール及びトランスレーションをパラメータとする関数である。そして、スケール及びトランスレーションを変化させつつdの値を計算する。こうしてウェーブレット変換により得られた評価関数dにつき、その値が極大値となるスケール及びトランスレーションを求める。このスケール及びトランスレーションをパラメータとして有するマザーウェーブレットψ(t)が、対象データx(t)との一致度が最も高いことになる。
マザーウェーブレットψ(t)の一例として、メキシカンハット関数

が挙げられる。ここでaはスケール、bはトランスレーションである。非特許文献1では、メキシカンハット関数を用いてウェーブレット変換を行うことにより評価関数dを求める。そのうえで、評価関数dについて、スケールaをある1つの値に固定して測定変数tを変化させたときに極大値となる点を求める操作を、多数のスケールaの値について行う。こうして求めた点を、測定変数tを横軸、スケールaを縦軸とするグラフ上に表すと、スケールaの方向に延びる1又は複数の線状となる。このように線状に表されるデータを「リッジライン」と呼ぶ。そして、リッジライン上で評価関数dが極大値を有するところの測定変数tの値を、対象データ(マススペクトル)におけるピークの位置(tの値)と決定する。この方法によれば、対象データにおけるピークの強弱等に関わらず、ピークを検出することができる。
が挙げられる。ここでaはスケール、bはトランスレーションである。非特許文献1では、メキシカンハット関数を用いてウェーブレット変換を行うことにより評価関数dを求める。そのうえで、評価関数dについて、スケールaをある1つの値に固定して測定変数tを変化させたときに極大値となる点を求める操作を、多数のスケールaの値について行う。こうして求めた点を、測定変数tを横軸、スケールaを縦軸とするグラフ上に表すと、スケールaの方向に延びる1又は複数の線状となる。このように線状に表されるデータを「リッジライン」と呼ぶ。そして、リッジライン上で評価関数dが極大値を有するところの測定変数tの値を、対象データ(マススペクトル)におけるピークの位置(tの値)と決定する。この方法によれば、対象データにおけるピークの強弱等に関わらず、ピークを検出することができる。
Pan Du 他2名、"Improved peak detection in mass spectrum by incorporating continuous wavelet transform-based pattern matching(連続ウェーブレット変換に基づくパターンマッチングを組み込むことによる、マススペクトルにおける改良されたピーク検出)"、Bioinformatics、(英国)、オックスフォード大学出版、2006年7月4日、第22巻第17号2059~2065頁
クロマトグラムには、成分に由来する本来のピークの他に、幅の狭いピーク状のノイズや、緩やかに立ち上がり幅が広いピーク状のバックグラウンドが重畳することがある。非特許文献1に記載の方法では、これらピーク状のノイズやバックグラウンドもピークとして検出してしまい、検出されたピークが真のピークであるのか、ノイズやバックグラウンドであるのかを判別することができない。スペクトルの場合も同様である。
本発明が解決しようとする課題は、ピークの強弱等に関わらずピークを検出することができ、且つ、検出されたピークが真のピークであるかを判別することができるピーク検出方法及びデータ処理装置を提供することである。
上記課題を解決するために成された本発明に係るデータ処理方法は、測定変数に対する測定値の変化を表すグラフのデータからピークを検出する方法であって、
a) 前記データに対して、極大値を1つのみ有するマザーウェーブレットを用いてウェーブレット変換を行うことにより、該マザーウェーブレットのスケール及びトランスレーションをパラメータとする評価関数を求めるウェーブレット変換ステップと、
b) 前記評価関数が極大値を有するところのトランスレーションに基づいて前記データにおけるピーク候補の位置を求めると共に、該ピーク候補に対応するスケールに基づいて該ピーク候補の幅を決定するピーク候補情報取得ステップと
を有することを特徴とする。
a) 前記データに対して、極大値を1つのみ有するマザーウェーブレットを用いてウェーブレット変換を行うことにより、該マザーウェーブレットのスケール及びトランスレーションをパラメータとする評価関数を求めるウェーブレット変換ステップと、
b) 前記評価関数が極大値を有するところのトランスレーションに基づいて前記データにおけるピーク候補の位置を求めると共に、該ピーク候補に対応するスケールに基づいて該ピーク候補の幅を決定するピーク候補情報取得ステップと
を有することを特徴とする。
ここで、測定変数とは例えばクロマトグラフの場合の時間、光スペクトルの場合の波長、質量電荷比スペクトルの場合の質量電荷比のことを指し、通常、グラフにおいて測定変数は横軸、測定値は縦軸として表現される。
本発明では、極大値を1つのみ有するマザーウェーブレットを用いてウェーブレット変換を行い、評価関数が極大値を有するところのトランスレーションに基づいて前記データにおけるピーク候補の位置を求めると共に、該ピーク候補に対応するスケールに基づいて該ピーク候補の幅を決定する。こうして決定されたピーク候補の幅は、該ピーク候補が試料中の成分に由来する本来のピークであるのか、本来のピークとは異なるもの(ノイズやバックグラウンド等)であるのかを判別する指標となる。
スケールは、ピーク候補の幅と同じ値ではないものの、マザーウェーブレットが極大値を1つのみ有する場合には該幅との間で相関関係がある。なお、マザーウェーブレットが極大値が2つ以上有する場合には、該マザーウェーブレットが前記データにおける複数個のピークとの一致度が高いことを意味している可能性があるため、スケールとデータのピークを対応付けることができない。そのため、本発明では極大値を1つのみ有するマザーウェーブレットを用いる。
前記マザーウェーブレットには、典型的にはメキシカンハット関数が挙げられる。あるいは、ガウス差分と呼ばれる、幅の異なる2つのガウス関数の差を取った関数を前記マザーウェーブレットして用いることもできる。以下、マザーウェーブレットとしてメキシカンハット関数を用いる場合を例として、ピーク候補の幅を決定する方法を説明する。ここでは、ガウス分布を有するピークが1個のみ存在するデータをモデルとして仮定し、該モデルのピークの幅を未知の値σpとする。また、このモデルのデータに対してウェーブレット変換を行うと、内積dtopは、スケールをσfとして

と表される。ここで、

である。ここで、内積dtopにスケールσf mを乗じた評価関数
S(σp, σf, m)=σf m dtop(σp, σf) …(5)
を導入する。この評価関数Sがσfの関数として極大値を取るとき、すなわち(∂S/∂σf)=0のとき、
σf=((5+2m)/(1-2m))1/2σp …(6)
となる。
と表される。ここで、
である。ここで、内積dtopにスケールσf mを乗じた評価関数
S(σp, σf, m)=σf m dtop(σp, σf) …(5)
を導入する。この評価関数Sがσfの関数として極大値を取るとき、すなわち(∂S/∂σf)=0のとき、
σf=((5+2m)/(1-2m))1/2σp …(6)
となる。
(5)式の評価関数Sにおいてm=0とすれば、内積dtopそのものが評価関数Sとなる。この場合、評価関数Sの極大値におけるスケールをσfmaxとすると、σp=5-1/2σfmaxとなる。また、(5)式においてm=-1とすれば、σp=σfmaxとなる。mの値をこれら0及び-1以外の値とした場合にも、同様にσfmaxとσpの関係を求めることができる。
そこで、実際のデータをウェーブレット変換することにより得られる内積dから評価関数Sを求め、得られた評価関数Sからリッジラインを作成し、該リッジラインにおいて評価関数Sが極大値となるスケールσfmaxを求めることにより、ピーク候補の幅σpを決定することができる。
なお、メキシカンハット関数以外のウェーブレット関数を用いる場合にも、上記と同様の方法を用いてピーク候補の幅を決定することができる。
本発明に係るピーク検出方法は、
複数の前記ピーク候補のうち前記スケールの値が小さい方から順に1又は複数個のピーク候補を前記データから除去することにより、幅広ピーク候補検出用データを作成し、
前記データを前記幅広ピーク候補検出用データに置き換えて、前記ウェーブレット変換ステップ及び前記ピーク候補情報取得ステップを行う
という処理を行うこともできる。
複数の前記ピーク候補のうち前記スケールの値が小さい方から順に1又は複数個のピーク候補を前記データから除去することにより、幅広ピーク候補検出用データを作成し、
前記データを前記幅広ピーク候補検出用データに置き換えて、前記ウェーブレット変換ステップ及び前記ピーク候補情報取得ステップを行う
という処理を行うこともできる。
一般に、幅の広いピーク候補ほどピーク強度が小さくなることから検出し難くなるが、この幅広ピーク候補検出用データを用いた処理によれば、幅の狭いピーク候補の影響を除去したうえで、ウェーブレット変換ステップ、ピーク候補位置決定ステップ及びピーク候補幅決定ステップを行うため、幅の広いピーク候補を検出し易くなる。なお、幅広ピーク候補検出用データを作成する際に一部のピーク候補を除去することは、当該ピーク候補を偽のピークと判別することを意味するのではない。それらのピーク候補については、前記データから除去される前に決定された幅に基づいて真偽を判別すればよい。
本発明に係るデータ処理装置は、測定変数に対する測定値の変化を表すグラフのデータからピークを検出するデータ処理を行う装置であって、
a) 前記データに対して、極大値を1つのみ有するマザーウェーブレットを用いてウェーブレット変換を行うことにより、該マザーウェーブレットのスケール及びトランスレーションを変数とする評価関数を求めるウェーブレット変換部と、
b) 前記評価関数が極大値を有するところのトランスレーションに基づいて前記データにおけるピーク候補の位置を求めると共に、該ピーク候補に対応するスケールに基づいて該ピーク候補の幅を決定するピーク候補情報取得部と
を備えることを特徴とする。
a) 前記データに対して、極大値を1つのみ有するマザーウェーブレットを用いてウェーブレット変換を行うことにより、該マザーウェーブレットのスケール及びトランスレーションを変数とする評価関数を求めるウェーブレット変換部と、
b) 前記評価関数が極大値を有するところのトランスレーションに基づいて前記データにおけるピーク候補の位置を求めると共に、該ピーク候補に対応するスケールに基づいて該ピーク候補の幅を決定するピーク候補情報取得部と
を備えることを特徴とする。
本発明によれば、ウェーブレット変換を行うことでピークの強弱等に関わらずピーク候補を検出することができ、且つ、検出されたピーク候補の幅を決定することができる。こうして決定されたピーク候補の幅に基づいて、該ピーク候補が真のピークであるかを判別することができる。
図1~図8を用いて、本発明に係るピーク検出方法及びデータ処理装置の実施形態を説明する。
第1実施形態のデータ処理装置10は、データ記録部1、表示装置2及び入力装置3と共に用いられる。データ記録部1は、液体クロマトグラフやガスクロマトグラフ等が有する検出器によって測定時に得られたデータを記録する装置であり、ハードディスクやメモリ等から成る。データ記録部1は、図1に示した例ではデータ処理装置10の外に設けているが、データ処理装置10内に設けてもよい。表示装置2は、データ処理装置10によるデータ処理中の情報やデータ処理の結果を表示するディスプレイである。入力装置3は、ユーザが必要な情報をデータ処理装置10に入力するための装置であって、キーボードやマウス等から成る。
第1実施形態のデータ処理装置10は、データ記録部1、表示装置2及び入力装置3と共に用いられる。データ記録部1は、液体クロマトグラフやガスクロマトグラフ等が有する検出器によって測定時に得られたデータを記録する装置であり、ハードディスクやメモリ等から成る。データ記録部1は、図1に示した例ではデータ処理装置10の外に設けているが、データ処理装置10内に設けてもよい。表示装置2は、データ処理装置10によるデータ処理中の情報やデータ処理の結果を表示するディスプレイである。入力装置3は、ユーザが必要な情報をデータ処理装置10に入力するための装置であって、キーボードやマウス等から成る。
データ処理装置10は、クロマトグラム作成部11、ウェーブレット変換部12、ピーク候補情報取得部13及びピーク決定部14を有する。ピーク候補情報取得部13は、ピーク候補位置決定部131及びピーク候補幅決定部132を有する。これら各部は、実際にはコンピュータのCPUやメモリ等のハードウエア、及びソフトウエアにより具現化されている。以下、図2のフローチャートを用いて、本発明に係るデータ処理方法の第1実施形態を説明すると共に、第1実施形態のデータ処理装置10の各部の機能を説明する。
まず、クロマトグラム作成部11は、データ記録部1からデータを取得して、従来と同様の方法によりクロマトグラムC(t)を作成する(ステップS1)。このクロマトグラムC(t)は上述の「測定値の変化を表すグラフのデータ」に該当し、tは時間であって上述の測定変数に該当する。スペクトルについて処理を行う場合には、クロマトグラムを作成する操作は不要であり、データ記録部1からデータを取得すればよい
次に、ウェーブレット変換部12は、クロマトグラムC(t)をウェーブレット変換することにより、評価関数を求める(ステップS2)。ウェーブレット変換では、前述の(1)式における対象データx(t)をクロマトグラムC(t)とし、マザーウェーブレットψ(t)としてメキシカンハット関数やガウス差分等の極大値を1つのみ有する関数を用いて内積を求める。こうして求めた内積そのものを評価関数としてもよいし、(5)式に示したように内積にσf
m(ここでσfはスケール)を乗じたものを評価関数としてもよい。この評価関数は、スケール及びトランスレーションをパラメータとする関数である。
続いて、ピーク候補情報取得部13は、ステップS2で求めた評価関数からリッジラインを作成し(ステップS3)、得られたリッジライン上で評価関数の値が極大値となる点を求める。リッジラインは、スケールσfをある1つの値に固定して測定変数tを変化させたときに極大値となる点を求める操作を、多数のスケールσfの値について行うことにより作成する。ここで得られるリッジラインは1つには限られず、多くの場合には複数存在することから、リッジライン上で評価関数の値が極大値となる点は、それら極大値の各々について求める。ピーク候補位置決定部131は、こうして得られた極大値における測定変数の値をクロマトグラムC(t)においてピーク候補が存在する位置(時間)として求め(ステップS4)、ピーク候補幅決定部132はピーク候補の各々についてスケールに基づきピーク候補の幅を決定する(ステップS5)。これらステップS3~S5は、前述のピーク候補情報取得ステップに該当する。なお、ステップS4とS5は同時並行で行ってもよいし、ステップS5の方を先に行ってもよい。ピーク候補の幅は、例えば(5)式及び(6)式を用いると、m=0(内積が評価関数)の場合には極大値におけるスケールの5-1/2倍の値、m=-1の場合には極大値におけるスケールと同じ値となる。
その後、ピーク決定部27は、得られた幅の値から、対応するピーク候補が真のピークであるか、ノイズやバックグラウンド等、真のピークではないものであるかを判別し(ステップS6)、処理を終了する。真のピークであるか否かは、典型的には、幅の上限値及び下限値を定めておき、得られた幅が上限値と下限値の間にあれば真のピークであり、それらの間になければ真のピークではない、と判別する。あるいは、位置(時間)を複数の区間に分け、区間毎に幅の上限値及び下限値を定めてもよい。本実施形態ではピーク決定部14がこの判別を自動的に行うが、その代わりに、幅の値を表示装置2に表示したうえで人が判別を行うようにしてもよい。
次に、第1実施形態のデータ処理方法によりピーク検出を行った例(実施例1)を説明する。実施例1では、図3のグラフに示したデータを処理対象とした。このデータには、10個のピーク(P01~P10)と、それらピークよりも幅が広い1個のピーク状プロファイルPB1が見られる。
本実施例では、このデータに対して、メキシカンハット関数をマザーウェーブレットとするウェーブレット変換を行うことにより内積を求め、その内積にσf
-1((5)式においてm=-1)を乗じたものを評価関数とした。この例では、評価関数が極大値を有するところのスケールの値をそのまま、元のデータのピーク候補における幅と決定する。
図4に、リッジラインを求めた結果を示す。図4では、2次元グラフの横軸に時間(測定変数。元のデータの横軸と同じ。)を、縦軸にスケールσfを取り(σfは底が2の対数とした)、以下のようにデータを表した。まず、スケールσfを1つの値に固定し、測定変数を変化させることにより、当該スケールσfの値における評価関数が極大値となる点を求める。この操作を、スケールσfの値を少しずつ変えながら繰り返し行う。そうすると、図4のグラフには、縦軸方向に延びる点の列が1つのピーク候補につき1本ずつ現れる。これら点の列がリッジラインである。そして、各リッジラインにつきそれぞれ、評価関数が極大値となるスケールσfを求めることにより、図4の2次元グラフ上で極大値となる位置を特定することができる。
図4のグラフより、評価関数が極大値となる10個の点(図中の×印)が得られた。これら10個の点はピークP01~P10に対応しており、いずれもσf、すなわち元のデータの幅がほぼ同じ値となっている。このグラフには、符号Nを付した多数の点列が見られるが、これらはノイズである。
一方、図4のグラフにはピーク状プロファイルPB1に対応する点列も見られるが、σfが大きいところにおいてP05及びP06と重なることによる影響が大きいため、この実施例1からはピーク状プロファイルPB1に対応するピーク候補の幅を見積もることはできなかった。次に、このように他のピークとの重なりが場合にもピーク候補の幅を見積もることができる方法である、本発明に係る第2実施形態について説明する。
第2実施形態に係るデータ処理装置20の概略構成を図5に示す。このデータ処理装置20は、第1実施形態のデータ処理装置10に幅広ピーク候補検出用データ作成部21を加えた構成を有する。以下、図6のフローチャートを用いて、本発明に係るデータ処理方法の第2実施形態を説明すると共に、幅広ピーク候補検出用データ作成部21の機能を説明する。
まず、ステップS11~S15では、第1実施形態のピーク処理方法のステップS1~S5と同様の操作を行うことにより、ピーク候補が存在する位置(時間)及びピーク候補の幅を決定する。
次に、幅広ピーク候補検出用データ作成部21が、ピーク候補のうち、決定された幅の値が小さいものから順に1又は複数個のピーク候補を選択する(ステップS16)。続いて、ステップS17において、幅広ピークの検出操作を実行するか判定する。この判定の方法として、例えば前述のようにピーク状プロファイルPB1のように極大値を求めることができなかった場合にYESとしたり、あるいは、データの内容に関わりなくステップS17を所定回数実行するまでYESとする、等が挙げられる。
ステップS17でYESの場合には、選択されたピーク候補について、真のピークであるか否かを判別する(ステップS18)。そして、クロマトグラムC(t)から、選択されたピーク候補の位置及び幅に対応する範囲内のデータを除去し、当該範囲内のデータを直線や曲線で補間することにより、幅広ピーク候補検出用データを作成する(ステップS19)。その後、ステップS12に戻り、幅広ピーク候補検出用データに基づいてステップS12~S16の操作を繰り返す。このとき、幅広ピーク候補検出用データでは元のデータよりもピーク又はピーク状プロファイルの数が少なくなっているため、幅の広いピークを検出し易くなる。これらステップS12~S16の操作は、ステップS17でNOとなるまで繰り返し実行される。
一方、ステップS17でNOの場合には、ピーク決定部が、その時点で残った全てのピーク候補について真のピークであるか否かを判別し(ステップS20)、処理を終了する。
以下、第2実施形態のデータ処理方法によりピーク検出を行った例(実施例2)を説明する。実施例2では、実施例1と同様に図3のグラフに示したデータを処理対象とする。まず、実施例1と同じ方法により、10個のピークP01~P10を検出する。そして、検出されたピークP01~P10について求めた位置及び幅に基づいて、元の図3のデータからピークP01~P10の部分のデータを除去し、除去した部分を補間することにより幅広ピーク候補検出用データを作成した。作成した幅広ピーク候補検出用データのグラフを図7に示す。そして、この幅広ピーク候補検出用データに基づいてリッジラインを作成した。当該リッジラインを図8に示す。ピーク状プロファイルPB1に対応して縦軸方向に延びる点の列が1列形成され、評価関数が極大値となる位置が特定されている。この列の近傍には他の点列がなく、他のピーク等の影響を受けることなくピーク状プロファイルPB1の位置及び幅を決定することができた。なお、ピーク状プロファイルPB1に対応するもの以外の点列は、データの補間の際に生じた不連続性等によるノイズである。
1…データ記録部
2…表示装置
3…入力装置
10、20…データ処理装置
11…クロマトグラム作成部
12…ウェーブレット変換部
13…ピーク候補情報取得部
131…ピーク候補位置決定部
132…ピーク候補幅決定部
14…ピーク決定部
21…幅広ピーク候補検出用データ作成部
2…表示装置
3…入力装置
10、20…データ処理装置
11…クロマトグラム作成部
12…ウェーブレット変換部
13…ピーク候補情報取得部
131…ピーク候補位置決定部
132…ピーク候補幅決定部
14…ピーク決定部
21…幅広ピーク候補検出用データ作成部
Claims (3)
- 測定変数に対する測定値の変化を表すグラフのデータからピークを検出する方法であって、
a) 前記データに対して、極大値を1つのみ有するマザーウェーブレットを用いてウェーブレット変換を行うことにより、該マザーウェーブレットのスケール及びトランスレーションをパラメータとする評価関数を求めるウェーブレット変換ステップと、
b) 前記評価関数が極大値を有するところのトランスレーションに基づいて前記データにおけるピーク候補の位置を求めると共に、該ピーク候補に対応するスケールに基づいて該ピーク候補の幅を決定するピーク候補情報取得ステップと
を有することを特徴とするピーク検出方法。 - 複数の前記ピーク候補のうち前記スケールの値が小さい方から順に1又は複数個のピーク候補を前記データから除去することにより、幅広ピーク候補検出用データを作成し、
前記データを前記幅広ピーク候補検出用データに置き換えて、前記ウェーブレット変換ステップ及び前記ピーク候補情報取得ステップを行う
ことを特徴とする請求項1に記載のピーク検出方法。 - 測定変数に対する測定値の変化を表すグラフのデータからピークを検出するデータ処理を行う装置であって、
a) 前記データに対して、極大値を1つのみ有するマザーウェーブレットを用いてウェーブレット変換を行うことにより、該マザーウェーブレットのスケール及びトランスレーションを変数とする評価関数を求めるウェーブレット変換部と、
b) 前記評価関数が極大値を有するところのトランスレーションに基づいて前記データにおけるピーク候補の位置を求めると共に、該ピーク候補に対応するスケールに基づいて該ピーク候補の幅を決定するピーク候補情報取得部と
を備えることを特徴とするデータ処理装置。
Priority Applications (4)
| Application Number | Priority Date | Filing Date | Title |
|---|---|---|---|
| JP2018520072A JP6610782B2 (ja) | 2016-05-30 | 2016-05-30 | ピーク検出方法及びデータ処理装置 |
| CN201680086361.XA CN109219748B (zh) | 2016-05-30 | 2016-05-30 | 峰检测方法以及数据处理装置 |
| PCT/JP2016/065915 WO2017208304A1 (ja) | 2016-05-30 | 2016-05-30 | ピーク検出方法及びデータ処理装置 |
| US16/305,711 US20200378933A1 (en) | 2016-05-30 | 2016-05-30 | Peak detection method and data processing device |
Applications Claiming Priority (1)
| Application Number | Priority Date | Filing Date | Title |
|---|---|---|---|
| PCT/JP2016/065915 WO2017208304A1 (ja) | 2016-05-30 | 2016-05-30 | ピーク検出方法及びデータ処理装置 |
Publications (1)
| Publication Number | Publication Date |
|---|---|
| WO2017208304A1 true WO2017208304A1 (ja) | 2017-12-07 |
Family
ID=60479215
Family Applications (1)
| Application Number | Title | Priority Date | Filing Date |
|---|---|---|---|
| PCT/JP2016/065915 Ceased WO2017208304A1 (ja) | 2016-05-30 | 2016-05-30 | ピーク検出方法及びデータ処理装置 |
Country Status (4)
| Country | Link |
|---|---|
| US (1) | US20200378933A1 (ja) |
| JP (1) | JP6610782B2 (ja) |
| CN (1) | CN109219748B (ja) |
| WO (1) | WO2017208304A1 (ja) |
Families Citing this family (3)
| Publication number | Priority date | Publication date | Assignee | Title |
|---|---|---|---|---|
| CN112415511A (zh) * | 2020-12-04 | 2021-02-26 | 安徽圭目机器人有限公司 | 基于小波变换的浅层对地雷达信号去除地面波的方法 |
| CN114895315B (zh) * | 2022-05-10 | 2025-02-18 | 上海灵昉科技有限公司 | 一种基于多峰检测的传感器图像处理方法以及处理装置 |
| CN117851734B (zh) * | 2023-12-05 | 2025-01-21 | 广东省水利水电科学研究院 | 基于小波变点检测的小波分析方法、系统及存储介质 |
Citations (4)
| Publication number | Priority date | Publication date | Assignee | Title |
|---|---|---|---|---|
| JP2000018961A (ja) * | 1998-06-30 | 2000-01-21 | Yamatake Corp | 振動成分検出方法および振動成分検出装置およびプログラム記憶媒体 |
| JP2001218747A (ja) * | 2000-02-10 | 2001-08-14 | Tokyo Denki Univ | 心電図解析システム、および、そのためのプログラムを記録したコンピュータ読み取り可能な記録媒体 |
| US20040102906A1 (en) * | 2002-08-23 | 2004-05-27 | Efeckta Technologies Corporation | Image processing of mass spectrometry data for using at multiple resolutions |
| WO2015033478A1 (ja) * | 2013-09-09 | 2015-03-12 | 株式会社島津製作所 | ピーク検出方法 |
Family Cites Families (6)
| Publication number | Priority date | Publication date | Assignee | Title |
|---|---|---|---|---|
| JP4218824B2 (ja) * | 2002-11-13 | 2009-02-04 | 隆之 大河内 | 木材の年輪箇所検出方法および年輪幅計測方法 |
| CN101726607A (zh) * | 2008-10-24 | 2010-06-09 | 上海申瑞电力科技股份有限公司 | 气体检测中低频微弱信号的检测方法 |
| CN101929989A (zh) * | 2009-06-24 | 2010-12-29 | 陈喆 | 一种代谢谱峰位置分辨与对齐的方法 |
| GB2477986C (en) * | 2010-02-22 | 2013-12-25 | Toshiba Res Europ Ltd | Method and apparatus for crest factor reduction |
| CN102735759A (zh) * | 2012-07-13 | 2012-10-17 | 南京信息工程大学 | 一种基于脊的兰姆波信号去噪方法 |
| US9080246B2 (en) * | 2012-10-12 | 2015-07-14 | Galvanotech | Selective plating apparatus and method |
-
2016
- 2016-05-30 CN CN201680086361.XA patent/CN109219748B/zh active Active
- 2016-05-30 US US16/305,711 patent/US20200378933A1/en not_active Abandoned
- 2016-05-30 WO PCT/JP2016/065915 patent/WO2017208304A1/ja not_active Ceased
- 2016-05-30 JP JP2018520072A patent/JP6610782B2/ja active Active
Patent Citations (4)
| Publication number | Priority date | Publication date | Assignee | Title |
|---|---|---|---|---|
| JP2000018961A (ja) * | 1998-06-30 | 2000-01-21 | Yamatake Corp | 振動成分検出方法および振動成分検出装置およびプログラム記憶媒体 |
| JP2001218747A (ja) * | 2000-02-10 | 2001-08-14 | Tokyo Denki Univ | 心電図解析システム、および、そのためのプログラムを記録したコンピュータ読み取り可能な記録媒体 |
| US20040102906A1 (en) * | 2002-08-23 | 2004-05-27 | Efeckta Technologies Corporation | Image processing of mass spectrometry data for using at multiple resolutions |
| WO2015033478A1 (ja) * | 2013-09-09 | 2015-03-12 | 株式会社島津製作所 | ピーク検出方法 |
Non-Patent Citations (1)
| Title |
|---|
| DU P ET AL.: "Improved peak detection in mass spectrum by incorporating continuous wavelet transform-based pattern matching", BIOINFORMATICS, vol. 22, no. 17, 1 September 2006 (2006-09-01), pages 2059 - 2065, XP055259624 * |
Also Published As
| Publication number | Publication date |
|---|---|
| CN109219748A (zh) | 2019-01-15 |
| JP6610782B2 (ja) | 2019-11-27 |
| JPWO2017208304A1 (ja) | 2019-02-28 |
| CN109219748B (zh) | 2021-03-12 |
| US20200378933A1 (en) | 2020-12-03 |
Similar Documents
| Publication | Publication Date | Title |
|---|---|---|
| JP6610678B2 (ja) | ピーク検出方法及びデータ処理装置 | |
| O’Haver | A pragmatic introduction to signal processing | |
| JP6094684B2 (ja) | 波形中のピーク端点検出方法および検出装置 | |
| US10956451B2 (en) | Time-series data processing method, recording medium having recorded thereon time-series data processing program, and time-series data processing device | |
| CN105518455A (zh) | 波峰检测方法 | |
| Zushi et al. | Pixel-by-pixel correction of retention time shifts in chromatograms from comprehensive two-dimensional gas chromatography coupled to high resolution time-of-flight mass spectrometry | |
| JP6610782B2 (ja) | ピーク検出方法及びデータ処理装置 | |
| JP2015049136A (ja) | ピーク抽出方法及びプログラム | |
| Mani-Varnosfaderani et al. | Estimating complicated baselines in analytical signals using the iterative training of Bayesian regularized artificial neural networks | |
| JP6458812B2 (ja) | ノイズレベル推定方法、測定データ処理装置、及び測定データ処理用プログラム | |
| JP2024152037A (ja) | 波形解析方法、波形解析装置、及び分析装置 | |
| JP7414125B2 (ja) | 波形情報推定方法及び装置、並びに、ピーク波形処理方法及び装置 | |
| Milani et al. | Generating realistic data through modeling and parametric probability for the numerical evaluation of data processing algorithms in two-dimensional chromatography | |
| JP6256162B2 (ja) | 信号波形データ処理装置 | |
| WO2018037487A1 (ja) | データ処理方法及び装置 | |
| JPWO2017168682A1 (ja) | ピーク検出方法及びデータ処理装置 | |
| Sloboda | Boundary transformation representation of attractor shape deformation | |
| JP7571791B2 (ja) | ピーク形状推定装置およびピーク形状推定方法 | |
| JP7718686B2 (ja) | スペクトル推定装置、スペクトル推定システム、コンピュータプログラム及びスペクトル推定方法 | |
| AU2022231184A1 (en) | Methods and systems for raman spectra-based identification of chemical compounds | |
| JP6817243B2 (ja) | スペクトル処理装置及び方法 | |
| US12578317B2 (en) | Learning data producing method, waveform analysis device, waveform analysis method, and recording medium | |
| Ilewicz et al. | Comparison of baseline estimation algorithms for chromatographic signals | |
| CN117907510B (zh) | 一种二维谱图对齐方法及系统 | |
| JP7480843B2 (ja) | ピークトラッキング装置、ピークトラッキング方法およびピークトラッキングプログラム |
Legal Events
| Date | Code | Title | Description |
|---|---|---|---|
| ENP | Entry into the national phase |
Ref document number: 2018520072 Country of ref document: JP Kind code of ref document: A |
|
| 121 | Ep: the epo has been informed by wipo that ep was designated in this application |
Ref document number: 16903932 Country of ref document: EP Kind code of ref document: A1 |
|
| NENP | Non-entry into the national phase |
Ref country code: DE |
|
| 122 | Ep: pct application non-entry in european phase |
Ref document number: 16903932 Country of ref document: EP Kind code of ref document: A1 |